Interim report on the 2nd quarter of 2010
|
|
|
- Adelia Jennings
- 8 years ago
- Views:
Transcription
1 Interim report on the 2nd quarter of

2 Group Financials Group Financials (IFRS) in TEUR 01/01-06/30/2010 (adjusted) 01/01-06/30/2009 A. Income statement key figures Revenues 39,827 73,306 a) Property sales 15,401 48,778 b) Rental income 23,864 23,488 c) Property management and other services 562 1,040 EBITDA before revaluation 17,735 1,453 EBIT 17,225-14,946 EBT 6,221-28,578 Consolidated net profit/loss before minority interests 6,256-32,334 Consolidated net profit/loss after minority interests 6,413-30,265 Earnings per share in EUR B. Balance sheet key figures 06/30/ /31/2009 Total assets 884, ,421 Equity before minorities 211, ,398 Equity ratio in % Bank loans 552, ,243 Of which non-current 437, ,939 Real estate volume 850, ,096 C. Employees 06/30/ /31/2009 Number of employees Further figures Market capitalisation in TEUR on 30 June ,978 Subscribed capital in EUR 34,984, WKN/ISIN / DE Number of shares 34,984,546 Free Float in % 93 Stock exchange SDAX / EPRA 2

3 Table of Contents Table of Contents Preface by the Management Board 05 Holdings currently held by TAG 11 TAG Share 12 Group management report 15 The German real estate market 16 Portfolio 18 Results of operations, financial condition and net assets 21 Business performance 25 Outlook 28 Consolidated balance sheet 30 Consolidated income statement 32 Consilidated statement of comprehensive income 33 Consolidated cash flow statement 34 Statement of changes in consolidated equity 35 Consolidated segment report 36 Notes on the interim financial statements 37 Review Report 44 Responsibility statement 46 Financial calender / Contact 47 3

4 Preface by the Management Board Salomonstraße, Goerlitz 4

5 Preface by the Management Board Preface by the Management Board Dear Shareholders, Ladies and Gentlemen, The first half of the current year was marked by the recovery of the German economy and the apparent stabilisation of the property market. The mood is improving, but the crisis is not yet over. Against this background, in the first six months of this year TAG recorded further operational successes. Capital increase and successful convertible bond issue First, at the beginning of the year we managed to effect a capital increase against contribution in kind by issuing 2.4 million shares at a price of EUR It was particularly gratifying that we were able to manage this issue without the support and advice of banks. And secondly, at the beginning of May we issued a convertible bond worth over EUR 30 million with subscription rights for TAG shareholders and successfully placed it on the market. This is all the more remarkable in the currently difficult capital market environment, as it was also significantly oversubscribed. The interest applicable to the nominal value of the bonds was fixed at percent per annum. The convertible bond (ISIN A1ELQFO) is listed on the Open Market of the Frankfurt Stock Exchange. 5

6 Preface by the Management Board Acquisition of two real estate companies: FranconoWest AG and TAG Sachsenimmobilien GmbH The two successfully completed transactions show that TAG shares are recognised as attractive by shareholders and investors. The resulting liquidity allows us to generate sustainable, profitable growth. For instance, this year we have already been able to realise two opportunities offered to us in the property market: Purchase of a Berlin residential property portfolio - TAG Nordimmobilien S.à r.l. As early as the first quarter of 2010, we acquired a portfolio of 800 apartments, mostly located in Berlin. The portfolio acquisition was financed by taking over a loan and effecting a capital increase against contribution in kind by issuing 2,418,182 new shares. In May of this year, TAG acquired another attractive residential property portfolio of around 2,000 units from FranconoWest AG (properties situated in central locations in North Rhine- Westphalia) and from Francono Advisory AG, which now trades as TAG Sachsen (properties in selected locations in Saxony). The current market value of this portfolio is approximately EUR 104 million. Most of the newly acquired properties won t be consolidated as part of the TAG Group until September The acquisition of the portfolio was again financed by issuing new TAG shares. These acquisitions have expanded our housing stock by more than 40 percent in regions where we are already invested. At the same time, non-real estate related costs remain stable, which increases the cost efficiency of the company. 6

7 Preface by the Management Board The two acquisitions serve to illustrate our strategy and show that our investment focus is clearly on the residential property sector. Longterm structural developments are taking place in this sector of the real estate market, whose potential awaits realisation. It is our goal to benefit from this development and to actively create value. Residential real estate accounts for over 50 percent of our total portfolio, and we will continue to use our existing growth potential to further and sustainably expand the portfolio. Acquisitions are subject to strict criteria, however, and must improve TAG s profitability and cash flow. We are confident that the successful implementation of our strategy will continue to result in sustained growth and increase the value of our portfolio. We are encouraged in this by the Group s excellent collective expertise in the residential property sector, and our good infrastructure. Vacancy further reduced By focusing on active rental and asset management and the profitable running of our existing properties, we have further reduced vacancy throughout the portfolio using powerful, innovative marketing channels. We were able to significantly reduce vacancy in our commercial properties from 5.2 percent in late 2009 to currently 4.0 percent. Furthermore, during the first half of the year, we managed to reduced our residential vacancy from 10 percent of existing inventory at year-end 2009 to 7.1 percent at the end of Q2/2010. In the newly acquired TAG Nordimmobilien portfolio, vacancy has already been reduced from 15 percent to 11.2 percent since the beginning of the year. At Group level, overall vacancy in the residential and commercial property sectors is down from 7.4 percent at the end of 2009 to 6.0 percent of existing inventory or 6.2 percent including the new portfolio in late June 2010 (Q2/2009: 9.8 percent). These successes in vacancy reduction are also reflected in the key financial figures for the half-year. While rental income in the first half of 2010 increased by EUR 0.4 million year-onyear to EUR 23.9 million in 2010 (against EUR 23.5 million in the first half of 2009), rental profits increased by around EUR 2.1 million from EUR 17.2 million to EUR 19.3 million in the first half of This increase was achieved in the residential sector alone, in particular through lower vacancy and maintenance costs. For the first half of 2010, we were thus able to achieve a pretax profit (EBT) of EUR 6.2 million against EUR million in the comparable period last year. Alongside the EBT, we achieved a respectable net profit of EUR 6.4 million for the same period, compared to EUR million in the first half of

8 Preface by the Management Board Highlights Successful issue of a convertible bond worth over EUR 30 million in a difficult market environment Successful integration of the acquired portfolios Further vacancy reduction at Group level to 6.2 percent - including the new acquisitions EUR 2.1 million increase in rental profit stems solely from the residential sector Earnings before taxes (EBT) of EUR 6.2 million for the first half of 2010 At the 2010 AGM, shareholders resolve to generate conditional and authorised capital One thing is very important in connection with all the activities so far this year: our shares may be used as currency again, and this confirms the confidence of our business partners, banks and shareholders in TAG and its prospects. This is also reflected in the fact that we managed to get resolutions approved at this year s Annual Meeting in June that are not to be taken for granted given the current market environment. For instance, the shareholders voted for the generation of additional authorised and conditional capital this means we can continue to issue convertible bonds and new shares when profitable, attractive market opportunities come up. And we would like to take this opportunity to briefly note that we kept our promise not to dilute Net Asset Value (NAV) by paying for the acquisitions in shares. The NAV increased to 6.05 EUR per share on 30 June 2010, and was therefore above the value at year-end 2009 (6.03 EUR). 8

9 Preface by the Management Board Auguste-Viktoria-Straße, Berlin Outlook In our Annual Report 2009 we forecast a pretax profit (EBT) of EUR 10 million for the current fiscal year. We continue to uphold this target. We hope that the figures in this report and the company s strategic direction demonstrate that we are on track to create more value for you. We would be pleased if you continued to accompany us on our promising growth path, and thank you for your trust. Yours sincerely, Rolf Elgeti Hans-Ulrich Sutter 9

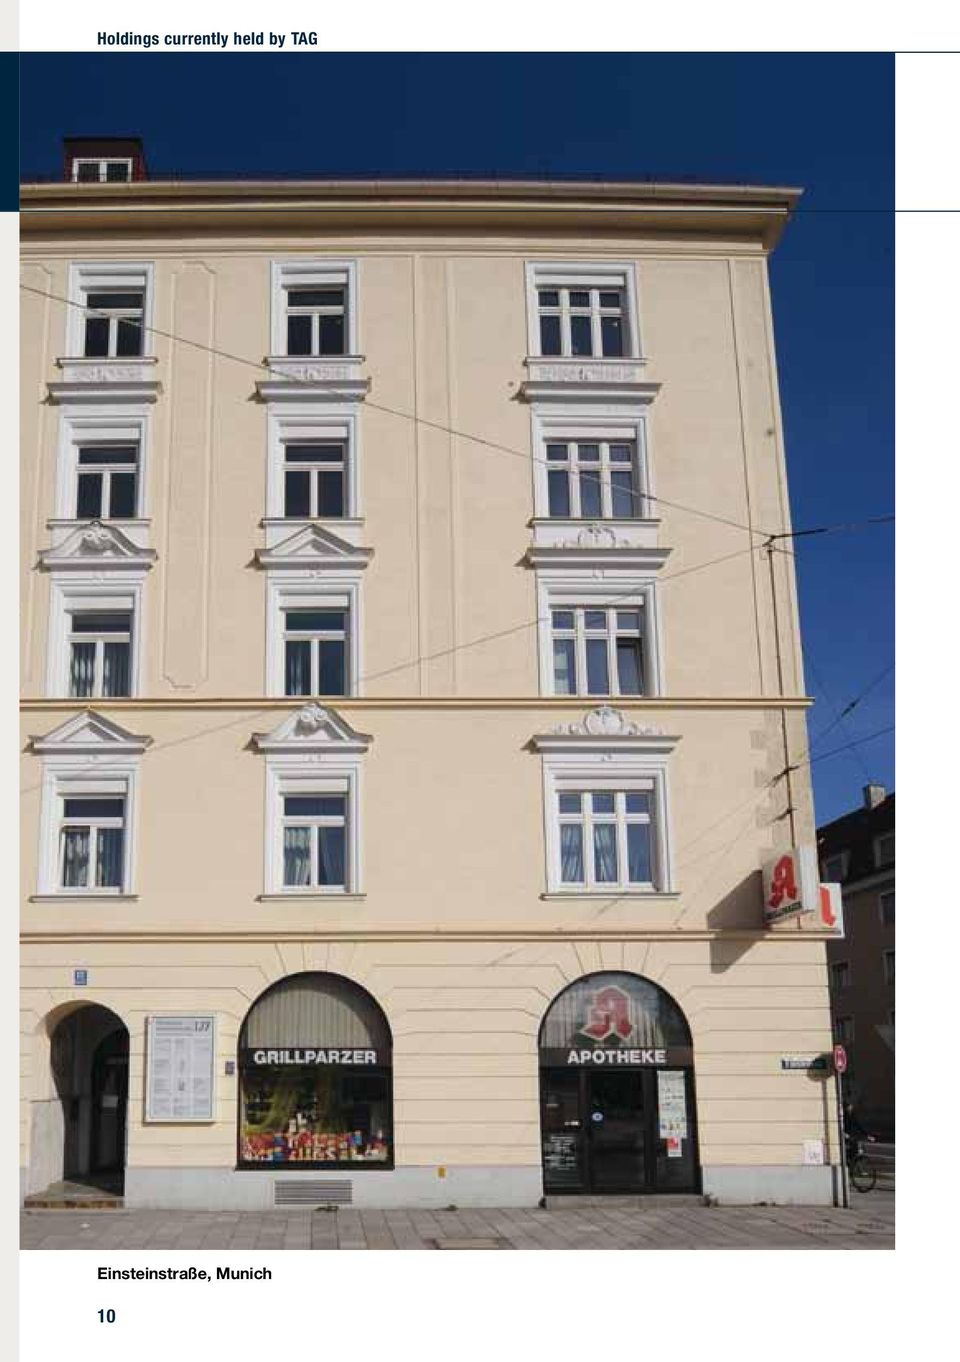
10 Holdings currently held by TAG Einsteinstraße, Munich 10
11 Holdings currently held by TAG Holdings currently held by TAG TAG Immobilien AG Residential and commercial real estate Founded in 1882 Listed on the SDAX Operative holding company of the group EUR 850 m real estate volume TAG Gewerbeimmobilien-AG 100 % Commercial real estate Pre-REIT status EUR 374 m real estate volume Bau-Verein zu Hamburg AG 91 % Residential real estate Founded 1892 Listed on the General Standard EUR 288 m real estate volume ESTAVIS AG 20 % Residential real estate EUR 78 m real estate volume (of which EUR 58 m are existing inventory and EUR 20 m are properties slated for development) Listed on the Prime Standard Westgrund AG 10 % Residential and commercial real estate A good monetary investment A shareholding represents an easy way to participate in the development of their real estate values FranconoWest AG 97 % Residential real estate Residential property volume of around EUR 87 m 94 % of the properties located in North Rhine Westphalia Consolidated as of Q3/2010 (expected) TAG Sachsenimmobilien Gmbh 100 % Residential real estate / Services 436 Units in Saxony and Thuringia Commercial and technical services for real estate Consolidated as of 1 June 2010 TAG Nordimmobilien S.à r.l. 100 % Residential real estate 787 Units predominantly in Berlin Consolidated as of Q1 / 2010 LARUS Asset Management Gmbh 49 % Services Services for commercial real estate EUR ~1.9 bn assets under management Joint Venture with HSH Real Estate AG non-consolidated 11
 Listed on the Prime Standard Westgrund AG 10 % Residential and commercial real estate A good monetary investment A shareholding represents an easy way to participate in the")
12 TAG Share TAG Share At the end of Q2/2010, TAG shares listed on Germany s SDAX were trading at EUR 4.63, a slight improvement over the EUR 4.50 share price at year-end Following the registration of capital increase against contribution in kind in March 2010, the number of shares increased by 2,418,182 units to currently 34,984,546 nonpar shares. Free float is 93 percent. At a price of EUR 4.63 on 30 June 2010, market capitalisation amounted to EUR 162 million. Investor relations activities including conferences, presentations and road shows were very much in demand during the first half of the year at a national and international level, not least as a result of the successful issuance of a EUR 30 million convertible bond offered to shareholders in the period 22 April to 6 May 2010, which was fully placed despite the current difficult market environment. At this year s Annual General Meeting on 25 June 2010, over 46 percent of the share capital was represented. The shareholders present approved all agenda items by a large majority. The current shareholder structure also reflects confidence in the company. Most of TAG s shareholders are national and international investors with predominantly long-term investment strategies form. 12

13 TAG Share Shareholder structure at 30. June % * allocated to free float in accordance with the Deutsche Börse definition 7 % 5 % 5 % 7 % 93 % Taube Hodson Stonex, UK* Ostara Holdings S.à r.l., L / Ashdown, UK* IP Concept / FvS Strategie SICAV, L* Skagen Funds, N* Investorengruppe Dr. Ristow, D Free Float Share price in % TAG share EPRA-Index SDAX JANUARy FEBRUARy March APRIL MAY JUNE 13

14 Group management report Danziger Straße, Berlin 14

15 Group management report Group management report for the first half of 2010 Economic conditions in Germany After sharp downturns in the global economy in 2009, the German economy is seeing a positive trend in mid In the opinion of various German managers, the economy has developed better than expected at the beginning of the year (Source: Handelsblatt, 28 June 2010). Actual production surpassed all expectations, especially in the German industrial sector, and growing world trade with high growth rates in India and China has revived Germany s strength as an export nation. This development had a positive effect on the German economy and continues to create a confident mood for specific investment and employment plans. A large proportion of German managers want to increase their staff and continue to hire. Consequently, several experts expect a growth of GDP. The President of the IfO Institute for Economic Research has raised his growth forecast for the current year to above 2 percent (Source: Handelsblatt, 8 July 2010). The Federal Minister of Finance is expecting somewhat more moderate economic growth of 2 percent even, an upward adjustment from the government s previous growth forecast of 1.4 percent (Source: Handelsblatt, 8 July 2010). Despite this optimism neither Germany, Europe nor the US have reached pre-crisis levels of industrial output. If the trend continues, the German economy is expected to emerge from what has turned out to be the biggest recession since the Great Depression of the 1930s by the end of 2012 (Source: Handelsblatt 28 June 2010). So a rapid recovery of the economy is not expected, and the markets will remain difficult and fiercely competitive for a while. 15

16 Group management report The German real estate market Commercial properties The recovery of the investment market continues and showed high levels of activity in the first half of 2010, especially in the commercial real estate sector where transaction volumes almost doubled to EUR 8.9 billion in the first two quarters. At around EUR 4.5 billion, more than half of the German transaction volumes took place in the six prime locations of Berlin, Düsseldorf, Frankfurt am Main, Hamburg, Munich and Stuttgart. Berlin is clearly the top location high-volume sales like the Sony Center and the A10 Center pushed transactions in the German capital past the twobillion-euro mark during the first half-year alone. Berlin is followed by Munich and Hamburg, with transaction volumes of EUR 869 million and EUR 505 million respectively. Open and closed real estate funds, occupational pension funds and insurance companies as well as project developers accounted for most of the activity in the transaction markets. The most in-demand properties were retail (41 percent or EUR 3.6 billion) and office (33 percent/eur 2.9 billion) spaces. In addition, prime yields in the six top locations remained stable. The most expensive is Munich (4.5 percent), followed by Hamburg (4.8 percent) and Frankfurt am Main (5.3 percent). To sum up, the German property market is currently shaped by the very steady investment strategies of investors active in the market. The high demand for core real estate simultaneously hits a low supply, which limits the volume of transactions. In addition, investment volumes are mainly significantly above those of the crisis year of Overall, a lively market is expected for the second half of the year. However, the debt crisis in many EU member states ensures continued nervousness in financial markets. Conversely, due to low interest rates the players on the investment markets can continue to undertake refinancing at favourable rates, which can then lead to further growth. (Source: Colliers Property Partners in Deal Magazine, 7 July 2010; Cushman & Wakefield in Deal Magazine, 24 June 2010) 16

17 Group management report Cafe Atlas, Munich Residential properties Unlike the commercial property market, Germany s residential real estate market is influenced by long-term structural developments, such as an aging population and an increasing number of small households of only one or two people. The residential sector continued to bottom out during the first half of The real estate consultants Cushman & Wakefield registered a total of 21 transactions with more than 250 residential units so the activity was at a similarly low level as in the previous year with 20 transactions. However, the number of traded units and transaction volumes increased slightly compared to the first half of The first six months of 2010 saw larger portfolio transactions (more than 250 units) of approximately 30,000 residential units with a volume of around EUR 1.58 billion. In 2009 there were 25,000 residential units with a volume of EUR 1.34 billion. The average price fell slightly to 770 EUR/m² compared to 2009 (780 EUR/m²). In conclusion: The residential real estate market has stabilised at a low level, as borne out by the transaction volume. However, against a background of high investor interest and a rising supply of non-performing portfolios experts expect a continued revival of the market in the second half of 2010 (source: Cushman & Wakefield in Deal Magazine, June ). 17

18 Group management report The TAG Group portfolio The TAG portfolio is characterised by real estate in attractive locations in big German cities with a focus on Berlin, Hamburg, Leipzig, Munich and the Rhine-Main area. These locations are notable for their good infrastructure and economic and demographic growth potential. Economic and purchasing power is concentrated in these cities and regions, and despite the current difficult economic environment rents here are expected to remain stable over the next few years. TAG is also doing well in the operations side of its business. The company successfully implemented its strategy by stepping up its vacancy reduction and active rental and asset management and realising existing market potential, especially in the residential real estate sector. As a result, its rental profit for the first half of 2010 EUR amounted to 19.3 million, vs. EUR 17.2 million for the first half of This represents a 12 percent increase. Vacancy reduction at Group level was also successfully advanced in the second quarter of 2010 using powerful, innovative marketing channels. Vacancy in the commercial property portfolio was significantly reduced from 5.2 percent at yearend 2009 to currently 4.0 percent. Furthermore, in the first half-year residential vacancy was reduced from 10 percent of existing inventory at year-end 2009 to 7.1 percent at the end of the first half of In the newly acquired TAG Nordimmobilien portfolio vacancy was reduced from 15 percent to 11.2 percent since the beginning of the year. At Group level, overall vacancy was reduced from 7.4 percent at year-end 2009 to 6.0 percent of existing inventory or 6.2 percent including the newly acquired portfolios at the end of June 2010 (Q2/2009: 9.8 percent). 18

19 Group management report Portfolio - Vacancy rate reduction - Total in sqm % 11.3 % 75,212 72, % 8.6 % 7.4 % 6.2 % 6.2 % ,648 52,719 45,076 40,186 41, Q4-08 Q1-09 Q2-09 Q3-09 Q4-09 Q1-10 Q2-10 Vacancy by floor area Vacancy in % 19

20 Group management report Portfolio - Vacancy rate reduction - Residential in sqm % 14.5 % 14.0 % 13.0 % 13.3 % % 10.2 % 10.8 % 10.0 % 9.2 % 8.2 % 9.2 % 8.4 % 8.8 % 7.9 % 11.2 % 9.6 % 7.9 % 7.1 % 0 Jan 10 Feb 10 Mar 10 Apr 10 May 10 June 10 TAG-Nordimmobilien portfolio TAG-Sachsenimmobilien portfolio as of June 2010 TAG portfolio total TAG existing inventory portfolio Vacancy rate reduction - Commercial real estate in sqm % 20, % 5.5 % 19,347 18, % 5.2 % 17,001 17, % 4.0 % 10 11,915 13,326 0 Vacancy by floor area Vacancy in % Q4-08 Q1-09 Q2-09 Q3-09 Q4-09 Q1-10 Q

21 Group management report Results of operations, financial condition and net assets of TAG Group TAG focuses on residential and commercial properties in German metropolitan regions, which are characterised by attractive locations offering growth potential and a favourable long-term outlook. TAG systematically continued to pursue its strategy of focusing on profitable growth in residential real estate in the first half of In March, the acquisition of a Berlin real estate portfolio of 787 flats with a total floor area of 51,300 sqm was completed. This was followed in May 2010 by the acquisition of another attractive residential real-estate portfolio with approximately 2,000 units and a market value of around EUR 104 million, through the purchase of the real estate companies FranconoWest AG and Francono Advisory AG. The acquired properties are situated in central locations in North Rhine-Westphalia as well as at selected sites in Saxony. Most of the approx. 2,000 newly acquired properties will be consolidated in the third quarter of The acquisition of two other, smaller real estate portfolios was already included in this interim report. In Schleswig-Holstein and Berlin, about 200 residential units were purchased at a purchase price of EUR 10.3 million. In Lübeck, approximately 180 apartments were purchased at a price of EUR 6.7 million. The acquisitions strengthened our operative business and resulted in substantial further synergy effects as the acquired properties could immediately be integrated into our existing internal network of service units. 21
22 Group management report Revenues for the first half of 2010 amounted to EUR 39.8 million against EUR 73.3 million in the first half of This 45.7 percent decrease resulted almost exclusively from lower proceeds from sales (disposals), which were down by EUR 33.4 million to EUR 15.4 million in the first half of Despite the high volume of properties sold in 2009, rental income for the first half of 2010 increased to EUR 23.9 million against EUR 23.5 million the previous year. Mainly due to the successful reduction of vacancy costs, rental profit in the first half of 2010 grew by EUR 2.1 million to EUR 19.3 million, against EUR 17.2 million for the same period last year. This represents an increase of 12 percent. EBITDA prior to the revaluation of the TAG Group increased to EUR 17.7 million in the first half of 2010 following EUR 1.5 million in the first half of 2009, which is attributed to the elimination of the restructuring expenses in 2009 and positive effects of the initial consolidations of the acquired companies, which are described in greater detail in the notes on the interim financial statements. Given the current situation and performance of the German residential and commercial real estate markets, and the positively developing income from the TAG property portfolio there is no indication for a deviation from the last valuation of 31 Dec The next property valuation will take place in the second half of 2010 as scheduled. Personnel expenses dropped to EUR 4.2 million for the period from January to June 2010 against EUR 5.8 million during the first half of This represents a 28 percent reduction. 22
23 Group management report Other operating expenses were reduced to EUR 7.1 million in the first half of 2010, as compared with EUR 11.7 million in the first six months of First-half net borrowing costs increased from EUR 12.6 million in 2009 to 14.3 million in 2010 due to acquisitions. The TAG Group was able to increase its earnings before taxes (EBT) to EUR 6.2 million following a loss in the amount of EUR million in the first half of This reflects the positive effect of earnings from a minority share in affiliated company Estavis AG, which was consolidated for the first time on 30 June Consolidated earnings after minority interests increased from EUR million in the 1st half of 2009 to EUR 6.4 million in the 1st half of TAG s balance sheet ratios are still stable. Due to the acquisitions, total revenues grew from EUR million on 31 Dec 2009 to EUR 885 million on 30 Jun The investment property volume increased from EUR million at year-end 2009 to EUR million on 30 Jun 2010, a 14 percent increase. The already-agreed purchase of FranconoWest AG won t be entered in the balance sheet until after 30 Jun 2010, and will further increase the property volume. 23
24 Group management report Meuselwitzer Straße, Gera Equity before minority interests increased by EUR 15.3 million or 7.8 percent to EUR million at 30 Jun 2010, against EUR million at 31 Dec The equity ratio was 23.9 percent at 30 Jun 2010, nearly on par with the 24.5 percent value at 31 Dec short-term borrowings were further reduced and amounted to EUR million at 30 Jun 2010 against EUR million at year-end TAG Group had EUR 4.6 million in cash and cash equivalents on 30 Jun 2010, against EUR 6.8 million on 31 Dec The loan liabilities totalled EUR million, against EUR million on 31 Dec This increase is mainly due to the liabilities assumed as part of the newly acquired property portfolios. The same time long-term loan liabilities increased to EUR 437 million at 30 Jun 2010, after EUR million at 31 Dec In contrast, The Loan to Value (LTV) ratio improved by 200 basis points in the first half of 2010, to 65.4 percent (year-end 2009: 67.4 percent). This reflects more favourable refinancing terms and a restructuring of our financing portfolio. The TAG Group improved its net asset value (NAV) to EUR 6.05 per share at 30 Jun 2010, despite the increased number of shares. So we have managed to avoid diluting the NAV in the wake of the acquisitions. 24
25 Group management report Business performance of Bau-Verein zu Hamburg Aktien-Gesellschaft Bau-Verein zu Hamburg Aktien-Gesellschaft s revenues fell overall due to a high volume of property sales in 2009, from EUR 57.2 million in the first half of 2009 to EUR 19.0 million in the first half of Accordingly, rental income decreased from EUR 9.0 million to EUR 8.2 million in the first half of 2010 and the sales proceeds dropped from EUR 47.1 million to EUR 10.2 million. Thanks to aggressive vacancy reduction, the company managed to improve its rental profit, especially in Berlin, and despite the high sales volume in 2009, by almost 22 percent: from EUR 5.1 million in the first half of 2009 to EUR 6.2 million in Bau-Verein s personnel expenses declined dramatically due to restructuring within the TAG Immobilien AG group, from EUR 3.1 million in the first half of 2009 to currently EUR 1.1 million. The employee headcount was reduced from 69 at the end of 2009 to 32 by the end of June For practical reasons, most of the employees have been employed by TAG Immobilien AG since the beginning of the year. Other operating expenses decreased from EUR 4.6 million in the first half of 2009 to EUR 3.2 million in the first half of In the first half of the year, Bau-Verein acquired two portfolios that go well with the Group s real estate structure. One portfolio consists of two residential properties with a total of 179 units (10,000 sqm) in Lübeck, and the second comprises seven properties in Berlin and Schleswig-Holstein. This portfolio has a total of 206 units (12,600 sqm) and is fully rented. 25
26 Group management report Given the current situation and performance of the German residential real-estate market, Bau-Verein believes in the profitability and stability of its residential portfolio and that a revaluation would not have shown any negative deviations from the last valuation of 31 Dec Therefore, the next property valuation will take place in the second half of 2010 as scheduled. In the first half of 2010, Bau-Verein generated EBIT of EUR 2.5 million against EUR -3.8 million in the first six months of Net borrowing costs improved slightly from EUR -4.8 million in the first half of 2009 to EUR -4.6 million in the current year. This resulted in pre-tax earnings (EBT) of EUR -2.0 million against EUR -9.7 million in the same period of Bau-Verein zu Hamburg Aktien-Gesellschaft s consolidated net income came to EUR -1.8 million, against EUR -6.5 million in the first half of The balance sheet total increased from EUR million at 31 Dec 2009 to EUR million at 30 Jun Equity before minority interests decreased slightly from EUR 94.3 million at 31 Dec 2009 to currently EUR 92.4 million, for an equity ratio of 30.6 percent. Long-term liabilities to banks increased from EUR million at year-end 2009 to EUR million at 30 Jun 2010, while short-term liabilities to banks decreased from EUR 64.7 million at 31 Dec 2009 to EUR 60.2 million by the end of the first half of In the first half of 2010, the value of newly purchased real estate exceeded that of assets sold. Thus, Bau-Verein s property volume increased to EUR million from EUR million at 31 Dec The Loan to Value (LTV) ratio improved to 60.8 percent at 30 Jun 2010 against 62.5 percent at year-end There were also changes to the Bau-Verein Supervisory Board with Mr. Andrés Cramer joining on 1 April after Dr. Wolfgang Schnell resigned his seat in December
27 Group management report Business performance of TAG Gewerbeimmobilien AG Revenues were down slightly in the first half of 2010, to EUR 11.6 million against EUR 12.0 million in the prior year period. The decline in revenue was partially offset by lower operating costs, and first-half rental income decreased from EUR 10.5 million in 2009 to EUR 10.3 million in EBITDA before revaluation increased to EUR 9.2 million in the first six months of 2010, against EUR 8.7 million in the period of January to June This was mainly due to lower operating expenses. TAG Gewerbe AG s first-half profits after taxes came to EUR -0.3 million in 2010, after EUR million in The company s balance sheet total increased from EUR million at 31 Dec 2009 to EUR million at 30 Jun Pre-tax earnings (EBT) improved from EUR million in the first half of 2009, to EUR -0.4 million in the first half of This is mainly due to the fact that in 2010 there was no depreciation of property assets, which had shaved EUR 12.3 million off the results in the first half of Liabilities to banks fell from EUR million at the end of 2009 to EUR million at 30 Jun The Loan to Value (LTV) ratio improved to 68.6 percent, against 69.6 percent at 31 Dec
28 Group management report Forecasts, opportunities, risks TAG is exposed to many operational and economic risks through its business activities. Major risks include leasing risks and the risk of rental losses, as well as interest rate and liquidity risks. In general, the principles of our risk management system have not changed since the beginning of the year. Please refer to the detailed presentation in the Annual Report 2009 (see Management Report, p.47 ff). The German economy developed positively in the first half of this year and the German real estate market has also stabilised or is showing signs of recovery. Nevertheless, the pace of economic development will slow in the months ahead, and during this period inflation and interest rates will remain at low levels. Against this backdrop, TAG s business model has put it in a good position for continued growth. The company will continue to pursue its strategy of realising existing potential for growth and value creation, and increasing the value and profitability of its real-estate inventory through active portfolio management. TAG is invested in attractive locations in German cities like Hamburg, Berlin, Munich, Leipzig and North Rhine-Westphalia and expects that rents will remain stable in these areas in the years ahead, or can be gradually increased through active asset management, especially in the residential real estate sector on the one hand through existing potential in the residential real estate market leading directly to an increase in rental income, and secondly by reducing vacancy. The successful implementation of these measures and strategic, moderate investment activity should have a positive effect on revenues and profitability and consequently also on the Company s future performance. 28
29 Group management report Paradieshof, Hamburg TAG will also continue to exploit opportunities for ongoing growth that crop up in the real estate market. The resolutions passed at the Annual General Meeting in June approving further authorised and conditional capital will have a positive effect on this. The Management Board of TAG stands by its forecast of earnings before taxes (EBT) reaching EUR 10 million for the full fiscal year. Hamburg, 9 August 2010 The Management Board 29
30 Balance sheet Consolidated balance sheet Assets in TEUR 06/30/2010 (adjusted) 12/31/2009 Non-current assets Investment properties 679, ,720 Intangible assets Property, plant and equipment 9,986 10,216 Investments in associates 7, Other financial assets 2, Deferred taxes 4,644 6, , ,831 Current assets Land with unfinished and finished buildings 147, ,618 Other inventories 1,036 1,619 Trade receivables 6,038 5,646 Income tax refund claims 1,079 1,074 Other current assets 6,063 6,858 Cash and cash equivalents 4,612 6, , ,655 Non-current available-for-sale assets 14,560 17, , ,421 30
31 Balance sheet PASSIVA in TEUR 06/30/2010 (adjusted) 12/31/2009 Equity Subscribed capital 34,985 32,566 Share premium 179, ,307 Other reserves -14,837-11,866 Unappropriated surplus/-loss 11,804 5,391 Attributable to the equity holders of the parent company 211, ,398 Minority interests 7,159 8, , ,481 Non-current liabilities Bank borrowings 437, ,939 Retirement benefit provisions 1,931 1,881 Other non-current liabilities 44,293 22,521 Deferred taxes 4,634 4, , ,959 Current liabilities Other provisions 9,224 17,908 Income tax liabilities 2,000 1,854 Bank borrowings 115, ,304 Trade payables 21,202 6,105 Other current liabilities 21,734 16, , ,368 Liabilities in connection with the non-current available-for-sale assets 8,597 8, , ,421 31
32 Income statement Consolidated income statement in TEUR 01/01 06/30/2010 (adjusted) 01/01 06/30/ /01 06/30/2010 (adjusted) 04/01 06/30/2009 Total revenues 39,827 73,306 18,726 40,227 Rental revenues 23,864 23,488 11,907 11,682 Rental expenses -4,533-6,286-2,252-3,385 Net rental income 19,331 17,202 9,655 8,297 Revenues from the sale of inventory real estate 11,354 20,509 5,109 10,805 Expenses on the sale of inventory real estate -11,605-19,675-5,371-10,359 Net revenues from sale of inventory real estate Revenues from the sale of investment properties 4,047 28,269 1,428 17,301 Expenses on the sale of investment properties -3,928-29,339-1,578-17,834 Net revenues from sale of investment properties 119-1, Revenues / net revenues from property management 562 1, Other operating income 9, , Fair-value remeasurement of investment properties 0-15, ,298 Gross profit 29,029 3,640 13,915-6,181 Personnel expenses -4,241-5,786-2,341-3,727 Depreciation / amortisation Impairment losses on receivables and inventories Other operating expenses -7,054-11,699-4,864-9,608 EBIT 17,225-14,946 6,406-20,367 Share of profit of associates 3, , Reversals / impairment losses on receivables from associates 0-1, ,045 Interest income 1,282 4, ,048 Borrowing costs -15,630-16,700-8,330-9,333 EBT 6,221-28,578 2,082-27,606 Income taxes 42-3, ,014 Other taxes Consolidated net profit/loss before minorities 6,256-32,334 1,967-31,929 of which attributable to minority interests , ,870 of which attributable to the equity holders of the parent company 6,413-30,265 2,077-30,059 Earnings per share (EUR), basic Basic earnings / loss per share Diluted earnings / loss per share
33 Consilidated statement of comprehensive income Consilidated statement of comprehensive income in TEUR 01/01-06/30/ /01-06/30/ /01-06/30/ /01-06/30/2009 Consolidated net profit / loss as shown in the income statement 6,256-32,334 1,967-31,929 Unrealised gains and losses from hedge accounting -4,523-3, ,993 Unrealised gains and losses for the revaluation of securities Deferred taxes on unrealised gains and losses 1,377 1, Other comprehensive income after taxes -2,976-2, ,027 Total comprehensive income 3,280-34,706 1,701-29,902 of which attributable to minority interests , ,870 of which attributable to the equityholders of the parent company 3,442-32,368 1,765-28,032 33
34 Cash flow statement Consolidated cash flow statement in TEUR 01/01-06/30/2010 (adjusted) 01/01-06/30/2009 Consolidated net profit / loss (attributable to equity holders of the parent) 6,413-30,265 Profit from first-time consolidation -5,074 0 Depreciation/amortisation Share of profits / losses of associates -3, Changes from remeasurement of investment properties 0 15,298 Impairments on receivables and inventories Reversals/impairment losses on receivables from associates 0 1,045 Earnings / losses from the disposal of investment properties ,070 Changes in deferred income taxes -1,128 2,458 Changes in provisions -8,696 8,492 Changes in receivables and other assets 2,975 4,585 Changes in payables and other liabilities -4,360 2,177 Cash flow from operating activities -12,824 5,908 Payments made for investments in investment properties -17,169-5,377 Payments received from the disposal of investment properties 4,047 28,269 Payments made for investments in intangible assets and property, plant and equipment Payments made for investments in other financial assets -4,909 0 Cash flow from investing activities -18,272 22,343 Payments issued fort he redemption of convertible bonds -11,400 0 Payments received from the issue of convertible bonds 30,000 0 Payments received from bank borrowings 30,507 35,252 Payments made for repaying bank borrowings -19,852-63,689 Payments made for business combinations without change of status Cash flow from financing activities 28,501-28,437 Net change in cash and cash equivalents -2, Cash and cash equivalents at the beginning of the period ,771 Cash and cash equivalents at the end of the period -3,189 3,585 34
35 Statement of changes in equity Statement of changes in consolidated equity in TEUR Subscribed capital Equity holders of the parent company Other reserves Share premium Retained earnings Revaluation of securities Hedge accounting reserve Unappropri ated surplus / accumulated loss Total Minority interests Total equity 01/01/2009 (adjusted) 32, , ,876-14, ,120 26, ,180 Consolidated net profit / loss ,103-30,265-32,368-2,338-34,706 Business combination without change of status /30/2009 (adjusted) 32, , ,979-44, ,880 23, ,474 Consolidated net profit / loss ,099 1, ,760 Business combination without change of status 0-1, ,535-15,602-17,137 Issue of convertible bond Amounts withdrawn from share premium 0-48, , Other changes in minorities /31/ , , ,393 5, ,398 8, ,481 Total comprehensive income ,085 6,413 3, ,280 Business combination without change of status Capital increase against contribution in kind 2,419 8, , ,883 Issue of convertible bond 0 1, , ,291 Repurchase of convertible bond Other changes in minorities /30/ , , ,478 11, ,679 7, ,838 35
36 Segment report Consolidated segment report in TEUR Real estate Hamburg Real estate Berlin Real estate Munich Real estate Others Total Residential Commercial Services Other acitivites/ Consolidation Group Total revenues 7,837 14,611 1,068 2,355 25,871 13, ,828 Previous year 37,395 13,431 3,007 4,431 58,264 12,805 2, ,306 Of which external revenues 7,837 14,611 1,068 2,355 25,871 12, ,828 Previous year 37,395 13,431 3,007 4,431 58,264 12,805 1,040 1,197 73,306 Of which internal revenues Previous year ,124-1,124 0 Segment profit/loss 1,930 3, ,817 11, ,761 Previous year 1,478-1, ,831-1,035 2, ,709 Of which revalu ation of investment properties Previous year , ,071-12, ,298 Non-allocated other operating income 9,268 Previous year 932 Gross profit 29,029 Previous year 3,641 Non-allocated income and expenses -22,808 Previous year -32,218 EBT 6,221 Previous year -28,577 Segment assets 105, ,426 43,381 30, , , , ,377 Previous year 83, ,917 43,381 31, , , , ,096 Non-allocated assets 34,603 Previous year 31,326 Total assets 884,980 Previous year 801,421 36
37 Notes on the interim financial statements Notes on the interim condensed consolidated financial statements to 30 June 2010 General principles The condensed consolidated financial statements of TAG Immobilien AG (referred to in the following as the Company or TAG ) were drawn up in accordance with Section 37w of the German Securities Trading Act pertaining to the half-year financial report. The reporting period covers the first six months of the 2010 financial year. Comparisons refer to 31 December 2009 with respect to the consolidated financial statements, otherwise to the first six months of the 2009 financial year. In addition, in the consolidated income statement and the consolidated statement of comprehensive income the figures pertaining to the second quarter of fiscal 2010 (from 1 April to 30 June 2010) are supplemented by corresponding comparative figures for the previous period. The figures reported in the halfyear financial statements are mostly given in TEUR (thousands of euros). This may result in rounding differences between the individual parts of the financial statements. The condensed consolidated financial statements and consolidated interim management report were reviewed by the Group s auditors. The report on the first half of the financial year is prepared on a consolidated basis in accordance with the International Financial Reporting Standards (IFRS) endorsed by the EU concerning interim reporting (IAS 34 Interim Reporting). The provisions contained in German Accounting Standard No. 16 (DRS 16 Interim Reporting) were also taken into account. The accounting and valuation methods as well as the notes and explanations in the half-year report are based on the same accounting and valuation methods used in the consolidated financial statements for the year ended 31 December For more details accounting and valuation methods, please refer to the consolidated financial statements at 31 December 2009 drawn up in accordance with IFRS, which form the material basis for these interim financial statements in accordance with IAS
38 Notes on the interim financial statements In the first half of 2010 a further 0.92 percent stake in Bau-Verein zu Hamburg Aktien-Gesellschaft, Hamburg, (Bau-Verein AG) were acquired for TEUR 753. This transaction was recorded as a business acquisition without change of status within Group equity. Consolidated companies and acquisitions of the reporting period The consolidated companies as of 30 June 2010 basically include TAG and all companies in which TAG directly or indirectly holds a majority of the voting rights. If shares in subsidiaries are considered to be of secondary significance from the Group s perspective, they are recognised as financial instruments in accordance with IAS 39. The shares in DESIGN Bau BV Hamburg GmbH & Co. KG and DESIGN Bau BV Hamburg Verwaltungs GmbH, which up to this point were included by way of proportionate consolidation, were sold with effect from 31 May The disposal of the shares resulted in a loss of TEUR 745, which is shown under other operating expenses. With effect from 1 January 2010, a 100 percent holding in Ostara Alpha S.à r.l. (now trading as TAG Nordimmobilien S.à r.l. ), based in Luxembourg, was acquired in return for the issuance of 2,418,182 shares and a cash purchase price. The current market value of the acquisition costs amounted to around TEUR 14,700. In this connection, the shares issued by TAG were valued at the market price on the date of purchase. The primary asset of this company is a portfolio of residential properties located mostly in Berlin with a total value of around TEUR 47,500. Major liabilities were acquired in the form of bank loans with a fair value of approximately TEUR 26,100 and in the form of deferred taxes of approximately TEUR 2,400. Setting off the net value of the acquired assets against the acquisition cost resulted in a net profit of around TEUR 4,200, which is listed under other expenses and income. Since the acquisition date, TAG Nordimmobilien S.à r.l. has generated revenues of TEUR 1,322 and a net profit of TEUR 55 for the period. 38
39 Notes on the interim financial statements With effect from 31 May 2010, TAG also acquired 100 percent of Francono Advisory AG, Frankfurt am Main (in future trading as TAG Sachsenimmobilien GmbH, Hamburg ) for a cash payment. The current market value of the acquisition costs amounted to around TEUR 4,500. The primary asset of this company is a portfolio of residential properties in East Germany with a total value of around TEUR 18,000. Substantial liabilities were acquired in the form of bank loans with a fair value of approximately TEUR 11,000 and in the form of negative market values of interest rate swaps of TEUR 1,400, and deferred taxes of approximately TEUR 400. Setting off the net value of the acquired assets against the acquisition cost resulted in a net profit of around TEUR 850 listed under other expenses and income. Since the acquisition date Francono Advisory AG has generated revenues of TEUR 157 and a net profit of TEUR -16. If the acquisition had occurred with effect from 1 January 2010, Francono Advisory AG would have had forecasted revenue of around TEUR 1,200 and a net loss for the period of around TEUR The acquisitions served to further expand TAG s residential real estate portfolio. Because all the information necessary to prepare accounts for the acquisitions was not yet available at the time of writing, the profits reported, which were achieved mainly by positive results from negotiations regarding individual purchase pricing, should be considered as provisional. Therefore, there changes may still be made to them by the time the consolidated financial statements to 31 December 2010 are published. In the second quarter of 2010, TAG bought up approx. 20 percent of the voting rights of Estavis AG, Berlin, which is included in the financial statements from 30 June 2010 as an associated company. The cost of these shares (totalling approximately TEUR 3,500) consisted of contributing a piece of real estate to Estavis as a contribution in kind, as well as a cash component. Setting off the net value of the acquired assets against the acquisition cost resulted in a net profit of around TEUR 3,300, which is listed under income from associated companies. The accounts for the acquisition of shares in Estavis AG were also prepared based on preliminary information. 39
40 Notes on the interim financial statements Material transactions and events during the reporting period Adjustment of prior-year figures and changes and changes to the accounts vs. the prior year In comparison to the condensed consolidated interim financial statements to 30 June 2009, the adjustments to the prior year s figures and changes in accounts as described in the consolidated financial statements to 31 December 2009 were initially made. Please refer to the remarks pertaining to this in the Consolidated Notes for the 2009 financial year. Furthermore, in fiscal 2009 reimbursements from tenants for the operating and utility costs were netted against rental expenses for the first time. In the past, these were shown under revenues. At 30 June 2010, these reimbursements amounted to TEUR 887 (previous year: TEUR 1,239). In the first half of the year, Bau-Verein AG acquired two residential real estate portfolios of around 403 units. The properties are characterised by attractive cash flows and potential for development. The regional focus of the portfolios is Schleswig- Holstein and Berlin. The new portfolios led to inflow of TEUR 17,016 in the investment property sector. Furthermore, there was a reduction in the investment properties and properties slated for sale shown on the balance sheet due to disposals during the first half of The new item under shares in associated companies refers to the newly acquired shares in Estavis AG. The increase in other financial assets refers to the acquisition of a 10 percent stake in Westgrund AG, Remscheid, at a purchase price of TEUR 1,347. Based on the revaluation of the securities to reflect their market price as of the balance sheet date (30 June 2010), a TEUR 170 upgrade with no effect on net income was recorded on the books, as a separate reserve within Group equity, with deferred taxes taken into consideration. 40
Interim report on the 3rd quarter of 2010
 Interim report on the 3rd quarter of 2010 1 Group Financials Group Financials (IFRS) in TEUR 01/01-09/30/2010 (adjusted) 01/01-09/30/2009 A. Income statement key figures Revenues 64,076 101,443 a) Sales
Real Estate Tax Strategies - 2009
 TAG Immobilien AG February 2010/Q1-Q3 2009 TAG I 1 Content I. Group overview Investment case/ Structure Highlights Q3 page 3-6 II. Portfolio page 7-12 Residential Commercial Vacancy rates Q4/2009 III.
TO OUR SHAREHOLDERS DYNAMIC FIRST HALF YEAR
 HALF YEAR REPORT AS OF JUNE 30, 2015 TO OUR SHAREHOLDERS Patrik Heider, Spokesman of the Executive Board and CFOO The Nemetschek Group maintained its dynamic development from the first quarter of 2015
Logwin AG. Interim Financial Report as of 31 March 2015
 Logwin AG Interim Financial Report as of 31 March 2015 Key Figures 1 January 31 March 2015 Earnings position In thousand EUR 2015 2014 Revenues Group 274,433 278,533 Change on 2014-1.5% Solutions 101,821
TO OUR SHAREHOLDERS PROFITABLE GROWTH COURSE INTERNATIONALIZATION FURTHER EXTENDED US MARKET IN FOCUS
 QUARTERLY STATEMENT AS OF MARCH 31, 2015 TO OUR SHAREHOLDERS Patrik Heider, Spokesman of the Executive Board and CFOO The Nemetschek Group has made a dynamic start in the 2015 financial year and continues
CONSOLIDATED INTERIM FINANCIAL STATEMENTS
 CONSOLIDATED INTERIM FINANCIAL STATEMENTS AND GROUP INTERIM MANAGEMENT REPORT SECOND QUARTER OF 2008 JUNE 30, 2008 FRANCONOFURT AG FRANKFURT AM MAIN FRANCONOFURT AG, FRANKFURT AM MAIN CONSOLIDATED INTERIM
Travel24.com AG. Quarterly Report Q1 2015
 Travel24.com AG Quarterly Report Q1 2015 2 Selected Key Group Data January 1 - March 31 Change In thousands of euro 2015 2014 % Revenue 4,494 7,810-42 % EBIT 806 1,231-35 % Net profit 66 518-87 % Earnings
Ahlers AG, Herford. ISIN DE0005009708 and DE0005009732 INTERIM REPORT
 Ahlers AG, Herford ISIN DE0005009708 and DE0005009732 I N T E R I M R E P O R T for the first six months of the 2006/07 financial year (December 1, 2006 to May 31, 2007) BUSINESS DEVELOPMENT IN THE FIRST
Overview of the key figures for the first half of the year
 Half-Year Report 2015 Q2 Revenues increase in the first half of the year by 23% EBIT increased by 1.5 million euros compared to the previous year Order book is growing Overall annual forecast remains unchanged
Interim consolidated financial statements as of September 30, 2007
 1 Interim consolidated financial statements as of September 30, 2007 January 1 through September 30, 2007 MeVis Medical Solutions AG laying the foundation for further dynamic growth: Sales plus other operating
HALF YEAR REPORT AS OF JUNE 30
 2 0 1 4 HALF YEAR REPORT AS OF JUNE 30 T O O U R S H A R E H O L D E R S Dear shareholders, ladies and gentlemen, The Nemetschek Group continued its successful development in the second quarter of 2014
Consolidated Interim Report
 Consolidated Interim Report as of 31 March 2015 UNIWHEELS AG CONTENTS 1. Key performance data 2. Condensed group management report as of 31 March 2015 3. Condensed consolidated financial statements as
TLG IMMOBILIEN AG H1 2015 Results August 2015
 TLG IMMOBILIEN AG H1 2015 Results August 2015 Disclaimer This presentation includes statements, estimates, opinions and projections with respect to anticipated future performance of TLG IMMOBILIEN ("Forward-Looking
2015 Quarterly Report II
 2015 Quarterly Report II 2 Key data Eckert & Ziegler 01 06/2015 01 06/2014 Change Sales million 69.0 61.9 + 11 % Return on revenue before tax % 16 % 9 % + 87 % EBITDA million 15.6 9.7 + 61 % EBIT million
Deutsche Wohnen AG.» Investor Presentation. September 2010
 Deutsche Wohnen AG» Investor Presentation September 21 1 » Agenda 1 2 3 4 Introduction to Deutsche Wohnen Portfolio Overview and Operations Financial Highlights Guidance and Strategic Objectives 2 » 1
Equity per share (NOK) 147 123 131 Equity ratio 39 % 38 % 36 % Non-current net asset value per share (NOK) (EPRA NNNAV) 2) 184 152 165
 147 123 131 Equity ratio 39 % 38 % 36 % Non-current net asset value per share (NOK) (EPRA NNNAV) 2) 184 152 165") REPORT FOR Q2 AND THE FIRST 6 MONTHS OF 2015 KEY FIGURES Amounts in NOK million Q2 2015 Q2 2014 30.06.15 30.06.14 2014 Net rental income 501 450 1 005 904 1 883 Fair value adjustments in investment properties
REPORT FOR Q2 AND THE FIRST 6 MONTHS OF 2015 KEY FIGURES Amounts in NOK million Q2 2015 Q2 2014 30.06.15 30.06.14 2014 Net rental income 501 450 1 005 904 1 883 Fair value adjustments in investment properties
Brookfield financial Review q2 2010
 Brookfield financial Review q2 2010 Overview Operating cash flow and gains totalled $327 million in the second quarter or $0.53 per share compared to $294 million in the prior year. This brings operating
Unaudited Financial Report
 RECRUITING SERVICES Amadeus FiRe AG Unaudited Financial Report Quarter I - 2015 Temporary Staffing. Permanent Placement Interim Management. Training www.amadeus-fire.de Unaudited Amadeus FiRe Group Financial
INTERIM REPORT First Nine Months 2009/10
 INTERIM REPORT First Nine Months 2009/10 1 July 2009 31 March 2010 OVERVIEW KEY FINANCIAL DATA ESTAVIS AG 3rd quarter 09/10 1 Jan. 2010 31 March 2010 3rd quarter 08/09 1 Jan. 2009 31 March 2009 9 months
InVision AG Workforce Management Cloud Services Call Center Training. Financial Report 9M 2014
 Financial Report 9M 2014 Seite 1 von 7 1. Financial Summary Income (in TEUR) 9M 2014 9M 2013 Revenues 9,485 9,992-5% Software & Subscriptions 8,668 8,127 +7% Services 817 1,865-56% EBIT 2,926 1,051 +178%
How To Calculate Earnings In Euro
 3 MONTH REPORT AS AT 31 DECEMBER 2014 KEY FIGURES IFRS in KEUR 10/2014 12/2014 10/2013 12/2013 Difference in % Earnings situation Sales revenues 61,403 56,296 5,107 9% EBITDA 7,159 5,901 1,258 21% EBITDA
Con sis ten cy. Positioned perfectly.
 Con sis ten cy Positioned perfectly. 1 Deutsche Wohnen AG group KEY FIGURES 2 Consolidated INTERIM MANAGEMENT REPORT 3 Consolidated INTERIM FINANCIAL STATEMENTS 19 Responsibility statement 32 FINANCIAL
Consolidated Financial Results for the First Two Quarters of the Fiscal Year Ending March 31, 2016 (Japan GAAP)
") Consolidated Financial Results for the First Two Quarters of the Fiscal Year Ending March 31, 2016 (Japan GAAP) Name of Listed Company: Yokogawa Electric Corporation (the Company herein) Stock Exchanges
Consolidated Financial Results for the First Two Quarters of the Fiscal Year Ending March 31, 2016 (Japan GAAP) Name of Listed Company: Yokogawa Electric Corporation (the Company herein) Stock Exchanges
gsw immobilien ag interim REPORt H1-2012
 gsw immobilien ag interim REPORt H1-2012 MY BERliN. MY HOME. Highlights Operational Highlights 30.06.2012 30.06.2011 Vacancy rate (residential) 3.2 % 3.8 % In-place rent (residential) 5.14 EUR / sqm 4.94
FINANCIAL REPORT H1 2014
 FINANCIAL REPORT H1 2014 HIGH SPEED BY PASSION 02_Key Figures 03_Group Status Report 05_Consolidated Financial Statements 10_Notes 11_Declaration of the Legal Representatives 02 PANKL KEY FIGURES EARNING
2014 Quarterly Report II
 2014 Quarterly Report II 2 Key data Eckert & Ziegler 01 06/2014 01 06/2013 Change Sales million 61.9 55.3 12% Return on revenue before tax % 9 % 12 % 26 % EBITDA million 9.7 10.2 5 % EBIT million 6.2 6.9
DEUFOL SE JOHANNES-GUTENBERG-STR. 3 5 65719 HOFHEIM (WALLAU), GERMANY PHONE: + 49 (61 22) 50-00 FAX: + 49 (61 22) 50-13 00 WWW.
, GERMANY PHONE: + 49 (61 22) 50-00 FAX: + 49 (61 22) 50-13 00 WWW.") SEMI-ANNUAL REPORT 5 Key Figures for the Deufol Group figures in thousand 6M 2015 6M 2014 Results of operations Revenue (total) 152,088 141,450 Germany 83,770 77,730 Rest of the World 68,318 63,720 International
SEMI-ANNUAL REPORT 5 Key Figures for the Deufol Group figures in thousand 6M 2015 6M 2014 Results of operations Revenue (total) 152,088 141,450 Germany 83,770 77,730 Rest of the World 68,318 63,720 International
EUROCASTLE INVESTMENT LIMITED. 2011 Investor Presentation
 EUROCASTLE INVESTMENT LIMITED 2011 Investor Presentation Forward Looking Statements This release contains statements that constitute forward-looking statements. Such forward-looking statements may relate
Equity per share (NOK) 135 123 131 Equity ratio 37 % 39 % 36 % Non-current net asset value per share (NOK) (EPRA NNNAV) 2) 170 153 165
 135 123 131 Equity ratio 37 % 39 % 36 % Non-current net asset value per share (NOK) (EPRA NNNAV) 2) 170 153 165") REPORT Q1/2015 KEY FIGURES Amounts in NOK million Q1 2015 Q1 2014 31.12.14 Net rental income 503 454 1 883 Fair value adjustments in investment properties and interest rate derivatives 1 294-9 281 Profit
REPORT Q1/2015 KEY FIGURES Amounts in NOK million Q1 2015 Q1 2014 31.12.14 Net rental income 503 454 1 883 Fair value adjustments in investment properties and interest rate derivatives 1 294-9 281 Profit
Quarterly Financial Report March 31, 2009. MBB Industries AG. Berlin
 Quarterly Financial Report March 31, 2009 MBB Industries AG. Berlin Quarterly Financial Report March 31, 2009 MBB Industries AG MBB Industries in Numbers 03 MBB Industries in Numbers Three Month (Jan.
2014/2015 The IndusTrIal Group
 Q2 2014/2015 Half-Year Interim Report 2014/2015 1 April to 30 September 2014 The Industrial Group The first six months of financial year 2014/2015 at a glance Incoming orders increased in the first half
Interim report as at 30 September 2014
 Interim report as at 30 September 2014 Fielmann increases unit sales, revenue and profit Result registers significant growth in the 3 rd quarter of 2014 Fielmann trains more than 2,900 opticians Fielmann
Financial Report 9M 2014
 Financial Report 9M 2014 1 von 10 12.11.14 13:19 1. Financial Summary Income (in TEUR) 9M 2014 9M 2013 Revenues 9,485 9,992 Software & Subscriptions 8,668 8,127 Services 817 1,865 EBIT 2,926 1,051 as a
Consolidated Financial Results for Six Months Ended September 30, 2007
 Consolidated Financial Results for Six Months Ended September 30, 2007 SOHGO SECURITY SERVICES CO., LTD (URL http://ir.alsok.co.jp/english) (Code No.:2331, TSE 1 st Sec.) Representative: Atsushi Murai,
9-MONTHS REPORT. Stable development of business in Q3 Lila Logistik confirms full-year forecast
 /08 9-MONTHS REPORT Stable development of business in Q3 Lila Logistik confirms full-year forecast Key figures for the first three quarters of 2008 in accordance with IFRS 01.01. 01.01. Change in Change
Consolidated and Non-Consolidated Financial Statements
 May 13, 2016 Consolidated and Non-Consolidated Financial Statements (For the Period from April 1, 2015 to March 31, 2016) 1. Summary of Operating Results (Consolidated) (April 1,
3-month report January - March 2007 Published on August 10, 2007
 3-month report January - March 2007 Published on August 10, 2007 3-month report January March 2007 1. Group management report for the first quarter of 2007 Overview of the first quarter in 2007 Continued
conwert Immobilien Buy (unchanged) Target: Euro 14.00 (unchanged)
 Target: Euro 14.00 (unchanged)") conwert Immobilien Buy (unchanged) Target: Euro 14.00 (unchanged) 26 Aug 15 Price (Euro) 11.31 52 weeks range 12.45 / 8.54 Key Data ISIN AT0000697750 Reuters CONW.VI Bloomberg CWI AV Reporting standard
conwert Immobilien Buy (unchanged) Target: Euro 14.00 (unchanged) 26 Aug 15 Price (Euro) 11.31 52 weeks range 12.45 / 8.54 Key Data ISIN AT0000697750 Reuters CONW.VI Bloomberg CWI AV Reporting standard
2014/2015 The IndusTrIal Group
 Q1 2014/2015 Interim Report 1 April to 30 june 2014 The Industrial Group The essentials at a glance in the first quarter Big increase in incoming orders, sales on par with previous year, earnings considerably
CPI PROPERTY GROUP continues in successful business operations, expansion plans and refinancing of existing projects
 CPI PROPERTY GROUP continues in successful business operations, expansion plans and refinancing of existing projects Corporate highlights Annual General Meeting of 28 May 2015 The Annual General Meeting
Group 9-month report Bastei Lübbe AG 1 Apr - 31 Dec 2015
 Group 9-month report Bastei Lübbe AG 1 Apr - 31 Dec 2015 At a Glance Key figures (IFRS) 01/04/2015-2015 01/04/- Change in % Business development in million Group turnover 79.4 86.8-8.5 % EBITDA 14.0 11.5
2OO 6 9 MONTHS REPORT 2OO 7
 2OO 6 9 MONTHS REPORT 2OO 7 Hönle at a glance Hönle Group Figures 1) 2006/2007 2005/2006 Changes 9 months 9 months Income Statement T T in % Revenues 19,055 17,081 11.6 EBITDA 3,504 2,661 31.7 EBIT 3,005
Consolidated Nine-month Report of Baader Bank AG as of 30 September 2012
 Consolidated Nine-month Report of Baader Bank AG as of 30 September 2012 Overview of key figures EARNINGS 1 Jan. - 30 Sept. 2012 1 Jan. - 30 Sept. 2011 Change % Net interest income thou. 4.06 4.66-13.0
Overview of the key figures for the first nine months
 Continued revenue growth: up 12% on previous year Results impacted by revenue structure and one-off effects High volume of orders: outlook remains optimistic Q3 Overview of the key figures for the first
Q3/2010 Interim report as of September 30, 2010
 Q3/2010 Interim report as of September 30, 2010 Overview of key figures 01.01.-30.09.2010 01.01.-30.09.2009 Change in % Net fee and commission income EUR million 25,89 27,03-4,2 Net trading income EUR
Financial Summary. as a % of balance sheet total
 InVision AG Financial Report 6M 2015 Consolidated Interim Financial Statements of InVision AG as of 30 June 2015 in accordance with IFRS and 315a of the German Commercial Code as well as the Group management
Unaudited Nine Months Financial Report
 RECRUITING SERVICES Amadeus FiRe AG Unaudited Nine Months Financial Report January to September 2015 Temporary Staffing. Permanent Placement Interim Management. Training www.amadeus-fire.de Unaudited Nine
Interim report as at 31 March 2015
 Interim report as at 31 March 2015 Increase of unit sales, revenue and profit Dividend raises to 1.60 per share Fielmann expects continuation of positive business performance Fielmann Aktiengesellschaft
Contact 6-Month Report 2005
 Contact 6-Month Report 2005 Security Networks AG Kronprinzenstrasse 30 45128 ssen Germany Phone: +49 (0) 201 54 54-0 Fax: +49 (0) 201 54 54-456 Internet: www..com -mail: investor.relations@.com Key figures
VASSETI (UK) PLC CONSOLIDATED FINANCIAL STATEMENTS FOR THE SIX MONTHS ENDED 30 JUNE 2013
 PLC CONSOLIDATED FINANCIAL STATEMENTS FOR THE SIX MONTHS ENDED 30 JUNE 2013") CONSOLIDATED FINANCIAL STATEMENTS FOR THE SIX MONTHS ENDED 30 JUNE 2013 INTERIM MANAGEMENT REPORT (UNAUDITED) FOR THE 6 MONTHS ENDED 30 JUNE 2013 1. Key Risks and uncertainties Risks and uncertainties
CONSOLIDATED FINANCIAL STATEMENTS FOR THE SIX MONTHS ENDED 30 JUNE 2013 INTERIM MANAGEMENT REPORT (UNAUDITED) FOR THE 6 MONTHS ENDED 30 JUNE 2013 1. Key Risks and uncertainties Risks and uncertainties
Consolidated Financial Results for Fiscal Year 2013 (April 1, 2013 March 31, 2014)
") Consolidated Financial Results for Fiscal Year 2013 (April 1, 2013 March 31, 2014) 28/4/2014 Name of registrant: ShinMaywa Industries, Ltd. Stock Exchange Listed: Tokyo Code number: 7224 (URL: http://www.shinmaywa.co.jp
Consolidated Financial Results for Fiscal Year 2013 (April 1, 2013 March 31, 2014) 28/4/2014 Name of registrant: ShinMaywa Industries, Ltd. Stock Exchange Listed: Tokyo Code number: 7224 (URL: http://www.shinmaywa.co.jp
Overview of Business Results for the Second Quarter of Fiscal Year Ending March 2015 [Japanese Standard Form] (Consolidated)
![Overview of Business Results for the Second Quarter of Fiscal Year Ending March 2015 [Japanese Standard Form] (Consolidated)](/thumbs/38/17889580.jpg "Overview of Business Results for the Second Quarter of Fiscal Year Ending March 2015 [Japanese Standard Form] (Consolidated)") Overview of Business Results for the Second Quarter of Fiscal Year Ending March 2015 [Japanese Standard Form] (Consolidated) November 6, 2014 Name of the Company: Cosmo Oil Co., Ltd. Shares traded:tse
Overview of Business Results for the Second Quarter of Fiscal Year Ending March 2015 [Japanese Standard Form] (Consolidated) November 6, 2014 Name of the Company: Cosmo Oil Co., Ltd. Shares traded:tse
Company Roadshow Presentation HAMBORNER REIT AG. Preliminary figures 2012 February 2013
 Company Roadshow Presentation HAMBORNER REIT AG Preliminary figures 2012 February 2013 HAMBORNER REIT AG key investment highlights Creating sustainable shareholder value Strong asset and portfolio management
Overview of key figures
 Quarterly report for the 1 st Quarter 2010 Overview of key figures 01.01.- 01.01.- Change 31.03.2010 31.03.2009 in % Net fee and commission income in EUR 9.87 8.58 15.0 Net trading income in EUR 16.96
1 CONSOLIDATED FINANCIAL STATEMENTS (1) Consolidated Balance Sheets
 Consolidated Balance Sheets") 1 CONSOLIDATED FINANCIAL STATEMENTS (1) Consolidated Balance Sheets As of March 31,2014 As of March 31,2015 Assets Cash and due from banks 478,425 339,266 Call loans and bills bought 23,088 58,740 Monetary
1 CONSOLIDATED FINANCIAL STATEMENTS (1) Consolidated Balance Sheets As of March 31,2014 As of March 31,2015 Assets Cash and due from banks 478,425 339,266 Call loans and bills bought 23,088 58,740 Monetary
Consolidated Half-Year Report of Baader Bank AG as at 30.06.2014
 Consolidated Half-Year Report of Baader Bank AG as at 30.06.2014 OVERVIEW OF KEY FIGURES RESULTS OF OPERATIONS 01.01-30.06.2014 01.01-30.06.2013 Change in % Net interest income thousand 1,017 1,991-48.9
Ahlers AG, Herford. ISIN DE0005009708 and DE0005009732 INTERIM REPORT
 Ahlers AG, Herford ISIN DE0005009708 and DE0005009732 on the first nine months of fiscal 2005/06 (December 1, 2005, to August 31, 2006) BUSINESS DEVELOPMENT IN THE FIRST NINE MONTHS OF FISCAL 2005/06 According
NN Group N.V. 30 June 2015 Condensed consolidated interim financial information
 Interim financial information 5 August NN Group N.V. Condensed consolidated interim financial information Condensed consolidated interim financial information contents Condensed consolidated interim
Unaudited Half Year Financial Report January June 2013. Creating career prospects and deploying targeted professional skills.
 Creating career prospects and deploying targeted professional skills Amadeus FiRe AG Unaudited Half Year Financial Report January June 2013 Unaudited Half Year Financial Report, January June 2013 1 Unaudited
Letter from the Management Board 3. Key Financial Figures 4. Management Report 5. Consolidated Income Statement (IFRS) 9
 9") 3-Months Report 2015 Content Letter from the Management Board 3 Key Financial Figures 4 Management Report 5 Consolidated Income Statement (IFRS) 9 Consolidated Statement of Comprehensive Income (IFRS)
3-Months Report 2015 Content Letter from the Management Board 3 Key Financial Figures 4 Management Report 5 Consolidated Income Statement (IFRS) 9 Consolidated Statement of Comprehensive Income (IFRS)
Statutory Financial Statements
 Statutory Financial Statements for the year ended December 31, 2007 by Kardan NV, Amsterdam, the Netherlands Consolidated IFRS Financial Statements Consolidated IFRS Balance Sheet 54 Consolidated IFRS
3 M O N T H S R E P O R T 2 O O 3 / 2 O O 4
 3 M O N T H S R E P O R T 2 O O 3 / 2 O O 4 Content 03 Hönle at a glance 04 Letter to the Shareholders 06 Management Report 09 Consolidated financial statement 17 Shareholdings of the corporate bodies
2 Quarterly Report 02 Ratios. Jan Jun/2012 Jan Jun/2011 Change. Sales Million EUR 57.9 55.8 4% Return on revenue before tax % 16% 20% 23%
 Quarterly Report II 2 Quarterly Report 02 Ratios Jan Jun/ Jan Jun/ Change Sales Million EUR 57.9 55.8 4% Return on revenue before tax % 16% 20% 23% EBITDA Million EUR 13.8 15.4 11% EBIT Million EUR 10.0
Semiannual Report of FJA AG
 www.fja.com Semiannual Report of FJA AG 01.01.2008-30.06.2008 Contact FJA AG Elsenheimerstrasse 65 80687 Munich GERMANY Investor Relations Phone: + 49 89 76901-274 or -7002 Fax: + 49 89 7698813 Email:
Report for the quarter ending March 31, 2004
 TAG Tegernsee Immobilien- und Beteiligungs-Aktiengesellschaft WKN 830 350 I S I N DE0008303504 Reuters TEGG Mu.F, Bloomberg TEG GR Report for the quarter ending March 31, 2004 TAG reporting consolidated
Results PostNL Q3 2014
 Results PostNL Q3 2014 The Hague, 3 November 2014 PostNL reports solid Q3 2014 results Financial highlights Q3 2014 Revenue increased to 988 million (Q3 2013: 969 million) Underlying cash operating income
Check against delivery. Hans Dieter Pötsch Speech at the Annual Media Conference and Investor Conference on March 13, 2014.
 Check against delivery Hans Dieter Pötsch Speech at the Annual Media Conference and Investor Conference on March 13, 2014 Part II Good morning, Ladies and Gentlemen, I, too, would like to wish you a very
Interim report as at 30 September 2015
 Interim report as at 30 September 2015 Fielmann improves unit sales, revenue and profit Specialists of tomorrow: 3,000 apprentices Fielmann creates 500 new jobs Fielmann Aktiengesellschaft Group interim
Quarter Report 2014 ESSANELLE HAIR GROUP AG
 Quarter Report 2014 ESSANELLE HAIR GROUP AG Q1 2 Q1/2014 ESSANELLE HAIR GROUP KEY FIGURES for 1 January to 31 March 2014/2013 (IFRS) million 2014 2013 Change* Consolidated sales 32.3 30.8 +4.7% essanelle
www.deutsche-wohnen.de
 JANUARY 1 TO JUNE 30, 2003 INTERIM REPORT www.deutsche-wohnen.de EUR 159.00 High: EUR 159.00 (June 26, 2003) 158.00 157.00 156.00 155.00 154.00 153.00 152.00 151.00 150.00 149.00 148.00 147.00 146.00 145.00
2013 HALF YEAR REPORT AS OF JUNE 30
 2013 HALF YEAR REPORT AS OF JUNE 30 To our shareholders Tanja Tamara Dreilich, Executive Board Dear shareholders, ladies and gentlemen, In the second quarter we were able to continue the solid development
2015 Results and Prospects
 PRESS RELEASE Paris, 23 March 2016 2015 Results and Prospects Revenues: 2,579.3 million, up 3.2% EBITDA: 342.0 million, an operating margin of 13.3% 2016 Objectives: revenues close to 3 billion and an
nine months statement
 nine months statement 22 Brüder Mannesmann Aktiengesellschaft Remscheid Brüder Mannesmann AG is a trading group with two orientations the worldwide trading in tools and the trading in pipe fittings for
Service Tax Planning - Expected Revenue Growth in FY 2015
 Munich, Germany, May 7, 2015 Earnings Release FY 2015 January 1 to March 31, 2015 Portfolio gains drive income»for business volume, we performed well in our markets. The profitability of our Industrial
3. CONSOLIDATED QUARTERLY FINANCIAL STATEMENTS
 3. CONSOLIDATED QUARTERLY FINANCIAL STATEMENTS (1) Consolidated Quarterly Balance Sheets September 30, 2014 and March 31, 2014 Supplementary Information 2Q FY March 2015 March 31, 2014 September 30, 2014
Earnings Release Q1 FY 2016 October 1 to December 31, 2015
 Munich, Germany, January 25, 2016 Earnings Release FY 2016 October 1 to December 31, 2015 Strong start into the fiscal year earnings outlook raised»we delivered a strong quarter and are well underway in
Consolidated Financial Results for the Third Quarter Ended December 31, 2014
 Consolidated Financial Results for the Third Quarter Ended February 3, 2015 SHARP CORPORATION Stock exchange listings: Tokyo Code number: 6753 URL: http://www.sharp.co.jp/ Representative: Kozo Takahashi,
Brief Report on Closing of Accounts (connection) for the Term Ended March 31, 2007
 for the Term Ended March 31, 2007") MARUHAN Co., Ltd. Brief Report on Closing of (connection) for the Term Ended March 31, 2007 (Amounts less than 1 million yen omitted) 1.Business Results for the term ended on March, 2007 (From April 1,
MARUHAN Co., Ltd. Brief Report on Closing of (connection) for the Term Ended March 31, 2007 (Amounts less than 1 million yen omitted) 1.Business Results for the term ended on March, 2007 (From April 1,
CONFERENCE CALL Q1-Q3 2010. 10 November 2010
 CONFERENCE CALL Q1-Q3 2010 10 November 2010 Agenda Overview Q1-Q3 Q3 2010 Dr Helmut Leube, Chairman of the Management Board Key financials i Q1-Q3 Q3 2010 Dr Margarete Haase, CFO Outlook Dr Helmut Leube,
Interim Report HORNBACH HOLDING AG GROUP. 1st QUARTER 2004/2005 (March 1 to May 31, 2004)
") Interim Report HORNBACH HOLDING AG GROUP 1st QUARTER 2004/2005 (March 1 to May 31, 2004) page 2 HORNBACH HOLDING AG Group Interim Report (IFRS) for the First Quarter of 2004/2005 (March 1 to May 31, 2004)
Interim Report HORNBACH HOLDING AG GROUP 1st QUARTER 2004/2005 (March 1 to May 31, 2004) page 2 HORNBACH HOLDING AG Group Interim Report (IFRS) for the First Quarter of 2004/2005 (March 1 to May 31, 2004)
Elements of a Pharmaceutical Spending in the United Kingdom
 Half-yearly Financial Report January 1 June 30, engineering for a better world GEA Group: Key IFRS figures GEA Group: Key IFRS figures (EUR million) Q2 Q2 1 Q1-Q2 Q1-Q2 1 Results of operations Order intake
interim report 2004June 30, 2004
 interim report 2004June 30, 2004 Macroeconomic trends In the first quarter of 2004, the euro-area economy grew 0.6% sequentially. This represented a faster pace of growth than in the previous quarters.
Note 2 SIGNIFICANT ACCOUNTING
 Note 2 SIGNIFICANT ACCOUNTING POLICIES BASIS FOR THE PREPARATION OF THE FINANCIAL STATEMENTS The consolidated financial statements have been prepared in accordance with International Financial Reporting
Financial Results. siemens.com
 s Financial Results Fourth Quarter and Fiscal 2015 siemens.com Key figures (in millions of, except where otherwise stated) Volume Q4 % Change Fiscal Year % Change FY 2015 FY 2014 Actual Comp. 1 2015 2014
Sydbank s preliminary announcement of 2006 annual results
 Copenhagen Stock Exchange London Stock Exchange Bourse de Luxembourg Other stakeholders Stock Exchange Announcement No 01/07 Group Executive Management Peberlyk 4 PO Box 1038 DK-6200 Aabenraa Tel +45 74
Interim Report. January - September
 Interim Report January - September LETTER TO THE SHAREHOLDERS RIB SOFTWARE AG LETTER TO THE SHAREHOLDERS Dear Shareholders, With two strategic acquisitions in the third quarter of, we have taken a further
HIGHLIGHTS AT A GLANCE
 1 HIGHLIGHTS AT A GLANCE M.A.X. Automation Group reports successful first half of 2015 Business development fully in line with expectations Consolidated sales rise by 4% to EUR 171 million EBIT before
Quarterly Financial Results for the Fiscal Year Ending September 30, 2016 (J-GAAP)
") February 10, 2016 Quarterly Financial Results for the Fiscal Year Ending September 30, 2016 (J-GAAP) (1st Quarter / October 1, 2015 December 31, 2015) Company Name Hosokawa Micron Corporation Stock Exchange
February 10, 2016 Quarterly Financial Results for the Fiscal Year Ending September 30, 2016 (J-GAAP) (1st Quarter / October 1, 2015 December 31, 2015) Company Name Hosokawa Micron Corporation Stock Exchange
RHÖN-KLINIKUM AG. Interim Report First Quarter 2007
 RHÖN-KLINIKUM AG Interim Report First Quarter 2007 Interim report to our shareholders for the first quarter of 2007 General remarks We are pleased to present this interim report which has been prepared
Diluted net income per share. Six months ended Sep. 30, 2012 0.40 0.39 Six months ended Sep. 30, 2011 (1.09) -
 -") November 9, 2012 Summary of Consolidated Financial Results for the Second Quarter of Fiscal Year Ending March 31, 2013 (Six Months Ended September 30, 2012) [Japanese GAAP] Company name: Japan System Techniques
November 9, 2012 Summary of Consolidated Financial Results for the Second Quarter of Fiscal Year Ending March 31, 2013 (Six Months Ended September 30, 2012) [Japanese GAAP] Company name: Japan System Techniques
Q1 2016 Results Conference Call
 Q1 2016 Results Conference Call Karim Bohn, CFO 10 May 2016 PATRIZIA Immobilien AG PATRIZIA Bürohaus Fuggerstrasse 26 86150 Augsburg T +49 821 50910-000 F +49 821 50910-999 immobilien@patrizia.ag www.patrizia.ag
Abbey plc ( Abbey or the Company ) Interim Statement for the six months ended 31 October 2007
 Interim Statement for the six months ended 31 October 2007") Abbey plc ( Abbey or the Company ) Interim Statement for the six months ended 31 October 2007 The Board of Abbey plc reports a profit before taxation of 18.20m which compares with a profit of 22.57m for
Abbey plc ( Abbey or the Company ) Interim Statement for the six months ended 31 October 2007 The Board of Abbey plc reports a profit before taxation of 18.20m which compares with a profit of 22.57m for
How To Calculate Solvay'S Financial Results
 SOLVAC SOCIETE ANONYME Rue de Ransbeek 310 - B-1120 Brussels Belgium Tel. + 32 2 639 66 30 Fax + 32 2 639 66 31 www.solvac.be Press Release Embargo, 27 February 2015 at 5:40 p.m. Regulated information
Deutsche Wohnen AG.» Full Year Results 2009. Conference Call, 26 March 2010
 Deutsche Wohnen AG» Full Year Results 2009 Conference Call, 26 March 2010 1 » Agenda 1. Results of the financial year 2009 2. Financial highlights 2009 3. Strategic objectives 4. Forecast 2 » 1 Results
ACER INCORPORATED AND SUBSIDIARIES. Consolidated Balance Sheets
 Consolidated Balance Sheets June 30, 2015, December 31, 2014, and (June 30, 2015 and 2014 are reviewed, not audited) Assets 2015.6.30 2014.12.31 2014.6.30 Current assets: Cash and cash equivalents $ 36,400,657
TIPTEL AG. Interim report of the TIPTEL Group. for the period from January 1 to September 30, 2006. tiptel
 TIPTEL AG Interim report of the TIPTEL Group for the period from January 1 to September 30, 2006 tiptel Letter to the Shareholders Dear shareholders and business friends, By September 30, 2006 our turnover
CPI PROPERTY GROUP holds its course set steady growth, successful acquisitions and decreasing cost of capital
 CPI PROPERTY GROUP holds its course set steady growth, successful acquisitions and decreasing cost of capital Corporate news Acquisition of 16.7% of own shares On 25 September 2015 the CPI PROPERTY GROUP
Nine-months Report 2014. focused profitable transparent
 Nine-months Report 2014 focused profitable transparent Interim Report for the period from 1 January to 3o September 2014 J Rental income up 8% on prior-year period to EUR 13,803 thousand J FFO increases
Overview of Business Results for the 2nd Quarter of Fiscal Year Ending March 31, 2012 (2Q FY2011)
") November 8, 2011 Overview of Business Results for the 2nd Quarter of Fiscal Year Ending March 31, 2012 () Name of the company: Iwatani Corporation Share traded: TSE, OSE, and NSE first sections Company
November 8, 2011 Overview of Business Results for the 2nd Quarter of Fiscal Year Ending March 31, 2012 () Name of the company: Iwatani Corporation Share traded: TSE, OSE, and NSE first sections Company