SOLVING THE OUT-OF-STOCK PROBLEM. A FMI/GMA Trading Partner Alliance Report
|
|
|
- Corey Kennedy
- 8 years ago
- Views:
Transcription
1 SOLVING THE OUT-OF-STOCK PROBLEM A FMI/GMA Trading Partner Alliance Report

2 Executive Overview Despite many years of good-faith efforts by manufacturers and retailers, the out-of-stock rate remains a stubborn eight percent, on average, with out-of-stocks for promoted items often exceeding 10 percent 1. That represents potential revenue loss of 8-10 percent or more in an industry already challenged with rising costs to serve the customer. The problem is bigger than just lost revenue, however. Today s consumer-driven marketplace makes improving the user experience a high priority. Shoppers say product availability is a Top 3 reason for where they shop, yet on average, every time a shopper comes into a store, one out of every 12 items on her shopping list, and one out of every 10 or less for promoted items, is not on the shelf. Not only does this harm user satisfaction and loyalty, data from the Grocery Manufacturers of America (GMA) and the Food Marketing Institute (FMI) Trading Partner Alliance shows a disturbing three-strikes-and-you re-out pattern. On the first occurrence of an out-of-stock, the typical shopper will substitute another item 70 percent of the time; on the second occurrence the shopper is equally likely to substitute, make no purchase, or go to another store; and on the third occurrence, 70 percent will go to another store. Thus, there is not only the potential for lost revenue from the out-of-stock item itself, but also from the greater loss of future revenue streams from lost brand and/or store loyalty. The FMI/GMA Trading Partner Alliance began researching the out-of-stock problem in 2013 and presented a Good-Better-Best maturity model for improving on-shelf availability (OSA) at the 2014 FMI/GMA Supply Chain Conference. As a next step after the conference, the Alliance surveyed manufacturers and retailers to better understand how a wide range of practitioners are currently addressing out-of-stock issues, or more correctly, how they are pursuing on-shelf availability. The survey results were consistent with the Alliance s previous diagnosis and confirmed the gaps between current practices and future desired state proposed by the Alliance. An updated Good-Better-Best maturity model for how trading partners can transition to a collaborative OSA approach, known as One Supply Chain, is discussed later in this report. The goal of the Alliance s work and the maturity model is to ultimately solve the out-ofstock problem. The gap between current practices and desired performance is repeatedly demonstrated by the study in several critical areas, including metrics/data, process/practice, organizational issues and technology integration. Key findings include: Metrics/Data There is no standard definition of OSA. While 86 percent of retailers measure OSA with physical audits at the shelf in-store, other metrics are also widely used. For instance, 43 percent report using the Zero on hand metric, 29 percent use Zero on hand with lost demand triggers 1 1 GMA/FMI Supply Chain Ideation Conference, May 2013; and, Retail Out-of-Stocks: A Worldwide Examination of Extent, Causes and Consumer Responses, FMI/GMA, 2003

3 and 21 percent use minimum display values. Manufacturers similarly reported multiple metrics for their definition of OSA. Clearly, an important issue is that all parties are not working off of same numbers. Process/Practice There is poor synchronization between retailers and manufacturers on event planning. While 58 percent of retailers say they lock down event plans four weeks or less before the event, 73 percent of manufacturers say they need at least five weeks or more to adjust their production to accommodate these plans. This lack of synchronization can be a major contributor to out-of-stock issues. Organizational Issues There is no clear owner of the inventory among retailers. An equal number of retail respondents said Supply Chain Planning owned inventory as those who said Category Managers or Buyers did, and almost as many said Merchandising owns it. And since respondents were allowed to select more than one answer, the total of responses was approximately 150 percent, indicating even within one retailer more than one group often has ownership. Without clear ownership, there is also no real accountability for solving the problem. Thus, the good intentions of retailers and manufacturers to collaborate will not be fully realized in OSA performance until these and other gaps identified in the research are addressed. The FMI/GMA Trading Partner Alliance is continuing its work on the Good- Better-Best framework to help companies incrementally reach this goal. Specific action items identified by the Alliance so far for the industry include: Move the industry toward a Zero on hand baseline definition of OSA to facilitate better communication and standardization for data exchange Agreement between retailers and suppliers on what demand signal is used for event forecasting Collaboration between retailers and suppliers to better align timing between issuance of event forecasts and production scheduling requirements Collaboration on high-side and low-side range contingency plans for events Technology Despite the high percentage of retail and manufacturing respondents who claim they collaborate on event forecasts, over 78 percent of manufacturers say they don t use retailer forecasts for production and deployment planning, instead opting for their own forecasts which are primarily based on shipments from their DCs. Analysis indicates that part of the reason for this is a timing gap between when data is available versus when it is actually needed, but there is also a problem with the huge amounts of data that must be analyzed. 2

4 FMI/GMA Trading Partner Alliance On-Shelf Availability (OSA) Study The OSA study was led by key retail and manufacturing executives from FMI/GMA Trading Partner Alliance member companies and the survey responses came from a wide selection of leading manufacturers and retailers. Survey questions were directed specifically to retailers or manufacturers to better understand each side s issues and as a means to compare and contrast the two sides approach to the problem. This was significant in identifying the gaps discussed in this report. This report summarizes the findings of the survey around the four key gaps that must be overcome to reach OSA maturity. These are: metrics/data; process/practice; organizational issues; and technology. The report also provides Good-Better-Best recommendations under these same four topic areas. The Metrics/Data Gap: Agreeing on the Facts While a rose by any other name may smell as sweet, the fact that manufacturers and retailers can t agree on the basic definition of an outof-stock is not so sweet. The industry needs a common definition of terminology and metrics before the metrics/data gaps in OSA can be addressed systematically. (See sidebar) As shown in Figure 2, for instance, 59 percent of manufacturers said they based their out-ofstock calculations on retailer-provided POS data, while another 28 percent said it is based on other retailer-provided metrics. But 40 percent of all manufacturers, and 80 percent of those using retailer-provided metrics (based on a follow-on question), said those metrics vary by retailer, making standardization across the industry problematic. Figure 2 MANUFACTURERS OSA MEASUREMENTS Varies by Retailers Retailer Metrics POS Data Physical Audits 0% 20% 40% 60% 80% 3

5 FMI/GMA Trading Partner Alliance Recommended OSA Definition Consistent with the Alliance s Good-Better- Best approach to moving the industry toward standardization and best practices, the Alliance has created the following definition of OSA that companies should adopt to begin to bring a level of standardization to the OSA process. This will help retailers and manufacturers to better communicate, collaborate and integrate to reach the OSA goals. At a minimum the Alliance recommends the industry move to Zero on Hand, as the new on shelf availability metric baseline. Retailers with CAO/CGO should be able to calculate this systematically. Retailers that do not have a CAO/ CGO system can still participate as long as there is a daily Store practice to determine out-ofstocks on-shelf. GOOD: Zero On Hand Number of instances when an authorized item s perpetual inventory fell to zero or below / total store item combinations. BETTER: Lost Demand When the perpetual inventory snapshot occurs and there is zero on hand, it triggers the system to determine what the item would have moved utilizing CAO/CGO forecasted movement. Lost Sales Turns the anticipated lost demand into dollars (Lost Demand * Retail Price) Below Minimum Presentation Minimum presentation is the minimum amount of units that the retailer will accept for merchandising an item on-shelf. With this method Minimum Presentation is the hypothetical zero and anything below that agreed upon threshold is considered a failure/ out. Leverage store technology or work process to understand inventory location (back room vs. shelf) in determining OSA and implementing proactive work processes/alerts to minimize OSA issues. Consider item profitability in the OSA analysis, as higher profit items may impact range of countermeasures or mitigating actions. Consider shopper equity data and substitution patterns in stratifying SKUs on service level goals as well as to plan for SKU forecast volatility due to switching. In the three strikes model, the first time shoppers are faced with OOS, they will substitute another item 70 percent of time when faced with OOS. But many departments and SKUs have much higher loyalty, where the shopper wants exactly what they want (i.e.- personal needs, baby, pet food). The following example illustrates how these three levels impact results. EXAMPLE WORKING ASSUMPTIONS Items are authorized in 100 Stores Stores have comparable daily item movement for simplicity Perpetual inventory is accurate in all 100 Stores Zero on hand in 2 stores Below minimum presentation in 3 stores Items Forecasted Movement Min Presentation Sales $ per unit Item A $5.00 Item B 10 6 $6.00 Item C 1 3 $10.00 BEST IN CLASS & FUTURE CONSIDERATIONS: Utilize forecasted movement (POS) and DCto-store delivery schedules to proactively determine potential out-of-stocks (OOS) before they happen. Consider promoted vs. non- promoted items in the analysis, given additional forecast volatility in promoted SKUs. OSA Methods Zero On Hand Item A 98% Item B 98% Lost Demand/ Sales 60 Units/ $ Units/ $120 Below Min Presentation 95% 95% Item C 98% 2 Units/ $20 95% 4

6 Meanwhile, 86 percent of retailers still measure out-of-stocks by physical audits at the shelf in-store, among other methods, a slow, manual process which is not sustainable in today s fastmoving retail environment, and is not conducive to the agile, collaborative planning processes the market now requires. Greater use of Zero on hand is recommended by the Alliance going forward. Figure 3 RETAILERS OSA MEASUREMENTS Shelf Audit Zero on hand Zero on hand, triggers Minimum display 0% 20% 40% 60% 80% 100% Clearly, the lack of a standard definition of what constitutes an out-of-stock is the first stumbling block for attacking this problem. See the OSA definition sidebar for the Alliance s proposal for standardization of this important metric. There is also the issue of the completeness of data measurement. As Figure 4 shows, only about 9 percent of manufacturers measure OSA for more than 75 percent of their volume. More telling is that over 29 percent of the manufacturers measure 25 percent or less of their volume. And in answer to a separate question, 24 percent of manufacturers say they don t measure OSA at all. This data suggests two things: first, that the lack of standardization, and thus trust in the data, has led manufacturers to put less emphasis on OSA issues than their retail counterparts; and second, that manufacturers are therefore currently tracking OSA for only a few of their largest customers. But this lack of complete and reliable tracking of OSA data is a limiting factor in solving the broader OSA problem. Figure 4 PERCENTAGE OF MANUFACTURERS CUSTOMER VOLUME WHERE OSA IS TRACKED 75+% 50-75% 25-49% 0-25% 0% 10% 20% 30% 40% Therefore, not only is there currently a lack of agreement on the definition of the OSA problem, there also seems to be a lack of urgency in approaching the issue in a more comprehensive manner. This will have to be overcome if the industry as a whole is to successfully solve the OSA problem and reap the resulting substantial rewards. 5

7 Making Effective Use the Data Another stumbling block for manufacturers and retailers effectively collaborating on OSA is the sheer size and variability of the data sets being communicated to suppliers. The survey suggests this may be an issue since both groups fall back on using traditional in-house DC shipment data for forecasting even when more accurate POS data is available and shared. To start with, 17 percent of retailers say they don t share POS data with their suppliers at all. But even though 83 percent do share this data, only 57 percent of manufacturers say they are able to use this data in their demand and production forecasts. Anecdotal evidence suggests that the disparity in data formats provided by retailers increases the complexity for suppliers trying to integrate this data into their planning processes. Add to this the tremendous volumes involved in item within store-level POS data being share and the magnitude of the challenge facing suppliers starts to become obvious. Top 10 Reasons Why Retailers Should Share POS Data with Suppliers 10. Your mother always taught you to share your things 9. It s what friends and partners should do 8. It builds trust and strengthens partnerships 7. It helps suppliers better meet retailers needs 6. It helps suppliers quickly adjust to new product introduction sales trends 5. It helps suppliers better understand promotion effectiveness 4. It helps suppliers understand local demand patterns 3. It helps suppliers better understand the effects of seasonality by region 2. It enables retailers and manufacturers to more effectively collaborate on OSA 1. You can t effectively solve the OSA problem without accurate, timely POS data This data volume issue may also be a legacy of the limitations of the demand forecasting technology manufacturers have traditionally used which does not have the scalability to handle the huge volume of SKU-level store POS data. In addition, when measuring forecast accuracy, 100 percent of manufacturing respondents said they base their measurement on their own shipments to retailers, further suggesting manufacturers are struggling to effectively use retailer provided data. Surprisingly, given retailers have access to their POS data, 75 percent of retailers also use aggregated shipment data from their DCs rather than their own POS data as the demand signal for their automated forecasting and replenishment systems perhaps also a volume and technology limitation issue. Another factor the survey results demonstrate is that retailers and manufacturers continue to work in silos. Each has their own language, their own data and their own ways of doing things that have been built up over decades of doing business as separate entities. Therefore, sharing POS data, while well intentioned, is only a first step in this difficult process of getting everyone on the same page. That is why collaborative efforts people talking to people and working out differences will be critical to establish standards for data sharing and the associated communication processes. Thus, simply sharing data between retailers and manufacturers will not be enough to solve the OSA problem until all partners agree on data standards, communication formats and timing so they can put the data to use to agilely adjust production, distribution, replenishment and merchandising plans down to the shelf level. 6

8 The Process/Practice Gap: Synchronizing Efforts Analyzing the data from the survey uncovered several areas where current processes are counterproductive to solving the OSA problem. These processing gaps include internal operational issues, timing issues between retailers and manufacturers, and other synchronization issues across the supply chain. The basic building block of OSA is visibility to what inventory is actually in each store at any point in time. Often referred to as a perpetual inventory process, this inventory visibility is the foundation of an effective computer-aided ordering (CAO) system (sometimes also called computer generated ordering or CGO). Retailers cannot hope to effectively solve the OSA problem without a perpetual inventory process and CAO in place. However, having a CAO solution in place does not necessarily mean a retailer has either enterprise-wide visibility to in-store inventory or that internal policies and practices support an accurate perpetual inventory process. For example, although half of the retailers report using some form of CAO, most of those that do use CAO allow stores to override or influence the CAO order. While there are legitimate reasons to allow store overrides, such as local weather emergencies or special local events, the fact that 40 percent also allow stores to override CAO system settings suggests that there is a lack of standardization across the enterprise, making it very difficult to implement effective corporate OSA programs. By extension, if corporate OSA programs are not effective, collaboration with suppliers will be severely hampered. This is not to say that CAO overrides are necessarily bad. Anecdotal evidence from Alliance members suggests overrides of up to five percent of store items are normal. The reasons for these overrides include variations in local demand, adjustments for shrinkage or spoilage, and other non-predictable in-store occurrences. However, the bigger fear is that CAO overrides are the result of poor in-store practices. For example, not training, and enforcing, that cashiers must scan all items at checkout rather than scanning the first item and hitting the quantity button for items that are not, in fact, identical. Or taking items from store shelves to use in other departments, such as the deli, bakery or prepared foods, without recording inventory adjustments. Or failing to properly scan or record all items in replenishment shipments. Without accurate accounting of all inventory in the store, perpetual inventory counts are inaccurate and CAO effectiveness will be impaired. A complicating factor for the use of CAO/CGO is that neither demand nor merchandising plans are constants. While a certain baseline of products exhibit fairly smooth demand and sales numbers, and are therefore easy to forecast and generate orders for, demand for other products is more volatile. Promotions, special events, new product introductions and unforeseen events such as snowstorms or natural disasters can all significantly impact demand and/or supply. Procedures for adjusting CAO/CGO must therefore be part of the overall OSA plan. Ultimately, the goal is to improve the CAO process to the point that overrides are not necessary. 7
 system (sometimes also called computer generated ordering")
9 Timing is Everything Another obvious process gap shown in the survey results is the timing on event forecasting. Although 79 percent of retailers say they include vendors in their event forecast planning process, a mismatch in timing may be undoing these good intentions. As shown in Figure 5, for example, 50 percent of retailers lock down their event forecasts, and can thus provide meaningful forecasts to their vendors, only 2-4 weeks before an event, with an additional eight percent locking the forecast down less than two weeks prior to the event. Figure 5 RETAILER LOCKDOWN TIMING ON EVENT FORECASTS 5-8 weeks 2-4 weeks <2 weeks Retailers 0% 20% 40% 60% In contrast, manufacturers generally need more time to properly plan production and deployment than what retailers are providing. As figure 6 shows, a change to a distribution plan requiring additional amounts typically covered by safety stock, or where it is just a matter of redirecting existing inventory, is the only area where manufacturers timelines seem likely to accommodate retailers four week or less forecast lockdown schedule. However, if the forecast deviation requires additional production, the need to order more raw materials or changes to special display plans, most manufacturers need more time, and in some cases significantly more time, to react. Thus, if manufacturers need more time than the retailers are giving them to produce the goods retailers are forecasting for events, out-of-stock conditions are inevitable. (see the Forecast Timing sidebar for more on this issue) Figure 6 MANUFACTURER LEAD TIME REQUIREMENTS FOR SIGNIFICANT (>25%) CHANGES TO RETAILER PLANS Displays Materials 9+ weeks 5-8 weeks 1-4 weeks Production Distribution 0% 50% 100% 8

10 However, the problem goes beyond lockdown timing. For whatever reasons, the majority of retailers make changes to their forecasts after the lockdown date. As shown in figure 7, a whopping 92 percent of respondents reported making changes to their forecasts of three percent or greater after lockdown, with 25 percent saying they make these changes over 20 percent of the time. Forecast Timing The survey data shows an obvious mismatch between the timing of when retailers say the generally provide event forecasts to manufacturers and the amount of time manufacturers say they need for production and deployment planning and execution. Overall, 58 percent of retailers provide these forecasts four weeks or less before the event kick-off date. Manufacturers, however, generally need four to eight weeks of foreknowledge of retailer requirements in order to provide the merchandise. This gap is an excellent candidate for collaboration. The Alliance has two recommendations that should help overcome this timing issue. First, eliminate the concept of an event lockdown date. Since 92 percent of retailers admit they make some degree of changes after this date anyway, its usefulness is questionable. Second, to replace this concept, retailers and manufacturers should begin collaborating on forecasts early in the event planning process and continue to adjust plans as warranted throughout the planning and execution of the event. As part of the event planning collaboration, participants should not be locked into a number for the forecast, but rather, should be developing a range of expected demand. This will allow joint creation of appropriate high-side and low-side contingency plans that cushion the impact of variance in demand. By focusing on demand forecasting as a process rather than a date and as a range rather than a number, the timing issue can be narrowed, if not eliminated, and contingency plans can help reduce the impact of any variations. Clearly, event forecasting is one area where retailers and manufacturers can make significant progress on OSA through better collaboration. As a starting point, the FMI/GMA Trading Partner Alliance recommends that manufacturers and retailers collaborate on high-side and low-side contingency planning as a first step in resolving the issues caused by the event forecast timing mismatch. (See sidebar on Forecast Timing) Under this process, retailers and manufacturers would agree on a single demand forecast along with a range of demand uplift for each event or promotion rather than work to a single number. The range would be based on a joint list of assumptions and potential risks, and would include what reactions each party will take if the variance to plan occurs. For example, if a promotion creates significantly greater demand than anticipated, the high side contingency may be that the manufacturer agrees to provide addition inventory in a specified timeframe and the retailer agrees to accept full case shipments rather than shelf-ready displays. Unfortunately, no respondents indicated they have such a program in place today. Instead, manufacturers either allocated extra inventory over forecast only to strategic customers (with potential impact spread among other customers) or allocated extra inventory only if it would not impact other customers. Neither alternative gets at the root of the problem. By collaborating on a high-side and lowside contingency plans early in the process, manufacturers can adjust production plans and work with their materials suppliers to ensure sufficient inventory will be available to cover forecast variations and changes after lockdown while retailers are flexible in how the additional inventory may be delivered or priced. 9

11 Figure 7 HOW OFTEN RETAILERS MAKE CHANGES TO FORECASTS AFTER THE LOCKDOWN DATE Retailers <2% 3-10% 11-20% >20% 0% 50% 100% The Organizational Gap: Owning Change Once you get past the data sharing and process issues, the next question is whether there is organizational readiness to support OSA initiatives. On the manufacturing side, the fact that 24 percent do not even track OSA, and on the retail side, the fact that 17 percent don t share POS data with suppliers, suggests there may be resistance. Even among those companies that track OSA, there seems to be a lack of commitment across their organizations and supply chains. For example, although 71 percent of manufacturers say OSA is a top business priority, only 53 percent say it is a key focus for their end-to-end supply chains, and that number drops further to 43 percent who say it is a focus area or metric for measuring their sales force. Since OSA is a total supply chain issue, not simply a manufacturing or retail issue, all parties must be involved in the solution. Not only will this require collaboration up and down the supply chain, it will also require a commitment to change from the people inside each organization. But just who those people are is uncertain. Survey responses from both retailers and manufacturers indicate there are no clear owners of the inventory or forecast decisions. An equal number of retail respondents said Supply Chain Planning owned inventory as those who said Category or Buyers did, and almost as many said Merchandising owns it. And since respondents were allowed to select more than one answer, the total of responses was approximately 150 percent, indicating even within one retailer more than one group often has ownership of inventory. Without clear ownership, and thus responsibility, for managing inventory levels and developing forecasts, there is no accountability for results. This organization alignment issue will be one step in helping to improve OSA. 10

12 Figure 8 WHO OWNS RETAIL INVENTORY SC Planning Merchandising Category/Buyers Dist/Trans Stores 0% 15% 30% 45% 60% These ownership issues cause several problems for effective OSA programs. First, the variance in which department owns the inventory makes it hard for manufacturers to know who they should be dealing with from retailer to retailer in setting up collaborative OSA processes. Interesting, although only nine percent of retailers say their stores have ownership of the inventory, and less than eight percent say stores are responsible for event forecasts, the majority of retailers allow stores to override CAO forecasts, a potential accountability issue. Second, for those retailers where there is more than one owner of inventory, effectively there is no owner, and thus, no accountability. Without accountability, there is little incentive to improve OSA, so implementing effective programs is unlikely. These issues spill over into the forecasting process. Who s in the Driver s Seat? While there has been much written about who is driving the relationship the brand manufacturer or the retailer, and whether that has changed over the years the real issue might be who is setting the forecasts on which OSA depends. For instance, according to the survey, 79 percent of retail respondents say that they forecast event demand collaboratively with their suppliers, while only 63 percent of manufacturers say that s how they perceive it is done. Similarly, 85 percent of retailers say that internally their category managers/ buyers are responsible for the event forecast, but only 30 percent of manufacturers perceive this to be the case. In contrast, 60 percent of manufacturers think that their sales or supply chain reps are responsible. If there is no agreement on who is responsible for the forecast, or whether the parties are even collaborating or not, how can effective programs be put in place to address the many issues impacting OSA? In this light, it is not surprising that less than 13 percent of manufacturers said they were Very Satisfied with the accuracy of the forecasts and could use them for direct adjustments to their production or deployment plans. Furthermore, when manufacturers were asked what they do when faced with forecasts from the retailer different from their own, less than 19 percent say they collaborate with the retailer to reconcile the differences, as opposed to 79 percent who said they primarily use their own forecast. This also harps back to the issue of trust in the data. Thus, part of the cultural change needed to facilitate the collaboration that will drive improvement in OSA involves decisions on 11

13 ownership, roles and who makes decisions regarding the many issues impacting OSA. There must be clear roles and accountability within organizations as well as open communication of those roles and responsibilities between the trading partners. Without these well understood guidelines, establishing effective OSA processes and programs will be unlikely, nor will they be sustainable even if put in place. The Technology Gap: Is Automated Collaboration Possible? The survey data implies several gaps in the technology used by retailers and manufacturers in the critical steps of forecasting demand and subsequent planning for OSA. As noted earlier, although 79 percent of retailers say they share POS data with their suppliers, few manufacturers or retailers seem to be using this data in their forecasting and planning processes. There is no question that the potential data volumes involved in the use of store level POS data are huge. In the past, this volume prohibited many forecasting and replenishment systems from using the more accurate storelevel POS data. Recent advancements in technology have removed that limitation. However, even if the technology is in place to address the large volume of data to produce accurate SKU-level forecasts by store or store cluster, the question remains of whether it will get used. As mentioned earlier, there are data format and communication issues that hinder the use of the POS data sets as well. The industry must work to standardize what, when and how it shares data, the communication processes and protocols used, and how that information will be put to use for agreed upon forecasts. This points out a larger problem the silos that exist in many companies, and between trading partners, that prevent effective data sharing and usage. These silos are often organizational, but can also be due to technology. As a result, each department and each company creates their own forecast with their own built-in assumptions and perceived risks, creating an ever-increasing bullwhip effect that multiplies forecast error. Why not use one shared forecast and let all other calculations flow from there? Integration of in-house systems to use a single set of available data in a timely way is the first technology building block for solving the OSA problem. The more difficult issue to overcome is the lack of standardization and integration between trading partner technologies. This disconnect will render OSA efforts moot unless retailer and manufacturing partners develop a collaborative process, and the necessary systems interfaces, to share a single POS-based forecast (a single version of the truth) and base all subsequent supply chain calculations off of that one forecast. This is foundational to developing One Supply Chain. 12

14 The Good-Better-Best Framework for Solving the OSA Problem Given all of the challenges discussed in this report and the data, process, organization and technology gaps defined by this research study, it should be clear that there is no easy solution to the OSA problem facing retailers and manufacturers. The FMI/GMA Trading Partner Alliance recognizes this fact and has created a Good-Better-Best (GBB) framework for addressing the issues and challenges incrementally, as well as some recommendations for an improved future state of collaboration and OSA mastery. The GBB framework focuses on a step-bystep approach for closing the data, process, organization and technology gaps identified. The framework provides target actions for improving metric/data quality and sharing, organizational improvement, and process/practice standardization supported by POS integrated forecasting and replenishment. The framework is represented by the Effectiveness Pyramid shown in figure 9. The ultimate goal is to arrive at a fully collaborative state where joint business planning (JBP) can be done interactively between trading partners so that the relationship is really supporting One Supply Chain. Figure 9 THE OSA EFFECTIVENESS PYRAMID JBP POS Integrated Forecasting & Replenishment Store Order Forecast POS Sharing Store Replenishment/CAO Standards, Metric/Data & Process/Practice 13

15 Good-Better-Best Metrics/Data The foundation of the OSA Effectiveness Pyramid, and the starting point for companies looking to improve their OSA performance, is standardizing their metrics and data. At a minimum, this will require retailers to implement a perpetual inventory program to provide accurate visibility to inventory at each store and across the enterprise. This accurate inventory visibility must be combined with an agreed upon standard definition between trading partners of what constitutes an out-of-stock condition. The FMI/GMA Trading Partner Alliance recommends that the industry move to Zero on Hand as the new OSA metric baseline. Retailers with CAO/CGO capability should be able to calculate this systematically. Retailers that do not have a CAO/ CGO system can still participate as long as there is a daily store practice to determine out-of-stocks. If you are using and sharing OSA methods, be clear as to which method(s) you are using or sharing to support apples-to-apples peer comparisons. Next, determine where you are currently versus where you want to be for OSA metrics. Leverage the hierarchy of the Good- Better- Best framework to help you and the industry eventually achieve the desired future state. Figure 10 GOOD-BETTER-BEST METRICS/DATA Good-Better-Best Process/Practice Best practice processes will need to be developed and implemented both internally and between trading partners in order for data to be shared securely and in a timely manner, as well as to ensure collaborative processes are in place to affect OSA outcomes. It starts with getting your internal house in order through initiating standard operating procedures for OSA within the stores. This will include proper training for cashiers, stocking personnel, and everyone else that handles, uses or otherwise deals with inventory. Next there will have to be an evaluation of the CAO processes do you have a CAO/CGO process and system in place; how and why will 14

16 overrides be used; and what is the impact on actual orders and OSA? Consider running a pilot study in a few stores covering a selected category and set of products to work out details and evaluate the impact of changes. As you are getting your own house is in order, start to engage suppliers for collaborative ways to use POS data, integrate technology and leverage consumer insights for better forecasting. Consider initiating a joint high side contingency planning process, as discussed earlier, as a first step in breaking down the silos and begin working from a single, shared forecast. Again, pilot programs with limited participants and objectives can help to smooth the way for wider adoption of OSA programs later on. Remember, this is a journey, not a quick fix. But over time, participants should see substantial revenue lift and cost savings from performing as One Supply Chain. Figure 11 GOOD-BETTER-BEST PROCESS/PRACTICE Good-Better-Best Organizational Improvement As with the process area, organizational improvements must start internally. Initiating an integrated business planning process is one way to start breaking down the internal silos and get people and departments talking and planning together. But rewards and incentives must also be aligned. Too many corporate strategies get blindsided by incentive programs that reward staff for goals within the silos that are counterproductive to the organization as a whole. Aligning incentive compensation is critical for OSA program success. The lack of alignment between OSA strategies and rewards was evident in the survey results. Although 71 percent of manufacturers say OSA is a top business priority, only nine percent include OSA as a factor in incentives or rewards. Given the current very primitive state of crossorganizational and trading partner collaboration on OSA, this low percentage is to be expected since too many factors are currently beyond 15

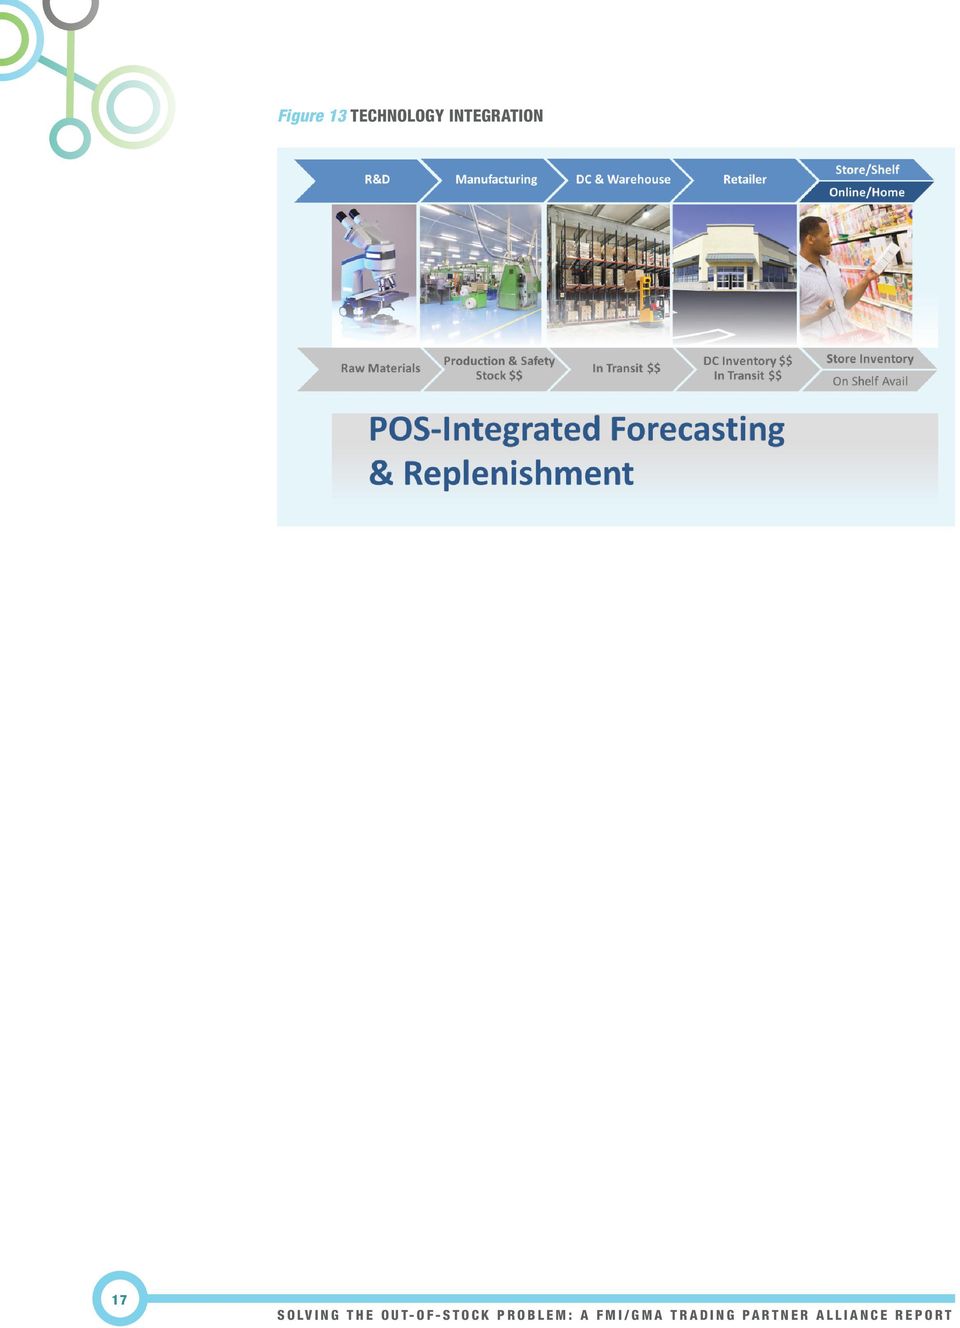
17 the control of individuals or departments. Still, one of the goals of implementing an effective and collaborative OSA program should be to eventually get better alignment between OSA effectiveness and related incentives. This should be extended to trading partner incentives as the program matures. Figure 12 GOOD-BETTER-BEST ORGANIZATIONAL IMPROVEMENT Technology Integration We live in an integrated world today. The Internet made that possible; omni-channel retail is making it an everyday imperative. The old siloed ways of doing business cannot hope to support this new paradigm. Likewise, the technology we use to support this integrated world can no longer live in silos. Technology must be integrated across departments and functions internally, and must be integrated to trading partners technology. As figure 13 depicts, from raw materials to the shelf is all one integrated process, and the technology that supports this process must function as one. Continuing on the Good-Better-Best theme, there is no need to attempt this all at once. Start by integrating internal systems so there is visibility to store-level inventory and sales across the enterprise. Use store-level POS data as the driver for forecasting demand. Integrate this demand data, along with seasonality, new product introductions and promotions, into replenishment planning. Integrate replenishment plans with DC and store inventory distribution and execution plans so that you realize the benefits of your efforts. As internal systems are being integrated, work with trading partners to integrate inter-company processes and systems. The goal should be to have a single POS-driven forecast driving all production, materials, distribution and replenishment calculations. The concept is to never forecast what you can calculate so you eliminate forecast error and the bullwhip effect. This will be the basis of the One Supply Chain model (see Figure 14) the Alliance recommends as the ultimate solution for OSA going forward. 16

18 Figure 13 TECHNOLOGY INTEGRATION 17
19 Insights to Action Information and insights have little value unless they are used to spur meaningful action. Thus, the Alliance is using the insights gained from this study together with their previous work to create specific action steps for companies to take to address the OSA challenge. This begins with One Supply Chain. One Supply Chain For at least a decade now supply chain professionals have understood that in today s global, hyper-connected world it is no longer my company against your company it is my supply chain against your supply chain. No retailer or manufacturer by themselves can solve the persistent out-of-stock problem that is costing businesses billions of dollars each year. All members of the supply chain must work together collaboratively if on-shelf availability is to improve. The FMI/GMA Trading Partner Alliance has worked hard over the past 18 months to lay the groundwork for this collaboration. The survey on which this report is based demonstrates that manufacturers and retailers are generally in agreement with the gaps and solutions the Alliance presented at the 2014 Supply Chain Conference. Figure 14 ONE SUPPLY CHAIN The result of the Alliance s work and the survey is a maturity model that can incrementally move companies and the industry toward a more collaborative approach to OSA which the Alliance has dubbed One Supply Chain. As figure 14 shows, there are many moving parts to One Supply Chain processes carried out by multiple players. But if all participants 18

20 collaborate on a shared view of POS data and inventory for a single definition of demand at the store level, and base all subsequent supply chain calculations from that single forecast, OSA will inevitably be significantly improved to the benefit of all. Therefore, the Alliance strongly recommends that all FMI/GMA member companies and their trading partners adopt the One Supply Chain approach for OSA excellence. Insights to Action The Way Forward The Alliance has identified four next steps the industry should take to move toward more collaborative and successful OSA process. These are: Adopt a Zero on hand baseline definition of OSA to facilitate better communication and standardization for data exchange Agreement between retailers and suppliers on what demand signal is used for event forecasting Collaboration between retailers and suppliers to better align timing between issuance of event forecasts and production scheduling requirements As with all business processes, improving on-shelf availability is an on-going journey, not a destination. This report and the Alliance s presentation at the 2015 FMI/GMA Supply Chain Conference conclude Phase 2 of the Alliance s Charter and set the stage for Phase 3, which is to formulate and help the industry to execute a five-year plan to bring OSA to 98 percent. To learn more and become part of this important journey, contact your FMI or GMA representative. FMI: Pat Walsh pwalsh@fmi.org GMA: Daniel Triot dtriot@gmaonline.org Collaboration on high-side and low-side range contingency plans for events 19

21 Appendix The FMI/GMA Trading Partner Alliance OSA Sub-Committee includes representatives from the following companies: Food Marketing Institute Grocery Manufacturers Association Clorox Delhaize GENCO HEB Inmar JDA Software McCormick Meijer Mondele z International Nestlé USA Procter & Gamble Walgreens There were a total of 77 retail and manufacturer/distributor respondents to the survey. 20
The Business Case for Investing in Retail Data Analytics
 The Business Case for Investing in Retail Data Analytics Why product manufacturers are investing in POS and inventory analytics solutions Introduction In the latest Shared Data Study from CGT and RIS News
Planning & Allocation vs. Replenishment: When is Each the Best Strategy?
 Planning & Allocation vs. Replenishment: When is Each the Best Strategy? As a full line retailer, you carry many types of products to meet your customers needs. Everything from fashion softlines to commodity
Delivering new insights and value to consumer products companies through big data
 IBM Software White Paper Consumer Products Delivering new insights and value to consumer products companies through big data 2 Delivering new insights and value to consumer products companies through big
FULFILLING EXPECTATIONS: THE HEART OF OMNICHANNEL RETAILING
 FULFILLING EXPECTATIONS: THE HEART OF OMNICHANNEL RETAILING Creating the supply chain visibility, accuracy, control and flexibility retailers need to meet the demanding fulfillment expectations of the
SOLUTION OVERVIEW SAS MERCHANDISE INTELLIGENCE. Make the right decisions through every stage of the merchandise life cycle
 SOLUTION OVERVIEW SAS MERCHANDISE INTELLIGENCE Make the right decisions through every stage of the merchandise life cycle Deliver profitable returns and rewarding customer experiences Challenges Critical
The Transformation to Demand-Driven Industry Leader. An Oracle White Paper Updated September 2006
 The Transformation to Demand-Driven Industry Leader An Oracle White Paper Updated September 2006 The Transformation to Demand-Driven Industry Leader Demand-driven companies have five best practices in
Meeting the Omni-Channel Challenge with In-Store Fulfillment for Retailers
 Meeting the Omni-Channel Challenge with In-Store Fulfillment for Retailers ABOUT THE AUTHOR CHUCK FUERST DIRECTOR OF PRODUCT STRATEGY Chuck Fuerst is the director of product strategy at HighJump. He has
Make your supply chain more efficient by using GS1 Global Standards
 IBM Global Business Services Executive Brief In collaboration with the Consumer Goods Forum Make your supply chain more efficient by using GS1 Global Standards Findings of the 2011 Consumer Goods Forum
GETTING AVAILABILITY RIGHT
 GETTING AVAILABILITY RIGHT BRINGING OUT OF STOCKS UNDER CONTROL Keeping products on the shelves and available to customers is a vital part of the retail business. Increasing inventory or in-store labour
Supply Chain Best Practice: Demand Planning Using Point-of-Sale Data. An Oracle White Paper Updated October 2006
 Supply Chain Best Practice: Demand Planning Using Point-of-Sale Data An Oracle White Paper Updated October 2006 Supply Chain Best Practice: Demand Planning Using Point-of-Sale Data Multiple forecasts based
White paper. Gerhard Hausruckinger. Approaches to measuring on-shelf availability at the point of sale
 White paper Gerhard Hausruckinger Approaches to measuring on-shelf availability at the point of sale Contents The goal: to raise productivity The precondition: using the OOS index to record out-of-stock
Best Practices for Managing Seasonal Items Vermont Information Processing, Inc.
 Best Practices for Managing Seasonal Items Vermont Information Processing, Inc. 402 Watertower Circle Colchester, VT 05446 802 655 9400 Fax: 802 655 1313 www.vtinfo.com Best Practices for Managing Seasonal
RETAIL INDUSTRY INSIGHTS. Maximising Inventory Efficiency
 RETAIL INDUSTRY INSIGHTS Maximising Inventory Efficiency Retail Operational Excellence There is nothing like a recession to focus the mind on releasing cash by reducing inventory. Kurt Salmon analysis
Executive summary... 3 Overview of S&OP and financial planning processes... 4 An in-depth discussion... 5
 Table of contents Executive summary... 3 Overview of S&OP and financial planning processes... 4 An in-depth discussion... 5 What are the benefits of S&OP and financial planning integration?... 5 Why is
Multi-channel Retailing Goes Mainstream
 Multi-channel Retailing Goes Mainstream Ashish Jandial, Patrick Ogawa and Preetha Sekharan Abstract Increasingly, retailers are turning towards multi-channel retailing to grow their market share and present
Is the time right for perpetual inventory?
 WHITE PAPER Is the time right for perpetual inventory? Does perpetual inventory in your mind seem a lot like dating a movie star nice dream, but hardly reality? With tens of thousands of items in each
Retail Out-of-Stock Management:
 Retail Out-of-Stock Management: An Outcome-Based Approach Your customers get what they want, when they want and wherever they want www.wipro.com Rajat Kaul Table of Contents 03... Abstract 03... The Retail
Aspen Collaborative Demand Manager
 A world-class enterprise solution for forecasting market demand Aspen Collaborative Demand Manager combines historical and real-time data to generate the most accurate forecasts and manage these forecasts
Getting the Intelligence to Build Demand-Driven Supply Networks
 Getting the Intelligence to Build Demand-Driven Supply Networks Introduction Building an effective Demand-Driven Supply Network (DDSN) presents an ongoing challenge. Most companies remain in the early
What options exist for multi-echelon forecasting and replenishment?
 Synchronization of Stores and Warehouses: Closing the Profit Gap Successful retailers focus their efforts on the customer and the unique attributes of each store in the chain. Tailoring assortments, promotions
How To Be Successful In An Omni Channel World
 Global Retail & Consumer Goods CEO Survey: The Omni-Channel Fulfillment Imperative PwC CEO survey finds rising confidence in revenue growth in 2015, but only 19% of top retailers say they can fulfill omni-channel
The Economic Benefits of Multi-echelon Inventory Optimization
 SOLUTION PERSPECTIVES: Leveraging Multi-echelon Replenishment to Maximize Return on Inventory Investment The Economic Benefits of Multi-echelon Inventory Optimization Lower working capital requirements,
Omnichannel Inventory Optimization: Where Are My Products?
 Going Glocal Executive Summary 1 retail consulting and industry thought leadership Omnichannel Inventory Optimization: Where Are My Products? Where Are My Products? 2 Macy s best customers are those who
THE ESSENTIAL GUIDE TO IMPLEMENTING VENDOR PERFORMANCE METRICS in your Import Supply Chain
 THE ESSENTIAL GUIDE TO IMPLEMENTING VENDOR PERFORMANCE METRICS in your Import Supply Chain Published on April 25, 2014 INTRODUCTION Importers strive to design their overall program to efficiently control
Supply Chains: From Inside-Out to Outside-In
 Supply Chains: From Inside-Out to Outside-In Table of Contents Big Data and the Supply Chains of the Process Industries The Inter-Enterprise System of Record Inside-Out vs. Outside-In Supply Chain How
Increasing Demand Insight and Forecast Accuracy with Demand Sensing and Shaping. Ganesh Wadawadigi, Ph.D. VP, Supply Chain Solutions, SAP
 Increasing Demand Insight and Forecast Accuracy with Demand Sensing and Shaping Ganesh Wadawadigi, Ph.D. VP, Supply Chain Solutions, SAP Legal disclaimer The information in this presentation is confidential
The Massive Prof it Impact Of Vendor Performance Improvement
 The Massive Prof it Impact Of Vendor Performance Improvement The relationship between vendor performance and retail profits is inextricable, and improving it yields big wins for both parties. A white paper
Improve the Agility of Demand-Driven Supply Networks
 GE Intelligent Platforms Improve the Agility of Demand-Driven Supply Networks Leverage real-time production data to optimize the supply chain for a sustainable competitive advantage Improve the Agility
Assessing Your Business Analytics Initiatives
 Assessing Your Business Analytics Initiatives Eight Metrics That Matter WHITE PAPER SAS White Paper Table of Contents Introduction.... 1 The Metrics... 1 Business Analytics Benchmark Study.... 3 Overall
Supply & Demand Management
 Supply & Demand Management Planning and Executing Across the Entire Supply Chain Strategic Planning Demand Management Replenishment/Order Optimization Collaboration/ Reporting & Analytics Network Optimization
Is it Time to Purchase a Fashion Enterprise Solution?
 Is it Time to Purchase a Fashion Enterprise Solution? Determining whether to replace an ERP, PLM or other system is a major decision for any apparel and fashion business. Fortunately, recent technology
CASE STUDY. Barber Foods. Successful Trade Promotion Optimization Strategy Improves Retail Effectiveness. Challenge. Solution.
 CASE STUDY Barber Foods Successful Trade Promotion Optimization Strategy Improves Retail Effectiveness Challenge Faced with escalating trade promotion costs and spend rates exceeding industry averages,
Accenture Perfect CPG Analytics. End-to-end analytics services for fact-based business decisions and high-performing execution
 Accenture Perfect CPG Analytics End-to-end analytics services for fact-based business decisions and high-performing execution Moving from insights to action at speed Consumer Packaged Goods (CPG) companies
front line A telling fortune Supply chain demand management is where forecasting meets lean methods by john t. mentzer 42 Industrial Engineer
 front line A telling fortune Supply chain demand management is where forecasting meets lean methods by john t. mentzer 42 Industrial Engineer A company thought it had a forecasting problem. Many of its
The Value of Connecting Supply Data to Demand
 The Value of Connecting Supply Data to Demand Companies achieve over 10% sales lift by connecting supply chain data to demand when launching new products. Changing the Product Launch Conversation Companies
A Guide to Implementing a World-Class Cycle Counting Program
 A Guide to Implementing a World-Class Cycle Counting Program - Page 1 A Guide to Implementing a World-Class Cycle Counting Program By Jeff Rose, Principal The implementation of comprehensive cycle counting
Understanding the Real Impact of Social Media Monitoring on the Value Chain
 March 2013 Understanding the Real Impact of Social Media Monitoring on the Value Chain More and more companies have turned to social media monitoring or social listening tools to find the critical insights
How To Be Successful In A Cross Channel Retailing
 Foreword Retail industry is currently going through a once-in-a-generation transformation, primarily driven by more evolved shoppers and technological innovations. This has resulted in a structural shift
Oracle Retail. AAFES Retail Management System
 Oracle Retail AAFES Retail Management System Oracle Retail Merchandising Suite Oracle Retail for AAFES Corporate Changes Summary of Benefits Discussions WHY ORACLE RETAIL SUITE? OUTDATED PROCESSES UPDATED
Creating and Embedding a Customer Driven Supply Chain
 To get there. Together. Creating and Embedding a Customer Driven Supply Chain Point of view Contents Creating and Embedding a Customer Driven Supply Chain 3 How to Embed a Customer Driven Supply Chain
Increase Customer Centrastity and Save Your Business From Service Interruption
 Your network as a retail performance driver in an omni-channel world RETAIL OVERVIEW Deliver Engaging Shopping Experiences & Maximize your Business Efficiency Any slowdown or service interruption can be
Capitalizing on Change
 White paper Capitalizing on Change Capitalizing on Change One Network Enterprises www.onenetwork.com White paper Capitalizing on Change These big bang implementations take months and years to complete,
Overcoming Obstacles to Retail Supply Chain Efficiency and Vendor Compliance
 Overcoming Obstacles to Retail Supply Chain Efficiency and Vendor Compliance 0 GreenLionDigital.com How process automation, data integration and visibility, advanced analytics, and collaboration improve
SYNCHRONIZATION: MOVING BEYOND RE-ENGINEERING
 SYNCHRONIZATION: MOVING BEYOND RE-ENGINEERING Ajit Kambil An edited version of this viewpoint appeared in the Journal of Business Strategy 2008, Volume 29, Issue 3. Please contact Emerald Insight Reprints
Point-of-Sale Monitoring. Using Real-Time Retail Data to Reduce Out-of-Stocks and Improve Business Performance
 Point-of-Sale Monitoring Using Real-Time Retail Data to Reduce Out-of-Stocks and Improve Business Performance 2 TABLE OF CONTENTS 1 The Challenge of Reducing Out-of-Stocks... 3 2 Components of POS Monitoring...
Data Governance in the B2B2C World
 WHITE PAPER Data Governance in the B2B2C World Today s empowered consumers and their demand for product data have given rise to challenges in product data management. Manufacturers and retailers more than
Take Time and Cost Out of Your Inventory and Supply Chain - Exploit the Constraints of Forecasting!
 Take Time and Cost Out of Your Inventory and Supply Chain - Exploit the Constraints of Forecasting! A Thought-Leadership Whitepaper from MCA Associates By Howard W. Coleman, Principal Introduction: Do
BUILDING OMNI-CHANNEL RETAIL FROM THE BACK END UP
 BUILDING OMNI-CHANNEL RETAIL FROM THE BACK END UP Building Omni-Channel Retail From The Back End Up 2 An average of 50% of retailers plan to increase their commitments to order management, e-commerce,
Finished Goods Inventory Management
 Hot Topic Report Finished Goods Inventory Management Presenting Growth & Adaptation Through Metrics Supply Chain Consortium Benchmarking & Best Practices February 27, 2012 www.supplychainconsortium.com
www.flowcastingbook.com Page 1
 The Summary in Brief The retail store has been disconnected from planning the supply chain, even though the majority of planning problems can only be addressed at store level. For example, retail out-of-stocks
Monitoring the Online Marketplace
 Market Track s Actionable Insights Monitoring the Online Marketplace Developing a plan to stay on top of fluctuations in products and pricing online Key Questions Do you know how your products are priced
Inventory Control: It s Your Money!
 A Randall Data Systems White Paper Inventory Control: It s Your Money! The importance of knowing what you have and what you really need, and how inventory control software can help. Randall Data Systems,
Five Easy Fixes: How You Can Quickly Improve S&OP Performance
 Five Easy Fixes: How You Can Quickly Improve S&OP Performance By Dr. David L. Anderson September 2008 Sales & Operations Planning (S&OP) activities are among the most important, but also the most complicated,
Action Plan. Smart Planning and Demand Forecasting for Retailers
 Waste User: Peter Aggett Action Plan Smart Planning and Demand Forecasting for Retailers This Action Plan is intended to be used by a Director or senior individual within a Procurement function in a food
Your Last Traditional POS
 RIS News Custom Research Your Last Traditional POS Examining the future of retail POS in a brave new omnichannel world produced by by joe skorupa Your Last Traditional POS Examining the future of retail
Combining Lean and Agile
 An Integrated Approach to Supply Chain Strategy: Combining Lean and Agile Solutions Professor Martin Christopher Cranfield School of Management Cranfield University Cranfield Bedford MK43 0AL United Kingdom
Retail Industry Executive Summary
 Mobile Business Intelligence: Better Decisions Anywhere You Do Business Retail Industry Executive Summary Business Intelligence (BI) and Mobility Applications are top priorities for today s retail business.
Six Key Trends Changing Supply Chain Management Today. Choosing the optimal strategy for your business
 A Knowledge-Driven Consulting White Paper 2009 Corporation Six Key Trends Changing Supply Chain Management Today Choosing the optimal strategy for your business Contents Demand Planning.........................................
BRIDGING THE OMNICHANNEL DIVIDE
 BRIDGING THE OMNICHANNEL DIVIDE BRIDGING THE OMNICHANNEL DIVIDE While ecommerce is recognized as one of the most exciting opportunities in the Consumer Packaged Goods industry, poised to make up 5% of
Information-Driven Transformation in Retail with the Enterprise Data Hub Accelerator
 Introduction Enterprise Data Hub Accelerator Retail Sector Use Cases Capabilities Information-Driven Transformation in Retail with the Enterprise Data Hub Accelerator Introduction Enterprise Data Hub Accelerator
Insights into Enterprise Telecom Expense Management
 IBM Software Industry Solutions Telecom Expense Management Insights into Enterprise Telecom Expense Management Trends and Best Practices Insights into Enterprise Telecom Expense Management Introduction
Can JIT and Global Sourcing Strategies Coexist? How Cloud-Driven Supply Chain Visibility Reconciles Lean Manufacturing With Globalization
 Can JIT and Global Sourcing Strategies Coexist? How Cloud-Driven Supply Chain Visibility Reconciles Lean Manufacturing With Globalization A GT Nexus White Paper Just-In-Time Is at Odds With Globalization
SCALING UP RFID FOR RETAIL CHAINS
 SCALING UP RFID FOR RETAIL CHAINS PLANNING GUIDE 4. Implementation 3. Rollout Planning 2. Systems Architecture 1. Solution Definition SCALING UP RFID DEPLOYMENTS IN RETAIL After running successful pilots
Segmentation for High Performance Marketers
 Segmentation for High Performance Marketers Right Time Revenue Optimization STEP-BY-STEP GUIDE A Journey not a Destination High performance marketers recognize that market segmentation strategy is a journey
FIVE INDUSTRIES. Where Big Data Is Making a Difference
 FIVE INDUSTRIES Where Big Data Is Making a Difference To understand how Big Data can transform businesses, we have to understand its nature. Although there are numerous definitions of Big Data, many will
Prescriptive Analytics. A business guide
 Prescriptive Analytics A business guide May 2014 Contents 3 The Business Value of Prescriptive Analytics 4 What is Prescriptive Analytics? 6 Prescriptive Analytics Methods 7 Integration 8 Business Applications
TECHNOLOGY BRIEF. Business Benefits from Radio Frequency Identification (RFID)
") TECHNOLOGY BRIEF Business Benefits from Radio Frequency Identification (RFID) Executive summary Today the largest government and business enterprises in the world are developing plans to deploy electronic
TECHNOLOGY BRIEF Business Benefits from Radio Frequency Identification (RFID) Executive summary Today the largest government and business enterprises in the world are developing plans to deploy electronic
Consumer Goods and Services
 Accenture Risk Management Industry Report Consumer Goods and Services 2011 Global Risk Management Point of View Consumer Goods and Services 2011 Global Risk Management Point of View Consumer Goods and
2014 Big Data in Retail Study
 2014 Big Data in Retail Study MARCH 2014 Table of Contents Goals of the Study 3 Summary of Results 3 Study Participants 3 Retailers Biggest Obstacles to Success with Analytics 4 Retail Functions with the
SAP BUSINESSOBJECTS SUPPLY CHAIN PERFORMANCE MANAGEMENT IMPROVING SUPPLY CHAIN EFFECTIVENESS
 SAP Solution in Detail SAP BusinessObjects Enterprise Performance Management Solutions SAP BUSINESSOBJECTS SUPPLY CHAIN PERFORMANCE MANAGEMENT IMPROVING SUPPLY CHAIN EFFECTIVENESS The SAP BusinessObjects
Bridging Operational & Financial Forecasting
 IBM Software Group White Paper Budgeting and Forecasting Bridging Operational & Financial Forecasting 2 Bridging Operational & Financial Forecasting Introduction The global economic downturn has accelerated
Thought Leadership White Paper. Omni-channel transforms retail transactions
 Thought Leadership White Paper Omni-channel transforms retail transactions Omni-channel transforms retail transactions Many consumers today cross channels inherently, often back and forth without even
RedPrairie > Retail > White Paper. The Bottom Line Benefits of Workforce Management in Retail Distribution
 The Bottom Line Benefits of Workforce Management in Retail Distribution 2 TABLE OF CONTENTS Executive Summary 3 Today s Labor Challenges 4 Case Study CSK Auto 5 New Approach to Workforce 6 Management Benefits
CHOICES The magazine of food, farm, and resource issues
 CHOICES The magazine of food, farm, and resource issues 4th Quarter 2005 20(4) A publication of the American Agricultural Economics Association Logistics, Inventory Control, and Supply Chain Management
Salient for Retail Link
 Providing software and services that enable our clients to operate more efficiently. Salient for Retail Link Automatically integrate Wal-Mart POS and inventory data with your in-house sales for decision-support.
2 Day In House Demand Planning & Forecasting Training Outline
 2 Day In House Demand Planning & Forecasting Training Outline On-site Corporate Training at Your Company's Convenience! For further information or to schedule IBF s corporate training at your company,
Adopting a Continuous Integration / Continuous Delivery Model to Improve Software Delivery
 Customer Success Stories TEKsystems Global Services Adopting a Continuous Integration / Continuous Delivery Model to Improve Software Delivery COMMUNICATIONS AGILE TRANSFORMATION SERVICES Executive Summary
Channel Visibility: Accessing and Utilizing Down-Channel Transactional Data
 Channel Visibility: Accessing and Utilizing Down-Channel Transactional Data Automotive Aftermarket Suppliers Association By Epicor and the AASA Technology Council October 2012 Channel Visibility: Accessing
The 5 Questions You Need to Ask Before Selecting a Business Intelligence Vendor. www.halobi.com. Share With Us!
 The 5 Questions You Need to Ask Before Selecting a Business Intelligence Vendor www.halobi.com Share With Us! Overview Over the last decade, Business Intelligence (BI) has been at or near the top of the
Optimizing Sales & Marketing Effectiveness
 Optimizing Sales & Marketing Effectiveness Measuring Results Across Distributed Sales Channels Published: August 2013 Version 1 www.dimins.com The overall goal of consumer goods manufacturers, wholesalers,
Drop Ship Fulfillment
 Drop Ship Fulfillment IMPLEMENTATION AND MANAGEMENT BEST PRACTICES FOR SUCCESS SHIPMENTS Implementation and management of a drop ship fulfillment program directly impacts the bottom line and the customer
Omni- Channel Benefits for B2B Commerce
 i Mtkang/Shutterstock B2B ecommerce trends and tides are signaling a shift towards a B2C- like Omni- Channel eco- system. arvato Systems North America 6 East 32nd Street, New York, New York 10016 United
Be Direct: Why A Direct-To- Consumer Online Channel Is Right For Your Business
 A Forrester Consulting Thought Leadership Paper Commissioned By Digital River May 2014 Be Direct: Why A Direct-To- Consumer Online Channel Is Right For Your Business 1 Table Of Contents Executive Summary...2
The Retail Analytics Challenge: Smarter Retail through Advanced Analytics & Optimization
 Smarter Retail The Retail Analytics Challenge: Smarter Retail through Advanced Analytics & Optimization 2011 IBM Corporation Connecting With the Digital Customer the Retail Challenge 88.8% increase in
Mergers and Acquisitions: The Data Dimension
 Global Excellence Mergers and Acquisitions: The Dimension A White Paper by Dr Walid el Abed CEO Trusted Intelligence Contents Preamble...............................................................3 The
Anatomy of an Enterprise Software Delivery Project
 Chapter 2 Anatomy of an Enterprise Software Delivery Project Chapter Summary I present an example of a typical enterprise software delivery project. I examine its key characteristics and analyze specific
132: Collaboration is Key: Introducing CPFR 2.0 in an Omni-Channel World
 132: Collaboration is Key: Introducing CPFR 2.0 in an Omni-Channel World Inez Blackburn, Market Techniques and Innovations Bob Downey, Robert Downey Consulting Dave Rush, GS1 US Apparel and General Merchandise
Sample of Best Practices
 Sample of Best Practices For a Copy of the Complete Set Call Katral Consulting Group 954-349-1281 Section 1 Planning & Forecasting Retail Best Practice Katral Consulting Group 1 of 7 Last printed 2005-06-10
Product Lifecycle Management in the Food and Beverage Industry. An Oracle White Paper Updated February 2008
 Product Lifecycle Management in the Food and Beverage Industry An Oracle White Paper Updated February 2008 Product Lifecycle Management in the Food and Beverage Industry EXECUTIVE OVERVIEW Companies in
Three Strategies for Implementing HR in the Cloud
 Three Strategies for Implementing HR in the Cloud Adoption of cloud-based, software-as-a-service (SaaS) human resource management systems (HRMS) has become one of the hottest trends in HR. According to
Retail 2020 Challenges: Collaborating for Growth through Supply Chain Efficiencies. Jeff Holmes Managing Director, Retail and Consumer PwC
 Retail 2020 Challenges: Collaborating for Growth through Supply Chain Efficiencies Jeff Holmes Managing Director, Retail and Consumer www.pwc.com Retail 2020: Redefining Supply Chain Collaboration to Drive
How To Manage It Asset Management On Peoplesoft.Com
 PEOPLESOFT IT ASSET MANAGEMENT KEY BENEFITS Streamline the IT Asset Lifecycle Ensure IT and Corporate Compliance Enterprise-Wide Integration Oracle s PeopleSoft IT Asset Management streamlines and automates
THE VALUE OF INFORMATION SHARING IN THE RETAIL SUPPLY CHAIN: TWO CASE STUDIES
 FORECAST PROCESS IMPROVEMENT LESSONS FROM SUCCESSFUL COMPANIES THE VALUE OF INFORMATION SHARING IN THE RETAIL SUPPLY CHAIN: TWO CASE STUDIES Tonya Boone and Ram Ganeshan PREVIEW Retail supply chains are
Keys to Successful Supply Chain Transformation
 Keys to Successful Supply Chain Transformation Weathering the Perfect Storm To maintain competitive advantage, organizations must change and evolve over time. Often, Supply Chain Leaders are responsible
QAD Enterprise Applications 2012 Enterprise Edition. Training Guide Demand Management 6.1 Domain Knowledge
 QAD Enterprise Applications 2012 Enterprise Edition Training Guide Demand Management 6.1 Domain Knowledge 70-3250-6.1 QAD Enterprise Applications 2012 February 2012 This document contains proprietary information
HOW THE GAME IS CHANGING: BIG DATA IN RETAIL
 BRICK MEETS CLICK BIG DATA UPDATE, 4Q 2013 HOW THE GAME IS CHANGING: BIG DATA IN RETAIL We ve been tracking retailing professionals experiences and attitudes toward big data regularly over the past two
Financial Planning, Budgeting, and Forecasting
 Financial Planning, Budgeting, and Forecasting Removing the Hurdles March 2013 Nick Castellina Financial Planning, Budgeting, and Forecasting: Removing the Hurdles Financial planning is the process by
Loss Prevention Data Mining Using big data, predictive and prescriptive analytics to enpower loss prevention
 White paper Loss Prevention Data Mining Using big data, predictive and prescriptive analytics to enpower loss prevention Abstract In the current economy where growth is stumpy and margins reduced, retailers
ENTERPRISE BUSINESS SYSTEMS PROGRAM MANAGEMENT
 ENTERPRISE BUSINESS SYSTEMS PROGRAM MANAGEMENT $8 Billion Global Hospitality Company in the Hotel, Resort and Timeshare Industry Company recognized its inability to satisfactorily deliver finance function
The key to success: Enterprise social collaboration fuels innovative sales & operations planning
 Manufacturing The key to success: Enterprise social collaboration fuels innovative sales & operations planning As the sales and operations planning leader, you have a few principal responsibilities: setting