Monitoring and evaluation of policy instruments to support renewable electricity in EU Member States
|
|
|
- Victor Montgomery
- 8 years ago
- Views:
Transcription
1 Final Report Monitoring and evaluation of policy instruments to support renewable electricity in EU Member States A research project funded by the German Federal Environment Agency (UBA) and the Ministry for the Environment, Nature Conservation and Nuclear Safety (BMU) Funding label: The project is based on the European projects OPTRES, Green-X and FORRES Authors: Mario Ragwitz (Fraunhofer ISI) Anne Held (Fraunhofer ISI) Gustav Resch (EEG) Thomas Faber (EEG) Claus Huber (EEG) Reinhard Haas (EEG)
 Anne Held (Fraunhofer ISI) Gustav Resch (EEG) Thomas Faber (EEG) Claus Huber (EEG)")
2 Acknowledgement The project "Monitoring and evaluation of policy instruments to support renewable electricity in EU Member States" has been supported by the German Federal Environment Agency (UBA) and the German Ministry for the Environment, Nature Conservation and Nuclear Safety (BMU). The results achieved in the frame of this project are based on the earlier EU projects Green-X "Deriving optimal promotion strategies for increasing the share of RES-E in a dynamic European electricity market" and FORRES 2020 "Analysis of the EU renewable energy sources' evolution up to 2020" and have significantly profited from the EU project OPTRES "Assessment and optimisation of renewable energy support schemes in the European electricity market", which was carried out in parallel. Imprint: Fraunhofer Institute Systems and Innovation Research Breslauer Str. 48, D Karlsruhe, Germany Printed in Germany September 2006 Photography (cover page) by Gustav Resch Contact details: Dr. Mario Ragwitz Fraunhofer Institute Systems and Innovation Research Breslauer Str. 48 D Karlsruhe Germany Phone: +49(0)721/ Fax: +49(0)721/ mario.ragwitz@isi.fhg.de Dr. Gustav Resch Vienna University of Technology Energy Economics Group (EEG) Gusshausstrasse 25 / A-1040 Vienna Austria Phone: +43(0)1/ Fax: +43(0)1/ resch@eeg.tuwien.ac.

3 CONTENTS Page Executive Summary Introduction General characterisation of support schemes for renewable energy sources in the electricity sector (RES-E) Current status of RES-E markets in selected EU Member States Effectiveness of the implemented support schemes in selected EU Member States The impact of support schemes on the future deployment of RES-E Design criteria for RES-E support instruments Main findings on the properties of feed-in systems and quota systems References GLOSSARY...95 Annex A Detailed results with respect to chapter 5 (future RES-E deployment)...98 Annex B Short characterisation of the Green-X model Page I

4 Page II
5 EXECUTIVE SUMMARY Since the publication of the White Paper "Energy for the future" (EC, 1997) and the adoption of the Directive 2001/77/EC (EC, 2001) on renewable energies in the electricity sector (RES-E), the EU renewable energy sector has developed in a dynamic way. All member states have introduced policies to support the market introduction of RES-E and most of them have started to improve the corresponding administrative framework conditions. The main existing policies comprise feed-in tariffs, quota obligations based on tradable green certificates (TGCs), investment grants, tender procedures and tax measures. Due to the different nature of the various policy schemes, the effects of these instruments on technological development, RES-E market diffusion and evolution of generation costs as well as cost for society differ significantly. Until now RES-E support measures have been implemented exclusively on a national level, aiming to meet the national indicative targets as set in the RES-E directive. However, based on the presently implemented policies, most of these targets will most likely not be met as was indicated in the communication of the European Commission in 2004 COM (2004) 366 (only Denmark, Finland, Germany and Spain are on track to reach the national target). An important reason for this is that the support level offered to RES-E is still very heterogeneous among the EU countries and certainly too low in a number of Member States, i.e. sometimes below long-term marginal costs. Furthermore, the identified key barriers to the development of RES-E which are of an administrative, financial, and social nature as well as insufficient electricity grid capacity are not being appropriately addressed by national authorities. Additionally the risk level associated with RES-E investments is still evaluated as comparatively high by the relevant financial institutions in some markets. Altogether, the effectiveness of present RES-E support is still limited in a number of cases and shows a rather uneven distribution across the EU. Besides these facts, the economic efficiency of RES-E support is lower than would be possible in an advanced policy environment and shows a clear heterogeneity among member states. In the present project the main national support instruments for RES-E implemented in EU Member States have been analysed based on a historical assessment of past achievements as well as on a prospective model based analysis. As general conclusions from the present study it can be stated that the continuity and long term investment stability of any implemented policy is a key criterion for the stable growth of RES-E markets as well as for reaching RES-E targets at low costs, most of the European success story to promote RES-E during the past decades was driven by implemented feed-in tariffs, which have proven to be an effective as well as economically efficient policy instrument, in order to minimise the costs for society, technology specific instruments are preferable to non-technology specific support, Page 1
, investment grants, tender procedures and tax measures.")
6 non-economic barriers (e.g. grid and administrative barriers) need to be diminished in order to increase the growth of many renewable energy markets in Europe. More detailed conclusions from the analysis of historic trends and the modelbased prospective analysis read as follows: Based on the analysis of historic trends: The best progress towards the targets set in the RES-E directive was achieved in countries with stable support systems and low overall barriers for the development of RES-E, i.e. Denmark, Finland, Germany and Spain in the present analysis. The effectiveness of the promotion of innovative technologies like wind energy, agricultural biogas and photovoltaics has been the highest in countries having feed-in tariffs as their main support system, even though not all feed-in countries have been equally successful. These technologies offer most significant future potentials for the mid to long term. Low cost options in the overall RES-E technology portfolio like sewage gas and certain fractions of solid biomass have been supported effectively but not always efficiently in countries with non-technology specific RES-E promotion schemes like tax incentives and quota obligations based on TGCs, although significant progress can be seen under some of the implemented feed-in systems as well. Comparing the current level of support offered under the different systems with the resulting effectiveness of the promotion schemes for the case of wind energy it is striking that three countries - Italy, the UK and Belgium - which have recently transformed their markets into quota systems as the main support instrument, show a high expected annuity of support (and therefore high costs for consumers) but low growth rates. The high annuity results in particular from the extrapolation of the presently observed high certificate prices. Although the latter assumption might be questioned (empirical evidence supporting this assumption is given in the report), the results show that certificate systems can lead to high producer profits resulting from high investment risks. On the other hand, it seems typical for countries supporting wind energy based on feed-in-tariffs to be more effective at generally moderate levels of support. An exception to this rule can be observed in countries, where administrative barriers are preventing rapid development of wind energy. Referring to the model-based prospective analysis: Results suggest that the most significant efficiency gains can be achieved simply by strengthening and improving national RES-E support schemes more than two thirds of the overall cost reduction potential of policy harmonisation can be attributed to the optimisation of national support schemes. The effectiveness of the various RES-E support schemes largely depends on the credibility of the system. The continuation of a policy avoiding stopand-go is important to create a stable growth in renewable energy sources and, in addition, also cause lower societal costs as a result of a lower risk premium (of investors). Page 2

7 Administrative barriers can have a significant impact on the success of an instrument and hamper the effectiveness of policy schemes which may be very powerful in principle. If technology-specific support instruments are applied coordination and harmonisation of the support mechanisms between the Member States might lead to lower transfer costs for consumers. Otherwise gains may be marginal or there may even be losses incurred. As model runs clearly indicate, a properly designed, harmonised, technology-specific promotion of RES-E at cluster or European level would cause lower transfer costs for consumers in total, accompanied by a better equalisation of consumer burden among the countries. Of course, the necessary pre-condition of reaching an international agreement is that a fair burden sharing concept is developed, which considers both national and international benefits from RES-E generation. By focusing on transfer costs for consumers, the comparison of the individual promotion instruments leads to the following findings: A quota obligation based on TGCs is less efficient from a societal point-ofview compared to the other instruments analysed such as feed-in tariffs because a higher risk must be borne by the investor, and efficiency gains are absorbed by the producers (high producer surplus) and not by the consumers; Feed-in tariffs (and also tender schemes) are useful to promote a more homogeneous distribution among different technologies by setting technologyspecific guaranteed tariffs. The implementation of such a policy can support the long-term technology development of various RES-E options which are currently not cost-efficient. Page 3

8 1 INTRODUCTION It is the European Union's objective to increase the share of electricity produced from renewable energy sources to 21 % in the EU-25 (22% in the EU-15) by This is the core element of Directive 2001/77/EC, which requires the Member States of the EU to apply appropriate instruments in order to achieve the national targets for RES in the electricity sector. The choice of instrument is left largely up to the Member States themselves. However, Articles 3 and 4 of the Directive provide for a monitoring system which observes the development in the individual Member States. If it can be anticipated that national targets will not be reached, it is then possible for the Commissions to request a Community framework for regulations promoting electricity from renewable energy sources (see Article /77/EC). As provided for in the Communication of the EU Commission COM(2004) 366 and asked for by the Council (Energy) in its conclusions of 29 November 2004, further targets are then to be set in 2007 for the year This present report examines the development of renewable energy sources in the electricity sector (RES-E) in the individual Member States of the European Union. In particular, the support instruments being used in the Member States are documented and assessed with regard to their impacts on the share of renewable energies in electricity production in empirical investigations as well as model-based scenario calculations. The effectiveness and efficiency of current and future instruments promoting electricity production from renewable energy sources in Europe are analysed in detail. The most effective and efficient instruments are identified and the (future) costs of electricity production from renewable energy sources and the government support necessary to guarantee stable growth are estimated. The intention is to identify the essential elements for the further development of national and EU-wide measures. The core questions analysed in this report can be summarized as follows: Which support instruments for renewable electricity are currently being implemented in the individual Member States of the EU? Which instrument changes have occurred in the past or are planned in the future? Which of the support instruments used (e.g. feed-in tariffs, investment grants, tender schemes, quotas based on tradable green certificates) are the most effective; which are the most efficient from a historical perspective and from a prospective analysis? What are the general minimum criteria able to be determined for effective and efficient support instruments? 1.1 Method of approach evaluation criteria Support instruments have to be effective in order to increase the penetration of RES-E and efficient with respect to minimising the resulting public costs (transfer cost for society) over time. The criteria used for the evaluation of the various instruments are based on the following conditions: Page 4

9 Minimise generation costs This aim is fulfilled if total RES-E generation costs (GC) are minimised. In other words, the system should provide incentives for investors to select technologies, sizes and sites such that generation costs are minimised. Lower producer profits If such cost-efficient systems are found various options should be evaluated with the aim of minimising the transfer costs for consumer / society.1 This means that feed-in tariffs, subsidies or trading systems should be designed in such a way that public transfer payments are also minimised. This implies lowering generation costs as well as producer surplus (PS)2. p MC Market clearing price = price for certificate price, costs [ /MWh] Producer surplus (PS) MC p C Generation Costs (GC) Transfer costs for consumer (additional costs for society) Quota Q = PS + GC p C * Q quantity [GWh/year] p C... market price for (conventional) electricity p MC... marginal price for RES-E (due to quota obligation) MC... marginal generation costs Figure 1. Basic definitions of the cost elements (illustrated for a TGC system) In some cases both goals minimise generation costs and producer surplus may not be reached together so that compromises have to be found. For a better illustration of the cost definitions used, the various cost elements are shown in Figure 1. 1 Transfer costs for consumers / society (sometimes also called additional / premium costs for society) are defined as the direct premium financial transfer costs resulting from the consumer to the producer due to the RES-E policy compared to the reference case of consumers purchasing conventional electricity from the power market. This means that these costs do not consider any indirect costs or externalities (environmental benefits, change of employment, etc.). The transfer costs for society are either expressed in M /year or related to the total electricity consumption. In the latter case, the premium costs refer to each MWh of electricity consumed. 2 The producer surplus is defined as the profit of green electricity generators. If for example, a green producer receives a feed-in tariff of 60 for each MWh of electricity he sells and his generation costs are 40 /MWh, the resulting profit would be 20 for each MWh. The sum of the profits of all green generators equals the producer surplus. Page 5

10 2 GENERAL CHARACTERISATION OF SUPPORT SCHEMES FOR RENEWABLE ENERGY SOURCES IN THE ELECTRICITY SECTOR (RES-E) Promotion instruments can be classified according to different criteria (i.e. whether they affect demand for or supply of RES-E or whether they support capacity or generation). So that a common terminology can be applied at least within this thesis, Table 1 provides a classification of these instruments, covering all the currently applied strategies referring to the promotion of RES-E deployment. A brief explanation of the terminology is provided below for instruments of high relevance. Table 1. Classification of promotion strategies Direct Price-driven Quantity-driven Indirect Investment incentives Tax incentives Feed-in tariffs Rate-based incentives Regulatory Investment focussed Generation based Tendering system Tendering system Quota obligation (RPS) based on Environmental taxes TGCs Shareholder pro- Investment grammes Voluntary focussed Contribution programmes Voluntary agreements Generation based Green tariffs Investment incentives establish an incentive for the development of RES-E projects as a percentage over total costs, or as a predefined amount of per installed kw. The level of incentive is usually technology-specific. Feed-in tariffs (FITs) are generation-based price-driven incentives. The price per unit of electricity that a utility or supplier or grid operator is legally obligated to pay for electricity from RES-E producers is determined by the system. Thus, a federal (or provincial) government regulates the tariff rate. It usually takes the form of either a total price for RES-E production, or an additional premium on top of the electricity market price paid to RES-E producers. Apart from the level of the tariff, its guaranteed duration represents an important parameter for assessing the actual financial incentive. FITs allow technologyspecific and band-specific promotion as well as an acknowledgement of future cost- Page 6

11 reductions by implementing decreasing tariffs (see, e.g. the German Renewable Energy Act). Quota obligations based on Tradable Green Certificates (TGCs) are generation-based quantity-driven instruments. The government defines targets for RES-E deployment and obliges any party of the electricity supply-chain (e.g. generator, wholesaler, or consumer) with their fulfilment. Once defined, a parallel market for renewable energy certificates is established and their price is set according to demand and supply conditions (forced by the obligation). Hence, for RES-E producers, financial support may arise from selling certificates in addition to the income from selling electricity on the power market. Production tax incentives are generation-based price-driven mechanisms that work through payment exemptions from the electricity taxes applied to all producers. This type of instrument thus differs from premium feed-in tariffs solely in terms of the cash flow for RES-E producers: it represents an avoided cost rather than additional income. Tendering systems are quantity-driven mechanisms. The financial support can either be investment-focused or generation-based. In the first case, a fixed amount of capacity to be installed is announced and contracts are given following a predefined bidding process which offers winners a set of favourable investment conditions, including investment subsidies per installed kw. The generation-based tendering systems work in a similar way. However, instead of providing up-front support, they offer support in the size of the bid price per kwh for a guaranteed duration. As well as the regulatory instruments described above, more and more voluntary approaches have appeared with on-going market liberalisation. They are mainly based on the willingness of consumers to pay premium rates for renewable energy. However, in terms of effectiveness so far i.e. actual installations resulting from their appliance their impact on total RES-E deployment is negligible. Figure 2 provides an overview of the renewable electricity support systems used in the EU-25 and Bulgaria and Romania. Page 7
.")
12 Feed-in Tarif f Quota CZ LV EE HU SK CY BG RO SI DE LT LU DK PT ES GR AT FR NL Certificate Systems SE IT PL UK BE IE NL UK MT FI SL Tender Tax measures Figure 2. Overview of renewable electricity support systems in EU-25 & BU, RO Page 8

13 3 CURRENT STATUS OF RES-E MARKETS IN SELECTED EU MEMBER STATES First we would like to present the status of the RES-E markets for selected EU Member States which are representative for specific RES support instruments. The following countries have been selected as characteristic candidates for each of the relevant policy schemes3: Support scheme Feed-in tariff Quota Tender Tax measure EU Member State DE, ES, FR, AT UK, BE, SWE, IT IE FI In Figure 3, the RES-E generation in 2003 is shown for the selected countries. It is obvious that hydropower is still the dominating source in most of the ten countries concerned, but the 'new' RES-E have started to play a more prominent role. Particularly in Germany, Finland, Spain and the UK, non-hydro sources like wind, biogas and solid biomass provide a significant contribution. Electricity generation [TWh/year] AT BE FI FR DE IE IT ES SE UK Hydro large-scale Hydro small-scale Wind off-shore Wind on-shore Photovoltaics Geothermal electricity Biowaste Solid biomass Gaseous biomass Figure 3. Total achieved RES-E generation potential in In order to show the recent progress of the ten Member States in more detail, the additional RES-E generation potential5 in the period is presented in Figure 4. As 3 The past policy changes in these countries are shown in Figure 8. In the near future, only Ireland is considering a major policy shift towards a feed-in system. 4 Wind on-shore: - Wind turbines that are installed on land, instead of being installed off-shore (in the sea). The term on-shore is not limited to costal areas. 5 The electricity generation potential represents the output potential of all plants installed up to the end of each year. Of course, the figures for actual generation and generation potential differ in most cases due to the fact that, in contrast to the actual data, the potential figures Page 9

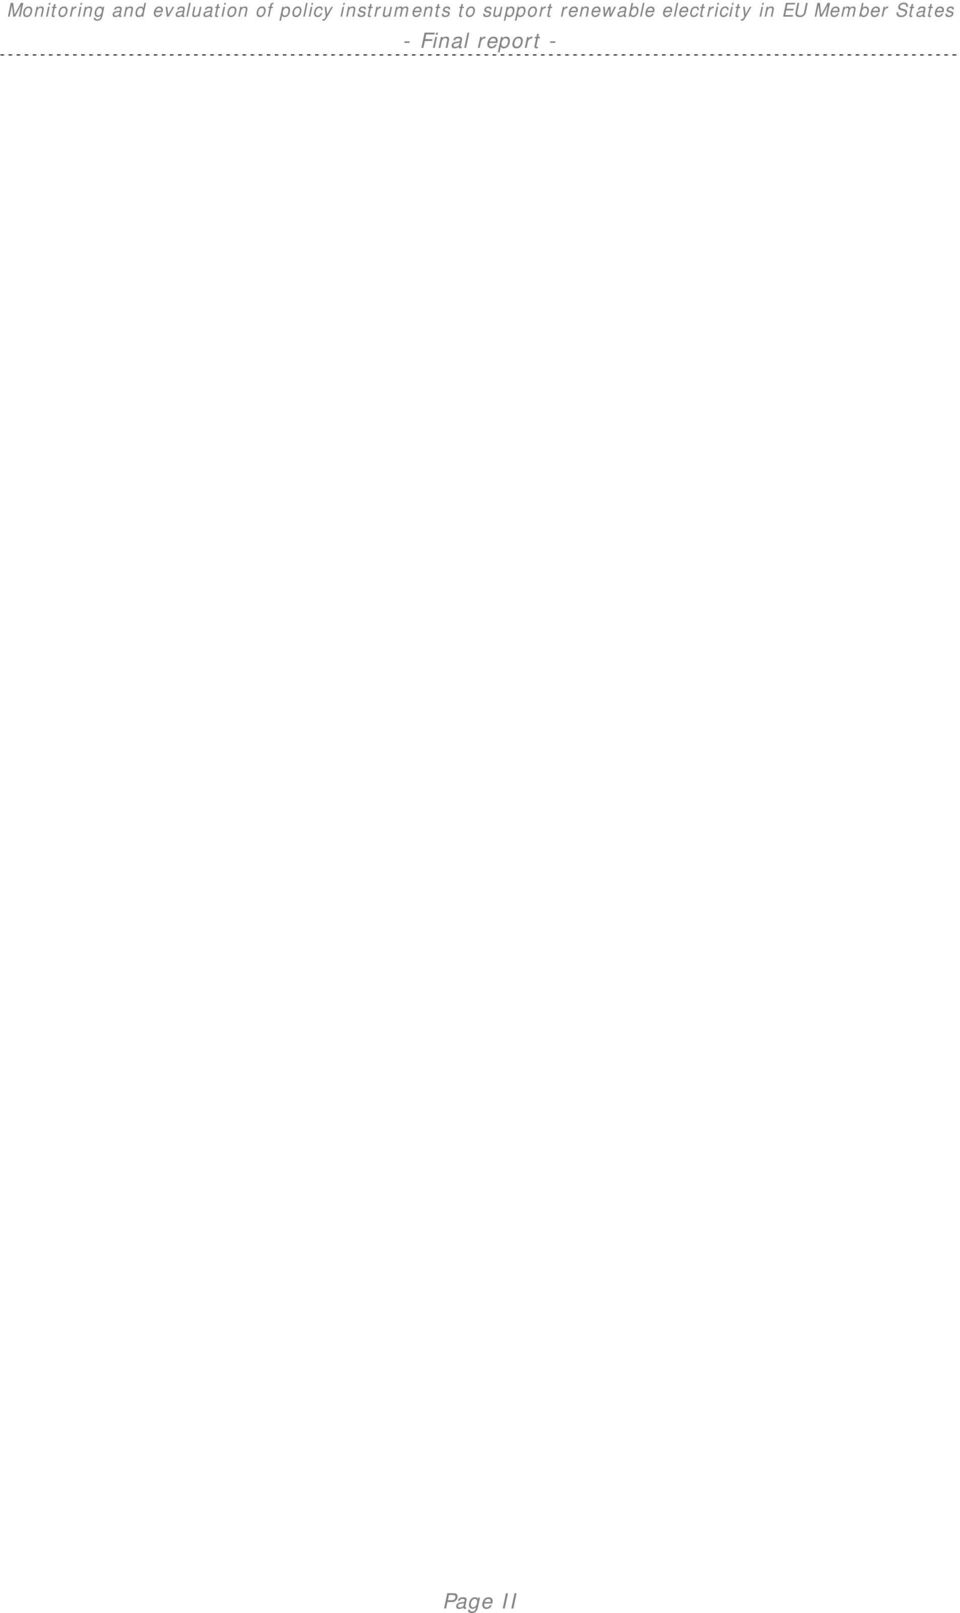
14 can be seen, Germany and Spain have by far the largest achievements since 1997 in terms of additional generation capacity of new RES-E. By far the slowest progress was made in Belgium and Ireland. In terms of technology, wind energy dominates followed by solid biomass and biogas. Austria, France, Italy and Spain have added large-scale hydropower generation capacity. Changes of RES-E generation potential (2003 versus 1997) [TWh/year] AT BE FI FR DE IE IT ES SE UK Hydro large-scale Hydro small-scale Wind off-shore Wind on-shore Photovoltaics Geothermal electricity Biowaste Solid biomass Gaseous biomass Figure 4. Total additional RES-E generation potential (2003 versus 1997) In a next step we would like to show the progress made by these countries since the publication of the White Paper "Energy for the future" in 1997 in terms of the RES-E share in gross electricity consumption. In Figure 5, the RES-E share is shown based on the generation potential, which represents the actual generation corrected by the annual volatility of hydropower and wind energy. As can be observed, only a few countries have actually significantly increased their RES-E share within the considered period. Notably Finland, Germany and Spain have made reasonable progress towards reaching the 2010 targets. 80% Share of RES-E in gross electricity consumption [%] 70% 60% 50% 40% 30% 20% 10% EU-Target for % Figure 5. AT BE FI FR DE IE IT ES SE UK EU15 Share of renewable electricity generation potential in gross electricity consumption (2003 versus 1997) based on the generation potential represent normal conditions, e.g. in case of hydropower, the normal hydrological conditions, and furthermore, not all plants are installed at the beginning of each year. Page 10
![Changes of RES-E generation potential (2003 versus 1997) [TWh/year] 30 25 20 15 10 5 0-5 AT BE FI FR DE IE IT ES SE UK Hydro large-scale Hydro small-scale Wind off-shore Wind on-shore Photovoltaics](/docs-images/56/7514074/images/page_14.jpg "Geothermal electricity Biowaste Solid biomass Gaseous biomass Figure 4.")
15 80% Additional generation potential in 2003 compared to 1997 as share of the RES-E target [%] 60% 40% 20% 0% -20% -40% AT BE FI FR DE IE IT ES SE UK -60% Figure 6. Additional generation potential in 2003 compared to 1997 as a share of the total additional generation potential needed by 2010 according to the RES-E directive In Figure 6 we show the progress made in reaching the Member State targets for 2010 in more detail by depicting the fraction of the difference to target between 1997 and 2010 which was already achieved by If countries were on track in a linear annual breakdown of the target, they should have fulfilled 46.2% of the difference to target by As can be seen, most countries, except Austria and France, have increased their RES-E share since However, only Finland, Germany and Spain show the growth needed to reach the target based on a linear extrapolation of the historical development. Clearly, there are two different explanations for slow progress in reaching the RES-E target: too little progress concerning the development of renewable technologies or a high growth in gross electricity consumption. Clearly a slow progress towards reaching the RES-E target might have two different reasons: too little progress concerning the development of renewable technologies or a high growth of gross electricity consumption. In order to separate the two effects Figure 7 shows the average annual growth rate of the renewable electricity generation potential and the average annual growth of the electricity consumption. As can be seen especially in countries like Ireland, Austria and Spain the progress made on the development of RES-E was diminished to a significant extent by the growing electricity consumption. In other countries like Sweden and France the slow progress on the promotion of renewables was the main reason for the limited success in approaching the targets. We would like to clearly state here that the average annual growth of the RES-E generation potential given in Figure 7 should not be primarily used to evaluate the progress with respect to RES-E in the different countries. The reason is that this quantity represents a biased indicator (if applied for measuring RES-E progress), which is naturally at a high level in countries with low RES-E share and visa versa. In order to judge the progress in terms of RES-E promotion the effectiveness indicator defined in section 4 represents the better suited indicator. Page 11

16 14% 12% Average annual growth RES-E generation potential (97-03) Average annual growth electricity demand (97-03) Average annual growth of RES-share (97-03) 10% 8% 6% 4% 2% 0% -2% AT BE FI FR DE IE IT ES SE UK EU-15-4% Figure 7. Comparison of average annual growth rates of renewable electricity generation potential and electricity demand in the period In the following tables a detailed characterisation of the present status of the RES-E markets and the policy environment in the selected member states will be given. Besides stating the main policy instrument for the promotion of RES-E the crucial implementation details of this policy are given as well as additional support schemes, which supplement the main instrument. Furthermore we shortly review the status of the RES markets in those countries and give the critical barriers that hindered stronger progress during the recent past (This information builds on the results derived in the EU financed projects FORRES 2020 and OPTRES.).6 6 For further information please visit: and Page 12

17 Austria Main instrument Feed-in tariffs (terminated by 31 December 2004) Main implementation details Renewable Energy Act (Ökostromgesetz). Technology-specific FITs guaranteed for 13 years for plants which get all permissions between 1 January 2003 and 31 December 2004 and, hence, start operation by the end of An amendment to the Renewable Energy Act, which was proposed in 2004, was rejected in December Since the active period of the former instrument has not been extended, there is currently a kind of "policy vacuum" in Austria. No new plants receive permissions. In August 2005 the time limit for implementing of already approved biogas, biomass and small hydro installations has been extended until December The level of tariffs implemented in 2003 can be summarised as follows: In general, this support is guaranteed for the first 13 years of operation. Small hydro: PV systems: /MWh (Only active in early 2003 as a limitation was included i.e. until a national cumulative capacity of 15 MW was reached) 600 /MWh for plants < 20 kw peak ;470 /MWh for plants > 20 kw peak Additional support Status of RES-E market Main barriers Wind systems: 78 /MWh for new plants Geothermal energy: 70 /MWh for electricity fed into the grid Solid biomass and waste with large biogenic fraction: /MWh, 65 /MWh (hybrid plants) Biogas: /MWh Sewage and landfill gas: /MWh Investment incentives of up to 30% on federal and regional level. Stimulated by the feed in tariffs a steady growth especially in the sectors of wind energy and biomass electricity was observed. Currently there is a hold on further RES-E investments, because no support (other than moderate investment incentives) exists. Continuity is the main problem due to short operational period (until end of 2004) of the feed in tariffs. In some areas grid shortages represent a barrier. Page 13

18 Belgium Main instrument Quota/TGC and feed-in-tariffs (minimum tariffs) Main details implementation In Belgium a combined support scheme is implemented by the regional authorities (except for wind offshore), FIT shall secure the price level of the TGCs. The main promotion scheme for RES in Belgium is a green certificate system with mandatory demand and guaranteed minimum prices ('fall-back prices') for green certificates at federal level. Minimum prices are: Wind offshore: Wind onshore: Solar: 90 /MWh 50 /MWh 150 /MWh Biomass and other RE: 20 /MWh Hydro: 50 /MWh Companies which do not reach the target by the end of the certificate accounting period have to pay a penalty. The penalties are varying according to regions. The penalty prices per certificate (1 MWh) in 2005 are: Flanders: 125 /missing certificate (1 MWh) until 2010 Walloon: 100 /missing certificate (1 MWh) until New penalties will be introduced in Brussels: 75 /missing certificate (1 MWh) until Penalty is 100 between Additional support Status of RES-E market Main barriers Investment support available Still an immature RES-E market due to policy change in 2002 and due to small size of the regional certificate markets. Because of the possibility of banking of certificates and formerly increasing penalty rates and a shortage on certificates, not much trading has taken place, as it is more favourable of paying penalties the first year and use the certificates in later periods. Due to the division by regions the Belgium market is not fully transparent. Furthermore the markets are rather small, resulting in an illiquid market with little trade. Page 14

19 Finland Main instrument Tax exemption Main implementation Exemption on energy tax for renewable electricity: Value of tax exemption: details Wind: 7.3 /MWh Biomass/Small hydro: 4.4 /MWh Recycled fuels 2.5 /MWh Additional support Investment incentives are available for new investments (up to 30%, in case of wind up to 40%) Status of RES-E market Renewables cover currently around 28% of the Finnish total electricity consumption supplied by two key sources: hydro power (70%) and biomass (30%). Over the past decade a significant increase has been realised in the deployment of biomass in particular in the form of CHP and large units for pure electricity generation. Main barriers The value of total available support does not completely cover the price gap with fossil or nuclear based competitors. This holds in particular for wind energy. Furthermore political instability and resulting uncertainty on future energy support programmes have sometimes resulted in withholding new renewable energy investments. France Main instrument Feed-in-tariffs Main details implementation FITs for RES-E plant < 12 MW (this limit does not apply to wind on-shore) guaranteed for 15 years (20 years PV and Hydro): Support level of FITs: Wind: 30,5-83,8 /MWh7 Biomass Geothermal: PV: Landfill gas: Hydro: MSW: /MWh /MWh 152,5-305 /MWh 45-57,2 /MW 54,9-61 /MWh8 25,8-47,2 /MWh Additional support Investment subsidies for Photovoltaics, Biomass and Biogas Tender system for installations > 12 MW with guaranteed price contracts (except for wind on-shore, which is generally supported by FITs). Calls for projects have been published for biogas and wind technology. 7 Stepped FIT: 83,8 /MWh for the first 5 years of operation and then between 30,5 and 83,8 /MWh depending on the quality of site 8 Producers can choose between four different schemes. The table shows the flat rate option. Within other schemes tariffs vary over time (peak/base etc.) Page 15
 and biomass (30%).")
20 Status of RES-E market Renewables cover currently around 16% of the French total electricity consumption. This supply is covered mainly by hydro power. Despite significant resources wind, biomass and geothermal energy play currently an insignificant role in the electricity sector. Main barriers Concerning wind, resistance by local authorities regarding the regulative approval of new projects can be specified as a problem. Moreover grid integration and future acceptance by the grid operator represents a barrier to further RES-development. Germany Main instrument Feed-in tariffs Main details implementation German Renewable Energy Act: FITs guaranteed for in general 20 years In more detail, FITs for new installations (installed after August 8, 2004) are (digression):9 Hydro: Wind 10 : Biomass & Biogas: /MWh (1%/a for large hydro) /MWh (2%/a) /MWh (1,5 %/a) Landfill-, Sewage- & Mine Gas: /MWh (1,5 %/a, except of Mine Gas) PV & Solar thermal electricity: /MWh (5-6,5%/a) Geothermal: /MWh (1%/a, starting 2010) Additional support Soft loans and investment incentives by the market incentive programme for biomass CHP, small hydropower. Soft loans by a federal investment bank DtA (a relevant share of Germanys wind energy investments is financed by government loans) Status of RES-E market The renewable energy market in Germany is mature showing large growth rates even at high penetration rates. Biomass and wind-offshore might be considered as the only source that is lacking behind the expectations (high growth of biomass can be observed since the revision of the Renewable Energy Act in 2004). The stable policy support has stimulated continuous and high growth especially in the case of wind energy, PV and biogas installations during the past decade. 9 The level of the tariff per kwh is constant for an installation after commissioning for in general 20 years, but depends on the date of commissioning. The later the initial operation is, the lower the tariff will be according the degression rates given in brackets. 10 Stepped FIT: In case of onshore wind 87 /MWh for the first 5 years of operation and then between 55 and 87 /MWh depending on the quality of site. Page 16

21 Main barriers Partially exploited potentials and limited grid capacity in the northern parts of Germany presently slow down growth of onshore wind energy on a high level of the market. Offshore wind energy develops slower than expected due to unexpected high costs and unsolved technical problems (high distance from land and large water depths). Biomass development was slower than expected (until 2005) due to fuel price uncertainty and high infrastructure costs. Most of the low-cost potentials (wood wastes) have already been exploited. Ireland Main instrument Tender (until end of 2005) / Feed-in Tariffs starting in 2006 Main details implementation Tender system: Alternative Energy Requirement (AER V, AER VI)11: Price caps of purchase contracts: Large scale wind (> 85MW): 52 /MWh; Small scale wind (< 85MW): 57 /MWh; Offshore Wind : 84 /MWh; Biomass: 64 /MWh; Biomass-CHP: 70 /MWh; Biomassanaerobic digestion: 70 /MWh; Hydro (< 5 MW): 70 /MWh Tariffs under the new feed-in tariff (draft figures January 2006): Large scale wind (>5MW) Small scale wind (<5MW) 57 /MWh 59 /MWh Biomass (including landfill gas) 70 /MWh Hydro and other biomass 72 /MWh The duration of the feed-in tariff is 15 years. Additional support Status of RES-E market Tax relief for investment in RES-E Traditionally hydropower is by far the most important renewable electricity source in Ireland, though in recent years production from other RES-E such as wind and biogas is increasing. However, compared to a high wind power potential in Ireland, until 2003 relatively moderate growth rates could be observed. As a result of the bidding round in 2004 the amount of additionally installed wind power capacity was considerably higher than in former years (153 MW). Main barriers The crucial barriers for further growth rates in Ireland are caused by the characteristics of the tender system. One constraint can be the fact, that bidding winners do not realize their projects due to non-economic contract conditions. The AER also tends to lead to relatively poor quality of equipment as the lower-price bids win the competition. Uncertainty about 11 Front weighting of the tariffs is allowed by offering the possibility to increase the price the first 7,5 years of the contract combined with a decrease of 35 % for the remaining contract duration. Page 17
22 future target setting (both levels and technology preferences) seems to one constraint of the Irish tender system, since it is a stop-start programme. Moreover projects eligible may not exceed certain capacity levels which may lead to a certain inefficiency of the project design. Italy Main instrument Quota/TGC Main details implementation Quota obligation (based on TGCs) on electricity suppliers: 2.35% target (2004), increasing yearly up to 2008; TGC issued for all (new) RES-E (incl. large Hydro and MSW) with rolling redemption12; Relatively high certificate prices up to 117 /MWh, certificates are issued only for plants with production of more than 50 MWh per year. Green certificates are only issued during the first 8 years of operation of a plant. Additional support Status of RES-E market Feed-in tariffs for PV, tariffs /MWh; total capacity limit 100 MW The quota system can be called still rather immature. The interim targets of the quota obligation set by the national government have not been reached. Among the new renewables in the electricity sector only wind energy and biowaste have shown relevant growth rates in the recent years. Main barriers The major problem of developing new production capacity seems to be problems in getting authorisation at the local level, high risk level for investors and high grid connection costs. 12 In general only plant put in operation after 1 st of April 1999 are allowed to receive TGCs for their produced green electricity. Moreover, this allowance is limited to the first 8 years of operation (rolling redemption). Page 18
23 Spain Main instrument Feed-in Tariff Main details implementation FITs (Royal Decree 436/2004): RES-E producer have the right to opt for a fixed price or for a premium tariff13. Both are adjusted by the government according to the variation in the average electricity sale price. In more detail the level of the fixed tariff for 2004 amounted to: Wind: PV14: Small Hydro: Biomass: 64.9 /MWh c/kwh /MWh /MWh Most operators have chosen the premium option in 2005 due to high electricity prices. Additional support ICO-IDAE funding line, which provides with special conditions to investments in RE and RUE investments. In general, investment incentives, soft loans and tax incentives were defined under the Plan de Fomento de las Energias Renovables (RES Promotion Plan), whose aim is to support RES investments with 13.1 % public financial sources Status of RES-E market Wind power has developed impressively. The biomass sector still needs an integral policy and probably higher tariffs in the feed-in system. Concentrating solar thermal power production shows impressive activities with regard to project development: about 200 MW of installed capacity are under construction. Main barriers Small hydro needs to overcome the administrative barriers. Sweden Main instrument Quota / TGC Main details implementation Quota obligation (based on TGC) on consumers: Increasing from 7.4% in 2003 up to 16.9% in Non-compliance leads to a penalty, which is fixed at 150% of the average certificate price in a year (26 /MWh in 2005). The certificate price is insufficient to initiate significant investments into new capacities. Additional support Investment incentives of 15% for wind power. During a transition period the certificate trading scheme will be complemented by targeted support for wind power production in the form of environmental bonus, ( In case of a premium tariff, RES-E generators earn in addition to the (compared to fixed rate lower) premium tariff the revenues from the selling of their electricity on the power market. 14 Depending on the plant size: <5kW: 360 /MWh or >5kW: 180 /MWh Page 19
24 /MWh) for wind energy in This will be progressively be phased out by The environmental tax benefits can make some biomass CHP systems competitive. Status of RES-E market Main barriers Renewables cover currently approximately 50% of the Swedish total electricity consumption. This supply is covered mainly by hydro power. The use of biomass has increased substantially over the past decade, but this growth is mainly based on biomass co-firing, which can be profitable in the present quota system. New investments in biomass generation capacity is limited. Wind capacity installed in Sweden is relatively low although the wind resource in the south of the country is comparable to Denmark. Low penalty level set in the quota system leads to the strategy to fulfil the quota through buy-out. The Government has declared that in the (near) future the certificate system may be opened for import. This market opening may pose a threat for investments in renewables in Sweden if a level playing field with the relevant import country (Norway) is lacking. United Kingdom Main instrument Quota / TGC Main details implementation Quota obligation (based on TGCs) for all RES-E: Increasing from 3% in 2003 up to 10.4% by 2010 and 15.4% in The non-compliance buy-out price for was set at 30.51/MWh (45 /MWh), for at 31.39/MWh (45 /MWh), for at 32.33/MWh (48 /MWh). The actual certificate price is typically higher than the buyout price due to the system of recycle payments. Additional support Status of RES-E market In addition to the TGC system, eligible RES-E are exempt from the Climate Change Levy certified by Levy Exemption Certificates (LEC s), which cannot be separately traded from physical electricity. The 2004 levy rate is 4.3 /MWh (6.3 /MWh). Investment grants in the frame of different programs (e.g. Clear Skies Scheme, DTI s Offshore Wind Capital Grant Scheme, the Energy Crops Scheme, Major PV Demonstration Program and the Scottish Community Renewable Initiative). The UK RES market can probably be called the most mature market among the countries with quota obligations in Europe. The relative success of the systems is partially based on the fact that buy-out revenues for non-compliances are recycled to the suppliers in proportion to the certificates they have used for complying with the obligation. This mechanism increased the certificate price above the buy-out price because the market is short. High prices in the first year gave the Renew- Page 20
25 able obligation certificate market a kick- start. Targets specified for 2010 and 2020 and duration specified until Compared to other quota systems the UK system provides a higher long-term security for achieving targets and for renewable energy investors. Main barriers Grid connection issues and grid capacities as well as severe competition on the electricity market disadvantage RES despite of the support programs. Page 21
26 4 EFFECTIVENESS OF THE IMPLEMENTED SUPPORT SCHEMES IN SELECTED EU MEMBER STATES Under the effectiveness of a policy scheme for the promotion of renewable electricity we understand the increase of electricity generation potential15 due to this policy as compared to a suitable reference quantity. Such a reference quantity could be the additional available renewable electricity generation potential16 or the gross electricity consumption. We define the effectiveness of a Member State policy in the following as the ratio of the change of the electricity generation potential during a given period of time and the additional realisable mid-term potential until 2020 for a specific technology, where the exact definition of the effectiveness reads as follows: E E G i n i n i n = ADD i Gn Gn 1 i ADD POTn 1 Effectiveness Indicator for RES technology i for the year n Electricity generation potential by RES technology i in year n i POT Additional generation potential of RES technology i in year n until 2020 n i This definition of the effectiveness has the advantage of giving an unbiased indicator with regard to the available potentials of a specific country for individual technologies. Member States, only need to develop specific RES-E sources proportionally to the given potential to show comparable effectiveness of their instruments. This appears to be the correct approach because the Member State targets determined in the RES-E directive are also derived based mainly on the realisable generation potential of each country. In the following section we will show this effectiveness indicator for the sectors wind onshore and PV for the period and for solid biomass and biogas for the period As in most EU Member States, significant policy changes took effect during this period. The evolution of the main support instrument for each country is given in Figure 8. This figure shall serve as the relevant basis for the interpretation of the effectiveness indicator presented. As can be seen, only Austria, Finland, Germany, Ireland and Spain did not experi- 15 The electricity generation potential represents the normalised output potential of all plants installed up to the end of each year. Of course, the figures for actual generation and generation potential differ in most cases due to the fact that, in contrast to the actual data, the potential figures represent normal conditions, e.g. in case of hydropower, the normal hydrological conditions, and furthermore, not all plants are installed at the beginning of each year. 16 The additional potential up to 2020 used in this report is based on the figures derived in the EU projects Green-X and FORRES 2020, which have been officially used by the European Commission do analyse future targets for renewable energies up to Page 22
27 ence a major policy shift during the period Belgium, Sweden and the UK changed their instruments into quota systems based on tradable green certificates during 2002 or later. Although the introduction of the new systems in these Member States took place during or after 2002, the policy changes caused investment instabilities even in the periods before this date. Therefore, for the period (or ) for which the effectiveness indicator is analysed in the subsequent section, a mixed policy is considered in Belgium, France, Italy, Sweden and the UK. In principle it would seem desirable to present temporal correlations between the implemented policies and the effectiveness indicator which are both known in the time domain. However, previous analyses have shown that only restricted information results from the temporal representation of the effectiveness indicator. Therefore we will show this quantity as an average value for the period for case of biogas and solid biomass and for the case of wind on-shore and PV. AT BE Wind Bioenergy PV Wind Bioenergy PV Feed-in system Quota/TGC FI FR Wind Bioenergy PV Wind Bioenergy PV Tender Tax incentives change of the system DE Wind Bioenergy PV adaptation of the system IE Wind Bioenergy PV IT Wind Bioenergy PV ES Wind Bioenergy PV SE Wind Bioenergy PV UK Wind Bioenergy PV Figure 8. Evolution of the main policy support scheme in selected EU Member States Figure 9 shows the average annual effectiveness indicator for wind on-shore electricity generation for the years for all countries selected in the present analysis. Page 23
28 Several messages can be derived from this figure. Firstly, the three Member States Germany, Spain, and Ireland with the highest effectiveness during the considered period did not experience a major policy shift during the entire period Even more striking is the fact that Germany and Spain - two countries with long term stability of RES-E support based on feed-in systems - show a significantly higher effectiveness than the rest of the countries considered here. The high investment security and low administrative and regulative barriers have stimulated a strong and continuous growth in wind energy during the last decade. It is commonly stated that the high level of the feed-in tariffs would be the main driver for investments in wind energy in these two countries. However, as will be shown at the end of this section in Figure 15 and Figure 18, the tariff level is not particularly high in the two countries when compared with the other countries analysed here. The conclusion can therefore be drawn that a long term and stable policy environment is a key criterion for success in developing RES markets. As can be observed in a country like France, high administrative barriers can significantly hamper the development of wind energy even under a stable policy environment combined with reasonably high feed-in tariffs. A detailed analysis of the main barriers and success factors in wind energy for each of the countries analysed is given in Table 2. 10% average annual effectiveness indicator [%] 8% 6% 4% 2% Tax incentives/rebates Quota / tradable green certificates Feed-in tariffs Tender 0% Figure 9. AT BE FI FR DE IE IT ES SE UK EU 15 Effectiveness indicator for wind on-shore electricity in the period Note: The relevant policy schemes during this period are shown in different colours Page 24
Recent developments of feed-in systems in the EU A research paper for the International Feed-In Cooperation
 1 Recent developments of feed-in systems in the EU A research paper for the International Feed-In Cooperation January 2012 A report commissioned by the Ministry for the Environment, Nature Conservation
Renewable and Sustainable Energy Reviews
 Renewable and Sustainable Energy Reviews 15 (2011) 1003 1034 Contents lists available at ScienceDirect Renewable and Sustainable Energy Reviews journal homepage: www.elsevier.com/locate/rser A historical
IEWT 2011 TOWARDS AN EFFECTIVE AND EFFICIENT RES TARGET FULFILLMENT FROM BAU TO STRENGTHENED NATIONAL POLICIES WITH PROACTIVE RISK MITIGATION
 TOWARDS AN EFFECTIVE AND EFFICIENT RES TARGET FULFILLMENT FROM BAU TO STRENGTHENED NATIONAL POLICIES WITH PROACTIVE RISK MITIGATION Vienna University of Technology, 7 th IEWT Slide 1 Cost estimates of
Implementing the cooperation mechanisms of the RES directive current status and open questions
 Implementing the cooperation mechanisms of the RES directive current status and open questions Corinna Klessmann, Ecofys Germany RE-SHAPING Workshop, Vilnius, 16.05.2011 Supported by Intelligent Energy
Emerging market for Green Certificates
 Emerging market for Green Certificates Dr Marianne OSTERKORN, Director of REEEP Dr Xavier LEMAIRE, SERN/REEEP CONTENT 1. What is a certificate system? 2. How certificates system works 3. What are the benefits
ERMInE Database. Presentation by Nils Flatabø SINTEF Energy Research. ERMInE Workshop 2 - Northern Europe Oslo, 1. November 2006
 ERMInE Database Presentation by Nils Flatabø SINTEF Energy Research ERMInE Workshop 2 - Northern Europe Oslo, 1. November 26 Overview Content of the Ermine Database Electronic Questionnaire RTD&D Data
Sectoral RES and EE targets for 2030: a cost-effective option to achieve the EU s climate and energy objectives?
 Briefing paper 1 Sectoral RES and EE targets for 2030: a cost-effective option to achieve the EU s climate and energy objectives? Anne Held, Mario Ragwitz, Wolfgang Eichhammer, Frank Sensfuss (Fraunhofer
Summary of the Impact assessment for a 2030 climate and energy policy framework
 Summary of the Impact assessment for a 2030 climate and energy policy framework Contents Overview a. Drivers of electricity prices b. Jobs and growth c. Trade d. Energy dependence A. Impact assessment
Renewable Energy Sources (RES) Support Levels, 2009
 Support Levels, 2009") Austria Hydropower Green electricity act Feed-in tariff (incentive only) 3.25 644,000 5.05 Wind (onshore) Green electricity act Feed-in tariff (incentive only) 59.46 1,915,000 31.05 Biomass Green electricity
Austria Hydropower Green electricity act Feed-in tariff (incentive only) 3.25 644,000 5.05 Wind (onshore) Green electricity act Feed-in tariff (incentive only) 59.46 1,915,000 31.05 Biomass Green electricity
How To Set Up A Power Station
 Renewable Energy policies in the EU Member States Indicators assessing market status, policy effectieness & efficiency Mario Ragwitz, Fraunhofer ISI Max Rathmann, ECOFYS 0 Main support policies for RES
Germany's energy transition: Status quo and Challenges.
 Ulrich Benterbusch Germany's energy transition: Status quo and Challenges. 2 nd Session Group of Experts on Renewable Energy, UNECE, Geneva 1 Agenda. Energy transition: Status quo and official goals. German
RENEWABLE ENERGY BURDEN SHARING REBUS
 May 2001 ECN-C--01-030 RENEWABLE ENERGY BURDEN SHARING REBUS Effects of burden sharing and certificate trade on the renewable electricity market in Europe M.H. Voogt M.A. Uyterlinde M. de Noord K. Skytte*
Renewable Energy Sources Act (EEG) Key features, development and perspectives
 Key features, development and perspectives") Renewable Energy Sources Act (EEG) Key features, development and perspectives Nicolas Oetzel Federal Ministry for the Environment, Nature Conservation and Nuclear Safety Division KI III 1, General and
Renewable Energy Sources Act (EEG) Key features, development and perspectives Nicolas Oetzel Federal Ministry for the Environment, Nature Conservation and Nuclear Safety Division KI III 1, General and
ON THE SUCCESS OF POLICY STRATEGIES FOR THE PROMOTION OF ELECTRICITY FROM RENEWABLE ENERGY SOURCES IN THE EU
 ON THE SUCCESS OF POLICY STRATEGIES FOR THE PROMOTION OF ELECTRICITY FROM RENEWABLE ENERGY SOURCES IN THE EU Anne Held 1, Reinhard Haas 2, Mario Ragwitz 1 1 Fraunhofer Institute for Systems and Innovation
Germany's renewable energy sector in the context of energy transition.
 Oliver Frank Germany's renewable energy sector in the context of energy transition. May 11 th, Hong Kong 1 Agenda. About dena Energy transition / main trends in the German energy sector Renewable Energies
The Transition to Tendering Perspective from the Manufacturing Industry
 The Transition to Tendering Perspective from the Manufacturing Industry Johannes Schiel, VDMA Power Systems Berlin, 12.11.2015 Lessons from Denmark Agora Event 2: Towards a Renewable Future - Energy Scenarios,
SURVEY ON THE TRAINING OF GENERAL CARE NURSES IN THE EUROPEAN UNION. The current minimum training requirements for general care nurses
 SURVEY ON THE TRAINING OF GENERAL CARE NURSES IN THE EUROPEAN UNION This survey serves as a background document for the discussion of the Commission's legislative proposal to modernize the minimum requirements
OVERVIEW OF PURCHASE AND TAX INCENTIVES FOR ELECTRIC VEHICLES IN THE EU
 01.04.2014 OVERVIEW OF PURCHASE AND TAX INCENTIVES FOR ELECTRIC VEHICLES IN THE EU This table provides an overview of the incentives that are granted in the Member States of the European Union for the
2020 RES scenarios for Europe
 22 RES scenarios for Europe - are Member States well on track for achieving 22 RES targets? Authors: Gustav Resch, Lukas Liebmann, André Ortner, Sebastian Busch TU VIENNA / EEG Vienna, September 214 Compiled
Renewable Electricity and Liberalised Markets REALM. JOULE-III Project JOR3-CT98-0290 GREECE ACTION PLAN. By ICCS / NTUA K. Delkis
 Renewable Electricity and Liberalised Markets REALM JOULE-III Project JOR3-CT98-0290 GREECE ACTION PLAN By ICCS / NTUA K. Delkis October 1999 INTRODUCTION AND BACKGROUND Background to Renewable Energy
THE GREEN ELECTRCITY MARKET IN DENMARK: QUOTAS, CERTIFICATES AND INTERNATIONAL TRADE. Ole Odgaard Denmark
 Workshop on Best Practices in Policies and Measures, 11 13 April 2000, Copenhagen THE GREEN ELECTRCITY MARKET IN DENMARK: QUOTAS, CERTIFICATES AND INTERNATIONAL TRADE Ole Odgaard Denmark Abstract: The
Design of Feed-in Tariffs for Sub-5MW Electricity in Great Britain. Quantitative analysis for DECC. Final Report. July 2009 URN 09D/704
 Design of Feed-in Tariffs for Sub-5MW Electricity in Great Britain Quantitative analysis for DECC July 2009 URN 09D/704 Element Energy Limited 60 Newman Street London W1T 3DA Tel: 020 7462 5299 Fax: 020
Renewable Energy Promotion Policies in Taiwan. Bureau of Energy Ministry of Economic Affairs
 Renewable Energy Promotion Policies in Taiwan Bureau of Energy Ministry of Economic Affairs October 2015 1 Outline Current Development of Renewables in Taiwan Taiwan s New Renewable Energy Policy 2 Current
Report on the Possibility for Insurance Companies to Use Hedge Funds 1
 CEIOPS-DOC-06/05 Rev.1 Report on the Possibility for Insurance Companies to Use Hedge Funds 1 December 2005 1. Introduction The purpose of this survey is to gather information at Community level on the
Trading green or white certificates for the sake of the environment or for the sake of traders?
 Trading green or white certificates for the sake of the environment or for the sake of traders? Reinhard Haas, Demet Suna & Gustav Resch Institute for Power Systems and Energy Economics Energy Economics
Renewable energy sources penetration in most of BSEC countries
 Renewable energy sources penetration in most of BSEC countries Prof. Dimitrios MAVRAKIS Director Energy Policy and Development Centre (KEPA) National and Kapodistrian University of Athens Energy Policy
Examples for financing of biogas projects in Italy
 IEE Project BiogasIN Examples for financing of biogas projects in Italy D.3.2., WP3 - Henning Hahn, Dominik Rutz, Erik Ferber, Franz Kirchmayer - November 2010 Contents 1. Introduction... 3 2. Basics of
Effects of a White Certificate trading scheme on the energy system of the EU-27
 Effects of a White Certificate trading scheme on the energy system of the EU-27 Ralf Kuder Institute of Energy Economics and the Rational Use of Energy University of Stuttgart 08.09.2009, Vienna Overview
CO2 BASED MOTOR VEHICLE TAXES IN THE EU IN 2015
 CO2 BASED MOTOR VEHICLE TAXES IN THE EU IN 2015 COUNTRY AT (AUSTRIA) BE (BELGIUM) BG (BULGARIA) CO2/FUEL CONSUMPTION TAXES A fuel consumption tax (Normverbrauchsabgabe or NoVA) is levied upon the first
ANALYSIS OF THE STAKEHOLDER CONSULTATION ON
 ANALYSIS OF THE STAKEHOLDER CONSULTATION ON Science and Technology, the key to Europe s future: guidelines for future European policy to support research COM(353)2004 DG Research, European Commission,
Nagel:Renewable Energy in Europe
 Nagel:Renewable Energy in Europe 1. An example: The German Renewable Energy Sources Act (EEG) of 2000, 2. Factual development in the EU 3. The bill of 2004 4. The RES-Electricity Directive of 2001 5. The
Renewable Energy Promotion Policies in Chinese Taipei
 Renewable Energy Promotion Policies in Chinese Taipei Bureau of Energy, Ministry of Economic Affairs Chinese Taipei November 12, 2014 RE for CT - 1 Current Development of Renewables in Chinese Taipei RE
Environment and energy briefing from Burges Salmon published in the March 2014 issue of The In-House Lawyer:
 Environment and energy briefing from Burges Salmon published in the March 2014 issue of The In-House Lawyer: Electricity market reform: an update on contracts for difference Electricity market reform:
Yongmin Zhang, Wenwen Liu. University of Nottingham Ningbo China, Ningbo, China
 Management Studies, April 2015, Vol. 3, No. 3-4, 110-128 doi: 10.17265/2328-2185/2015.0304.005 D DAVID PUBLISHING Some Recommendations for Improving Renewable Energy Policies in China Yongmin Zhang, Wenwen
RES policy design implications: The impact of volatile energy and raw material prices
 The impact of volatile energy and raw material prices Authors: Christian Panzer, Gustav Resch Energy Economics Group, Vienna University of Technology Contact: Web: http://eeg.tuwien.ac.at Email: panzer@eeg.tuwien.ac.at
Subsidising Biomass Electricity - Contracts for Difference and what they mean for dedicated and converted biomass power stations
 January 2014 Subsidising Biomass Electricity - Contracts for Difference and what they mean for dedicated and converted biomass power stations New Government support for renewable electricity, and hence
Investing in renewable technologies CfD contract terms and strike prices
 Investing in renewable technologies CfD contract terms and strike prices December 2013 Crown copyright 2013 You may re-use this information (not including logos) free of charge in any format or medium,
THE AMENDED RENEWABLE ENERGY SOURCES ACT 2014 (EEG 2014)
") THE AMENDED RENEWABLE ENERGY SOURCES ACT 2014 (EEG 2014) 18.08.2014 Energy Regulatory & Governmental Affairs The Amended Renewable Energy Sources Act 2014 (EEG 2014) With the most recent amendment of the
THE AMENDED RENEWABLE ENERGY SOURCES ACT 2014 (EEG 2014) 18.08.2014 Energy Regulatory & Governmental Affairs The Amended Renewable Energy Sources Act 2014 (EEG 2014) With the most recent amendment of the
Renewable Energy Certificate systems in Europe (the path to international trade)
") Renewable Energy Certificate systems in Europe (the path to international trade) Marcel Galjee Board member RECS International Athens, March 31 st 2004 Outline of the presentation About RECS RECS International
Renewable Energy Certificate systems in Europe (the path to international trade) Marcel Galjee Board member RECS International Athens, March 31 st 2004 Outline of the presentation About RECS RECS International
This seeks to define Contracts for Difference (CfDs) and their relevance to energy related development in Copeland.
 and their relevance to energy related development in Copeland.") Contracts for Difference and Electricity Market Reform LEAD OFFICER: REPORT AUTHOR: John Groves Denice Gallen Summary and Recommendation: This seeks to define Contracts for Difference (CfDs) and their
Contracts for Difference and Electricity Market Reform LEAD OFFICER: REPORT AUTHOR: John Groves Denice Gallen Summary and Recommendation: This seeks to define Contracts for Difference (CfDs) and their
Renewable Energy Projections as Published in the National Renewable Energy Action Plans of the European Member States
 Renewable Energy Projections as Published in the National Renewable Energy Action Plans of the European Member States This update covers 21 countries L.W.M. Beurskens M. Hekkenberg ECN-E--10-069 1 October
The energy industry and energy price issues in Slovakia during recent years 1
 The energy industry and energy price issues in Slovakia during recent years 1 Ing. Mikulá Cár, PhD. National Bank of Slovakia The energy industry and energy prices are becoming a subject of political decisions
Electricity Generation Costs
 October 2012 Introduction Electricity generation costs are a fundamental part of energy market analysis, and a good understanding of these costs is important when analysing and designing policy. DECC regularly
Integrating 300 GW wind power in European power systems: challenges and recommendations. Frans Van Hulle Technical Advisor
 Integrating 300 GW wind power in European power systems: challenges and recommendations Frans Van Hulle Technical Advisor Worldbank, SDN Week, Washington, February 21-22, 2008 Leonard Crettaz What is the
Experiences and future perspectives of biomethane in Germany from a regulatory perspective
 Experiences and future perspectives of biomethane in Germany from a regulatory perspective Dr. Wolfgang Urban Ecologic Institute On secondment to the Federal Ministry for the Environment, Nature Conservation
Study on comparison tools and third-party verification schemes
 Justice and Consumers Study on comparison tools and third-party verification schemes ECCG 25/03/2015 Julien Brugerolle JUST E6 Introduction Study objectives Explore consumer behavioural patterns in the
Public Debt and Contingent Liabilities: A Cross-Country Comparison
 Public Debt and Contingent Liabilities: A Cross-Country Comparison Melchior Vella and Gevit Duca * 1. Contingent Liabilities 1.1 What are contingent liabilities? Contingent liabilities are obligations
INNOBAROMETER 2015 - THE INNOVATION TRENDS AT EU ENTERPRISES
 Eurobarometer INNOBAROMETER 2015 - THE INNOVATION TRENDS AT EU ENTERPRISES REPORT Fieldwork: February 2015 Publication: September 2015 This survey has been requested by the European Commission, Directorate-General
Renewable energy incentive program
 Switzerland Renewable energy incentive program This document may not be reproduced or transmitted in any form or by any means, electronic or mechanical, for any purpose, without our prior written permission.
Options for financing biogas plants
 IEE Project BiogasIN Options for financing biogas plants D.5.5, WP 5 Dominik Rutz Erik Ferber WIP Renewable Energies Sylvensteinstr. 2 81369 Munich, Germany February 2011 Contents 1. Introduction... 3
TRENDS 2015 IN PHOTOVOLTAIC APPLICATIONS EXECUTIVE SUMMARY
 TRENDS 2015 IN PHOTOVOLTAIC APPLICATIONS EXECUTIVE SUMMARY Report IEA-PVPS T1-27:2015 FOREWORD.... The IEA PVPS Programme is proud to provide you with its 20 th edition of the international survey report
Renewable energy opportunities in the transformation of the energy system
 Renewable energy opportunities in the transformation of the energy system Dipl.Ing. Josef Plank, R 20 Vienna 2014 10 09 President of Renewable Energy Austria (EEÖ) Managing Director of RENERGIE GmbH Energy
State of the art of solid biomass technologies in Germany
 Energy State of the art of solid biomass technologies in Germany Jens Giersdorf Deutsches Biomasseforschungszentrum gemeinnützige GmbH (DBFZ) November 27, 2012, São Paulo, Brazil www.german-renewable-energy.com
Wind in power 2014 European statistics. February 2015 THE EUROPEAN WIND ENERGY ASSOCIATION
 Wind in power 2014 European statistics February 2015 1 WIND IN POWER: 2014 EUROPEAN STATISTICS Contents Executive summary... 3 2014 annual installations... 5 Wind power capacity installations... 5 Power
RE-Shaping: Shaping an effective and efficient European renewable energy market
 D23 Final Report: RE-Shaping: Shaping an effective and efficient European renewable energy market Authors: Mario Ragwitz, Simone Steinhilber, Barbara Breitschopf; FRAUNHOFER ISI Gustav Resch, Christian
INTRODUCTION... 2. I. Participation in the 2014 European elections... 3
 ?? Directorate-General for Communication PUBLIC OPINION MONITORING UNIT 2014 EUROPEAN ELECTIONS DESK RESEARCH Brussels, April 2015 Profile of voters and abstainees in the European elections 2014 INTRODUCTION...
Feed-In Systems in Germany and Spain and a comparison
 1 Feed-In Systems in Germany and Spain and a comparison Dr. Mario Ragwitz*, Dr. Claus Huber * corresponding author: Fraunhofer Institut für Systemtechnik und Innovationsforschung Breslauer Str. 48, D-76139
SPANISH EXPERIENCE IN RENEWABLE ENERGY AND ENERGY EFFICIENCY. Anton Garcia Diaz Economic Bureau of the Prime Minister
 SPANISH EXPERIENCE IN RENEWABLE ENERGY AND ENERGY EFFICIENCY Anton Garcia Diaz Economic Bureau of the Prime Minister «Symposium on Strengthening Sino-Spain cooperation in multiple Fields» New Energy Cooperation
DOCTORAL (Ph.D) THESIS
 THESIS") DOCTORAL (Ph.D) THESIS UNIVERSITY OF KAPOSVÁR FACULTY OF ECONOMIC SCIENCE Department of Finance and Economics Head of Doctors School: DR. GÁBOR UDOVECZ Doctor of the Hungarian Academy of Sciences Supervisor:
DOCTORAL (Ph.D) THESIS UNIVERSITY OF KAPOSVÁR FACULTY OF ECONOMIC SCIENCE Department of Finance and Economics Head of Doctors School: DR. GÁBOR UDOVECZ Doctor of the Hungarian Academy of Sciences Supervisor:
OBSTACLES TO GREEN ELECTRICITY GENERATION BUSINESS
 OBSTACLES TO GREEN ELECTRICITY GENERATION BUSINESS Arta Denina¹, Janis Zvanitajs² Riga Technical University Faculty of Engineering and Management Meza str. 1/7, Riga, LV-1048, Latvia E-mail: ¹arta.denina@gmail.com,
Methodologies for estimating Levelised Cost of Electricity (LCOE) Implementing the best practice LCoE methodology of the guidance
 Implementing the best practice LCoE methodology of the guidance") Methodologies for estimating Levelised Cost of Electricity (LCOE) Implementing the best practice LCoE methodology of the guidance Methodologies for estimating Levelised Cost of Electricity (LCOE) Implementing
Methodologies for estimating Levelised Cost of Electricity (LCOE) Implementing the best practice LCoE methodology of the guidance Methodologies for estimating Levelised Cost of Electricity (LCOE) Implementing
Estimating the Price of ROCs
 Estimating the Price of ROCs Jeff Bryan Ian Lange Alex MacDonald Stirling Economics Discussion Paper 2013-08 July 2013 Online at http://www.management.stir.ac.uk/research/economics/workingpapers Estimating
EUROPEAN SEMESTER THEMATIC FICHE ACCESS TO FINANCE
 EUROPEAN SEMESTER THEMATIC FICHE ACCESS TO FINANCE Access to finance is key to business development. Investment and innovation are not possible without adequate financing. A difficulty in getting finance
Our patent and trade mark attorneys are here to help you protect and profit from your ideas, making sure they re working every bit as hard as you do.
 Our patent and trade mark attorneys are here to help you protect and profit from your ideas, making sure they re working every bit as hard as you do. Our people work with everyone from multi-nationals
User language preferences online. Analytical report
 Flash Eurobarometer 313 The Gallup Organization Flash Eurobarometer European Commission User language preferences online Analytical report Fieldwork: January 2011 Publication: May 2011 This survey was
Success story: Feed-In Tariffs Support renewable energy in Germany
 Success story: Feed-In Tariffs Support renewable energy in Germany This document will show how this success story has been brought about and is made up of the following sections: 1. What is a Feed-In Tariff?
Energy Efficiency and Renewable Energy Sources in Sweden
 Energy Efficiency and Renewable Energy Sources in Sweden Swedish Energy Agency www.stem.se Yelena Varasteh yelena.varasteh@stem.se Slovakia, 24-25 April 2006 Total energy supply in Sweden in 2004 Total
TURKEY S HYDROPOWER POTENTIAL and
 ERE OTOPRODÜKTÖR, ELEKTRİK ÜRETİM, İLETİM ve DAĞITIM SANAYİ ve TİCARET A.Ş. TURKEY S HYDROPOWER POTENTIAL and REVIEW of ELECTRICITY GENERATION POLICIES from EU PERSPECTIVE FEASIBILITY CRITERIA FOR HEPP
Country profiles: Austria
 Country profiles: Austria Last updated: date (09/05/2014) 1 Implementation of Tracking Systems As electricity tracking system Austria uses electricity disclosure, which provides consumers with details
European judicial training 2014. Justice
 European judicial training 2014 Justice Europe Direct is a service to help you find answers to your questions about the European Union. Freephone number (*): 00 800 6 7 8 9 10 11 (*) Certain mobile telephone
REDUCTION OF BUREAUCRATIC BARRIERS FOR SUCCESSFUL PV DEPLOYMENT IN THE EU KEY RECOMMENDATIONS
 REDUCTION OF BUREAUCRATIC BARRIERS FOR SUCCESSFUL PV DEPLOYMENT IN THE EU KEY RECOMMENDATIONS September 2011 THE PV LEGAL PROJECT Many countries have already recognised the potential of solar energy and
Long Term Potentials and Costs of RES Part I: Potentials, Diffusion and Technological learning
 D10 Report Long Term Potentials and Costs of RES Part I: Potentials, Diffusion and Technological learning Authors: Ric Hoefnagels, Martin Junginger, COPERNICUS INSTITUTE / UTRECHT UNIVERSITY Christian
Executive Summary. The core energy policy is as follows:
 Executive Summary Energy management must become more sustainable and less dependent on increasingly scarce fossil fuels. Energy is a fundamental element of the economy, and the Netherlands must do more
Quantifying the "merit-order" effect in European electricity markets
 Rapid Response Energy Brief Quantifying the "merit-order" effect in European electricity markets Lead author: Paul Deane (UCC) Authoring team: Seán Collins, Brian Ó Gallachóir (UCC), Cherrelle Eid (IFRI),
Energy Efficiency in SMEs: Success Factors and Obstacles
 Energy Efficiency in SMEs: Success Factors and Obstacles CHANGE Chambers Promoting Intelligent Energy for SMEs The present survey was carried out in the framework of CHANGE. The CHANGE project helps SMEs
The Legal Protection Insurance Market in Europe. October 2013
 The Legal Protection Insurance Market in Europe October 2013 The Legal Protection Insurance Market in Europe October 2013 In its latest publication RIAD, the International Association of Legal Protection
Government response to the consultation on proposals for the levels of banded support under the Renewables Obligation for the period 2013-17 and the
 Government response to the consultation on proposals for the levels of banded support under the Renewables Obligation for the period 2013-17 and the Renewables Obligation Order 2012 July 2012 Government
Eugene Water Electric Board. Oregon Renewable Portfolio Standard 2015 Compliance Report. June 1, 2016
 Eugene Water Electric Board Oregon Renewable Portfolio Standard 2015 Compliance Report June 1, 2016 EWEB 2015 RPS Compliance Report Page 1 Introduction In 2007 Oregon enacted Senate Bill 838, the Oregon
Re-assessing Costs in the European Power Sector. July 2013
 Re-assessing Costs in the European Power Sector July 2013 The rise in non-conventional energy production in the United States along with the need to rebuild Europe s economy has led to a new focus and
FEED-IN TARIFF (FiT) IN MALAYSIA www.seda.gov.my
 IN MALAYSIA www.seda.gov.my") IN MALAYSIA www.seda.gov.my 1 Introduction to Feed-in Tariff Mechanism Feed-in Tariff mechanism oblige energy utilities to buy renewable energy from producers, at a mandated price. By guaranteeing access
IN MALAYSIA www.seda.gov.my 1 Introduction to Feed-in Tariff Mechanism Feed-in Tariff mechanism oblige energy utilities to buy renewable energy from producers, at a mandated price. By guaranteeing access
THE ROLE OF PUBLIC SUPPORT IN THE COMMERCIALISATION OF INNOVATIONS
 Flash Eurobarometer THE ROLE OF PUBLIC SUPPORT IN THE COMMERCIALISATION OF INNOVATIONS REPORT Fieldwork: January February 2014 Publication: May 2014 This survey has been requested by the European Commission,
SMES, RESOURCE EFFICIENCY AND GREEN MARKETS
 Eurobarometer SMES, RESOURCE EFFICIENCY AND GREEN MARKETS REPORT Fieldwork: September 2013 Publication: December 2013 This survey has been requested by the European Commission, Directorate-General for
Renewable Energy Sector in the EU: its Employment and Export Potential
 Renewable Energy Sector in the EU: its Employment and Export Potential A Final Report to DG Environment ECOTEC Research & Consulting Limited Priestley House 28-34 Albert Street Birmingham B4 7UD United
RETAILERS ATTITUDES TOWARDS CROSS- BORDER TRADE AND CONSUMER PROTECTION
 Eurobarometer RETAILERS ATTITUDES TOWARDS CROSS- BORDER TRADE AND CONSUMER PROTECTION REPORT Fieldwork: September - October 2012 Publication: June 2013 This survey has been requested by the European Commission,
Mål og virkemidler i de nordiske landenes handlingsplaner for Fornybar Energi
 Mål og virkemidler i de nordiske landenes handlingsplaner for Fornybar Energi Bjarne Juul-Kristensen Energistyrelsen, Nordiske Arbejdsgruppe for Fornybar Energi Content Targets and measures in RES-Directive
1. Measures to promote the use of biofuels or other renewable fuels for transport
 Important notice: this report has been submitted in the language of the Member State, which is the sole authentic version. Translation into the English language is being provided for information purposes
The coverage rate of social benefits. Research note 9/2013
 Research note 9/2013 SOCIAL SITUATION OBSERVATORY INCOME DISTRIBUTION AND LIVING CONDITIONS APPLICA (BE), EUROPEAN CENTRE FOR THE EUROPEAN CENTRE FOR SOCIAL WELFARE POLICY AND RESEARCH (AT), ISER UNIVERSITY
Renewable Energy Supply
 Renewable Energy Supply Financing RE Projects in Chile Rodrigo Violic Head of Project Finance, Banco BICE Bonn, Germany, June 3, 2015 The Chilean Energy Sector Current installed capacity of c. 20,000 MW
DANISH DISTRICT ENERGY PLANNING EXPERIENCE
 MOWAT ENERGY, A RESEARCH HUB AT THE MOWAT CENTRE, AT THE REQUEST OF THE ONTARIO MINISTRY OF ENERGY FUTURE INNOVATION IN ENERGY PLANNING: A SPECIAL SESSION TO ADVISE ON ONTARIO S LONG-TERM ENERGY FUTURE
Saving energy: bringing down Europe s energy prices
 Saving energy: bringing down Europe s energy prices Saving energy: bringing down Europe s energy prices By: Dr. Edith Molenbroek, Prof. Dr. Kornelis Blok Date: May 2012 Project number: BUINL12344 Ecofys
Renewable Energy Strategy for 2020 and Regulatory Framework. Eng. Hatem Amer Egyptian Electric Regulatory and Consumer Protection Agency
 Renewable Energy Strategy for 2020 and Regulatory Framework Eng. Hatem Amer Egyptian Electric Regulatory and Consumer Protection Agency Objectives of the Agency Regulate, supervise, and control all matters
Broadband Coverage in Europe Final Report 2009 Survey Data as of 31 December 2008. DG INFSO 80106 December 2009 IDATE 1
 Broadband Coverage in Europe Final Report 2009 Survey Data as of 31 December 2008 DG INFSO 80106 December 2009 IDATE 1 Table of contents 1. Methodological notes...5 2. Executive summary...7 3. European
Preparatory Paper on Focal Areas to Support a Sustainable Energy System in the Electricity Sector
 Preparatory Paper on Focal Areas to Support a Sustainable Energy System in the Electricity Sector C. Agert, Th. Vogt EWE Research Centre NEXT ENERGY, Oldenburg, Germany corresponding author: Carsten.Agert@next-energy.de
EUROPEAN YOUTH: PARTICIPATION IN DEMOCRATIC LIFE
 Flash Eurobarometer EUROPEAN YOUTH: PARTICIPATION IN DEMOCRATIC LIFE REPORT Fieldwork: April 2013 Publication: May 2013 This survey has been requested by the European Commission, Directorate-General for
Impacts of large-scale solar and wind power production on the balance of the Swedish power system
 Impacts of large-scale solar and wind power production on the balance of the Swedish power system Joakim Widén 1,*, Magnus Åberg 1, Dag Henning 2 1 Department of Engineering Sciences, Uppsala University,
European Experience with Tradable Green Certificates and Feed-in Tariffs for Renewable Electricity Support
 European Experience with Tradable Green Certificates and Feed-in Tariffs for Renewable Electricity Support Prepared by: Diana Poputoaia, M.Sc. Matthias Fripp, Ph.D. Environmental Change Institute, University
Contracts for Difference - the new support regime for low carbon generation
 Contracts for Difference - the new support regime for low carbon generation James Taylor Raj Bavishi 11 November 2014 UK Incentive Regimes Small scale Feed in Tariffs and the Renewables Obligations have
4th Basic Plan Targets of Renewable Energy Deployment
 Yeonji Kim 4th Basic Plan Targets of Renewable Energy Deployment Changes in 2035 RE Share Target ratio of waste has decreased largely PV Generation Capacity Target : 17.5GW by 2035 Expected Share of RE
Opportunities for the Georgian Hydropower industry to benefit from Directive 2009/28EC of the European Parliament
 Promotion hidroenergetikasi Project investiciebis (HIPP) Opportunities for the Georgian Hydropower industry to benefit from Directive 2009/28EC of the European Parliament What Europe wants to do Comply
INNOVATION IN THE PUBLIC SECTOR: ITS PERCEPTION IN AND IMPACT ON BUSINESS
 Flash Eurobarometer INNOVATION IN THE PUBLIC SECTOR: ITS PERCEPTION IN AND IMPACT ON BUSINESS REPORT Fieldwork: February-March 22 Publication: June 22 This survey has been requested by the European Commission,