COMMISSION STAFF WORKING DOCUMENT. Trends and Developments in European Energy Markets Accompanying the document
|
|
|
- Gordon Gilmore
- 8 years ago
- Views:
Transcription
1 EUROPEAN COMMISSION Brussels, SWD(2014) 310 final COMMISSION STAFF WORKING DOCUMENT Trends and Developments in European Energy Markets 2014 Accompanying the document COMMUNICATION FROM THE COMMISSION TO THE EUROPEAN PARLIAMENT, THE COUNCIL, THE EUROPEAN ECONOMIC AND SOCIAL COMMITTEE AND THE COMMITTEE OF THE REGIONS Progress towards completing the Internal Energy Market {COM(2014) 634 final} {SWD(2014) 311 final} {SWD(2014) 312 final} {SWD(2014) 313 final} {SWD(2014) 314 final} {SWD(2014) 315 final} EN EN
 634 final}")
2 Table of Contents 1. Energy position of the EU EU energy consumption Gross Inland Consumption Uses of energy sources by sector Energy intensity EU energy supply EU primary energy production EU electricity generation EU energy imports EU import dependency Recent developments in the European wholesale markets of natural gas Recent developments in the European wholesale markets of electricity

3 1. Energy position of the EU 1.1. EU energy consumption Gross Inland Consumption Gross inland consumption decreased by 4% between 2010 and Crude oil and petroleum products continued to dominate the energy mix, although their share decreased from 35.1% to 33.8%. Gas consumption decreased both in absolute and relative terms against feeble economic performance, weak electricity demand and growing role of solid fuels and renewables in the power sector. The quantity of gas consumed went down by 11%, reaching 393 mtoe in 2012 and the share of gas declined from 25.1% in 2010 to 23.4%. Nuclear energy retained its share, with the quantity consumed declining from mtoe in 2010 to mtoe in Two energy sources saw an increase in consumption and share: solid fuels and renewables. Solid fuel consumption increased from 280 mtoe in 2010 to 293 mtoe in 2012, its share growing from 15.9% to 17.5%. Renewables consumption went up from mtoe in 2010 to mtoe in 2012, its share growing from 9.8% in 2010 to 11% of gross inland consumption in Figure 1. EU-28 gross inland consumption (as % of total Mtoe) in 2012 Source: Eurostat (preliminary data for 2012) Uses of energy sources by sector 3

4 2012 final energy consumption was 5% below its 2010 levels with transport remaining the largest consumer of energy, followed by industry and households. Compared to 2010, the shares of different end use sectors remained fairly stable with transport at 32% (+0.5 p.p.), industry at 26% (+0.5 p.p.) and households at 26% (-0.7 p.p.). Figure 2. EU-28 total final energy consumption by end-use sector (in Mtoe) ( ) Source: Eurostat (preliminary data for 2012) Looking by fuel, between 2010 and 2012 against weak economic performance industrial gas consumption levels decreased even though the share of industry in in natural gas consumption went up slightly. Household gas consumption level and share went down between 2010 and

5 Figure 3. EU-28 Use of natural gas by sector (final consumption) (2012) Source: Eurostat (preliminary data for 2012) In the area of petroleum products, shares remained unchanged between 2010 and 2012, with transport accounting for about two thirds and industry for 22%. Solid fuels are predominantly used in industry, with a share of 75%. Figure 4. EU-28 use of petroleum products by sector (final consumption) (2012) Source: Eurostat (preliminary data for 2012) 5

6 Figure 5. EU-28 use of solid fuels by sector (final consumption) (2012) Source: Eurostat (preliminary data for 2012) Turning to electricity, total consumption went down by 2% between 2010 and In 2012 industry continues to be the largest consumer of electricity and in 2012 accounted for 86.6 mtoe (down from 88.5 mtoe in 2010), with the share of industrial electricity consumption in total electricity consumption slightly down, reaching 36% of the total. 6

7 Households and services each account for 30% of electricity consumption and together accounted for mtoe of electricity consumption in 2012 (households down by 2.5% and services by 0.6% relative to 2010). Figure 6. Use of electricity by sector (2012) Source: Eurostat (preliminary data for 2012) Energy intensity Energy intensity is an indicator of the amount of energy used to produce a unit of economic output. Final energy intensity measures the energy efficiency of the economy against final energy consumption that is the amount of energy finally available to different sectors after conversion of energy sources. At the level of the entire economy final intensity has been decreasing since the year 2000, although with a very minor increase between 2002 and This trend holds also for industry and transport: final intensity in the transport and industrial sectors has been on a downward trend apart from a slight increase between 2008 and 2009 for transport and between 2002 and 2003 for industry. Figure 7. EU final energy intensity (in toe/million EUR, ) Source: Eurostat (preliminary data for 2012) 7

8 8

9 1.2. EU energy supply EU primary energy production EU energy production decreased by more than 4.5% between 2010 and 2012, after a slight increase in Crude oil and petroleum products registered a 21% decrease in this period and gas production a 17% drop. Production of solid fuels showed a modest increase of 1.3%. Renewables production registered a 9% increase reaching 22% share of primary energy production second only to nuclear at 29%. Netherlands and the UK are the largest producers of natural gas in the EU and in 2012 respectively accounted for 43% and 26% of gas production in the EU; the third and fourth producers - Germany and Romania has a 7% and 6.5% share of natural gas production in the EU. The UK is the largest producer of crude oil and petroleum products in the EU with a 60% share in 2012; Denmark is the second largest producer with a 13% share. Between 1995 and 2012 the decrease in natural gas production reached 30%. Production crude oil and petroleum went down by 56% since 1995 and of solid fuels by 40%. Figure 8. EU-28 Primary energy production (in mtoe) ( ) Source: Eurostat (preliminary data for 2012) EU electricity generation Total electricity generation in 2012 was 3295 TWh 1, stable year-on-year. Solid fuels and nuclear each accounted for 27% of electricity generation: up by 2 p.p. in the case of solid fuels and stable in the 1 Note that we would advise against presenting historical data and comparing in detail (by fuel) 2011 to 2012 data in absolute terms due to a break in the series (methodological change) between 2011 and

10 case of nuclear in comparison to The share of natural gas in EU electricity generation continuously decreased from 24% in 2010, to 22% in 2011 and 19% in The share of oil remained stable at around. Cyprus and Malta are the two Member States that rely almost entirely on oil for electricity generation. In 2012 CO2-neutral sources, namely renewables and nuclear, accounted for 51% of EU electricity generation up from less than 45% in the 90s. Renewables accounted for 24% of electricity generation: 3 p.p. above the 2010 share. Hydro power remained the most important renewable source, representing 46% of renewable power generation, followed by wind (26% of renewable generation, up by 14% between 2011 and 2012) and biomass and waste (19% of renewable power generation, up by 12% between 2011 and 2012). In 2012 solar accounted for 9% of renewable electricity generation, up by impressive 50% between 2011 and 2012, following a doubling a production between 2010 and Figure 9. EU-28 gross electricity generation (as % of total = 3295 TWh) (2012) Source: Eurostat (preliminary data 2012) EU energy imports In line with lower energy consumption and electricity generation, in 2012 EU energy imports were 9% below the 2008 peak levels and indeed fell in third consecutive year, reaching 922 mtoe. After a significant drop over the period , imports of solid fuels and in particular of hard coal increased in 2011 and Solid fuel imports accounted for 13% of energy imports. In 2012 imports of crude oil and petroleum products registered a slight fall (-4.6% compared to 2010) and accounted for 58% of energy imports. Natural gas imports reached a new peak in 2010, but dropped by 2% to 259 mtoe since then and as of 2012 account for 28% of energy imports. 10

11 Figure 10. EU-28 net imports of energy (in mtoe) ( ) Source: Eurostat (preliminary data 2012) Partner countries differ from fuel to fuel, although some of them are key partners in a number of fuel categories. In 2012 Russia was the main exporter of crude oil and hard coal to the EU and on par with Norway in the natural gas exports. The list of the top six exporters of crude oil to the EU changed between 2010 and 2012 with Saudi Arabia, Libya and Nigeria exporting more to the EU than Norway that was previously second to Russia in crude oil exports. When it comes to hard coal exporters to the EU, Colombia and the US remained the second and third largest exporters. The increase in US exports of coal is related to increasing consumption of gas domestically. Against the background of weaker demand in the course of 2012 exports of natural gas from Norway to the EU rose to levels comparable with Russian natural gas exports. Norwegian companies have been actively changing their pricing policy with new Statoil contracts negotiated purely on a spot indexation basis. At the same time, Gazprom maintains that the oil price link is indispensable for longterm business planning, but has been offering a number of discounts in its long-term prices between 2011 and 2013 to a number of companies. By changing the price setting mechanism to gas-on-gas basis, Norway was able to retain consumers and in 2012 increase market share to the detriment of other exporters such as the Russian Federation and Algeria. 11

12 Figure 11. EU-28 imports of fossil fuels by country of origin (2012) Source: Eurostat (preliminary data 2012) EU import dependency The EU is the world's largest energy importer. The majority of MS are highly dependent on imports of oil and gas. A few MS have significant production that makes a considerable contribution to the EU energy balance. The UK and Romania satisfy a sizeable share of their needs with domestic production, while the Netherlands is an important net exporter of gas and Denmark of crude oil and petroleum products. The overall energy import dependency of the EU peaked in 2008, before falling in 2009 and At 53.3 in 2012, overall energy dependency in 2012 it was slightly higher than in 2010 driven by an increase in the import dependency for solid fuels and for crude oil and petroleum products. The downturn in the primary production of hard coal, lignite, crude oil and natural gas has led to a situation where the EU is increasingly reliant on primary energy imports in order to satisfy demand. Yet, at 42.2% import dependency of solid fuels is more than 2 p.p. below its peak in At the same time in 2012 crude oil and petroleum product dependency reached a historic high of 86.4%. The import dependency for gas peaked in 2011 before falling by 1.3 p.p. in 2012 to 65.8%. This dynamics was underpinned by a fast decrease in gross inland consumption of gas (-12% between 2010 and 2012) and a somewhat more moderate drop in import volumes (-5% between 2010 and 2012). Figure 12. EU import dependency (in %) ( ) 12

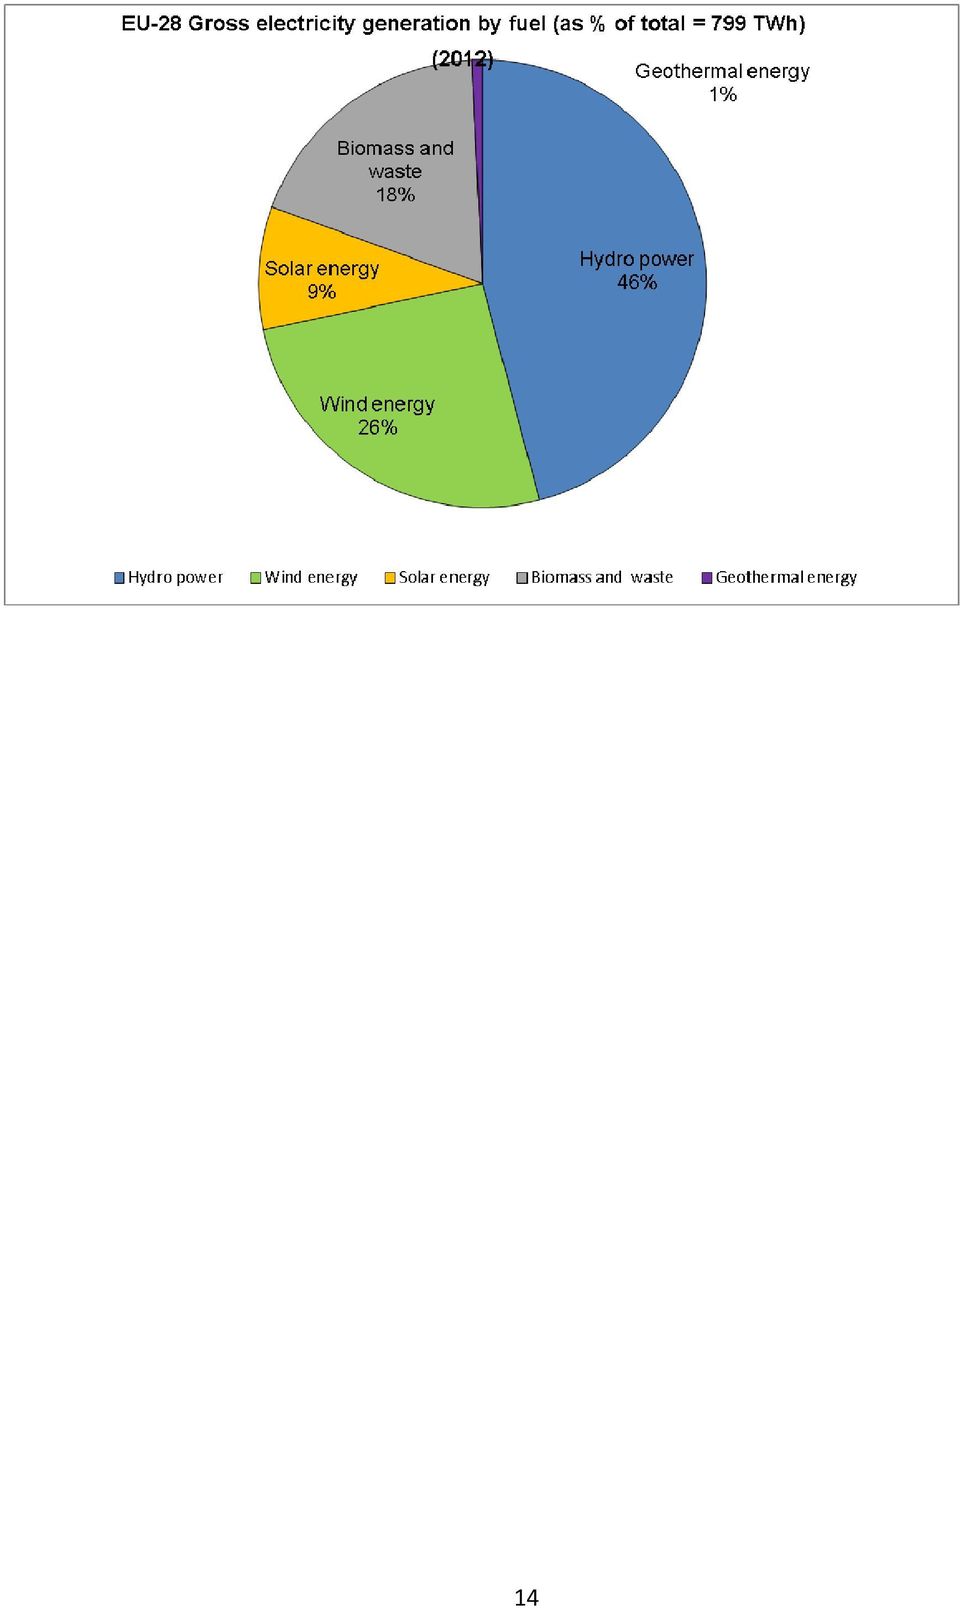
13 Source: Eurostat (preliminary data for 2012) Electricity from RES In 2012 the production of renewable electricity reached 799 TWh, an increase of more than 13% compared to Hydro power is the most important renewable electricity source and accounts for 46% of renewable electricity generation in the EU. The importance of RES other than hydro has been growing. Between 2011 and 2012 electricity from solar energy saw an impressive growth of more than 50%, with its share in renewable electricity generation reaching 9%. Electricity from wind registered a growth of about 14% and electricity from biomass and waste of about 12%. Figure 13. EU-28 Gross Electricity Generation by Renewable Energy Source Source: Eurostat (preliminary data 2012) 13

14 14
15 2. Recent developments in the European wholesale markets of natural gas The gross domestic product of the EU Member States registered a year-on-year increase of 0.5% during the third quarter of This ended a sequence of 5 consecutive quarters with negative or zero growth rates. The prolonged economic slowdown, still not over for some Member States, and the prospects of gradual recovery affected the economic decisions and actions of market participants in the EU energy markets throughout 2012 and Further to the difficult macroeconomic context, the actors in the EU markets of natural gas had to take into account the long-term prospects of the industry in terms of the replacement of decreasing indigenous production with imports from extra-eu trading partners and in terms of a general decoupling of energy consumption and economic growth, as illustrated in Figure 14. The consumption of natural gas in 2012 stood at TWh, representing a 2.7% decrease on a yearly basis. No lower level was recorded since Based on a preliminary 2013 data from Eurostat, 18 Member States registered further declines of gross inland consumption. Among the factors affecting these developments were the low levels of industrial demand and relatively mild weather conditions which affected demand for heating. The reduced consumption from power plants turned into an important factor: in 2012 and 2013 gas power plants were outcompeted by coal (as demonstrated by clean spark and dark spreads 2 ) and RES. Table 1 illustrates the reduced intake from power plants. Based on data from Platts Bentek, it appears that in 6 years, the gas consumption of power plants was reduced more than 3 times in Spain almost 2 times in the UK whereas Italian power plants reduced the in-take by more than 13 bcm per year. 2 Dark spreads are reported as indicative prices giving the average difference between the cost of coal delivered ex-ship and the power price. As such, they do not include operation, maintenance or transport costs. Spreads are defined for a coal-fired plant with 35 % efficiency. Clean dark spreads are defined as the average difference between the price of coal and carbon emission, and the equivalent price of electricity. Spark spreads are indicative prices showing the average difference between the cost of gas delivered on the gas transmission system and the power price. As such, they do not include operation, maintenance or transport costs. The spark spreads are calculated for gas-fired plants with standard efficiencies of 50% and 60%. Clean spark spreads are defined as the average difference between the cost of gas and emissions, and the equivalent price of electricity. 15

16 Table 1. Annual gas intake from power plants (bcm) Italy UK Spain Belgium n.a. n.a. n.a France n.a. n.a Source: Platts-Bentek As shown in Figure 14, the gradual decline in EU domestic production of natural gas continued throughout 2012, with the average decrease since the year of peak production (2001) amounting to 4%. Figure 14. Balance of natural gas in the EU Source: Eurostat (preliminary data 2012) 16
 amounting to 4%. Figure 14.")
17 In 2011 and 2012 falling imports of natural gas could also be observed along with falling consumption. This development is in contrast to observed trends in the three previous years. According to preliminary Eurostat data for 2012, the extra-eu gas imports totalled TWh (about 341 bcm 3 ) in 2012, with the most important trading partners being Norway and the Russian Federation (31% each), and Algeria (13%) and Qatar (8%). The combined part of Nigeria, Libya, Egypt, Trinidad & Tobago and others was less than 8% 4. An additional 40 bcm was imported by MS from intra-eu sources. The EU 28 import dependency 5 of natural gas increased from 0.43 in 1995 to 0.49 in 2000, to 0.57 in 2005, to 0.62 in 2010 and reached 0.66 in 2012 (preliminary figures). The majority of Member States tend to rely on imports as the major source for the gross inland consumption. Figure 15. Imports of natural gas in the EU-28 Source: Eurostat (preliminary data 2012) 3 Conversion rate used: 1 bcm = TWh (normal cubic meter, measured at 0 degree Celsius and 760 mm Hg), as defined by IEA Natural gas information: 4 The non-specified trading partner category of Eurostat may contain gas coming from the above-mentioned countries. 5 Import dependency is defined as the ratio of net imports over the sum of gross inland consumption and bunkers. The EU import dependency is net of intra EU trade; calculated at national level however, it includes the intra EU trade. 17

18 Between 2011 and 2012 the EU 28 total imports of natural gas decreased by 108 TWh, which is equivalent to slightly more than 10 bcm. The import evolution by transport delivery mode was quite different. As illustrated in Figure 15, an increase of imports of natural gas delivered by pipelines (12 bcm / year) was more than matched by a strong decrease of LNG deliveries (more than 22 bcm / year). As a result, the relative share of LNG in total gas supplied dropped from 20% in 2011 to 15% in Figure 16. LNG prices, selected countries The diversion of LNG cargoes to the Pacific basin in the aftermath of Fukushima is well documented 6 and Figure 16 provides further evidence for the more attractive pricing conditions in Japan (similar price levels were also observed in South Korea and China). The relative inflexibility of some market participants who are bound to long term contracts with take or pay obligations may be another reason of the decreasing relative share of LNG in total imports. 6 Check for example the regular publications of the Market observatory for energy here: 18

19 Based on the latest report from Prospex Research 7, the total traded volumes (including exchange spot and forward and OTC cleared and non-cleared) of the EU markets of natural gas stood at TWh in 2011, a fifth consecutive year of strong growth. This number compares to a gross inland consumption in the EU of TWh. The gas traded volumes are also approximately 4 times bigger than those recorded for electricity. The UK market is by far the most liquid, recording trading volumes above TWh. Market operators on the Dutch and German markets exchanged respectively TWh and TWh. The highest churn factors 8 were in the UK (23.6) and the Netherlands (16.3), followed by Austria (4.4), Belgium (4.2) and Germany (2.5) 9. OTC accounts for more than 80% of the traded volumes. Similar to electricity markets, the cleared OTC has a much smaller share than the non-cleared OTC under which the gas volumes from the long term contracts are recorded. Figure 17. Traded volumes of natural gas in selected hubs 7 European Gas Trading 2012, Prospex Research, 8 The churn factor is defined as the ratio of traded volume to physical consumption. It informs about the liquidity of the market place and the quality of the pricing signal that is discovered on that market. 9 The low churn factor for Germany on the gross market is due to the important share of long-term contracts. 19
 and the Netherlands (16.3), followed by Austria (4.")
20 As illustrated in Figure 17, in the period after 2011 hub traded volumes stabilized, registering varying fortunes across hubs (Netherlands 10 and the German hubs were among the more notable increases and hub volumes in the UK and Austria went down). The evolution of the overall traded volumes is not yet clear. Judging by data from the International Gas Union (see Figure 18), the relative share of natural gas delivered in the EU under hub based gas-on-gas competition continued to increase and reached almost 50% of the overall EU consumption. For the Member States that have developed mature hub trading, this share is well above 80%. Figure 18. Break-down of natural gas contracts by pricing mechanism in Europe (in share of consumption) Another indication of the difficult situation facing the gas fired power generators is provided by Figure 19 which traces the evolution of prices of competitive fuels against selected benchmark prices for gas in the EU. A persistent surplus of steam coal on the US market resulted from the gradual crowding out of coal by shale gas. These extra volumes of coal from the US but also Columbia and other countries were made available in the EU at competitive prices. In addition, a structural oversupply of ETS allowances kept a downward pressure on carbon prices. 10 GTS reports hub and OTC trades for the Netherlands. 20

21 Figure 19. Evolution of prices for competitive fuels versus European gas price benchmarks It is also interesting to observe the dynamics of gas prices by comparing the pure hub benchmark (such as the NBP price) against a hybrid price containing hub and oil indexation elements (such as the German border price). Whereas the hub benchmark was traded at a discount since 2010 and earlier, the spread was reduced by 2012 and in some cases hub prices were above the German border price. One factor that could explain the decrease of the spread is the more pronounced part of hub prices in the German border price as more and more suppliers are turning to this pricing mechanism; this can also be witnessed by the divergence of the German border price from a pure oil indexed benchmark with delivery in North Western Europe, such as the Platts Gas Contract indicator. Another factor may be linked to the relative stability of the major oil benchmarks providing a support for the long term gas prices indexed on oil. As illustrated by the map on next page, the divergence of the wholesale gas prices across the EU decreased somewhat; yet Member States with few supply choices were facing a tougher bargain and higher prices. 21
22 Figure 20. Comparison of EU-28 average wholesale gas prices during first half of
23 Figure 21. Evolution of the main gas hub benchmarks Figure 21 illustrates the strong correlation across the EU hub prices. By the second half of 2012 the Italian benchmark gradually aligned with the Austrian and then continental hub prices. The French PEG South price followed an opposite evolution, slowly diverging from the more traded PEG North price and then from the other hub prices as well. This evolution is most likely linked to the persistently low levels and capacities of gas storage, and the need of a strong pricing signal to ship gas flows from North to South. As a rule, the hub prices gave a fair representation of the supply and demand conditions in different trading areas and market participants were using the available trading opportunities to make sure prices were aligned. As shown in Table 2, the operation of the gas markets improved significantly in the last couple of years, as shown by the decrease of FAPD events 11 that measure irrational adverse flows. 11 Flow against price differentials (FAPDs): By combining daily price and flow data, Flow Against Price Differentials (FAPDs) are designed to give a measure of the consistency of economic decisions of market participants in the context of close to real time operation of natural gas systems. With the closure of the day-ahead markets (D-1), the price for delivering gas in a given hub on day D is known by market participants. Based on price information for adjacent areas, market participants can establish price differentials. Later in D-1, market participants also nominate commercial schedules for day D. An event labelled as an FAPD occurs when commercial nominations for cross border capacities are such that gas is set to flow from a higher price area to a lower price area. The FAPD event is defined by the minimum 23
24 Table 2. FAPD events by selected adjacent areas # observations / year BE-NL BE-UK NL-UK FR PEG Nord FR PEG Sud AT-IT AT-DE Average FAPD events selected Sources. (1) Price data: Platts; (2) Flow nomination data: Fluxys, BBL, ENTSOG TP The successive cold spell events that hit the Northern part of Europe at the end of the heating season were another period of significant price swings. The majority of countries in North and North-Western Europe experienced harsher than usual meteorological conditions throughout the winter season. Based on heating degree days data (HDD) 12 from the Joint Research Centre of the European Commission, the March temperatures were the furthest apart from the long term average, with some MS recording more than 100 HDDs in addition to the long term average. In two separate events during the second and third week of the month, the temperatures across the UK were 6 0 C 8 0 C cooler than the long term average for several days. Prior to March 2013, market operators were withdrawing gas from storages at a faster-than normal rate. The March cold spell events accelerated further the withdrawal and as the winter season was coming to an end, a new minimum level of 2.71% was reached on 13 April 2013 in the NBP area. French storage levels were also extremely low and the minimum was reached on (6.23%). threshold of price difference under which no FAPD is recorded. The minimum threshold for gas is set at 0.5 /MWh. After the day ahead market closes, market participants still have the opportunity to level off their positions on the balancing market. That is why a high level of FAPD does not necessarily equate to irrational behaviour. In addition, it should be noted that close-to real time transactions represent only a fractional amount of the total trade on gas contracts. 12 Heating degree days (HDDs) express the severity of a meteorological condition for a given area and in a specific time period. HDDs are defined relative to the outdoor temperature and to what is considered as comfortable room temperature. The colder is the weather, the higher is the number of HDDs. These quantitative indices are designed to reflect the demand for energy needed for heating purposes. 24
25 3. Recent developments in the European wholesale markets of electricity The map on the next page (Figure 22) illustrates the annual averages of day-ahead wholesale baseload electricity prices in 2013 in the member states of the European Union, Norway and Switzerland: Power generation costs and wholesale prices are primarily influenced on one hand by supply side drivers, such as the structure of the power generation mix, the amount of generated power compared to domestic needs or the availability of power imports and exports and other factors, for example carbon emission allowance prices. On the other hand, the demand side is affected by the electricity need of households (lighting and heating needs), and the industrial demand for electricity, primarily depending on the general performance of the economy. On the longer term both household and industrial electricity demand is also impacted by energy efficiency policies. In those countries, where the contribution of hydro energy is significant in power generation (e.g.: Spain, Portugal, Sweden, Austria, Norway or Switzerland) the amount of precipitation significantly impacts the generation costs and the wholesale power price level. In most of these countries the 2013 average power prices were among the lowest in Europe. In countries like Germany, where the influence of solar and wind power generation rapidly increased during the last couple of years, abundant renewable supply assured one of the lowest average price in 2013 in the EU. German power generation trends have significantly impacted the price level in Central and Eastern Europe. Prices in this region also depend on the availability of electricity interconnections to neighbouring countries and regions, such as the Balkans. Prices in Italy, Ireland the United Kingdom and the Netherlands were among the highest in the EU in 2013, either because of the lack of sufficient interconnection capacities to neighbouring power markets (Italy and Ireland) or because of the dominance of expensive generation fuels in setting the marginal price in the wholesale market (natural gas in the case of the Netherlands and the UK). In the UK changes in the energy mix, i.e. related to significant coal-fired generation capacities taken offline in 2013 according to long standing plans, have created an upward pressure on domestic wholesale power prices in the short term, pending new capacity coming on-stream. 25
26 Figure 22. Comparison of average wholesale baseload electricity prices, first semester of
27 Taking a look at the longer term trends on Figure 23, the findings of the analysis above on the 2013 average prices can be reinforced. The important role of hydro generation can be tracked in the volatility of Spanish and Nordic power markets; with sudden shoot-ups and falls in power prices, depending on hydro availability. Italy had a significant price premium to other European peers during the last four years, and the UK has had a price premium since 2012 as gas-fired generation has become less competitive to coal. Central Western and Central Eastern European wholesale electricity prices showed a high degree of convergence in the last four years, as German power prices served as a peer to many markets in both regions. In the Southern European countries (e.g.: Spain, Italy or Greece) high summer temperatures can significantly increase power demand (mainly for cooling needs in households) and wholesale prices in the market. On the other hand, severe cold snaps affecting the whole European continent, like in February 2012, can result in sudden increases in heating needs, driving up both feeding stock costs for generation (natural gas) and electricity prices 13. Figure 23. Evolution of monthly average wholesale electricity prices in different European regions Source: Platts, power exchange platforms 13 See more detailed analysis in the Quarterly Report on European Electricity Markets: markets.pdf 27
28 In 2010 and 2011 a slight recovery from the lows in 2009 could be observed for most of the regional power prices in Europe, however, in 2012 and 2013 prices were on a decreasing trajectory in most of the regions. On the demand side the sluggish economic recovery has put a lid on price increases, which could easily be tracked in limited industrial demand for power. After the 2008 crisis many industries did not cease to respond to high energy costs by further decreasing their electricity intensity, which might have also contributed to the lower power demand. On the supply side several factors have simultaneously contributed to lower generation costs and have kept a lid on wholesale power prices, as Figure 24 shows. Import coal prices in North Western Europe fell by 40% since the beginning of 2011, primarily owing to abundant import supply from Colombia and the United States. At the same time natural gas prices stabilised since the beginning of 2012 after a significant growth in 2010 and As oilindex gas contracts still have an important role in many EU countries and LNG shipments from third countries have substantially decreased since the first months of 2011 (LNG quantities have been sold on Asian markets, offering more competitive prices), natural gas prices have stuck on a relatively high level in Europe, despite the fact that industrial demand for gas remained limited during this period. Decreasing coal prices, in contrast to relatively high gas prices, increased the profitability of coal-fired power generation to the detriment of natural gas. EU Emission Trading Scheme (ETS) emission allowance prices, reaching 15 /tonnes of CO 2 equivalent in June 2011, fell below 5 /tonnes in 2013 on average. The low carbon prices did not improve the situation of gas-fired generation either, as they could not incentivise gas-fired generation being proportionally less carbon-emission-intensive than coal. These achievements have led to a gradual squeeze-out of natural gas; the share of this fuel fell by almost five per cent in the EU-28 power generation mix between 2010 and 2012, according to preliminary data from Eurostat 14. At the same time renewable energy sources (solar and wind combined with significant hydro contribution in rainy periods) managed to gain ground, similarly to coal. The share of nuclear energy also diminished as a consequence of decisions in some member states to gradually abandon nuclear power generation in the forthcoming decade. As renewable power generation, due to its intermittent nature, needs backup capacities, the shift from less emission-intensive generation sources to coal raises a new challenge for national and European greenhouse gas emission reduction policies. 14 See Chapter x on page y 28
29 Figure 24. Evolution of the Platts' Pan European Power index, the import price of the steam coal, German import border price for natural gas, emission allowance price and the share of renewables in the EU power generation mix Source: Platts, BAFA Platts PEP: Pan European Power Index (in /MWh) Coal CIF ARA: Principal coal import price benchmark in North Western Europe (in /Mt) DE border imp. stands for long term contract based import natural gas price on the German border (in /MWh) RES includes hydro, wind, solar and biomass; RES share in the total power generation estimation is based on monthly ENTSO-E data for the EU-28 as a whole Traded volume and liquidity in the European wholesale markets Besides the evolution of the price level it is important to analyse the traded volumes of power and the liquidity in the European wholesale electricity markets. Traded volume of power measures the amount of day-ahead baseload power contracts in a given period (e.g.: a quarter). Liquidity is defined as the ratio of traded volume of power and the gross inland electricity consumption in a given country or a region. Figure 25 shows the quarterly evolution of traded volume of power and the European average liquidity between 2010 and 2013 for most of the European power trading markets. The highest traded volume of power could have been observed in this period in the Central Western European 15 (CWE) markets and in the Nordic markets 16 (Nordpoolspot). Nordpoolspot has also been the most liquid market, with a liquidity ratio of 96% in the fourth quarter of 2013, being above 80% during most of 2012 and The CWE region could also be found among the liquid ones, with a ratio of 34% in the fourth quarter of Power 15 Germany, France, Belgium, Netherlands Austria and Luxembourg 16 Sweden, Denmark, Finland, Estonia, Latvia, Lithuania and Norway 29
30 regions, such as the Iberian-peninsula, 17 Apennine-peninsula (Italy) and Greece had high traded volumes and liquidity ratios as measured against the gross inland electricity consumption, however, these markets are so-called mandatory pools, meaning that all bilateral power trade must compulsorily be carried out on these trading platforms, resulting in traded volumes being higher than in other (non-mandatory) markets. The Central and Eastern European 18 (CEE) region has been the most dynamically evolving region in the observed period, as traded volumes have nearly quadrupled and market liquidity has risen from 6.4% to 21.4%. The overall European market liquidity, incorporating both mandatory and non-mandatory markets, rose from 39% to 51% between the first quarter of 2010 and the fourth quarter of Besides increasing traded in power volume this increase in the market liquidity was also due to decreasing gross inland electricity consumption in this four year long time period. Figure 25. Evolution of quarterly traded volume of power in the major European regions and the average European power market liquidity Integration of the European electricity markets During the last decade several market couplings have taken place among neighbouring European markets, enabling an implicit cross border trade of electricity. The coupling of the Nordic markets already started at the beginning of the last decade and in June 2013, as the last 17 Spain and Portugal 18 Poland, Czech Republic, Slovakia, Hungary, Slovenia, Romania 30
31 country, Latvia became the part of the coupled region. In the Central Western European (CWE) region a trilateral coupling between France, Belgium and the Netherlands was introduced in 2006, which was extended to Germany in November In Central and Eastern Europe (CEE) a market coupling exists between the Czech Republic and Slovakia since 2009, which was extended to Hungary in September Poland is also coupled with Sweden and Slovenia with Italy as from the end of Finally, at the beginning of February 2014 the CWE and the Nordic region was coupled with the UK and Ireland, forming the North Western Europe (NWE) market, with the participation of fifteen European countries. Since May 2014, also the South-West European Market, i.e. Spain and Portugal, are coupled with North-Western Europe. These market couplings have also contributed to the convergence in wholesale prices between neighbouring markets. However, the existence of market couplings does not necessarily eliminate price differentials. For example, the Dutch wholesale power prices had an average premium of 14 /MWh to Germany in 2013, primarily owing to the significant impact of costly gas-fired generation in the Netherlands and to the lack of sufficient import capacities from Germany during the time of abundant solar and wind generation in that country. Belgian prices also decoupled from the other markets of the CWE region in 2012 and in the first half of 2013, as two nuclear reactors were permanently taken offline. Latvia and Lithuania still had a significant premium to other countries of the Nordic region, in the consequence of insufficient interconnections to other Nordpool markets and heavy dependence on electricity imports from Russia. Hungarian power prices, being coupled with the Czech and the Slovak markets, also showed signs of temporary decoupling many times in 2013, especially in the case of suddenly increasing domestic electricity consumption or significant amount of exports to the Balkans. Nevertheless, market couplings contributed to the reduction of the number of occurrences of adverse power flows (when power is flowing from a more expensive market to a cheaper one, providing an example for non-economical behaviour), thus minimising welfare losses of cross-border power trade. In most of the cases the ratios of adverse powers compared to the total number of trading hours fell close to zero shortly after the implementation of the market coupling and remained almost negligible even if significant price differentials could be observed between neighbouring markets. Figure 26 shows a good example for the co-existence of price divergences and low adverse power flow ratios between neighbouring markets. In 2011 the ratio of trading hours, when the hourly price difference was less than 10% between Germany and the Netherlands was above 90%, while in 2013 this ratio dropped below 40% during most of the time. However, adverse power flows hardly occurred between the two markets in spite of the existence of obvious price divergences. On the other hand, adverse power flows between Hungary and Slovakia became almost negligible after the implementation of the market coupling in the autumn of However, the price divergence still exists between the two markets, though it is less significant as it was beforehand. 31
32 Figure 26 Monthly ratios of hourly price considered as being convergent and monthly adverse power flow ratios between Germany and the Netherlands and between Hungary and Slovakia Source: HUPX, OTE-SK power exchanges To put it in another way, market coupling can be a useful tool for promoting the integration of the European wholesale electricity markets within the course of the creation of a single internal electricity market, eliminating welfare losses from cross-border power trade, however, coupled markets do not necessarily lead to permanent price convergence in electricity prices across the coupled area. In order to improve convergence in prices, the development of physical power transmission and interconnector infrastructure is indispensable besides the existence of cross border trading allocation mechanisms. Besides price convergence and adverse power flows between neighbouring power areas the integration of the European electricity markets can also be captured in increasing cross border electricity flows, as Figure 27 shows. 32
33 Figure 27 Monthly cross border electricity flows in the EU and the ratio of cross border flows compared to the gross inland electricity consumption Source: ENTSO-E In 2010 the monthly average cross border electricity trade was 17.8 TWh in the EU, while in 2013 it amounted to 21.7 TWh, showing a growth of 23% in this period. Although monthly cross border trade volumes showed a high degree of seasonality between 2010 and 2013 (being higher in winter months, as electricity need increases, and lower during the summer periods), an upward trend in monthly trade volumes could clerarly be observed. During the same time gross inland electricity consumption in the EU showed only a modest increase (being less than 2%). Dynamic growth in cross border trade as opposed to modest increase in electricity consumption resulted in an increase in the ratio of electricity cross border trade volumes compared to consumption, up from 6% measured in January 2010 to 9.8% in December The increasing trend of cross border trade vlolumes compared to national electricity consumption clearly shows the good signs of the integration of European wholesale electricity markets, as the increasing availability of electricity sources from other markets helps in promoting competition and boosting consumer welfare. 33
Commission européenne, B-1049 Bruxelles / Europese Commissie, B-1049 Brussel Belgium E-mail: ENER-MARKET-OBSERVATORY-QUARTERLY-REPORTS@ec.europa.
 DISCLAIMER: This report prepared by the Market Observatory for Energy of the European Commission aims at enhancing public access to information about prices of electricity in the Members States of the
WP1 Task 1 The Drivers of Electricity Demand and Supply
 PROJECT NO 518294 SES6 CASES COST ASSESSMENT OF SUSTAINABLE ENERGY SYSTEMS Observatoire Méditerranéen de l Energie WP1 Task 1 The Drivers of Electricity Demand and Supply Version April 2007 1. Drivers
Electricity and natural gas price statistics 1
 Electricity and natural gas price statistics 1 Source: Statistics Explained (http://epp.eurostat.ec.europa.eu/statistics_explained/) - 21/11/2011-09:11:44 Electricity and natural gas price statistics Data
Quarterly Report. on European Electricity Markets
 Quarterly Report on European Electricity Markets Market Observatory for Energy DG Energy Volume 6 (issues 3 & 4; third and fourth quarter of 2013) and Volume 7 (issues 1 & 2; first and second quarter of
Preparing for Changes in Market Design
 Preparing for Changes in Market Design EMART Conference Didier Lebout, Strategy and Development Director Gazprom Marketing and Trading France Amsterdam, 21 November 2012 In this presentation GM&T Ltd:
GDF SUEZ. Introduction. Jean-François Cirelli
 GDF SUEZ Introduction Jean-François Cirelli Content 1. Focus on gas market dynamics 2. Focus on electricity market dynamics 3. Focus on P&L resilience and sensitivities 4. Focus on synergies and performance
Quarterly Report. on European Electricity Markets. Market Observatory for Energy DG Energy Volume 7 (issues 3; third quarter of 2014) Energy
 Energy") Quarterly Report on European Electricity Markets Market Observatory for Energy DG Energy Volume 7 (issues 3; third quarter of 2014) Energy DISCLAIMER: This report prepared by the Market Observatory for
Quarterly Report on European Electricity Markets Market Observatory for Energy DG Energy Volume 7 (issues 3; third quarter of 2014) Energy DISCLAIMER: This report prepared by the Market Observatory for
Annex 2C International comparisons of gas and electricity prices
 Annex 2C International comparisons of gas and electricity prices Wholesale gas prices in the UK have risen between 23 and 24. This has caused industrial and domestic gas prices to increase and the gap
ERMInE Database. Presentation by Nils Flatabø SINTEF Energy Research. ERMInE Workshop 2 - Northern Europe Oslo, 1. November 2006
 ERMInE Database Presentation by Nils Flatabø SINTEF Energy Research ERMInE Workshop 2 - Northern Europe Oslo, 1. November 26 Overview Content of the Ermine Database Electronic Questionnaire RTD&D Data
Biomass Pellet Prices Drivers and Outlook What is the worst that can happen?
 Biomass Pellet Prices Drivers and Outlook What is the worst that can happen? European Biomass Power Generation 1st October 2012 Cormac O Carroll Director, London Office Pöyry Management Consulting (UK)
Quarterly Report. on European Electricity Markets. Market Observatory for Energy DG Energy Volume 8 (issue 1; first quarter of 2015) Energy
 Energy") Quarterly Report on European Electricity Markets Market Observatory for Energy DG Energy Volume 8 (issue 1; first quarter of 2015) Energy DISCLAIMER: This report prepared by the Market Observatory for
Quarterly Report on European Electricity Markets Market Observatory for Energy DG Energy Volume 8 (issue 1; first quarter of 2015) Energy DISCLAIMER: This report prepared by the Market Observatory for
Economic Analysis of the Renewable Energy Policies in the European Union
 6th International Conference on Industrial Engineering and Industrial Management. XVI Congreso de Ingeniería de Organización. Vigo, July 18-20, 2012 Economic Analysis of the Renewable Energy Policies in
IS ENERGY IN ESTONIA CHEAP OR EXPENSIVE?
 IS ENERGY IN ESTONIA CHEAP OR EXPENSIVE? Rita Raudjärv, Ljudmilla Kuskova Energy is a resource without which it is hard to imagine life in today's world. People seem to take it for granted that energy
The energy industry and energy price issues in Slovakia during recent years 1
 The energy industry and energy price issues in Slovakia during recent years 1 Ing. Mikulá Cár, PhD. National Bank of Slovakia The energy industry and energy prices are becoming a subject of political decisions
INVESTING IN A TRANSITIONING SECTOR
 INVESTING IN A TRANSITIONING SECTOR Eurelectric conference Jon Moore, CEO NEW INVESTMENT IN CLEAN ENERGY 24-14 ($BN) 32% 17% $318bn -7% $294bn 16% -9% $31bn.5% $272bn $268bn 17% 46% 36% $175bn $25bn $26bn
ISSN 1831-5666. Europe s energy position markets and supply
 ISSN 1831-5666 Europe s energy position markets and supply KET OBSERVATORY FOR ENERGY REPORT 29 Europe s energy position markets & supply This publication is based on the Commission Staff Working Document
13 th Economic Trends Survey of the Architects Council of Europe
 13 th Economic Trends Survey 13 th Economic Trends Survey of the Architects Council of Europe 13 th Economic Trends Survey Breakdown of responses COUNTRY ANSWERS France 1464 Belgium 399 Spain 365 Italy
Summary of the Impact assessment for a 2030 climate and energy policy framework
 Summary of the Impact assessment for a 2030 climate and energy policy framework Contents Overview a. Drivers of electricity prices b. Jobs and growth c. Trade d. Energy dependence A. Impact assessment
Power market integration. Geir-Arne Mo Team Lead Nordic Spot Trading Bergen Energi AS
 Power market integration Geir-Arne Mo Team Lead Nordic Spot Trading Bergen Energi AS 1 Geir-Arne Mo Some background information: Working for Bergen Energi since 2015 Team Lead Nordic Spot Trading I work
Value of production of agricultural products and foodstuffs, wines, aromatised wines and spirits protected by a geographical indication (GI)
") Value of production of agricultural products and foodstuffs, wines, aromatised wines and spirits protected by a geographical indication (GI) TENDER N AGRI 2011 EVAL 04 Leaflet October 2012 The information
Value of production of agricultural products and foodstuffs, wines, aromatised wines and spirits protected by a geographical indication (GI) TENDER N AGRI 2011 EVAL 04 Leaflet October 2012 The information
U.S. Trade Overview, 2013
 U.S. Trade Overview, 213 Stephanie Han & Natalie Soroka Trade and Economic Analysis Industry and Analysis Department of Commerce International Trade Administration October 214 Trade: A Vital Part of the
EU gas hub development and a comparison with US Henry Hub
 EU gas hub development and a comparison with US Henry Hub Dennis Hesseling, Head of Gas Department EU US Energy Regulatory Round table Madrid, April 26 2016 Objectives Objectives for today.highlight diversity
The current electricity costs of energy-intensive industries in Germany
 Memo From: Dr. Felix Christian Matthes Energy & Climate Division f.matthes@oeko.de Berlin, 23 June 2013 The current electricity costs of energy-intensive industries in Germany Background The electricity
EU Energy Policy and the Energy Situation in Germany
 IIPS Japan Policy Commentary EU Energy Policy and the Energy Situation in Germany By Mikihiko Shimizu Senior Research Fellow at IIPS Introduction Japan s energy policy is undergoing fundamental review
Electricity, Gas and Water: The European Market Report 2014
 Brochure More information from http://www.researchandmarkets.com/reports/2876228/ Electricity, Gas and Water: The European Market Report 2014 Description: The combined European annual demand for electricity,
Energy Efficiency Indicators for Public Electricity Production from Fossil Fuels
 international energy agency agence internationale de l energie Energy Efficiency Indicators for Public Electricity Production from Fossil Fuels IEA Information paper In Support of the G8 Plan of Action
Please address your inquiries to balances@iea.org.
 Excerpt from: ii - EXCERPT FROM ENERGY BALANCES OF OECD COUNTRIES (215 edition) The following analysis is an excerpt from the publication Energy Balances of OECD Countries (215 edition). Please note that
99/2015-9 June 2015. EU28, euro area and United States GDP growth rates % change over the previous quarter
 2005Q1 2005Q2 2005Q3 2005Q4 2006Q1 2006Q2 2006Q3 2006Q4 2007Q1 2007Q2 2007Q3 2007Q4 2008Q1 2008Q2 2008Q3 2008Q4 2009Q1 2009Q2 2009Q3 2009Q4 2010Q1 2010Q2 2010Q3 2010Q4 2011Q1 2011Q2 2011Q3 2011Q4 2012Q1
Volatility, risk and risk premium in German and Continental power markets
 Volatility, risk and risk premium in German and Continental power markets Stefan Judisch / Andree Stracke RWE Supply & Trading GmbH 22 nd January 2015 RWE Supply & Trading PAGE 0 Agenda 1. What are the
Price developments on the EU retail markets for electricity and gas 1998 2011
 Price developments on the EU retail markets for electricity and gas 1998 2011 The Market Observatory for Energy has analysed price developments on the retail markets for electricity and natural gas (domestic
187/2014-5 December 2014. EU28, euro area and United States GDP growth rates % change over the previous quarter
 187/2014-5 December 2014 This News Release has been revised following an error in the data for Gross Fixed Capital Formation. This affects both the growth of GFCF and its contribution to GDP growth. All
Energy prices in the EU Household electricity prices in the EU rose by 2.9% in 2014 Gas prices up by 2.0% in the EU
 92/2015-27 May 2015 Energy prices in the EU Household electricity prices in the EU rose by 2.9% in 2014 Gas prices up by 2.0% in the EU In the European Union (EU), household electricity prices 1 rose by
Global growth rates Macroeconomic indicators CEDIGAZ Reference Scenario
 Medium and Long Term Natural Gas Outlook CEDIGAZ February 215 Global growth rates Macroeconomic indicators CEDIGAZ Reference Scenario 4 3 %/year 199-213 213-235 6 Main consuming markets - %/year (213-235)
Poland must fully transpose the Third Energy Package Directives without further delay to liberalise the electricity and gas markets.
 Poland Key Issues + With regard to electricity, coal is still the main source of fuel for power generation. Poland's generating capacity is ageing, and the country needs better incentives for investment
Slovakia. Key issues. 1. General overview
 Slovakia Key issues Slovakia should enhance the independence of national regulatory authority and ensure its accountability. Slovakia should promote a regulatory framework conducive to investment in and
Short and long-term indicators and early warning tool for energy security. L. Vanhoorn *, H. Faas
 Short and long-term indicators and early warning tool for energy security L. Vanhoorn *, H. Faas European Commission; JRC - Institute for Energy; Energy Security Unit P.O. Box 2, 1755 ZG Petten, the Netherlands
First estimate for 2014 Euro area international trade in goods surplus 194.8 bn 24.2 bn surplus for EU28
 30/2015-16 February 2015 First estimate for 2014 Euro area international trade in goods surplus 194.8 bn 24.2 bn surplus for EU28 The first estimate for the euro area 1 (EA18) trade in goods balance with
Price setting in the electricity markets within the EU single market
 PricesettingintheelectricitymarketswithintheEUsingle market AreportbyEASACtotheCommitteeonIndustry,ResearchandEnergyoftheEuropean Parliament February2006 Forfurtherinformation: FionaSteiger EASACSecretariat
MARKET NEWSLETTER No 102 February 2016
 TRENDS IN WORLD OLIVE OIL CONSUMPTION World consumption of olive oil increased 1.8 fold in volume between 1990/00 and 2015/16. As can be seen from Chart 1, this upward movement has been located primarily
Good afternoon, and thanks to the Energy Dialogue for your kind invitation to speak today.
 Good afternoon, and thanks to the Energy Dialogue for your kind invitation to speak today. Europe is at the forefront of a global transition to a cleaner energy economy. At the same time globally energy
Alcohol Consumption in Ireland 1986-2006 A Report for the Health Service Executive
 Alcohol Consumption in Ireland 1986-2006 A Report for the Health Service Executive Prepared by Dr. Ann Hope This report should be referenced: Hope, A. (2007). Alcohol consumption in Ireland 1986-2006.
41 T Korea, Rep. 52.3. 42 T Netherlands 51.4. 43 T Japan 51.1. 44 E Bulgaria 51.1. 45 T Argentina 50.8. 46 T Czech Republic 50.4. 47 T Greece 50.
 Overall Results Climate Change Performance Index 2012 Table 1 Rank Country Score** Partial Score Tendency Trend Level Policy 1* Rank Country Score** Partial Score Tendency Trend Level Policy 21 - Egypt***
THE GROWING GLOBAL MARKET OF LNG
 THE GROWING GLOBAL MARKET OF LNG ISSUES & CHALLENGES Dr Naji Abi-Aad April 2013 The Growing Global Market of LNG Outline Characteristics of Liquefied Natural Gas (LNG) & its Trade Increasing Volumes of
France Electricity Report for 2014
 France Electricity Report for 2014 Press kit Contents 1. The consumption drop 6 2. The development of renewable energies 8 3. The fossil fuel power generation slump 9 4. The CO 2 emissions decrease 5.
NEW PASSENGER CAR REGISTRATIONS BY ALTERNATIVE FUEL TYPE IN THE EUROPEAN UNION 1 Quarter 4 2015
 NEW PASSENGER CAR REGISTRATIONS BY ALTERNATIVE FUEL TYPE IN THE Quarter 4 2015 Alternative fuel vehicle (AFV) registrations: +20.0% in 2015; +21.1% in Q4 In the fourth quarter of 2015, total alternative
Wholesale price movements and price drivers. Interconnector flows
 Market Review 213 Market Prices and costs coupling Introduction Price volatility The electricity market is going through a phase of rapid change. While the process of European integration of electricity
168/2014-4 November 2014. At risk of poverty or social exclusion 2 rate in the EU28, 2008-2013 (% of total population)
") 168/2014-4 November 2014 At risk of poverty or social exclusion in the EU28 More than 120 million persons at risk of poverty or social exclusion in 2013 Almost 1 out of every 4 persons in the EU in this
168/2014-4 November 2014 At risk of poverty or social exclusion in the EU28 More than 120 million persons at risk of poverty or social exclusion in 2013 Almost 1 out of every 4 persons in the EU in this
COMMISSION STAFF WORKING DOCUMENT. Country Factsheet Sweden. Accompanying the document
 EUROPEAN COMMISSION Brussels, 18.11.015 SWD(015) 0 final COMMISSION STAFF WORKING DOCUMENT Country Factsheet Sweden Accompanying the document COMMUNICATION FROM THE COMMISSION TO THE EUROPEAN PARLIAMENT,
Pure Power. Wind Energy Scenarios up to 2030. By the European Wind Energy Association
 Pure Power Wind Energy Scenarios up to 23 By the European Wind Energy Association Text and analysis: Arthouros Zervos and Christian Kjaer Project Coordinator: Sarah Clifford Design: www.inextremis.be Pure
Evolution of EU exports and imports of goods with CELAC, 2004-2014 (in billion)
") 100/2015-9 June 2015 EU Community of Latin American and Caribbean States (CELAC) summit CELAC represents the fifth most important trading partner of the EU More than 200 bn total trade The 28 Member States
100/2015-9 June 2015 EU Community of Latin American and Caribbean States (CELAC) summit CELAC represents the fifth most important trading partner of the EU More than 200 bn total trade The 28 Member States
Main trends in industry in 2014 and thoughts on future developments. (April 2015)
") Main trends in industry in 2014 and thoughts on future developments (April 2015) Development of the industrial sector in 2014 After two years of recession, industrial production returned to growth in 2014.
Main trends in industry in 2014 and thoughts on future developments (April 2015) Development of the industrial sector in 2014 After two years of recession, industrial production returned to growth in 2014.
Reasons for the drop of Swedish electricity prices
 Reasons for the drop of Swedish electricity prices Project for Svensk Energi Dr. Lion Hirth Neon Neue Energieökonomik GmbH Karl-Marx-Platz 12, 12043 Berlin, Germany hirth@neon-energie.de Summary report
Costs of air pollution from European industrial facilities 2008 2012 an updated assessment
 Costs of air pollution from European industrial facilities 2008 2012 an updated assessment Summary In 2012, air pollution from European industrial facilities cost at least EUR 59 billion (and up to EUR
IEWT 2011 TOWARDS AN EFFECTIVE AND EFFICIENT RES TARGET FULFILLMENT FROM BAU TO STRENGTHENED NATIONAL POLICIES WITH PROACTIVE RISK MITIGATION
 TOWARDS AN EFFECTIVE AND EFFICIENT RES TARGET FULFILLMENT FROM BAU TO STRENGTHENED NATIONAL POLICIES WITH PROACTIVE RISK MITIGATION Vienna University of Technology, 7 th IEWT Slide 1 Cost estimates of
Germany. Key issues. 1. General overview
 Germany Key issues High volumes of renewables have changed the way the electricity market in Germany operates. In 2012 direct marketing increased, in particular in onshore wind, due to a change of the
Implementing the cooperation mechanisms of the RES directive current status and open questions
 Implementing the cooperation mechanisms of the RES directive current status and open questions Corinna Klessmann, Ecofys Germany RE-SHAPING Workshop, Vilnius, 16.05.2011 Supported by Intelligent Energy
COMMUNICATION FROM THE COMMISSION
 EUROPEAN COMMISSION Brussels, 17.9.2014 C(2014) 6767 final COMMUNICATION FROM THE COMMISSION Updating of data used to calculate lump sum and penalty payments to be proposed by the Commission to the Court
7: The electricity market
 7: The electricity market 94 : Facts 2008 : Energy and Water Resources in Norway The power sector in Norway is regulated by the Energy Act. Market-based power trading is one of the principles incorporated
Russian Gas and European Energy Security : Beyond Clichés
 Russian Gas and European Energy Security : Beyond Clichés World Energy Council Workshop Energy Vulnerabilities in Europe Didier Lebout, Strategy and Development Director Gazprom Marketing and Trading France
The Cost of Electricity in Jersey
 Jersey Energy Trends 25 Headlines In 25 total final energy demand in Jersey was 187 million toe (2,17, 9 MWh) an increase of.1% on 24. Final consumption of electricity grew by 1.2% between 24 and 25. Over
Oil & Gas Conference - Cheuvreux October 14 th, 2011
 LNG terminal Montoir, France Oil & Gas Conference - Cheuvreux October 14 th, 2011 Jean - Marie DAUGER Executive Vice-President, in charge of the Global Gas & LNG Business line DISCLAIMER Forward-Looking
How To Understand Factoring
 EIF Project "Jeremie" General Report on Factoring 1 Market analysis on Factoring in EU 25+2 prepared by International Factors Group (IFG) for European Investment Fund (EIF) project JEREMIE Preliminary
Analysis of the EU fruit and vegetables sector
 26 September 2014 Analysis of the EU fruit and vegetables sector EU and to Russia (2011-2013) Recent market s and measures taken to address market disruptions following the Russian import ban EU and to
VOLUNTARY HEALTH INSURANCE AS A METHOD OF HEALTH CARE FINANCING IN EUROPEAN COUNTRIES
 VOLUNTARY HEALTH INSURANCE AS A METHOD OF HEALTH CARE FINANCING IN EUROPEAN COUNTRIES Marta Borda Department of Insurance, Wroclaw University of Economics Komandorska St. No. 118/120, 53-345 Wroclaw, Poland
PGE - Polish Energy Group. Nuclear power development in Poland - we need decision today. Organisation of the Polish Power Sector After Consolidation
 Nuclear power development in Poland - we need decision today Hanna Trojanowska Director of International Affairs and New Technologies Department PGE Polska Grupa Energetyczna S.A. Organisation of the Polish
Energy Prices. Presented by: John Heffernan
 Global Wholesale Energy Prices Presented by: John Heffernan Energy in 2012 In 2012, the growth in Energy consumption slowed in 2012 90% of this growth came from China & India Consumption & production of
Review of European Electricity Prices
 On behalf of Union of the Electricity Industry EURELECTRIC Final Report Prepared by KEMA Consulting GmbH Bonn, Germany Disclaimer This report is based on empirical evidence and provides facts and observations
OVERVIEW OF GAS SUPPLY TO EUROPE. Andrew Potter World Bioenergy Association
 OVERVIEW OF GAS SUPPLY TO EUROPE Andrew Potter World Bioenergy Association EU Gas Consumption 1965-2007 In 2011 natural gas covered 24% of the primary energy supply in EU 27. The total primary energy demand
NERI Quarterly Economic Facts Summer 2012. 4 Distribution of Income and Wealth
 4 Distribution of Income and Wealth 53 54 Indicator 4.1 Income per capita in the EU Indicator defined National income (GDP) in per capita (per head of population) terms expressed in Euro and adjusted for
Size and Development of the Shadow Economy of 31 European and 5 other OECD Countries from 2003 to 2015: Different Developments
 January 20, 2015 ShadEcEurope31_January2015.doc Size and Development of the Shadow Economy of 31 European and 5 other OECD Countries from 2003 to 2015: Different Developments by Friedrich Schneider *)
Wind Power in Germany in 2014
 Renewables International www.renewablesinternational.net Wind Power in Germany in 2014 Bernard CHABOT BCCONSULT, Garbejaire B107, 06560 VALBONNE, France Email: Bernard_Chabot@yahoo.fr Content Scope, main
The Legal Protection Insurance Market in Europe. October 2013
 The Legal Protection Insurance Market in Europe October 2013 The Legal Protection Insurance Market in Europe October 2013 In its latest publication RIAD, the International Association of Legal Protection
PUBLIC DEBT SIZE, COST AND LONG-TERM SUSTAINABILITY: PORTUGAL VS. EURO AREA PEERS
 PUBLIC DEBT SIZE, COST AND LONG-TERM SUSTAINABILITY: PORTUGAL VS. EURO AREA PEERS 1. Introduction This note discusses the strength of government finances in, and its relative position with respect to other
Consumer Credit Worldwide at year end 2012
 Consumer Credit Worldwide at year end 2012 Introduction For the fifth consecutive year, Crédit Agricole Consumer Finance has published the Consumer Credit Overview, its yearly report on the international
The Energiewende in the Power Sector: State of Affairs 2014
 The Energiewende in the Power Sector: State of Affairs 2014 A Review of the Significant Developments and an Outlook for 2015 BERLIN, 07 JANUARY 2015 The most important developments in 2014 at a glance:
Energi och gas ivår omvarld. Thina Margrethe Saltvedt, Chief Analyst Macro/Oil (Ph. D.) April 2014 @ThinaSaltvedt
 April 2014 @ThinaSaltvedt") Energi och gas ivår omvarld Thina Margrethe Saltvedt, Chief Analyst Macro/Oil (Ph. D.) April 2014 @ThinaSaltvedt US shale gas soon aiming for new markets higher oil and natural gas prices Shale formations
Energi och gas ivår omvarld Thina Margrethe Saltvedt, Chief Analyst Macro/Oil (Ph. D.) April 2014 @ThinaSaltvedt US shale gas soon aiming for new markets higher oil and natural gas prices Shale formations
World Energy Outlook 2009. Presentation to the Press London, 10 November 2009
 World Energy Outlook 29 Presentation to the Press London, 1 November 29 The context The worst economic slump since the 2 nd World War & signs of recovery but how fast? An oil price collapse & then a rebound
Post-Consumer Plastic Waste Management in European Countries 2012 - EU 27 + 2 Countries -
 Final Report (October 2013) Post-Consumer Plastic Waste Management in European Countries 2012 - EU 27 + 2 Countries - PlasticsEurope Av. E. Van Nieuwenhuyse 4/3 B-1160 Bruxelles CONSULTIC MARKETING & INDUSTRIEBERATUNG
With data up to: May 2016. Monthly Electricity Statistics
 With data up to: 216 Monthly Electricity Statistics Date of publication: 12 ust 216 Monthly Electricity Statistics TABLE OF CONTENTS Page # HIGHLIGHTS i ORGANISATIONAL AND REGIONAL TABLES OECD Total 1
193/2014-15 December 2014. Hourly labour costs in the EU28 Member States, 2012 (in )
") 193/2014-15 December 2014 Labour Cost Survey 2012 in the EU28 Labour costs highest in the financial and insurance sector Three times higher than in the accommodation and food sector In 2012, average hourly
193/2014-15 December 2014 Labour Cost Survey 2012 in the EU28 Labour costs highest in the financial and insurance sector Three times higher than in the accommodation and food sector In 2012, average hourly
Developments in the Traded Market:
 PatrickHeatherConsultancy Developments in the Traded Market: The Evolution of European Traded Gas Hubs Eurogas Conference on Central and Eastern Europe Ljubljana, 15 th December, 2015 The contents of this
Future possible uses of renewable energy in the V4 countries
 Future possible uses of renewable energy in the V4 countries Róbert Magda Szent István University Institute of Economics, Law and Methodology, Department of Microeconomics Páter Károly út 1. H-2100 Gödöllő,
ICIS Power Index Q1 2015 Global gas oversupply pushes down prices
 Highlights l UK wholesale electricity market prices hit their lowest levels since the IPI has been calculated, because of global gas oversupply. l UK markets are now much more influenced by global gas
Annual report 2009: the state of the drugs problem in Europe
 Annual report 2009: the state of the drugs problem in Europe International Conference: New trends in drug use: facts and solutions, Parliament of the Republic of Vilnius - 5 November 2009 Dagmar Hedrich
GB Electricity Market Summary
 GB Electricity Market Summary SECOND QUARTER 2014 APR TO JUN Recorded Levels of UK Generation by Fuel (based upon DECC Energy Trends & FUELHH data): GAS: 10.8GW WIND: 2.6GW AUGUST 2014 COAL: 10.1GW BIOMASS:
Economic and Market Outlook. EU Automobile Industry
 Economic and Market Outlook EU Automobile Industry March 2015 Report 1 of 4 2015 CONTENTS EU ECONOMIC FORECASTS... 2 PASSENGER CARS... 4 REGISTRATIONS... 4 WORLD... 4 THE EUROPEAN UNION... 6 PRODUCTION...
A Cheaper Renewable Alternative for Belarus
 A Cheaper Renewable Alternative for Belarus Issue paper from INFORSE-Europe 1, by Gunnar Boye Olesen, July 2011 Summary Following the increasing fossil energy prices, the country of Belarus is struggling
World Energy Outlook 2007: China and India Insights. www.worldenergyoutlook.org International Energy Agency
 World Energy Outlook 27: China and India Insights www.worldenergyoutlook.org International Energy Agency Why Focus on China & India? Increase in World Primary Energy Demand, Imports & Energy-Related CO
Wind energy scenarios for 2020. A report by the European Wind Energy Association - July 2014. Wind energy scenarios for 2020
 A report by the European Wind Energy Association - July 2014 1 WIND ENERGY SCENARIOS FOR 2020 Content Background...3 Reasons for the new scenarios...3 Proposed new scenarios...3 Text and analysis: Jacopo
RENEWABLE ENERGY IN AUSTRALIA
 RENEWABLE ENERGY IN AUSTRALIA Increasing electricity generation from renewable energy sources is one of the main strategies to reduce greenhouse emissions from the power sector. Australia has historically
WHEN AN EFFECTIVE EU ENERGY POLICY?
 WHEN AN EFFECTIVE EU ENERGY POLICY? A. Clerici ABB Italy Honorary Chairman of WEC Italy Chairman of WEC WG The future role of nuclear in Europe 1 INDEX 1. General Comments 2. Vulnerability 3. Transmission
Beer statistics. 2014 edition. The Brewers of Europe
 Beer statistics 2014 edition The Brewers of Europe Beer statistics 2014 edition The Brewers of Europe Editor: Marlies Van de Walle 1st edition, October 2014 ISBN 978-2-9601382-3-8 EAN 9782960138238 1
Russia s gas sector and gas export developments. Marc-Antoine Eyl-Mazzega June 2015
 Russia s gas sector and gas export developments Marc-Antoine Eyl-Mazzega June 215 IEA: 29 Members, worldwide engagement IEA member countries Accession country Key Partner countries Countries co-operating
World Manufacturing Production
 Quarterly Report World Manufacturing Production Statistics for Quarter III, 2013 Statistics Unit www.unido.org/statistics Report on world manufacturing production, Quarter III, 2013 UNIDO Statistics presents
FUSIONS Food waste data set for EU-28. New Estimates and Environmental Impact
 FUSIONS Food waste data set for EU-28 New Estimates and Environmental Impact 15 October 2015 Food waste is an issue of importance to global food security and good environmental governance, directly linked
NATURAL GAS DEMAND AND SUPPLY Long Term Outlook to 2030
 1. Background On different occasions, Eurogas is asked to present its views on the future of the European gas industry. The forecasts are mainly needed for conferences and bilateral discussions with European
EUF STATISTICS. 31 December 2013
 . ESTIMATES OF EU TURNOVER VOLUMES. Turnover volumes by product, allocation and notification (Estimates of EU s, Millions of ) Estimate of the EU % on Turnover Significance of the sample on total turnover
How many students study abroad and where do they go?
 From: Education at a Glance 2012 Highlights Access the complete publication at: http://dx.doi.org/10.1787/eag_highlights-2012-en How many students study abroad and where do they go? Please cite this chapter