Risk and Vulnerability Assessment of Distrito Nacional, Santo Domingo, Dominican Republic
|
|
|
- Molly Perry
- 8 years ago
- Views:
Transcription
1 Risk and Vulnerability Assessment of Distrito Nacional, Santo Domingo, Dominican Republic George McQueen Community & Regional Planning School of Architecture Latin American Studies Lozano Long Institute of Latin American Studies University of Texas at Austin CRP 386 Introduction to Geographic Information Systems December 14, 2009

2 EXECUTIVE SUMMARY Many government institutions in the Global South typically lack capacity to effectively use geospatial data for urban governance, including the ability to develop effective means to improve living conditions in informal settlements. The marginalized communities along the Ozama and Isablela Rivers in Distrio Nacional, Dominican Republic have been surveyed and studied regularly for the past 50 years. The communities and governing bodies are keenly aware of the environmental risks and social vulnerabilities of this area, but there appears to be little continuity between surveys and organizations. Surveys and maps become property of the sponsoring organization and each new effort to understand and address the environmental and social concerns requires the creation of new methodologies, new spatial references and the gathering of new data. Geographic Information Systems (GIS) can be a powerful tool to help improve communication and understanding among communities and government institutions. GIS can provide spatial and statistical information that can be communicated visually. This project will (1) review, categorize, document and prepare geospatial data provided by public institutions in the Dominican Republic, and (2) prepare supporting documentation of the data for use by public officials, technicians, and scholars working in Santo Domingo. Finally (3), this project will conduct a remote risk and vulnerability assessment of the Distrito Nacional, Santo Domingo, to demonstrate how GIS can be used to identify areas that are at risk of environmental hazards and vulnerable to a variety of social conditions. This will constitute an initial assessment, resulting in a recommendation for how geospatial data may be collected and used for further, more indepthe assessments of living conditions in the Distrito Nacional. This information may guide public works departments in prioritizing infrastructure improvement or municipalities in deciding where to site public services, such as community centers and health clinics. The assessment will also provide a model for future training of technicians and show the opportunities of GIS for the improvement of informal settlements in Santo Domingo and elsewhere in the Dominican Republic. 2

3 INTRODUCTION As the largest city and the capital of the Dominican Republic, Santo Domingo also has the highest population density. In a country of 8.5 million in 2002 (almost exactly 50 percent female, 50 percent male), 1.8 million live in the Santo Domingo Province, of which just over 900,000 live in the Distrito Nacional. Of the 48,442 square kilometers of the Dominican Republic, about 1/5th of the country's population lives in area of just 92 square kilometers of the Distrito Nacional. In other words, 21% of the population lives in.01% of the country. (ADN) While the population of the Dominican Republic continues to grow, there is also a shift in the countrywide population to the urban centers. (CONAU) Opportunities for jobs, education, services are all located in the cities; therefore there is a natural tendency for people living in rural communities to migrate towards these opportunities. As cities become more dense, the availability of these opportunities becomes more competitive, which is a disadvantaged to the most vulnerable community members. Housing opportunities also become more scarce, especially affordable housing, therefore people will settle where they can, even in areas that are hazardous, putting their well being at risk. (Navarro) As troubling as this is, this is a reality that affects most large cities, especially in Latin America. The Distrito Nacional is not an exception to the problems affecting large cities developing nations. Since the 1960s, the governing institutions have been trying to address the problems of of social and environmental inequality. Some efforts have been more successful than others, and the Distrito Nacional experienced its own form of urban renewal in the 60s and 70s. (Chantada) One area of continued concern and attention has been the land along the shores of the Ozama and Isabela rivers (see Figure 1). While the northern and eastern political boundaries of the Distrito Nacional are defined by these two rivers, so are many of the social and environmental conditions of the poor. These two large rivers converge just before reaching the Caribbean Sea. Sited at the confluence of three bodies of water, the Distrito Nacional has been a strategic location militarily and economically for centuries. However, this location also poses many unique environmental risks to the ever increasing population. (CONAU) In the mid 1990s, the municipality of the Distrito Nacional identified key areas of risk along the Isabela and Ozama Rivers with a project was called RESURE ( La Reestructuración Social, Urbana, y Ecológica de los Barrios Marginados que Rodean los Rios Ozama e Isabela; translated: The Social, Urban and Ecological Restructuring of the Marginalized Neighborhoods along the Ozama and Isablea Rivers ). This project proposed engaging the marginalized communities along the rivers to help improve the infrastructure and create autoconstrucción self help. (RESURE) The project also proposed the creation of a greenbelt along the river shore. This proposed relocating families found in areas of high risk and designating these areas as protected zones, which would allow for a contiguous green belt along the river. While intentions, actions and 3

4 results of RESURE (and RESURE II) are not in question, the methodology for the initial assessment remains unclear. Other similar efforts have been made to either improve conditions for or move people from these areas of highest risk, particularly in the neighborhoods of La Zurza and La Ciénega. These neighborhoods are among the poorest and located in the areas most susceptible to natural hazards in the Distrito Nacional.(RESURE) Other neighborhoods that are equally poor, with similar environmental hazards are Gualey, Puerto Isabela, Escanche Capotillo, Simón Bolivar, 24 de Abril, and Domingo Salvo. These neighborhoods represent a contiguous belt along the southwestern shores of the Isabel and Ozama Rivers. Another defining feature of these neighborhoods is the canyon, or the cañada. The cañada is the natural watershed drainage and is typically unsuitable for development, (Sletto) which is why the poorest people settle there albeit illegally because it is the only available land. Each of these neighborhood has a cañada, which is a continuous source of health and environmental risk. Following previous research and anticipating further investigation, this analysis will demonstrate how government officials can use census data and geographic information systems (GIS) shapefiles to anticipate and prevent certain social, economic and environmental crises. This analysis, however, does have very clear limitations. First, much of the data used for this project is over 10 years old and the conditions and infrastructure have likely changed. The accuracy of the original data is not known, therefore the accuracy of this assessment is limited. Second, much of the data had to be transferred from computer animated design (CAD) drawing files (.dwg) to GIS shapefiles (.shp). This creates additional opportunity for human error. Third, because this assessment was conducted remotely, and the author has not been to the study site, this is primarily a visual exercise in the possible uses of GIS. 4
 Other neighborhoods that are equally poor, with similar environmental hazards are Gualey, Puerto Isabela, Escanche Capotillo, Simón Bolivar, 24 de Abril, and Domingo Salvo.")
5 PROBLEM STATEMENT Individual departments within governmental institutions gather and create information on the community and constituency they serve and represent. However, it is not uncommon for departments to be unable or unwilling to share this information. Cities in Latin America are not an exception, particularly the Distrito Nacional, Dominican Republic. Urban planners in Latin America have been traditionally educated as architects and use the tools of architects to document, represent and analyze space. Computer animated design is a common tools for Latin American planners/architects to create maps and plans. But as departmental budgets are constrained, so are the faculties to produce and use these maps and plans. In the Distrito Nacional, the marginalized communities along the Ozama and Isablela Rivers in Distrio Nacional, Dominican Republic have been surveyed and studied regularly for the past 50 years. The governing bodies are very aware of the environmental risks and social vulnerabilities of this area, but there appears to be little continuity between surveys and organizations. There also seems to be a limited capacity to represent these conditions. Geographic Information Systems (GIS) can be an effective tool that could help streamline the process of information creation and sharing. Instead of re-creating drawings, shapes can be shared and perfected and data can be stored in the attributes. GIS can help governmental institutions develop effective means to more quickly and accurately understand conditions, and create reports to represent this understanding. It is my hypothesis that the areas most socially vulnerable and at risk to environmental conditions can be identified through a cursory risk and vulnerability assessment, conducted remotely and with only spatial data. RESEARCH QUESTIONS 1) What are the principal environmental risks and vulnerability criteria in informal settlements in Santo Domingo? 2) Where are the locations of informal settlements in Santo Domingo? (Based on RESURE) 3) Where are the areas of greatest risk within informal settlements in the Distrito Nacional, Santo Domingo? (With available data, this will be based on the proximity to: the river, cañadas, floodplains, steel slopes and uneven soil) 4) What are the most vulnerable areas? ((With available data, this will be based on the distance from: education facilities, health clinics, police stations, markets and transit routes)) 5

6 METHODOLOGY Since this project is multi-layered, the methodology will be divided into the three parts mentioned in the executive summary: (1) understand and prepare data, (2) document the process of converting data from drawings to shapefiles, and (3) conduct a remote risk and vulnerability assessment Part 1 I acquired approximately six gigabytes of data on the Dominican Republic from Dr. Bjørn Sletto, professor of Community and Region Planning in the University of Texas at Austin School of Architecture. Government officials in the Distrito Nacional have shared spatial and census information with Dr.Sletto s because of his continued work in the Domincan Republic. I used ArcCatalog to open, preview and document the data. Most the data is defined and projected using "WGS 1984 UTM Zone 19N" as the projected coordinate system and "GCS WGS 1984" as the geographic coordinate system, but reviewing the shapefiles in ArcCatalog, some data will have to be defined and projected. Part 2 After understanding and organizing all the data, I realized most of the GIS data was of at the country-wide scale and I was hoping to work at the neighborhood scale. This was four levels of data removed from what I needed (The data is organized by Country, Province, Section, Municipality, Neighborhood, Block). Fortunately, there were many CAD drawing files that had neighborhood-level information. Unfortunately, it all had to be exported into GIS, defined, projected, georeferenced and resized to fit the proper scale. This process was documented in the Appendix and will hopefully be of future use. Part 3 I used the layers and shapes created in Part 2 to run a suitability assessment using GIS. Using ArcMap, ArcScene and other ArcGIS analytical tools (i.e. spatial analyst) I created a series of layouts that, if nothing more, give a visual description of the process of using GIS for a risk and vulnerability assessment (also represented in Figure 22). Adapting a methodology from the National Oceanic and Atmospheric Administration's (NOAA), assessed the risk and vulnerability of a specific site in the Distrito Nacional based social vulnerability and environmental risk. Given the limitation of the data, I defined social vulnerability as distance from public facilities including: education facilities, police stations, markets, public transportation and health centers. The environmental risk was defined by the proximity to environmental hazards, such as the rivers, cañadas, steep slopes, uneven surfaces and floodplains. The final product was these two assessments combined, which demonstrates the areas must vulnerable and at highest risk (see figures 17, 19 and 21 for representations of the final assessment. Figure 22 shows the process). 6

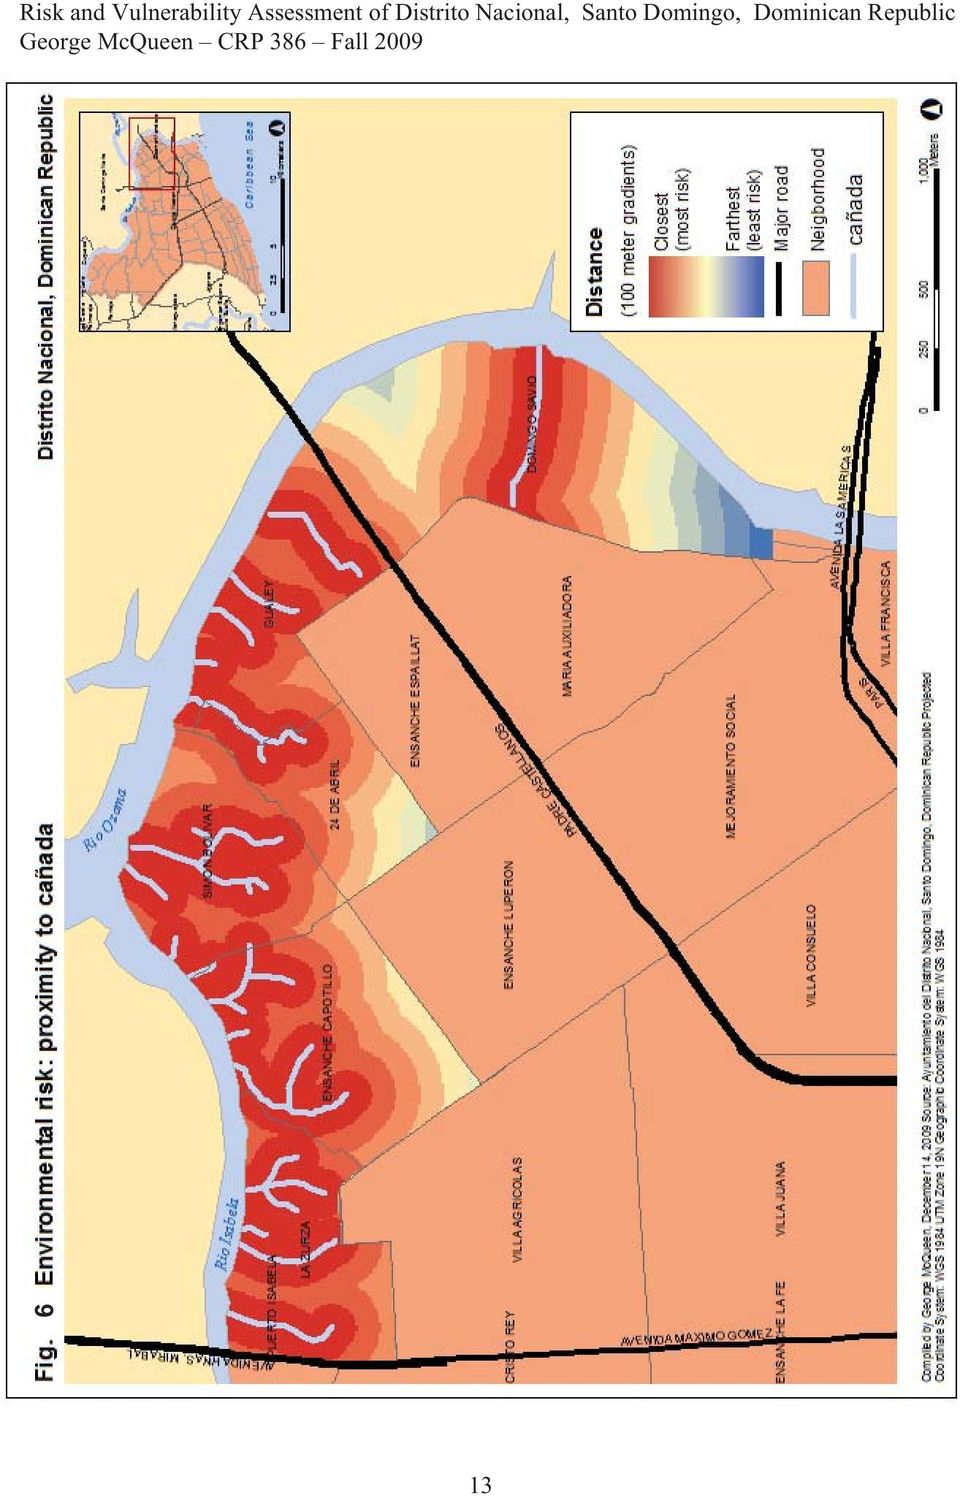
7 FINDINGS Series of Layouts: Fig. 1.1 Fig. 1.2 Fig. 1.3 Fig. 2 Fig. 3 Fig. 4 Fig. 5 Fig. 6 Fig. 7 Fig. 8 Fig. 9 Fig. 10 Fig. 11 Fig. 12 Fig. 13 Fig. 13 Fig. 14 Fig. 15 Fig. 16 Fig. 17 Fig. 18 Fig. 19 Fig. 20 Fig. 21 Context within the Caribbean Context within the Dominican Republic Context within Santo Domingo Percent of population in poverty in study area Focus area for assessment: Over 40% poverty Layers created from CAD files Environmental risk: proximity to river Environmental risk: proximity to a cañada Environmental risk: proximity to a floodplain Environmental risk: proximity to an uneven surface Environmental risk: proximity to a steep slope Areas most at risk because of environmental conditions Social vulnerability: distance from education facilities Social vulnerability: distance from health center Social vulnerability: distance from markets Social vulnerability: distance from police stations Social vulnerability: distance from public transportation Ares most vulnerable because of social conditions Both assessments combined: Areas most vulnerable and at risk Digital elevation model of study area Risk and vulnerability in relation to topography 3D image of study area, facing west 3D image of area with highest risk and most vulnerability Steps of a risk and vulnerability assessment using GIS 7

8 8

9 2 9

10 3 10

11 4 11

12 5 12

13 6 13
14 7 14

15 8 15

16 9 16

17 10 17

18 11 18

19 12 19

20 13 20

21 14 21
22 15 22
23 16 23
24 17 24
25 18 25
26 19 26
27 20 27
28 21 28
29 22 29
30 ANALYSIS The purpose, implications and limitations of each layout will be discussed independently. Fig. 1.1 Context within the Caribbean This layout is an effort to orient the view to the scope of the study area. The Dominican Republic shares the island of Hispaniola with Haiti. The island is not far from Columbia, Venezuela, Cuba, Puerto Rico, and the United Stats Fig. 1.2 Context within the Dominican Republic There Dominican Republic consists of 31 provinces, of which Distrito Nacional is one municipality inside a single province. Fig. 1.3 Context within Santo Domingo Distrito Nacional is a municipality within the province of Santo Domingo. There are several other cities within the Santo Domingo Province, including Santo Domingo Oeste, Este and Norte. There are about 100 neighborhoods within the Distrito Nacional. However, because there are different categories of sub neighborhoods, census and spatial data do not show the same number of neighborhoods. The study area is limited to 11 neighborhoods in the eastern part of Distrito Nacional. At the top of the study area, the Isabela and Ozama Rivers converge before they empty to the Caribbean Sea. Fig. 2 Percent of population in poverty in study area Based on a CAD map from the RESURE project, this map shows the concentration of poverty along the rivers. This data was gathered in 1993 and published in Fig. 3 Focus area for assessment: Over 40% poverty Since poverty levels are the highest indicator of vulnerability, the study area will focus only on those neighborhoods with poverty levels above 40%. This limits the study area to neighborhoods along the rivers, which are also the most at risk of environmental hazards, such as floods and solid waste. Fig. 4 Layers created from CAD files Based on CAD maps from the RESURE project, each one of these shapes was extracted from a drawing and imported into layer of its own. The limitation of this map is the features were either polygons or lines, therefore the symbology is difficult to interpret. With more time these features could have been converted into points so the legend can have the same shapes as the features. Fig. 5 Environmental risk: proximity to river After the distance from the river was measured and a raster was created, the raster was reclassified and given a color scale to represent the areas of highest risk. For the purpose of this exercise, and visual consistency, every analysis run with the spatial analyst was at 1000 meters. There is no reason other than visual communication for this number. 30
31 Fig. 6 Environmental risk: proximity to a cañada Cañadas are both a physical and social term in the Dominican Republic. Translated literally to mean canyon, the cañada is also the place where the most informal housing is found. Cañada also means slum. Fig. 7 Environmental risk: proximity to a floodplain Because of the two large rivers in the area, there are parts of the soil that are prone flooding. However, people still build on these areas and are at high risk. Fig. 8 Environmental risk: proximity to an uneven surface This layer, also taken from the RESURE maps, is a rough translation of tierra accidnentado, which roughly translates to uneven land. Not knowing the exact nature of this definition creates a limitation on the importance of this layer. Fig. 9 Environmental risk: proximity to a steep slope The limitation of this map is the exact pitch of the slope is not known. However, the slopes do correspond with the slopes in the digital elevation model (see Figure 17). Fig. 10 Areas most at risk because of environmental conditions When all the distances were calculated and reclassified, they were then combined using the raster calculator to determine the areas that are most at risk because of natural physical conditions. Fig. 11 Social vulnerability: distance from education facilities The distance from the education facility was calculated and reclassified at 1000 meters (each colored ring represents 100 meters). However, the limitation of this layout and the following vulnerability layouts is the exact use is not known. For example, it is not known what type of education facility this features represent. Fig. 12 Social vulnerability: distance from health center There are several health centers, clinics perhaps, in these neighborhoods. But what kind of clinics there are is not known. This layer also does not reflect the fact that there is a very large hospital in the Eschanche Luperon neighborhood, which is in the center of the study area (but no along the river). Fig. 13 Social vulnerability: distance from markets This layer is also limited because the exact nature of the market is not known. Fig. 13 Social vulnerability: distance from police stations For purposes of this exercise, the police station is considered a social benefit. Though I am not sure of the political tension and power struggles in the Distrito Nacional, which could make these a risk to the community if the police are corrupt. Fig. 14 Social vulnerability: distance from public transportation It is not known if these are all the transportation routes, or if they are still in existence. A major change that is not reflected in these maps is the installation of a metro-rail that goes 31
32 along and under Avenida Maximo Gomez all the way to Santo Domingo Norte. Depending on the location of the new stops, this could increase access to many marginalize communities. Fig. 15 Ares most vulnerable because of social conditions When all the distances were calculated and reclassified, they were then combined using the raster calculator to determine the areas that are most vulnerable because of their distance from public facilities. This is a very limited assessment and with the correct data a more accurate vulnerability assessment would include more detailed socio-ecconomic and demographic information. Fig. 16 Both assessments combined: Areas most vulnerable and at risk As demonstrated in Figure 21, this image represents the risk and vulnerability assessments combined. They were given equal weight and combined with the raster calculator. The areas that are at highest risk are the low laying areas in the floodplain and along the steepest slopes. The lease vulnerable areas are long the major transit corridors and higher elevations. Fig. 17 Digital elevation model of study area This shows the general topography of the study area; the darker the cell, the steeper the incline. Fig. 18 Risk and vulnerability in relation to topography Overlaying the risk and vulnerability analysis with the digital elevation model (DEM) shows that the risk and vulnerability assessment corresponds with the physical topography. Fig. 19 Fig. 20 3D image of study area, facing west 3D image of area with highest risk and most vulnerability Fig. 21 Steps of a risk and vulnerability assessment using GIS This figure is a visual to convey, in a very basic way, the process of creating the risk and vulnerability assessment. After the distances were measured with the spatial analyst, and reclassified, the raster calculator tool was used to combine the layers with the following weights. The given weights are arbitrary and the same assessment was run with all at equal weights and there was not much visual difference. Risk assessment: Cañadas 10%; Rio Isabela 10%; Floodplain 25%; Uneven ground 20%; Steep slope 35% Vulnerability assessment: Transporte 15%; Market 10%; Educacion 25%; Policia 20%; Salud 30% Risk and vulnerability assessment combined: Risk 50%; Vulnerability 50% 32
33 CONCLUSION My conclusion is two succinct parts: (1) a conclusion about the process of converting data from computer animated design drawing files to geographic information systems shapefiles, and (2) a conclusion about the results of the risk and vulnerability assessment. Part 1 The strength of GIS is also its greatest weakness: the availability of data. This project was more a lesson in data management and manipulation than actual results. The most valuable part of this project was learning how to use tools and techniques we learned in class, but in different ways. The process of importing, georeferencing and resizing all the layers was laborious, but it emphasized GIS s flexibility, when one understands the possibilities. This also is a cautionary example of how data can be manipulated, whether intentional or unintentional. Since cannot guarantee the accuracy of the original CAD files, I certainly cannot guarantee the accuracy of the newly created shapefiles. If nothing more, the methodology might serve as a how-to when one has unreferenced spatial data, whether raster or vector, and would like to import it into a GIS shapefile. However, the accuracy of the newly created shapefile is only as good as the data it came from. Part 2 By using CAD drawing files I was able to show how a variety of basic social and environmental factors can be analyzed to assess risk and vulnerability in the Distrio Nacional. Governmental institutions can benefit from collecting and creating data using GIS because it is not only easy to create maps, but it is easy to transfer and improve data. Located at the confluence of two large rivers and on the shores of an island nation, and with a population approaching one-million, the Distrito Nacional of the Domincan Republic embodies many unique social and environmental conditions that make understanding, assessing and addressing the needs of the community a challenge. While there are many limitations to this particular assessment, it does serve as a model for how future risk and vulnerability assessments may be approached, particularly with more extensive data. 33
34 REFERENCES Atlas Barrial del Distrito Nacional; Circunscripsción No.3, Ribera Isabela-Ozama, Dirección General de Planeamiento Urbano, Ayuntamiento del Distrito Nacional, 2006 ADN. Ayuntamiento del Distrito Nacional, República Dominicana < > Chantada, Amparo "Medio ambiente, crisis y desarrollo: reflexiones en torno a los Ríos Ozama e Isabela." In Antología Urbana de la Ciudad Alternativa. CONAU GEO Santo Domingo: Perspectiva del Medio Ambiente Urbano. Santo Domingo: Consejo Nacional de Asuntos Urbanos. Navarro, Andrés and Ayacx Mercedes "Organizaciones barriales, mejoramiento urbano y desarrollo de la ciudad." In Antología Urbana de la Ciudad Alternativa. Navarro, Andrés " Introducción," in Plan Cigua: Plan de desarrollo para La Ciénaga y Los Guandules. Navarro, Andrés "Desarrollo urbano en República Dominicana: preocupaciones y expectativas." Oficina Metropolitana de Servicios de Autobuses, Santo Domingo, República Dominicana http <:// > Pelling, Mark "Assessing urban vulnerability and social adaptation to risk: Evidence from Santo Domingo." International Development Planning Review. Risk and Vulnerability Assessment Tool (RVAT). NOAA Coastal Services Center. RESURE Plan Director, Plan de Accion Cooridnada Interinstitucional para la Reestructuración Social, Urbana, y Ecológica de los Barrios Marginados que Rodean los Rios Ozama e Isabela. Ayuntamiento del Distrito Nacional Sletto, Bjorn Diagnóstico participativo sobre las causas, riesgos y consecuencias de las inundaciones en la cañada Los Platanitos, Municipio Santo Domingo Norte. The University of Texas at Austin, School of Architecture, Center for Sustainable Development. Yunén, Rafael Emilio "La ciudad del presente." In La Ciudad en el Tiempo, pp Santo Domingo: Ciudad Alternativa. 34
35 APPENDIX 35
36 APPENDINDIX This is a valuable lesson in working with data from Latin America because there are many more architects and engineers than there are planners or demographers. If anything, I have learned in detail how attributes and shapes work together in GIS. Otherwise we could just use AutoCAD. Need to convert polygon to points. DATA SOURCES Census 2002 Oficina Nacional de Estadística, Secretariado Técnico de la Presidencia, República Dominicana GIS Shapefiles Ayuntamiento del Distrito Nacional (collected by Dr. Sletto) Caveat: Most the data is defined and projected using "WGS 1984 UTM Zone 19N" as the projected coordinate system and "GCS WGS 1984" as the geographic coordinate system, but reviewing the shapefiles in ArcCatalog, some data will have to be defined and projected. Got world map from ESRI Ensured Map from ESRI is projected Resized and clipped to new layer to Caribbean extent and exported to save memory Projected Coordinate System: WGS_1984_UTM_Zone_19N Geographic Coordinate System: GCS_WGS_1984 Separated Haiti from Hispanola. Muted color (Haiti is for geographical reference only) Created Major Roads file : "NOMBRE" = 'AVENIDA HNAS. MIRABAL' OR "NOMBRE" = 'AVENIDA JHON F. KENNEDY' OR "NOMBRE" = 'AVENIDA MAXIMO GOMEZ' OR "NOMBRE" = 'AVENIDA ABRAHAN LINCOLN' OR "NOMBRE" = 'PADRE CASTELLANOS' OR "NOMBRE" = 'AVENIDA EXPRESO V CENTENARIO' OR "NOMBRE" = '27 DE FEBRERO' OR "NOMBRE" = 'PARIS' OR "NOMBRE" = 'AVENIDA LAS AMERICAS' OR "NOMBRE" = AVENIDA LUPERON OR "NOMBRE" = 'AUTOPISTA DUARTE' OR "NOMBRE" = 'SAN VICENTE DE PAUL' How to convert CAD drawing file to GIS layer (dwg to lyr) Create a new polygon from CAD.dwg (i.e. Importing from CAD) In ArcCatalog Open Toolbox: - Search CAD - Double-click Import from CAD - Input.dwg you want to use (Ex: pobreza suelos ) 36
37 - Output to preferred file - Defined spatial reference to others - OK Suelos > Create layer - In ArcCatalog, click on Suelos.dwg, right click on Suelos.dwg > select create layer > chose location > open in ArcMap (Georeference later, when moving shapes) #Create new layer from CAD.dwg In ArcCatalog - Click on.dwg file in table of contents so all layers display - In preview see which layer is desirable (usually polygon and annotation) - Right click and Export - Export to shapefile (single) - This layer can be georeferenced if you want to create new polygons/lines/points by tracing - This layer is good for viewing and referencing imported shapefiles from.dwg in ArcMap. In ArcMap - Add data > select newly created polygon - View > Toobars > Georeferencing > Choose layer) - Georeferencing: - In table of contents, right click layer that accurate, select zoom to layer o In this view, select Georeferencing > fit to display o Add anchor points. Create features from AutoCAD - with sub-barrios 7 underneath AutoCAD layers, set sub-barrios 7 as the only selectable layer. - Select barrios corresponding to hatching (Pobreza: %, 40-50%, - Export to new layer (save as Pobreza_??-??_porciento.shp ) - In ArcCatalog, copy shape and save as Pobreza_??-??_porciento_modified.shp - Using Editor tool, modify layers (barrios) to match CAD drawings (only a few need some minor changes. Add Pobreza field in attribute table to each barrio of each layer - Open attribute table > Options > Add field > name: Pobreza > type: long integer > 100 precision > ok - Start editor > select target layer > enter data under pobreza field (Ex: 100 in all cells of Pobreza_50-100_porciento_modified, 50 for Pobreza_ ) Merge Layers - Input Datasets (all Pobreza_... layers) - Output layer Pobreza_five_merged 37
38 Display - Select Pobreza_five_merged > properties > symbology > show, quantities > fields: values pobreza, normailization none Terreno: (after all selected: data > export > new layer) Accidentado - Select by attribute "EntID" > AND "EntID" < Add to current selection "EntID" > 9413 AND "EntID" < Inundable - Select by attribute "EntID" > AND "EntID" < Add to current selection "EntID" > AND "EntID" < Add to current selection "EntID" = 1 - Add to current selection "EntID" = Revove from current selection "EntID" = Regular - Select by attribute "EntID" > AND "EntID" < Add new field into each terreno layer called Ter_tipo > add corresponding names into column (i.e. inundable, accidentado, regular (After adding new field, start editor and replace all blank cells using options > find and replace > replace all Merge Accidentado, Inundable, Regular into one shapefile - Toolbox > merge > Display unique values - terreno_merge properties > symbology > categories > unique values > value_field = ter_tipo Create Rio Isabela shape: (done need to describe process somehow got it from pobreza ) - add Rio Isabela Convert Transporte Files (looks like it has ca#adas) (Maybe Vial is better) (Converted Not able to use the above ) Convert Equipamento Comunitario - Import from CAD > input/output/define/ > OK > - Open Geodatabase in ArcMap > add line, add points - Using ArcMap, select a point in the.dwg legend and open attribute table, view only selected note EID - In ArcCatalog open TxProp in Priview mode and find that EID and note properties: (Centro de Acogida, Salud, Iglesia, Puesto Fijo de INSPIRE, Comedor Economico, Deporte/Club, Policia, Educacion, Mercado) - Find shape in.dwg map an select like shapes, export to new layer (repeat for each shape in legend 38
Data source, type, and file naming convention
 Exercise 1: Basic visualization of LiDAR Digital Elevation Models using ArcGIS Introduction This exercise covers activities associated with basic visualization of LiDAR Digital Elevation Models using ArcGIS.
Government 1008: Introduction to Geographic Information Systems. LAB EXERCISE 4: Got Database?
 Government 1008: Introduction to Geographic Information Systems Objectives: Creating geodatabases Joining attribute tables Attribute and location based queries Spatial joins Creating spatial and attribute
WFP Liberia Country Office
 1 Oscar Gobbato oscar.gobbato@wfp.org oscar.gobbato@libero.it WFP Liberia Country Office GIS training - Summary Objectives 1 To introduce to participants the basic concepts and techniques in using Geographic
Government 1009: Advanced Geographical Information Systems Workshop. LAB EXERCISE 3b: Network
 Government 1009: Advanced Geographical Information Systems Workshop LAB EXERCISE 3b: Network Objective: Using the Network Analyst in ArcGIS Implementing a network functionality as a model In this exercise,
A GIS helps you answer questions and solve problems by looking at your data in a way that is quickly understood and easily shared.
 A Geographic Information System (GIS) integrates hardware, software, and data for capturing, managing, analyzing, and displaying all forms of geographically referenced information. GIS allows us to view,
INSTRUCTIONS FOR MAKING 3D,.DWG CONTOUR LINES
 INSTRUCTIONS FOR MAKING 3D,.DWG CONTOUR LINES A TUTORIAL FROM SPATIAL AND NUMERIC DATA SERVICES NICOLE SCHOLTZ AND GEOFF IVERSON Overview... 2 A. Get a Digital Elevation Model (DEM)... 3 B. Open ArcMap,
Spatial Adjustment Tools: The Tutorial
 Spatial Adjustment Tools: The Tutorial By Peter Kasianchuk, ESRI Educational Services In this exercise, you will perform some spatial adjustment and data management operations data to be used in analysis
A Method Using ArcMap to Create a Hydrologically conditioned Digital Elevation Model
 A Method Using ArcMap to Create a Hydrologically conditioned Digital Elevation Model High resolution topography derived from LiDAR data is becoming more readily available. This new data source of topography
Software: AutoCAD Civil 3D 2014, NRCS C3D 2014 template, ESRI ArcMap. Notation:Button to Press Displayed Text Icon Action {Text to Enter} Menu Item
 Overview: Use the following processes for exchanging georeferenced data between AutoCAD Civil 3D 2014 and ArcMap. The work must be based in any real world coordinate system. (This example uses NAD 83 UTM
Under GIS Data select Hydrography This will show all of the state-wide options for hydrography data. For this project, we want the seventh entry in
 Introductory Exercises for GIS Using ArcMap & ArcCatalog GIS Cyberinfrastructure Module EEB 5894, section 10 Please refer to the ESRI online GIS Dictionary for additional details on any of the terms in
1. Launch ArcCatalog, then navigate to the following location using the directory tree on the left side of the screen:
 Vector Data Analysis I: Buffering Today we will use ArcMap and ArcToolbox to manipulate vector-based geographic data. The results of these simple analyses will allow us to visualize complex spatial relationships.
Using CAD Data in ArcGIS
 Esri International User Conference San Diego, California Technical Workshops July 27, 2012 Using CAD Data in ArcGIS Jeff Reinhart & Phil Sanchez Agenda Overview of ArcGIS CAD Support Using CAD Datasets
Tutorial 8 Raster Data Analysis
 Objectives Tutorial 8 Raster Data Analysis This tutorial is designed to introduce you to a basic set of raster-based analyses including: 1. Displaying Digital Elevation Model (DEM) 2. Slope calculations
Spatial Analyst Tutorial
 Copyright 1995-2010 Esri All rights reserved. Table of Contents About the ArcGIS Spatial Analyst Tutorial......................... 3 Exercise 1: Preparing for analysis............................ 5 Exercise
What is GIS? Geographic Information Systems. Introduction to ArcGIS. GIS Maps Contain Layers. What Can You Do With GIS? Layers Can Contain Features
 What is GIS? Geographic Information Systems Introduction to ArcGIS A database system in which the organizing principle is explicitly SPATIAL For CPSC 178 Visualization: Data, Pixels, and Ideas. What Can
Data Interoperability Extension Tutorial
 Data Interoperability Extension Tutorial Copyright 1995-2010 Esri All rights reserved. Table of Contents About the Data Interoperability extension tutorial...................... 3 Exercise 1: Using direct-read
Create a folder on your network drive called DEM. This is where data for the first part of this lesson will be stored.
 In this lesson you will create a Digital Elevation Model (DEM). A DEM is a gridded array of elevations. In its raw form it is an ASCII, or text, file. First, you will interpolate elevations on a topographic
Raster to Vector Conversion for Overlay Analysis
 Raster to Vector Conversion for Overlay Analysis In some cases, it may be necessary to perform vector-based analyses on a raster data set, or vice versa. The types of analyses that can be performed on
Tutorial 3 - Map Symbology in ArcGIS
 Tutorial 3 - Map Symbology in ArcGIS Introduction ArcGIS provides many ways to display and analyze map features. Although not specifically a map-making or cartographic program, ArcGIS does feature a wide
Geographic Information Systems (GIS) @ GIS at UCSD. Here to help you explore our world
 @ GIS at UCSD. Here to help you explore our world") Geographic Information Systems (GIS) @ GIS at UCSD Here to help you explore our world GIS at UCSD what it is and what it means to you Tracey Hughes UCSD GIS Coordinator 2006 Image from Google Earth An
Geographic Information Systems (GIS) @ GIS at UCSD Here to help you explore our world GIS at UCSD what it is and what it means to you Tracey Hughes UCSD GIS Coordinator 2006 Image from Google Earth An
Getting Started with the ArcGIS Predictive Analysis Add-In
 Getting Started with the ArcGIS Predictive Analysis Add-In Table of Contents ArcGIS Predictive Analysis Add-In....................................... 3 Getting Started 4..............................................
Data Visualization. Brief Overview of ArcMap
 Data Visualization Prepared by Francisco Olivera, Ph.D., P.E., Srikanth Koka and Lauren Walker Department of Civil Engineering September 13, 2006 Contents: Brief Overview of ArcMap Goals of the Exercise
Geography 3251: Mountain Geography Assignment III: Natural hazards A Case Study of the 1980s Mt. St. Helens Eruption
 Name: Geography 3251: Mountain Geography Assignment III: Natural hazards A Case Study of the 1980s Mt. St. Helens Eruption Learning Objectives: Assigned: May 30, 2012 Due: June 1, 2012 @ 9 AM 1. Learn
Creating a File Geodatabase
 Creating a File Geodatabase Updated by Thomas Stieve January 06, 2012 This exercise demonstrates how to create a file geodatabase in ArcGIS 10; how to import existing data into the geodatabase, and how
Creating Figure Ground Maps in ArcMap 10.x: Basic procedures to download, open, manipulate and print spatial data
 Creating Figure Ground Maps in ArcMap 10.x: Basic procedures to download, open, manipulate and print spatial data These procedures outline: A. Retrieving Property Data B. Uncompressing the Downloaded Files
ArcGIS Tutorial: Adding Attribute Data
 ArcGIS Tutorial: Adding Attribute Data Introduction A common need in GIS is to map characteristics, or attributes, of different geographic areas. These maps are called thematic maps. Examples of thematic
INTRODUCTION to ESRI ARCGIS For Visualization, CPSC 178
 INTRODUCTION to ESRI ARCGIS For Visualization, CPSC 178 1) Navigate to the C:/temp folder 2) Make a directory using your initials. 3) Use your web browser to navigate to www.library.yale.edu/mapcoll/ and
TABLE OF CONTENTS. 7. shapefile..59. shapefile... 45. 4. shapefile
 ArcView 8.3. Johansson, T.,.,.: e-learning MINERVA GISAS, ) 2005. Mr. Tino Johansson University of Helsinki, Finland.. 2. (Print Screen shots) ArcCatalog ArcMap. copyright ESRI, Inc. GISAS, MINERVA 2003-2006.
Converting GIS Datasets into CAD Format
 Ball State University Libraries GIS Research and Map Collection Converting GIS Datasets into CAD Format Author: Angela Gibson, 6/13/2014 Overview: One of the most common requests from students is for GIS
User s Guide to ArcView 3.3 for Land Use Planners in Puttalam District
 User s Guide to ArcView 3.3 for Land Use Planners in Puttalam District Dilhari Weragodatenna IUCN Sri Lanka, Country Office Table of Content Page No Introduction...... 1 1. Getting started..... 2 2. Geo-referencing...
Cookbook 23 September 2013 GIS Analysis Part 1 - A GIS is NOT a Map!
 Cookbook 23 September 2013 GIS Analysis Part 1 - A GIS is NOT a Map! Overview 1. A GIS is NOT a Map! 2. How does a GIS handle its data? Data Formats! GARP 0344 (Fall 2013) Page 1 Dr. Carsten Braun 1) A
University of Arkansas Libraries ArcGIS Desktop Tutorial. Section 5: Analyzing Spatial Data. Buffering Features:
 : Analyzing Spatial Data Buffering Features: A buffer operation is one of the most common spatial analysis tools. A buffer is a map feature that represents a uniform distance around a feature. When creating
Introduction to GIS. http://libguides.mit.edu/gis
 Introduction to GIS http://libguides.mit.edu/gis 1 Overview What is GIS? Types of Data and Projections What can I do with GIS? Data Sources and Formats Software Data Management Tips 2 What is GIS? 3 Characteristics
Government 98dn Mapping Social and Environmental Space
 Government 98dn Mapping Social and Environmental Space LAB EXERCISE 5: The Analysis of Fields Objectives of this lab: Visualizing raster data Using Spatial Analyst functions to create new data Analysis
Introduction to GIS (Basics, Data, Analysis) & Case Studies. 13 th May 2004. Content. What is GIS?
 & Case Studies. 13 th May 2004. Content. What is GIS?") Introduction to GIS (Basics, Data, Analysis) & Case Studies 13 th May 2004 Content Introduction to GIS Data concepts Data input Analysis Applications selected examples What is GIS? Geographic Information
Introduction to GIS (Basics, Data, Analysis) & Case Studies 13 th May 2004 Content Introduction to GIS Data concepts Data input Analysis Applications selected examples What is GIS? Geographic Information
Data Visualization. Prepared by Francisco Olivera, Ph.D., Srikanth Koka Department of Civil Engineering Texas A&M University February 2004
 Data Visualization Prepared by Francisco Olivera, Ph.D., Srikanth Koka Department of Civil Engineering Texas A&M University February 2004 Contents Brief Overview of ArcMap Goals of the Exercise Computer
University of Arkansas Libraries ArcGIS Desktop Tutorial. Section 2: Manipulating Display Parameters in ArcMap. Symbolizing Features and Rasters:
 : Manipulating Display Parameters in ArcMap Symbolizing Features and Rasters: Data sets that are added to ArcMap a default symbology. The user can change the default symbology for their features (point,
What is GIS. What is GIS? University of Tsukuba. What do you image of GIS? Copyright(C) ESRI Japan Corporation. All rights reserved.
 ESRI Japan Corporation. All rights reserved.") What is GIS University of Tsukuba Graduate School of Life and Environmental Science April 21 st, 2011 What is GIS? What do you image of GIS? Gas Insulated Switch Groupe Interventional Speciale Geographic
What is GIS University of Tsukuba Graduate School of Life and Environmental Science April 21 st, 2011 What is GIS? What do you image of GIS? Gas Insulated Switch Groupe Interventional Speciale Geographic
Using GIS to Develop a Control Map and Database
 PENN STATE UNIVERSITY Using GIS to Develop a Control Map and Database SUR-351 Geodetic Models Brian E. Halchak & Rich Cebrick 12/2/2013 Table of Contents Abstract... 2 What is a GIS?... 2 Development of
Census Data: Access, Mapping and Visualization
 Census Data: Access, Mapping and Visualization Trent University is a member of the Data Liberation Initiative (DLI), an agreement that provides academic institutions with access to otherwise restricted
Working with Data from External Sources
 Working with Data from External Sources Bentley WaterCAD V8i supports several methods of exchanging data with external applications, preventing duplication of effort and allowing you to save time by reusing
University of Arkansas Libraries ArcGIS Desktop Tutorial. Section 4: Preparing Data for Analysis
 : Preparing Data for Analysis When a user acquires a particular data set of interest, it is rarely in the exact form that is needed during analysis. This tutorial describes how to change the data to make
Groundwater Chemistry
 Mapping and Modeling Groundwater Chemistry By importing Excel spreadsheets into ArcGIS 9.2 By Mike Price, Entrada/San Juan, Inc. In ArcGIS 9.2, Microsoft Excel spreadsheet data can be imported and used
Getting Started With LP360
 Getting Started With LP360 10/30/2014 1 Contents What is LP360?... 3 System Requirements... 3 Installing LP360... 4 How to Enable the LP360 Extension... 4 How to Display the LP360 Toolbar... 4 How to Import
How To Hydrologically Condition A Digital Dam
 Program: Funding: Conservation Applications of LiDAR Data http://tsp.umn.edu/lidar Environment and Natural Resources Trust Fund Module: Instructor: Hydrologic Applications Sean Vaughn, DNR GIS Hydrologist
The Spatiotemporal Visualization of Historical Earthquake Data in Yellowstone National Park Using ArcGIS
 The Spatiotemporal Visualization of Historical Earthquake Data in Yellowstone National Park Using ArcGIS GIS and GPS Applications in Earth Science Paul Stevenson, pts453 December 2013 Problem Formulation
Development of an Impervious-Surface Database for the Little Blackwater River Watershed, Dorchester County, Maryland
 Development of an Impervious-Surface Database for the Little Blackwater River Watershed, Dorchester County, Maryland By Lesley E. Milheim, John W. Jones, and Roger A. Barlow Open-File Report 2007 1308
ArcScan Tutorial. Copyright 1995-2012 Esri All rights reserved.
 Copyright 1995-2012 Esri All rights reserved. Table of Contents Exercise 1: Interactive vectorization........................... 3 Exercise 2: Automatic vectorization........................... 12 Copyright
Tutorial Creating a regular grid for point sampling
 This tutorial describes how to use the fishnet, clip, and optionally the buffer tools in ArcGIS 10 to generate a regularly-spaced grid of sampling points inside a polygon layer. The steps below should
INTRODUCTION TO ARCGIS SOFTWARE
 INTRODUCTION TO ARCGIS SOFTWARE I. History of Software Development a. Developer ESRI - Environmental Systems Research Institute, Inc., in 1969 as a privately held consulting firm that specialized in landuse
Personal Geodatabase 101
 Personal Geodatabase 101 There are a variety of file formats that can be used within the ArcGIS software. Two file formats, the shape file and the personal geodatabase were designed to hold geographic
Effects of Florida Under a 10 Meter Sea Level Rise
 Effects of Florida Under a 10 Meter Sea Level Rise Chance B. Murray Dec. 7 2009 I. Goal Assess the effects a 10 meter sea level rise would have on Florida. Mission: Determine the length of Florida s coastline
A Workflow for Creating and Sharing Maps
 A Workflow for Creating and Sharing Maps By Keith Mann, Esri What You Will Need Item Source ArcGIS Online for Organizations subscription ArcGIS 10.1 for Desktop (Any license level) ArcGIS Spatial Analyst
13/10/2011. Data Integration and Interoperability. Gordon Sumerling & Maree Wilson
 Data Integration and Interoperability Gordon Sumerling & Maree Wilson 1 Agenda Seamless integration between GIS and CAD CAD Support in ArcGIS Using GIS Data in CAD Editing GIS Data in CAD Introduction
GEOGRAPHIC INFORMATION SYSTEMS Lecture 20: Adding and Creating Data
 Adding Existing Data Into ArcGIS - there are many different ways to get data into ArcGIS GEOGRAPHIC INFORMATION SYSTEMS Lecture 20: Adding and Creating Data Add Data - normally we use the Add Data button
Database Servers Tutorial
 Copyright 1995-2010 Esri All rights reserved. Table of Contents A quick tour of the database servers tutorial........................ 3 Exercise 1: Add a database server to the Catalog tree and create
Lab 6: Distance and Density
 Lab 6: Distance and Density Exercise 1: Air Ambulance study The dispatch managers of local hospitals providing air ambulance service are working together with local schools and colleges to conduct a preliminary
Tutorial 4 - Attribute data in ArcGIS
 Tutorial 4 - Attribute data in ArcGIS Note: Before beginning the tutorial, please make sure your server folder is mapped. The data you will be working with this week is contained in a winzip archive called
Introduction to GIS software
 Introduction to GIS software There are a wide variety of GIS software packages available. Some of these software packages are freely available for you to download and could be used in your classroom. ArcGIS
Finding GIS Data and Preparing it for Use
 Finding_Data_Tutorial.Doc Page 1 of 19 Getting Ready for the Tutorial Sign Up for the GIS-L Listserv Finding GIS Data and Preparing it for Use The Yale University GIS-L Listserv is an internal University
Online Digitizing and Editing of GIS Layers (On-Screen or Head s Up Digitizing)
") Online Digitizing and Editing of GIS Layers (On-Screen or Head s Up Digitizing) 2011 Charlie Schweik, Alexander Stepanov, Maria Fernandez, Lara Aniskoff Note: This work is licensed under the Creative Commons
Online Digitizing and Editing of GIS Layers (On-Screen or Head s Up Digitizing) 2011 Charlie Schweik, Alexander Stepanov, Maria Fernandez, Lara Aniskoff Note: This work is licensed under the Creative Commons
The Courses. Covering complete breadth of GIS technology from ESRI including ArcGIS, ArcGIS Server and ArcGIS Engine.
 ESRI India: Corporate profile ESRI India A profile India s Premier GIS Company Strategic alliance between ESRI Inc. and NIIT Technologies Adjudged as India s Best GIS Solutions Company - Map India 2001
Raster: The Other GIS Data
 04-Raster_Tutorial_Arcgis_93.Doc Page 1 of 11 Raster: The Other GIS Data Objectives Understand the raster format and how it is used to model continuous geographic phenomena Understand how projections &
GIS III: GIS Analysis Module 2a: Introduction to Network Analyst
 *** Files needed for exercise: nc_cty.shp; target_stores_infousa.dbf; streets.sdc (provided by street map usa); NC_tracts_2000sf1.shp Goals: To learn how to use the Network analyst tools to perform network
ArcGIS. Tips and Shortcuts. for Desktop
 ArcGIS Tips and Shortcuts for Desktop Map Navigation Refresh and redraw the display. F5 Suspend the map s drawing. F9 Zoom in and out. Center map. Roll the mouse wheel backward and forward. Hold down Ctrl
ArcScan Tutorial. Copyright 1995-2010 Esri All rights reserved.
 Copyright 1995-2010 Esri All rights reserved. Table of Contents Exercise 1: Interactive vectorization........................... 3 Exercise 2: Automatic vectorization........................... 12 Copyright
GEOGRAPHIC INFORMATION SYSTEMS CERTIFICATION
 GEOGRAPHIC INFORMATION SYSTEMS CERTIFICATION GIS Syllabus - Version 1.2 January 2007 Copyright AICA-CEPIS 2009 1 Version 1 January 2007 GIS Certification Programme 1. Target The GIS certification is aimed
Working with the Raster Calculator
 Working with the Raster Calculator The Raster Calculator provides you a powerful tool for performing multiple tasks. You can perform mathematical calculations using operators and functions, set up selection
GIS: Geographic Information Systems A short introduction
 GIS: Geographic Information Systems A short introduction Outline The Center for Digital Scholarship What is GIS? Data types GIS software and analysis Campus GIS resources Center for Digital Scholarship
TUTORIAL - Locations & Mapping. Using the ESdat Environmental Database System. For use with ESDAT version 5
 TUTORIAL - Locations & Mapping Using the ESdat Environmental Database System For use with ESDAT version 5 (version 5 software updates available from ) Function Tutorial - Locations and Mapping Table of
Create and share a map with GIScloud.com
 Create and share a map with GIScloud.com GIS Cloud is a web based Geographic Information System powered by Cloud Computing and with the full power of desktop GIS. It allows users to create and access your
Geographic Information Systems Training Module I through 4
 Geographic Information Systems Training Module I through 4 ARC GIS 10.x Geographic Information Systems and GPS Training Guide Developed by Stephen P. Menard Jr, USAID/Malawi Program Officer - Original
GIS IN ECOLOGY: GIS PROJECT ISSUES
 GIS IN ECOLOGY: GIS PROJECT ISSUES Contents Introduction... 2 Conducting a GIS Analysis... 2 GIS File Management and Software... 3 Course Data Sources... 6 Tasks... 7 Copying GIS Data... 7 Managing Data
ANALYSIS 3 - RASTER What kinds of analysis can we do with GIS?
 ANALYSIS 3 - RASTER What kinds of analysis can we do with GIS? 1. Measurements 2. Layer statistics 3. Queries 4. Buffering (vector); Proximity (raster) 5. Filtering (raster) 6. Map overlay (layer on layer
Linear Referencing Tutorial
 Copyright 1995-2010 Esri All rights reserved. Table of Contents An overview of the linear referencing tutorial........................ 3 Exercise 1: Organizing your linear referencing data in ArcCatalog...............
GIS Architecture and Data Management Practices Boone County GIS Created and Maintained by the Boone County Planning Commission GIS Services Division
 GIS Architecture and Data Management Practices Boone County GIS Created and Maintained by the Boone County Planning Commission June 2008 Background Boone County s GIS program has been in existence for
ABSTRACT Utilizing Mobile GIS for Hydrology and Hydraulics Field Reconnaissance
 ABSTRACT Utilizing Mobile GIS for Hydrology and Hydraulics Field Reconnaissance Jessica D. Baker 1, EIT, CFM and Noelle Gaspard 1, CFM Advances in technology have dramatically improved traditional methods
From GPS Data Collection to GIS Data Display A Walk-Through Example
 From GPS Data Collection to GIS Data Display A Walk-Through Example The Global Positioning System (GPS) is a satellite based navigation system consisting of 24 satellites, a worldwide network of tracking
The UCC-21 cognitive skills that are listed above will be met via the following objectives.
 Master Syllabus Department of Geography GEOG 265: Introduction to Geographic Information Systems Course Description Fundamentals of geographic information systems (GIS). How to visualize geographic information
Soil Data Viewer 5.1 User Guide
 Soil Data Viewer 5.1 User Guide Soil Survey Division October 2006 INTRODUCTION... 5 WHAT IS SOIL DATA VIEWER... 5 WHAT SOFTWARE AND CAPABILITIES DO I NEED TO USE SOIL DATA VIEWER 5.1?... 5 WHAT DATA DO
ArcGIS Reference Document
 Migration of GIS Data to ArcSDE Page 1 of 10 Table of Contents A Brief Summary of DEP s GIS Data Storage o The Y Drive o ArcSDE (Spatial Database) Keeping Your GIS Project Data Current o Checking Your
DWGSee Professional User Guide
 DWGSee Professional User Guide DWGSee is comprehensive software for viewing, printing, marking and sharing DWG files. It is fast, powerful and easy-to-use for every expert and beginners. Starting DWGSee
Data Mining and Analysis in ArcGIS Online Joseph Kerski Education Manager Esri jkerski@esri.com Twitter @josephkerski 303-449-7779 x 18237
 Data Mining and Analysis in ArcGIS Online Joseph Kerski Education Manager Esri jkerski@esri.com Twitter @josephkerski 303-449-7779 x 18237 Joseph Kerski Webinar 1 Goals for this workshop 1. Understanding
Publishing Geoprocessing Services Tutorial
 Publishing Geoprocessing Services Tutorial Copyright 1995-2010 Esri All rights reserved. Table of Contents Tutorial: Publishing a geoprocessing service........................ 3 Copyright 1995-2010 ESRI,
ArcFuels Supplemental Material: GIS 9.x Tips and Tricks
 ArcFuels Supplemental Material: GIS 9.x Tips and Tricks Supplemental material: GIS Tips and Tricks... 1 Shapefiles: Points, Lines, and Polygons... 2 Creating a New Shapefile (point, line, or polygon)...
ART Vulnerability and Risk Assessment Report September 2012 Appendix C. ART GIS Exposure Analysis
 Adapting to Rising Tides GIS Exposure Analysis The aim of this appendix is to familiarize the reader with the data and methodology that was used to conduct an analysis of shoreline and community asset
HELCOM Data and Map Service. User Manual
 HELCOM Data and Map Service User Manual Version 2.2 - February 2015 1 Table of contents 1. General Information... 3 1.1 Background... 3 1.2 Technical requirements... 3 1.3 Contact... 3 2. Accessing HELCOM
GEOGRAPHIC INFORMATION SYSTEMS
 GIS GEOGRAPHIC INFORMATION SYSTEMS FOR CADASTRAL MAPPING Chapter 7 2015 Cadastral Mapping Manual 7-0 GIS - GEOGRAPHIC INFORMATION SYSTEMS What is GIS For a long time people have sketched, drawn and studied
How to use PGS: Basic Services Provision Map App
 How to use PGS: Basic Services Provision Map App The PGS: Basic Services Provision Map App The main features of the PGP Basic Services web application includes: Navigation Tools Map Tools Main Map Links
Objectives. Raster Data Discrete Classes. Spatial Information in Natural Resources FANR 3800. Review the raster data model
 Spatial Information in Natural Resources FANR 3800 Raster Analysis Objectives Review the raster data model Understand how raster analysis fundamentally differs from vector analysis Become familiar with
ArcGIS Online. Visualizing Data: Tutorial 3 of 4. Created by: Julianna Kelly
 ArcGIS Online Visualizing Data: Tutorial 3 of 4 2014 Created by: Julianna Kelly Contents of This Tutorial The Goal of This Tutorial In this tutorial we will learn about the analysis tools that ArcGIS Online
What do I do first in ArcView 8.x? When the program starts Select from the Dialog box: A new empty map
 www.library.carleton.ca/find/gis Introduction Introduction to Georeferenced Images using ArcGIS Georeferenced images such as aerial photographs or satellite images can be used in many ways in both GIS
GIS Tools for Land Managers
 Citation: Karl, J. 2010. GIS Tools for Land Managers. Sound Science White Paper Series #05. www.sound-science.org. GIS Tools for Land Managers Most land managers recognize that geographic information systems
Investigation 6: What happens when plates collide?
 Tectonics Investigation 6: Teacher Guide Investigation 6: What happens when plates collide? In this activity, students will use the distribution of earthquakes and volcanoes in a Web GIS to learn about
GEOGRAPHIC INFORMATION SYSTEMS
 GIS GEOGRAPHIC INFORMATION SYSTEMS FOR CADASTRAL MAPPING Chapter 6 2015 Cadastral Mapping Manual 6-0 GIS - GEOGRAPHIC INFORMATION SYSTEMS What is GIS For a long time people have sketched, drawn and studied
Introduction to GIS Mapping and ESRI s ArcGIS Software
 01-Introduction To GIS Mapping And Arcgis 9.2 Software.Doc Page 1 of 25 Objectives Introduction to GIS Mapping and ESRI s ArcGIS Software In this exercise you are introduced to the ArcMap interface and
Version 3.0, April 16, 2012, updated for ArcGIS 10.0 Produced by the Geographic Information Network of Alaska http://www.gina.alaska.
 Using the AlaskaMapped Web Services in ESRI ArcGIS Version 3.0, April 16, 2012, updated for ArcGIS 10.0 Produced by the Geographic Information Network of Alaska http://www.gina.alaska.edu AlaskaMapped
Modeling Fire Hazard By Monica Pratt, ArcUser Editor
 By Monica Pratt, ArcUser Editor Spatial modeling technology is growing like wildfire within the emergency management community. In areas of the United States where the population has expanded to abut natural
Contouring and Advanced Visualization
 Contouring and Advanced Visualization Contouring Underlay your oneline with an image Geographic Data Views Auto-created geographic data visualization Emphasis of Display Objects Make specific objects standout
Use Geodatabase Subtypes and Attribute Domains for Automatic Validation Tutorial
 Use Geodatabase Subtypes and Attribute Domains for Automatic Validation Tutorial By Marnel Taggart and Mike Ridland, ESRI Educational Services Overview This tutorial supplements the article Use Geodatabase