THE ECONOMIC IMPACTS OF MEDICAID EXPANSION ON MISSOURI
|
|
|
- Sherilyn Matthews
- 8 years ago
- Views:
Transcription
1 THE ECONOMIC IMPACTS OF MEDICAID EXPANSION ON MISSOURI Prepared by: University of Missouri School of Medicine Department of Health Management and Informatics and Dobson DaVanzo & Associates, LLC, Vienna VA November 2012 Prepared for: Missouri Hospital Association Missouri Foundation for Health
2 University of Missouri School of Medicine Department of Health Management and Informatics Lanis L. Hicks, Ph.D. Sue Boren, Ph.D. Ricky Leung, Ph.D. Adam Bouras Ashley Kimberling Kyle Myers Dobson DaVanzo & Associates, LLC Joan DaVanzo, Ph.D., M.S.W. Steven Heath, M.P.A. Greg Berger Al Dobson, Ph.D.
3 TABLE OF CONTENTS UNDERLYING ASSUMPTIONS...v EXECUTIVE SUMMARY...vi INTRODUCTION...1 OVERVIEW OF MEDICAID EXPANSION OPTION...2 Medicaid Nationally and in Missouri...3 Funding Under ACA Medicaid Expansion...3 GEOGRAPHIC AREAS OF ANALYSIS...4 ASSUMPTIONS IN MODEL...5 INSURANCE COVERAGE UNDER MEDICAID EXPANSION...6 MODEL INPUTS NEW MEDICAID ENROLLEES UNDER MEDICAID EXPANSION...7 MODEL INPUTS FEDERAL MEDICAID EXPENDITURES DERIVED DEMAND DUE TO INCREASED MEDICAID ENROLLMENT...8 FINDINGS ECONOMIC ANALYSIS...9 Overview of Topics...9 Job Creation Results...11 Labor Income Results...13 Value Added to Gross State Product...13 Tax Impact...14 EFFECT OF MEDICAID EXPANSION ON PRIVATE SECTOR PREMIUMS...16 CONCLUSIONS REGARDING KEY IMPACTS...18 REFERENCES...19 APPENDIX...21 Detailed Tables...21 Health Insurance Exchanges...28 Maps...29 LIST OF TABLES Table 1: Federal Government Payment for Newly Eligible Enrollees...3 Table 2: Medicaid Expansion in the Missouri Context, Table 3: Impact of Medicaid Expansion on Missouri by Type of Industry, Table 4: Impact of New Job Creation on Unemployment, Table 5: Total Value Added to GSP with Medicaid Expansion, (in millions)...14 Table 6: Total Tax Generated...15 Tables in Appendix Table 1a: Total Population Ages in Missouri, Table 2a: Total Population Ages and 138% of the FPL in Missouri, Table 3a: Eligible Individuals, Age % of the FPL, Table 4a: New Medicaid Enrollees under Medicaid Expansion Program, Page iii
4 LIST OF TABLES CONTINUED Table 5a: Comparison of Federal and State Contributions to Missouri Medicaid Expansion Program, Table 6a: Employment Generated by Type of Effect by WIA, Table 7a: Labor Income Generated by Type of Effect by WIA, Table 8a: Value Added Generated by Type of Effect by WIA, Table 9a: Impact of Job Creation, in Terms of Current Major Employer, per WIA, Table 10a: Taxes Generated from Medicaid Expansion by WIA, Table 11a: Basic Multipliers by WIA, Table 12a: Applicable Percentage Table for Health Insurance Exchanges...28 LIST OF FIGURES Figure 1: Missouri Workforce Investment Areas...4 Figure 2: Newly Eligible Individuals Under Medicaid Expansion, Figure 3: New Enrollees in Medicaid, Figure 4: Federal and State Contri butions to Missouri Medicaid Expansion, Figure 5: Federal and State Share of Contributions for Figure 6: Impact of Infusion of New Monies in an Economy...10 Figure 7: Employment Generated by Year, Figure 8: Labor Income Generated by Medicaid Expansion, Figure 9: Tax Generation with the Medicaid Expansion, Figure 10: Projected Reduction in Private Sector Premiums Due to Cost Shifting From Medicaid Expansion, Figure 11: Projected Reduction in Total Private Sector Premiums Due to Cost Shifting From Medicaid Expansion, MAPS IN APPENDIX Map 1: Uninsured Individuals Ages and at or below 138% of Poverty, Map 2: Federal Contributions from Medicaid Expansion, Map 3: State Contributions from Medicaid Expansion, Map 4: Total Jobs Created from Medicaid Expansion, Map 5: Total Labor Income from Medicaid Expansion, Map 6: Total Value Added from Medicaid Expansion, Page iv
5 UNDERLYING ASSUMPTIONS This study examines the enrollment, economic and tax impacts of the Medicaid expansion on Missouri. The opportunity to expand states Medicaid programs was created because of the Patient Protection and Affordable Care Act, more commonly known as the Affordable Care Act (ACA). In performing the study, the 3.0 version of the IMPLAN model was used to generate the potential impact of Medicaid expansion on Medicaid enrollment, Medicaid expenditures, jobs created, labor income, taxes generated and the impact it could have on private insurance premiums. IMPLAN 3.0 is an input-output model used to examine the impact of changes (expanding or contracting) that occur in an industry or economy. In performing the analysis, a number of important assumptions were made. As decisions were made about the Missouri-specific data to include in the model, the approach was to be conservative. This included using the household multipliers instead of government multipliers in IMPLAN, which reflect household spending resulting from the infusion of resources. In addition, the results involve the net value-added output to the economy, not the total output. This is consistent with the way national and state gross domestic products are calculated. As a result, the findings in this report should be viewed as representing a very conservative estimate of the potential impact of Medicaid expansion on Missouri, which is consistent with economic theory. Missouri will begin to participate in the Medicaid expansion in The potential population included only individuals ages From the potential population, only individuals with incomes at or below 138% of the federal poverty level (FPL) were included. Of the individuals at or below 138% of the poverty level, only those uninsured were included. Of these potentially eligible individuals, it was assumed only 73% would actually enroll in Medicaid. The initial cost per Medicaid enrollee was assumed to be $6,556, based on historic Medicaid costs for adult services, excluding nursing facilities and Part D premiums. The federal share of the costs during will be 96.1%. Once the key assumptions involving eligibility, enrollment and cost were established, these factors were included in the IMPLAN model to estimate the impact of Medicaid expansion on Missouri. In addition to estimating the direct effect of Medicaid expansion on Missouri, the indirect and induced effects associated with the infusion of federal dollars into the state were calculated. The data used in the model were obtained at the county level, and then the county data were aggregated into the 10 Workforce Investment Areas (WIAs) of Missouri. State level calculations were not simply the aggregation of the WIAs but instead were performed separately to minimize the distortions that might occur from interactions among the WIAs. Cost of Medicaid Expansion The estimated average health care cost of an adult individual enrolled in Missouri Medicaid was $6,556 in From 2014 to 2020, the federal government will contribute $8.2 billion to Missouri s Medicaid expansion (96.1% of total expansion costs). From 2014 to 2020, the Missouri government will contribute $332.9 million to the Medicaid expansion (3.9% of total expansion costs). Expected Increase in Medicaid Eligibility and Enrollment with Expansion Federal and State Contributions to Medicaid Expansion Program for Figure 5: Federal and State Contributions to Medicaid Expansion Program for $332,855, % $8,235,061, % Between 2014 and 2020, the population at or below 138% of the federal poverty level in Missouri is projected to increase by 2.34%, from 663,915 to 679,467. With the expansion of Medicaid in 2014, 218,165 additional Missourians would be eligible for Medicaid, and this number would grow to 220,932 by Approximately 73% of newly eligible enrollees would enroll in Medicaid; this will result in an estimated 161,281 new enrollees in the Medicaid program in State Federal Page v
.")

6 EXECUTIVE SUMMARY This report estimates the potential impact of Medicaid expansion on Missouri, if the state elects to opt in to the Medicaid expansion under the Patient Protection and Affordable Care Act (ACA). It is critical that, as this decision on whether or not to participate is made, state law and policymakers thoroughly consider the impact on the number of individuals insured, the state budget and the potential change in Missouri s employment rate. Current Impact of the Uninsured Population on Missouri increased cost of private insurance premiums increased cost of public programs, such as Medicare and Medicaid inefficient use of emergency department resources loss of work productivity Impact of Infusion of New Monies in an Economy Job Creation and Labor Income Increased Jobs: Expansion of Medicaid in Missouri is projected to generate an additional 24,008 jobs in Missouri in In one year, this is more than the employment of Missouri s 10 Fortune 500 companies in the state. It also is 12.8% of the total unemployment number in Missouri in Increased Payroll: Labor income in the state is projected to increase by nearly $7 billion during the period 2014 to Increased GSP: In 2011, the Missouri gross state product (GSP) was $249.5 billion. If Missouri participates in the Medicaid expansion, it has the potential of adding another $9.6 billion in value-added output to the economy from (an approximate 0.53% increase to the total GSP). Total Impact: The total effects (direct, indirect and induced) of the original $8.6 billion Medicaid expansion is an additional $9.6 billion of value-added output to the state. Increased Tax Revenue: The Medicaid expansion will generate $856 million in additional state and local taxes from 2014 to 2020 and $1.4 billion in federal taxes due to the increase in jobs and economic activity, for a total tax collected of $2.3 billion. Page vi
7 Effect of Medicaid Expansion on Private Insurance Premiums Cost Shift A cost shift occurs when some payers underpay hospitals and other health care providers relative to the costs of providing care. These costs may then be passed on to private payers in the form of higher premiums. Given no change, the average private insurance premium for a family of four in Missouri was $12,754 in 2010 and is projected to cost $14,992 in Of the growth in Missouri insurance premiums from 2010 to 2014, cost shifting from the uninsured represents $434 of this growth. Amount of Premiums Due to Cost-Shift from the Uninsured (millions) When the full effects of Medicaid expansion are realized, the elimination of cost shifting means a family of four could expect to save $1,688 due to reduced premiums over the period , and an individual would save $610 over this time frame Projected Reduction in Total Private-Sector Premiums Figure 11: Projected Reduction in Total Private Sector Premiums Due to Cost Shifting from Medicaid Expansion, Across the period , privately insured individuals and families could potentially save nearly $1 billion due to reductions in premiums. $2,500 $2,000 $1,500 $1,000 $500 $0 $256 $138 $2, Before Medicaid Expansion After Medicaid Expansion $1,155 Summary: Medicaid expansion would be highly beneficial to the Missouri economy and its citizens. Page vii
8 INTRODUCTION The Department of Health Management and Informatics (HMI), School of Medicine, at the University of Missouri and Dobson DaVanzo & Associates, LLC, were commissioned by the Missouri Hospital Association (MHA) and the Missouri Foundation for Health (MFH) to determine the potential Medicaid enrollment, economic and tax impacts on Missouri, if the state participates in the Medicaid expansion created under the Patient Protection and Affordable Care Act, more commonly known just as the Affordable Care Act (ACA). Our goal was to examine baseline estimates of Missouri Medicaid enrollment and the Missouri economy in the absence of Medicaid expansion to determine how Missouri could look with Medicaid expansion. To accomplish this, a series of simulation models was developed. The first estimates are on the increased enrollment in and the direct federal and state expenditures on Medicaid due to the implementation of the expansion offered by ACA (the Hilltop Institute, 2012). Second, the simulation model then estimates the value-added economic and tax impacts on the state s economy, as well as impacts on private employer health insurance premiums, if the state participates in the Medicaid expansion. The economic and tax models are based on the IMPLAN (Impact Analysis for Planning) professional 3.0 model building software and data package (Minnesota IMPLAN Group, 2010 data). The economic model can be updated as new data become available or as changes are made in underlying assumptions. The multipliers employed in this study are those associated with households. The household multiplier involves the income and purchases of individuals, but does not include government entities, because any new capacity created by the government entities must ultimately be financed by output in the economy. The outcomes reported in this study reflect the value-added contributions to the state gross output. Value added reflects the difference between an industry s total output and the cost of its intermediate inputs. It equals gross output (sales or receipts and other operating income, plus inventory change) minus intermediate inputs (consumption of goods and services purchased from other industries or imported). Value added consists of compensation of employees, taxes on production and imports less subsidies, and gross operating surplus. Gross value added is the value of output less the value of intermediate consumption; it is a measure of the contribution to gross domestic product (GDP) made by an individual producer, industry or sector. The results of this study, therefore, are conservative and do not estimate the contribution to total expenditures on health care. While conservative, the model employed is consistent with economic theory. The value-added approach was selected to avoid the double-counting that occurs when total output is used. Value added does not include the value of intermediate products used in production while total output also counts the value of these intermediate products in its determination of contributions to the economy. Page 1
9 OVERVIEW OF MEDICAID EXPANSION OPTION The Patient Protection and Affordable Care Act was enacted in March A significant feature of the health care reform law is an expansion of Medicaid to cover a larger number of low-income individuals, beginning Jan. 1, Because each state administers its own Medicaid program in partnership with the federal government, Medicaid expansion will affect each state differently. Under Missouri s current Medicaid program, categories of covered groups are as follows. parents with incomes at or equal to 19% of the federal poverty level (FPL) pregnant women under 185% of the FPL disabled individuals under 85% of the FPL Missourians 65 and older up to 85% of the FPL blind individuals up to 85% of the FPL qualified Medicare beneficiaries up to 100% of the FPL children under age 19 under 300% of the FPL (Missouri Foundation for Health, 2011) The eligibility criteria for the various groups of individuals currently covered by Medicaid in Missouri are not dissimilar to those of most other states in the U.S. Presently, 18 states, including Missouri, cover pregnant women up to 185% of the FPL, and 15 states, including Missouri, and the District of Columbia (D.C.) cover children up to 300% of the FPL with only two states covering a higher income level above the FPL criteria. However, 42 states and Washington, D.C., have higher FPL criteria for the coverage of parents than Missouri (Kaiser Commission on Medicaid and Uninsured, 2012). Under the current Medicaid program, Missouri covers 39.9% of all children, and a remaining 4.4% of children are eligible but not enrolled (American Academy of Pediatrics, 2012). Under Medicaid expansion, coverage would expand to all non-medicare eligible individuals under age 65 whose incomes are up to 133% of the federal poverty level (FPL), effectively including incomes up to 138% of the FPL, because the regulations disregard 5% of incomes within the FPL. Modified adjusted gross income will be used to determine the eligibility of individuals under Medicaid expansion. With the expansion, newly eligible adults will receive a benefit package meeting federal requirements and benchmarks and have the same essential health benefits offered to individuals currently on Medicaid (Kaiser Commission on Medicaid and Uninsured, 2012). In Missouri, children will continue to be covered up to 300% of FPL under the current Medicaid program. The expanded coverage applies to uninsured adults, as long as they meet citizenship requirements, are not incarcerated, are not entitled to Medicare and were not eligible to participate in the current Medicaid program (Sommers & Epstein, 2010). The Medicaid expansion program is designed to cover only individuals who qualify under the new eligibility criteria; individuals currently eligible for Medicaid coverage but not enrolled are not eligible for coverage under the expansion program. These eligible but not enrolled individuals will remain eligible under the conditions of each state s current Medicaid program coverage. Consequently, in the following analysis, the focus is on the population ages whose income is at or below 138% of the FPL and who are currently not eligible for or enrolled in Medicaid coverage. Page 2
10 Medicaid Nationally and in Missouri Medicaid (Title XIX of the federal Social Security Act) plays a major role in the U.S. health care delivery system, currently accounting for about one-sixth of all health care spending. However, 66% of all Medicaid spending in Missouri is for the 28% of the population who are elderly and disabled enrollees. In addition, Medicaid, a jointly administered and funded state and federal health insurance program, represents the largest source of federal revenue for most states (through federal matching payments). Payments support the ability of states to finance health care coverage for their population. The MO HealthNet Division of the Missouri Department of Social Services (DSS) administers the Missouri Medicaid program and provides for payment of Medicaid covered services. The Family Support Division in DSS determines eligibility for individuals and families. In 2011, Missouri s Medicaid program covered about one out of every seven Missourians. Medicaid state expenditures account for about 28% of the total state budget, with more than 60% of the funding coming from the federal government (Missouri Foundation for Health, 2011). Originally, the ACA required all states to expand eligibility criteria in their Medicaid programs, warning that if states refused to participate, all federal dollars from their current Medicaid programs would be withheld. However, 26 states filed a joint lawsuit and two states (Missouri and Virginia) filed individual lawsuits against the federal government, claiming the ACA was unconstitutional (National Conference of State Legislatures, 2012). On June 28, 2012, the U.S. Supreme Court ruled that while the ACA was constitutional, the federal government could not withhold federal dollars from the Medicaid program if a state chose not to participate in the Medicaid expansion. Therefore, the decision is now up to the individual state as to whether and when it will opt in or opt out of participating in the expansion. Because the Medicaid expansion program is voluntary, states do not have a deadline for deciding whether to opt in to the expansion and will be allowed to opt out of the expansion at any time without penalty (Kaiser Health News, 2012). Funding under ACA Medicaid Expansion For states that choose to opt in to the Medicaid expansion, 100% of newly eligible enrollees health care costs will be covered by the federal government from 2014 to During this time, the states will not have to use their budgets to cover newly eligible enrollees. Beginning in 2017, the federal government will continue to pay for 95% of the new enrollees costs, with participating state governments having to cover the remaining 5%. The federal government will then continue to assume a progressively smaller portion of total costs each subsequent year, paying 94% in 2018, 93% in 2019 and 90% in For all subsequent years following 2020, the federal government will continue to pay 90% of new enrollees costs (Kaiser Family Foundation, 2010). Table 1 provides a summary of the federal government s share of the cost associated with the new enrollees. Table 1: Federal Government Payment for Newly Eligible Enrollees Year Federal Percent % % % % % % % Page 3

11 The ACA also authorizes states to create health insurance exchanges. While these exchanges also are a mechanism to offer affordable insurance, individuals expected to use the health insurance exchange are not included in our Medicaid expansion analysis, because they will mostly have income above the expansion program s criteria and will not be eligible to participate in the program. (See appendix for details on the ACA health insurance exchanges.) GEOGRAPHIC AREAS OF ANALYSIS In addition to a state-level analysis of Missouri, additional analyses were conducted for each of the state s 10 workforce investment areas (WIAs). Because the U.S. and state departments of labor aggregate employment numbers by WIA, it is helpful to look at economic and job growth in this way. WIAs were created under the Workforce Investment Act of 1998 and are designed to consolidate, coordinate and improve employment, training, literacy and vocational rehabilitation programs (P.L ). Missouri is divided into regional areas, each administered by a local board. The state board provides oversight for the local areas. Figure 1 provides a map indicating the location of the 10 WIAs in Missouri analyzed in this report. Page 4
12 ASSUMPTIONS IN MODEL In assessing the potential economic impact of Medicaid expansion on the state of Missouri, it was necessary to make certain assumptions during the development of the economic impact models. In future years, as decisions are solidified and data become more current and available, the economic impact models can be updated accordingly, potentially improving the accuracy of the projected impact. In performing the study, the 3.0 version of the IMPLAN model was used to generate the potential impact of Medicaid expansion on Medicaid enrollment, Medicaid expenditures, jobs created, labor income, taxes generated, and the impact it could have on private insurance premiums. IMPLAN 3.0 is an input-output model used to examine the impact of changes (expanding or contracting) that occur in an industry or economy. In performing the analysis, several important underlying assumptions were made. As decisions were made about the Missouri-specific data to include in the model, the approach was to select the most conservative set of options available to be included. As a result, the findings in this report should be viewed as representing a very conservative estimate of the potential impact of Medicaid expansion on Missouri. Our assumptions are predicated on Missouri deciding to participate in the Medicaid expansion program beginning in Our assumptions are as follows. 1. The first assumption involved deciding which populations were potential candidates for inclusion in the Medicaid expansion. From the total population, it was determined to exclude individuals over the age of 64, since the ACA excludes individuals covered under Medicare. Because the Medicaid expansion only covers individuals up to and including 138% of the FPL, individuals under the age of 19 also were excluded because Missouri covers this age cohort up to 300% of poverty. Therefore, the population included in the analysis only included individuals ages Population data were obtained from the Missouri Office of Administration, Bureau of Planning by age cohort and projections from 2010 to The next assumption involved reducing the total population ages to include only those who had income at or below 138% of the FPL. Information on the number of individuals by age cohort at or below 138% of the FPL in 2010 was obtained from the U.S. Census Bureau. The percent of the population at or below 138% of the FPL was assumed to remain constant during the period 2010 to This percent was then multiplied by the population ages in each year to determine its population at or below 138% of the FPL. 3. Individuals who have health insurance are excluded from the estimation of individuals eligible for coverage under the Medicaid expansion. The baseline percent of the uninsured population ages and at or below 138% of the FPL in 2010 are assumed to remain constant over the projected period. This rate of the uninsured in each county is used to estimate the future number of uninsured individuals who are ages and at or below 138% of the FPL by multiplying it by the projected total population ages and at or below 138% the FPL for the period spanning 2014 to The county data on the uninsured were obtained from the U.S. Census Bureau (2012). 4. We assume that there will be no crowd-out from private health insurance plans to Medicaid. According to the Kaiser Family Foundation (StateHealthFacts.org), approximately 23% of individuals in Missouri under age 65 and at or below 138% of the FPL have employer-based or individual private health insurance. And, while it is possible some of these individuals will switch to Medicaid once they become eligible, information needed to make a credible projection regarding the actual number switching insurance is not available, and so this factor was not incorporated into the calculations in this report. 5. It is assumed that the rate of unemployment by county in Missouri will parallel the rate of population growth; therefore, population growth will produce no net effect on the number of individuals unemployed. A study by Holahan & Garrett (2009) found a positive relationship between the number of uninsured and the Page 5
13 unemployment rate, and how this relationship can affect the number of Medicaid enrollees. However, the study did not investigate the impact of unemployment on the number of uninsured at the county level. Alternatively, a study that investigated the adjustment of unemployment at the county level found that the unemployment rates change slowly over time (Moomaw, 1995). 6. Once the number of newly eligible individuals was estimated, the percent of those eligible who would actually enroll in Medicaid was selected. Based on current Medicaid enrollment data for Missouri and information from the Congressional Budget Office, the Urban Institute and the Kaiser Family Foundation, a rate of 73% was selected. This rate also was held constant over time. Much of the pent-up demand for services that will be delivered to newly enrolled individuals when they receive a Medicaid card will occur during the initial three years of the Medicaid expansion, and the federal government will pay 100% of the costs. 7. In establishing the projected cost per new Medicaid recipient to be included in the model, 2011 monthly Medicaid data obtained from MO HealthNet on expenditures and enrollees per category of services were summed to obtain weighted annual estimates, and these annual costs were used. In deriving the expenditure data to include, the categories covering payment for nursing facilities and Part D premiums were excluded. Also excluded were the categories predominantly covering individuals 18 years of age and under (e.g., foster care, child welfare services, MAF children, HDN, etc.) because it was assumed these individual are not eligible for Medicaid expansion because they are currently eligible for coverage under Missouri Medicaid. The total expenditures associated with the selected categories were divided by the total number of enrollees in those categories to obtain an average cost per enrollee. 8. The administrative costs of the Medicaid program are assumed to be 5% of total Medicaid expenditures. This administrative cost assumption is based on current Medicaid administrative costs in the Missouri Medicaid fee-for-service program. 9. This 2011 cost period forms the basis for the cost but is adjusted for projected inflation for the period , based on the average rate of increase in Medicaid during the past five years; this rate is held constant over time. Several studies (Glied & Little, 2003; Gulley, Rasch, & Chan, 2011; Billings, Parikh, & Mijanovih, 2000) formed the foundation for the assumptions behind establishing the base rate for the newly enrolled population. INSURANCE COVERAGE UNDER MEDICAID EXPANSION An individual s access to health insurance has substantial implications for his or her health status. Individuals without health insurance consistently have a lower health status than those with insurance, typically due to a lack of utilization of preventive services and screenings. Additionally, reduced access to medical care for acute and chronic illness equates to overall poor health outcomes for the uninsured (Cover Missouri, 2011). As uninsured individuals have lower utilization of preventive services, they typically only receive care in urgent or emergent situations. This has negative direct and indirect impacts on health systems and society through the following: 1) increased costs to commercial insurance and public programs, such as Medicare and Medicaid; 2) misuse of emergency departments and averted resources for acute care of the uninsured; and 3) loss of work productivity when uninsured individuals experience health problems (Cover Missouri, 2011). Figure 2 provides information on the projected growth in the number of uninsured Missourians who are ages and at or below 138% of the FPL between 2014 and 2020 who would be eligible for coverage under the Medicaid expansion program. As indicated, the number of newly eligible individuals is projected to grow from 218,165 in 2014 to 220,932 in Changes in the population ages and at or below 138% of the FPL vary substantially among WIAs across the state. For example, the Ozark WIA s population in this cohort is projected to increase by 7% between 2014 and 2020, from 21,718 to 23,248. Alternatively, the South Central WIA s population in this cohort is projected to decrease by 2.2%, from 13,208 to 12,914 during this period of time. Table 3a in the appendix provides an overview of Page 6
14 the projected number of newly eligible individuals ages and at or below 138% of the FPL in the state of Missouri by WIA between 2014 and 2020 who would be eligible for coverage under the Medicaid expansion program. Number of Individuals 222, , , , , ,000 Figure 2: Newly Eligible Individuals Under Medicaid Expansion, , , , , , , , , MODEL INPUTS NEW MEDICAID ENROLLEES UNDER MEDICAID EXPANSION The first step in estimating the impact of the Medicaid expansion Figure 3: New Enrollees in Medicaid, on the state of Missouri is to estimate the number of new enrollees 161, , ,006 in Medicaid under the expanded 161, ,731 coverage. Not all individuals newly 160,456 eligible for enrollment will participate 160, ,181 in the Medicaid program, even 159, ,000 if they are eligible. The foundation for this estimate of new enrollees 159, ,260 is the model assumption that 73% of the number of newly Medicaid eligible individuals in the state will enroll under Medicaid expansion. This assumption is based 159, , ,000 on information provided by the Congressional Budget Office (2012) on Medicaid enrollment in the expansion program. As reflected in the data contained in Table 4a in the appendix, this assumption results in an estimated 159,260 new enrollees in the Medicaid program in 2014 and 161,281 in As the data indicate, the largest growth in new Medicaid enrollees is in the St. Louis WIA, reflecting the larger population base in that geographic area. Figure 3 shows the projected growth in Medicaid enrollees under the expansion program between 2014 and Number of Individuals Page 7
15 MODEL INPUTS FEDERAL MEDICAID EXPENDITURES DERIVED DEMAND DUE TO INCREASED MEDICAID ENROLLMENT The next step in estimating the impact on Missouri of participating in the Medicaid expansion program is to develop an estimate of the total amount of federal dollars that will flow into Missouri through the program. In deriving the estimated cost to the Medicaid program, it was assumed that the average annual cost per recipient would be based on the calculated rate of $6,556. This amount forms the foundation for a proxy for estimating direct Medicaid costs that will be reimbursed by the federal government under the program. This cost per recipient is increased by an expected growth rate based on historic Medicaid cost increases for the period 2014 to Table 5a in the appendix provides information on the direct Medicaid payments that Missouri is estimated to receive from the federal government through Missouri s participation in the Medicaid expansion. These federal data do not reflect the expected Medicaid expenditures by the state of Missouri beginning in Also included in appendix Table 5a is the estimated state s contributions to the costs of the Medicaid expansion. As the data indicate, federal contributions to Missouri s Medicaid expansion program will increase from $1.13 billion in 2014 to $1.19 billion in As a result, the total direct infusion of federal Medicaid dollars to the Medicaid expansion will be more than $8.2 billion during this seven-year period. During this period, the state s costs for the Medicaid expansion will increase from about $58 million in 2017 to more than $119 million in 2020, reflecting both increased enrollment and an increased share of total Medicaid expansion expenditures, as the federal government reduces its share from 100% in 2014 to 90% by Total state Medicaid expenditures over this period are expected to be almost $333 million. Total Medicaid expansion expenditures (federal and state) for the period are expected to be approximately $8.6 billion. Figure 4 illustrates the federal and state contributions to the Medicaid expansion between 2014 and 2020 based on the assumptions incorporated in the IMPLAN model employed. Millions $1,400 $1,200 $1,000 $800 $600 $400 $200 $0 Figure 4: Federal and State Contributions to Missouri Medicaid Expansion Program, $1,132 $0 $1,164 $0 $1,194 $0 $1,165 $58 $1,183 $71 $1,202 $84 $1, Federal State Figure 5: Federal and State Contributions to Medicaid Expansion Program for $332,855, % State $119 Federal Starting in 2017, the federal government will finance 95% of the expansion program, and Missouri will need to assume 5% of the costs of the expansion. In $8,235,061, % Page 8
16 2018, the federal government s share drops to 94%, and Missouri s share increases to 6%. In 2019, the relative shares are 93% federal and 7% Missouri. In 2020 and beyond, the federal share of the Medicaid expansion program is 90%, and Missouri s share is 10%. Figure 5 shows the relative overall contributions of Federal and state financing of the Medicaid expansion program over the period FINDINGS ECONOMIC ANALYSIS Overview of Topics The discussion of the projected federal and state expenditures for Medicaid expansion in the preceding section represents an estimate of the direct impact of the Medicaid expansion on the Missouri economy. As illustrated by Figure 6, the flow of an infusion of federal Medicaid dollars through a state impacts the flow of health services and suppliers of goods and services to the health sector and to the economy in general. That is, Medicaid not only impacts beneficiaries and providers participating in the program but also the larger state economy. As the federal government injects dollars into the state s economy through the Medicaid program, these dollars trickle down to other individuals and organizations within the state, multiplying the initial flow of dollars. To estimate the downstream impacts of the Medicaid expansion in Missouri, we used the IMPLAN 3.0 software package. This proprietary economic modeling tool tracks the interdependence among various producing and consuming sectors of an economy to estimate the economic contributions of an industry (or economic sector) to a defined region; in our analysis, we analyzed the state as a whole and then analyzed 10 defined WIAs in Missouri. A comparison of the new state economic output to direct inputs provides an index of how many times each direct dollar is re-spent in the economy of a geographical area or how each direct job supports additional jobs in the economy. Definitions of key IMPLAN components as applied to this study follow. Total value-added economic effects are the combined effect, or sum, of direct, indirect and induced effects.»» Direct effect is the initial change in revenue, earnings and employment (jobs) due to the Medicaid expansion in Missouri.»» Indirect effect is a change in inter-industry transactions, as supplying industries respond to the direct effects of the Medicaid expansion in Missouri.»» Induced effect is the change in downstream household spending caused by the direct and indirect effects on household income. Multipliers calculated by IMPLAN show the relationship between the value-added direct effect and the total economic effect. The value-added direct effect times the multiplier produces the total economic effect. Tax effects represent state and local, as well as federal, taxes on the total economic effect. As shown in Figure 6, health care providers are directly impacted by the Medicaid payments they receive from the state, using these payments to support jobs, generate income and purchase goods and services associated with the provision of care. There are downstream impacts from providing a new job in a community. Page 9
.")
17 Table 2 details the impact of the Medicaid expansion in It shows the scale of the health care sector of the economy in Missouri and how this Medicaid expansion will increase jobs, labor income and gross state product (GSP). Table 2: Medicaid Expansion in the Missouri Context, 2014 Employment (Jobs) Labor Income* Value Added* Missouri 3,510,755 $221,465 million $251,629 million Value Added to Health Expenditures 392,709 $20,094 million $22,047 million Direct Impact of Medicaid Expansion for ,920 $640 million $737 million Direct as a Percent of State GSP 0.42% 0.29% 0.29% Direct as a Percent of Value Added to Health Expenditures 3.80% 3.19% 3.34% Total Impact of Medicaid Expansion for ,008 $977 million $1,339 million Total as a Percent of State GSP 0.68% 0.44% 0.53% Total as a Percent of Value Added to Health Expenditures 6.11% 4.86% 6.07% Multiplier Note: *The figures are based on 2010 dollars. Page 10
18 Job Creation Results As indicated, the inflow of additional federal dollars into Missouri will directly result in jobs being created in the health care organizations providing services to the newly enrolled Medicaid population. In addition to the direct impact on these organizations, there also will be both an indirect effect and an induced impact on employment in Missouri. Although the direct employment impact focuses on the creation of jobs associated with the direct provision of health care services in these organizations, the indirect and induced effects will impact a wide range of other sectors in the economy, such as retail sales, real estate, wholesale trade, education, etc. Through Medicaid expansion, an estimated 24,008 jobs would be created in 2014, with 22,175 of them sustained through It is estimated that these new jobs would produce a labor income (employee compensation) impact of approximately $977 million in 2014 and continue to produce approximately $992 million in Table 3 provides information on the estimated impact of the Medicaid expansion on various industries within Missouri s economy in Table 3: Impact of Medicaid Expansion on Missouri by Type of Industry, 2014 Industry Impacted Employment Labor Income GSP (Value Added) Nursing and residential care facilities 5,094 $144,537,880 $166,277,160 Retail stores - health and personal care 3,208 $123,568,266 $163,878,656 Employment and payroll only (state & local government, noneducation) 2,929 $138,182,669 $155,700,286 Private hospitals 2,905 $180,355,977 $196,939,729 Home health care services 2,108 $78,817,797 $80,416,770 Food services and drinking places 807 $14,980,542 $23,067,040 Real estate establishments 741 $8,860,442 $65,079,793 Medical and diagnostic labs and outpatient 373 $21,638,653 $26,773,737 Employment services 381 $12,803,394 $13,795,433 Offices of physicians, dentists and other health practitioners 375 $32,395,607 $33,452,015 Nondepository credit intermediation and related activities 234 $13,641,945 $14,893,219 Wholesale trade businesses 242 $18,190,919 $32,377,920 Retail Stores - general merchandise 195 $5,424,392 $8,452,171 Services to buildings and dwellings 198 $5,027,541 $6,628,730 Retail stores - food and beverage 189 $5,264,025 $7,599,425 Subtotal 19,977 $803,690,049 $995,332,084 Other 4,031 $73,415,080 $343,651,941 Total 24,008 $977,105,129 $1,371,868,679 Figure 7 shows the expected number of total jobs to be created through the Medicaid expansion for Missouri during the period 2014 to Appendix Table 6a provides data on the estimated direct, indirect, induced and total numbers of jobs created with the Medicaid expansion program in each of the WIAs. As these data indicate, the number of direct jobs created accounts for approximately 66% of all jobs created but the percent varies by WIA, reflecting the relative amount of time resources will stay in an individual region. The numbers reflected in the period of are not additional jobs created but reflect the number of jobs initially created in 2014 that will be sustained during each of the subsequent years. Page 11
19 As these data indicate, Medicaid expansion in Missouri is projected Figure 7: Employment Generated by Year, to generate more than 24,008 26,000 24,008 additional jobs in the state initially, 24,000 23,002 22,813 22,636 22,465 and 22,175 of these jobs will be 22,318 22,175 sustained during the study timeframe. Of the 24,008 jobs created 20,000 22,000 in 2014, 5,318 will be generated in the St. Louis area (a number similar 18,000 to current employment at Saint 16,000 Louis University), and 4,236 will be 14,000 generated in the Kansas City area (a number similar to current employment at Ford Motor Co.). Although 12,000 10,000 the more rural areas of the state generate fewer jobs, the impact on the local economy and population will still be substantial. For example, it is estimated that the Medicaid expansion in Northeast WIA will generate an additional 860 jobs during 2014 while an additional 1,723 jobs will be generated in the Southeast WIA and 1,040 in the Northwest WIA. As Table 4 indicates, the generation of new jobs in the WIAs can have a substantial impact on the number of individuals unemployed in the areas. The total number of jobs created in the state is more than the employment of Missouri s 10 Fortune 500 companies in the state. Note that the total number of jobs created in the state does not equal the total number created in the individual WIAs due to the state multiplier smoothing the interactions among the WIAs. Table 9a in the appendix provides information on the impact of jobs created in terms of current major employers in each WIA. Number of Jobs Created Table 4: Impact of New Job Creation on Unemployment, 2014 WIA Number Unemployed 2011 Number of New Jobs Percent Reduction in Unemployed Northwest 7,278 1, % Northeast 8, % West Central 8,006 1, % Central 18,571 2, % Southwest 7,641 1, % Ozark 14,848 2, % South Central 6,937 1, % Southeast 11,159 1, % St. Louis 66,929 5, % Kansas City 37,109 4, % Missouri 186,982 24, % The Missouri total is not the sum of the individual WIAs; it is calculated independently from the individual WIAs and accounts for leakages that occur among the WIAs. Page 12
20 Table 6a in the appendix provides more detailed information regarding the impact on employment generated with the Medicaid expansion. This table provides yearby-year estimates of the impact on employment (initial and sustained jobs created) within each of the workforce investment areas of the state and for the state of Missouri. Labor Income in Millions $1,200 $1,000 $800 $600 $400 Figure 8: Labor Income by Medicaid Expansion, $977 Labor Income Results $200 As a result of the number of new $0 jobs created in Missouri, labor income (employee compensation) also will increase in the state. Figure 8 and Table 7a in the appendix provide information on the projected impact on labor income as a result of the Medicaid expansion program. As these data indicate, labor income in the state is projected to increase by almost $7 billion during the period 2014 to This income reflects the direct income received by individuals in organizations providing services to the Medicaid population, as well as the indirect and induced incomes generated throughout the economy. Appendix Table 7a provides detailed information regarding the impact on labor income for the state during this period of time. It provides year-by-year estimates of the impact on labor income within each of the WIAs of the state and for the state of Missouri. The table also provides information for each of the WIAs on the direct, indirect and induced labor income impacts annually. This table provides substantial insight into the impact that the Medicaid expansion program will have on various geographic areas of the state. $995 $1,011 $1,006 $983 $999 $993 Value Added to Gross State Product Value added reflects the difference between an industry s total output and the cost of its intermediate inputs. It equals gross output (sales or receipts and other operating income, plus inventory change) minus intermediate inputs (consumption of goods and services purchased from other industries that are imported). Value added consists of compensation of employees, taxes on production and imports less subsidies (formerly indirect business taxes and nontax payments), and gross operating surplus (formerly other value added ). Gross value added is the value of output less the value of intermediate consumption; it is a measure of the contribution to gross state product (GSP) made by an individual producer, industry or sector; gross value added is the source from which the primary incomes of the System of National Accounts (SNA) are generated and is the basis of GDP estimation. For example, a business will purchase raw or intermediate goods or services to use in its business, repackage or transform these goods or services into new products to sell to consumers or to other businesses. The difference between the cost of the intermediate goods and the final product is the amount by which the business has contributed (the value added) to production and therefore, to the economy. Table 5 provides summary information on the total value added to the Missouri economy with participation in Medicaid expansion between 2014 and As the data indicate, the total value added to the Missouri economy between 2014 and 2020 is estimated to be almost $9.6 billion. This includes the direct, indirect and induced impacts of participation in Medicaid expansion and results from the initial $8.6 billion federal and state contributions spent on Medicaid expansion. Page 13
21 Table 5: Total Value Added to GSP with Medicaid Expansion, (in millions) WIA Total Northwest $53.8 $54.5 $55.2 $53.0 $53.1 $53.8 $53.2 $376.7 Northeast $38.0 $40.5 $41.3 $40.0 $40.5 $41.2 $41.1 $282.6 West Central $67.1 $68.1 $68.9 $66.4 $66.6 $67.4 $66.7 $471.1 Central $130.6 $133.4 $135.8 $131.6 $132.7 $135.0 $134.4 $933.4 Southwest $90.5 $92.8 $94.9 $92.3 $93.5 $95.4 $95.2 $654.5 Ozark $113.3 $116.8 $120.0 $117.2 $119.3 $122.2 $122.5 $831.4 South Central $56.7 $57.5 $58.2 $55.9 $56.0 $56.6 $55.8 $396.7 Southeast $85.8 $87.0 $88.0 $84.6 $84.8 $85.7 $84.7 $600.7 St. Louis $333.0 $345.6 $334.7 $329.7 $330.8 $335.1 $331.9 $2,340.8 Kansas City $264.0 $269.1 $274.1 $265.5 $267.8 $272.7 $271.5 $1,884.8 Missouri $1,339.0 $1,364.2 $1,386.8 $1,380.3 $1,350.4 $1,371.9 $1,363.2 $9,555.8 The Missouri total is not the sum of the individual WIAs; it is calculated independently from the individual WIAs and accounts for leakages that occur among the WIAs. Table 8a in the appendix provides more detailed information on the total value added that is created by the Medicaid expansion program between 2014 and As these data indicate, the total value added to Missouri was almost $9.6 billion between 2014 and The data in Appendix Table 8a highlights the estimated direct, indirect and induced amounts of value added to Missouri s economy during this seven-year period. Tax Impact Figure 9 depicts the distribution of tax generated through Medicaid expansion during the period The pie chart in the middle shows the distribution of tax collected by state and local governments ($856 million) and the federal government ($1.4 billion). The federal tax represents about 62.4% of the total tax collected ($2.2 billion) during the Medicaid expansion period of The state and local governments account for the balance of the total taxes. The side graphs in Figure 9 provide additional information about the sources of the taxes that would be generated with the Medicaid expansion. As the graph indicates, there are five main sources of taxes: employee compensation, proprietor, indirect business, households and corporations. Comparing information in the two side graphs, the findings show that the indirect business tax contributes substantially (77.2%) to the state and local taxes generated, but employee compensation contributes the most to federal taxes generated (53.0%). Household tax is the second component that drives both federal (27.4%) and state and local taxes (19.4%) generated. Page 14

22 Figure 9: Tax Generated with Medicaid Expansion, Table 6 provides information about the total taxes generated for the first year of Medicaid expansion (2014), whether federal or state, and for the entire period 2014 to As the data indicate, an additional $2.3 billion will be generated in taxes from the Medicaid expansion, with 62.4% of it being federal taxes. Table 10a in the appendix provides details on the taxes generated in each of the WIAs by source of the taxes during the period Table 6: Total Tax Generated Federal State and Local Total One Year: 2014 $202,727,715 $119,247,565 $321,975, to 2020 $1,423,863,355 $855,653,365 $2,279,516,720 The estimates provided throughout this report reflect a base multiplier effect, estimating the impact of the direct, indirect and induced effects of activities within the state. However, because Medicaid expansion involves the infusion of federal dollars into the Medicaid program in the state, the application of a super multiplier for the impact would result in even larger effects. The super multiplier reflects the concept that for every Medicaid dollar spent in a state, it is matched at some level by the federal government (the Federal Medical Assistance Percentage) and, therefore, increases the amount of federal dollars circulating through businesses and households in the state. The super multiplier is calculated with the formula: Super Multiplier = Multiplier x 1/(1 FMAP). For example, Missouri s FMAP was 63.45% in 2012, meaning that for every dollar Missouri spent on its Medicaid program, the federal government reimbursed them $ The base value-added multiplier for Missouri is 1.81; consequently, this would result in a super multiplier of 4.95, which would create a $4.95 value added per dollar of Medicaid expansion in Missouri s economy. If the super multiplier had been applied instead of the base value-added multiplier, the total impact on Missouri would have been much larger approximately $47.5 billion instead of the $9.6 billion estimated as the value-added Page 15
23 output of Medicaid expansion. While the state s value-added multiplier was 1.81, the multipliers for the WIAs ranged from 1.43 to Table 11a in the appendix includes the basic multipliers for the WIAs and the state for As discussed throughout the report, the appendix contains more detailed information for each of the workforce investment areas of Missouri. Also included in the appendix are maps showing the locations of the WIAs and the impacts that the Medicaid expansion program will have on the various sectors. These maps include information on employment, labor income, value added, output, number of uninsured and number of insured. EFFECT OF MEDICAID EXPANSION ON PRIVATE SECTOR PREMIUMS Regardless of insurance status, nearly all individuals seek some type of health care service at some point in their lives. As mentioned previously, those individuals who are uninsured or underinsured often seek care through their local hospital emergency department. In addition, since 1986, federal law has required hospitals to provide care in the emergency department through the Emergency Medical Treatment and Active Labor Act. Although the hospitals often provide these services at a loss, many institutions and other health providers try to obtain payment for these services through alternative funding streams. The federal government and state and local governments have such programs as the Medicare and Medicaid disproportionate share hospital (DSH) payment to partially cover this cost. However, under the ACA, those payments will be reduced, and this reduction was intended to be offset by newly covered individuals. Some hospitals also receive donations from charitable foundations, private donors and other sources to partially offset their charity care. It is well understood that the remainder of the cost of care for the uninsured is shifted to other individuals with private insurance in the form of higher premiums, a phenomenon called cost shifting (Families USA, 2009; Dobson, DaVanzo, El-Gamil, Berger, 2009; Dobson, DaVanzo & Sen, 2006; Dowless, 2007; Frakt, 2011; Robinson, 2011). Cost shifting is the economic phenomenon of setting different prices for identical services based upon the payer. Uncompensated services provided to uninsured and underinsured individuals, combined with stringent public reimbursement policies, result in decreasing revenues for many hospitals (Dowless, 2007). As a result, hospitals may mark up the price of certain services that have the highest volume to their best private payer, or they may otherwise negotiate higher payment rates from private payers. Due to cost shifting, industry analysts note an inverse relationship between decreased public payer reimbursement and private payer payments. When reimbursement rates from Medicare and Medicaid decrease, payments from private payers increase (Dowless, 2007). Nationally, in 2010, the average total premium cost was $13,871 for family coverage. If increases in health insurance premiums continue to grow at the previous rate, it is estimated that the average premium for family coverage would rise to $23,793 by 2020, an increase of 72% from While Missouri has one of the lower health insurance premium costs in the U.S. with its average premium of $12,754 for family coverage in 2010, premiums are still a major expense for employers and individuals. Although Missouri is projected to remain below the national average in 2020, premiums are still estimated to increase to $21,877 by then, if increases continue at the historical rate of growth (Schoen, 2011). To estimate the potential impact of the Medicaid expansion in 2014 on private insurance premiums in Missouri, we adapted the research findings of prominent health economist Ken Thorpe at Emory University in Atlanta. In 2005, Thorpe estimated that cost shifting from the uninsured in Missouri added $110 to individual private premiums and $291 to private premiums for a family of four (approximately 3 percent of total premiums for each group) (Families Page 16
24 USA, 2005). We then projected these estimates forward from 2005 to the period consistent with the methodology employed by other organizations using these figures (Furnas & Harbage, 2009). Based on data collected through the Medical Expenditure Panel Survey (MEPS), an ongoing panel survey conducted by the Agency for Healthcare Research and Quality (AHRQ), we determined that in 2010, the average private insurance premium for an individual in Missouri was $4,603 and for a family was $12,754. (AHRQ, Table X.C 2010; AHRQ, Table X.D, 2010) Using projected inflation factors for private health insurance from the Office of the Actuary at the Centers for Medicare & Medicaid Services, we estimate that individual premiums will cost $5,411, and family premiums will cost $14,992 annually in Missouri in 2014 (CMS, 2011). At these premium levels, the amount represented by cost shifting from the uninsured to the insured would be approximately $157 for an individual and $434 for a family. Amount of Premiums Due to Cost Shift From the Uninsured Amount of Premiums Due to Cost Shift From the Uninsured (millions) $500 $450 $400 $350 $300 $250 $200 $150 $100 $50 Figure 10: Projected Reduction in Private Sector Premiums Due to Cost Shifting from Medicaid Expansion, 2014 $0 $157 $84 $434 $233 Individual Plan (Base Premium of $5,254) Family Plan (Base Premium of $14,558) Before Medicaid Expansion After Medicaid Expansion Figure 11: Projected Reduction in Total Private Sector Premiums Due to Cost Shifting from Medicaid Expansion, $2,500 $2,000 $1,500 $1,000 $500 $0 $256 $138 $2, Before Medicaid Expansion After Medicaid Expansion $1,155 Based on our assumptions of population growth, income distribution and the take-up rate of Medicaid in Missouri in 2014, we estimate that the number of individuals without insurance in Missouri will fall by 46.4% due to the expansion of the Medicaid program. If the cost shift to private insurance premiums from the previously uninsured falls by a proportionate amount, then individuals would pay $73 less and families would pay $201 less annually for the same level of coverage as the currently uninsured gain access to coverage through Medicaid (see Figure 10). Across the period , these savings could total $610 for an individual and $1,688 for a family. Across all private insurance premiums in Missouri, this reduction in the cost-shift to private insurers from the uninsured due to increased Medicaid enrollment could result in approximately $119 million in savings in 2014 to individuals and families as private insurance premiums fall. 1 Across the period , privately insured individuals and families could potentially save nearly $1 billion due to reductions in premiums (Figure 11). 1 Authors analysis. Total direct private health insurance premiums written for 2009 were inflated to 2014 using inflation factors from the Office of the Actuary, CMS, and the proportion of premiums due to cost shifting from the uninsured was calculated as an average between individual and family plans. Direct premiums written from: Department of Insurance, Financial Institutions & Professional Registration, State of Missouri (2012, April) Missouri life, accident and health supplemental report, statistics section. (Jefferson City, MO: DIFP). Page 17
25 CONCLUSIONS REGARDING KEY IMPACTS Missouri s decision to opt in or opt out of the ACA s opportunity for Medicaid expansion will have a significant impact on the state s economy and on the health insurance coverage and health status of its residents. If Missouri decides to participate in Medicaid expansion, more than 200,000 individuals will be newly eligible to participate in the program each year between 2014 and Of these individuals, it is estimated that approximately 160,000 will participate in Medicaid each year. Because the federal government will cover 100% of the costs of expansion for years , Missouri will experience no direct financial burden for the individuals participating during these years. Much of the pent-up demand for services that will be delivered when the patient receives a Medicaid card will be paid by the full federal funding in the first three years of implementation. For the period , during which time Missouri gradually contributes to the capped state-share of 10%, total state expenditures for Medicaid expansion would be approximately $333 million. During this seven-year period, there would be an infusion of approximately $8.2 billion federal dollars to support the Medicaid expansion, and Missouri s contribution combined with the federal contribution would total approximately $8.6 billion. The creation of approximately 22,000 sustainable new jobs in the economy over the period due to Medicaid expansion will significantly impact each WIA in the state in terms of ability to reduce unemployment. To put the number of statewide new jobs created into context, the number of new employees added to the economy would be similar to adding the total workforce of Missouri s 10 Fortune 500 companies in the state. In addition to the individuals provided with health insurance and the impact on their improved health status, the economic value-added output produced through direct, indirect and induced effects of the $8.6 billion Medicaid expansion infusion totals approximately $9.6 billion added to the gross state product. The Medicaid expansion will generate nearly $856 million in additional state and local taxes from 2014 to 2020 and more than $1.4 billion in federal taxes due to the increase in jobs and economic activities within the state. Page 18
26 REFERENCES Agency for Healthcare Research and Quality, Center for Financing, Access and Cost Trends (2010) Medical Expenditure Panel Survey-Insurance Component [Table X.C (2010) Premium distribution (in dollars) for private-sector employees enrolled in single coverage at the 10th, 25th, 50th (median), 75th and 90th percentiles, by State; United States, 2010]. (Rockville, MD: AHRQ). Agency for Healthcare Research and Quality, Center for Financing, Access and Cost Trends (2010) Medical Expenditure Panel Survey-Insurance Component [Table X.D (2010) Premium distribution (in dollars) for private-sector employees enrolled in family coverage at the 10th, 25th, 50th (median), 75th and 90th percentiles, by State; United States, 2010]. (Rockville, MD: AHRQ). American Academy of Pediatrics. (2012). Missouri Medicaid Facts. Retrieved October 3, advocacy-and-policy/federal-advocacy/access-tocare/medicaid%20fact%20sheets/missouri.pdf Billings, J., Parikh, N., & Mijanovich, T. (2000). Emergency Room Use: The New York Story. The Commonwealth Fund. Centers for Medicare & Medicaid Services. (2011). Medical Integrity Program Missouri Comprehensive Program Integrity Review: Final Report. Retrieved September 20, Prevention/FraudAbuseforProfs/Downloads/mocompfy07pireviewfinalreport.pdf Centers for Medicare & Medicaid Services, Office of the Actuary (2011). National Health Expenditure Accounts [Table 3: National Health Expenditures; Aggregate and Per Capita Amounts, Percent Distribution and Annual Percent Change by Source of Funds: Calendar Years ]. (Washington, DC: CMS). Congressional Budget Office. (2012). CBO Updated Estimates for the Insurance Coverage Provisions of the Affordable Care Act. Retrieved September 20, County Health Rankings. (2012). Morgan County Health Outcomes. Retrieved September 21, Cover Missouri (2011). The Significance of Missouri s Uninsured. Missouri Foundation for Health. Dobson A., DaVanzo J.E., El-Gamil AM, Berger G. (2009). How a new public plan could affect hospitals finances and private insurance premiums. Health Affairs 28(6): w1013-w1024. Dobson A., DaVanzo J. & Sen N. (2006). The cost-shift payment hydraulic : Foundation, history, and implications. Health Affairs 25(1): Dowless, Robert M. The Health Care Cost-Shifting Debate: Could Both Sides Be Right? The Journal of Health Care Finance. (2007). 34(1), Families USA (2005). Paying a premium: The added cost of care for the uninsured [Publication No ]. Submitted by Kenneth Thorpe, Emory University. (Washington, DC: Families USA). Families USA (2009). Hidden health tax: Americans paying a premium. Submitted by Milliman, Inc. (Washington, DC: Families USA). Federal Register (2012). Retrieved October 16, Frakt A.B. (2011). How much do hospitals cost shift? A review of the evidence. Milbank Quarterly, 89(1): Furnas B., Harbage P. (2009, March 24). The cost shift from the uninsured: American family health care premiums cost $1,100 more because our system doesn t provide continuous coverage for all. (Washington, DC: Center for American Progress Action Fund). Glied, S., & Little, S. E. (2003). The Uninsured And The Benefits Of Medical Progress. Health Affairs, 22(4), doi: /hlthaff Gulley, S. P., Rasch, E. K., & Chan, L. (2011). Ongoing coverage for ongoing care: access, utilization, and out-of-pocket spending among uninsured working-aged adults with chronic health care needs. American Journal of Public Health, 101(2), doi: /ajph Page 19
27 Health Policy and Research Solutions. (2012). County Projections of Newly Insured Missourians in Retrieved September 20, Holahan, J. & Garrett A.B. (2009). Rising Unemployment, Medicaid and the Uninsured. Kaiser Commission on Medicaid and the Uninsured. Retrieved September 21, zotero://attachment/1401/ Jobs Missouri. Missouri Workforce Investment Regions. Retrieved October 16, missouri-workforce-investment-regions Kaiser Commission on Medicaid and Uninsured. (2012). Key Facts. Retrieved October 6, upload/ pdf Kaiser Family Foundation (2012). Focus on Health Reform: Explaining Health Care Reform: Questions about Health Insurance Subsidies. Retrieved October 16, Kaiser Family Foundation. (2010). Report and Briefing on Medicaid Coverage and Spending in Health Reform: National and State-By-State Results for Low-Income Adults. Retrieved September 20, Kaiser Family Foundation (2011). StateHealthFacts.Org. Health Insurance Coverage of the Nonelderly (0-64) with Incomes up to 139% of the Federal Poverty Level (FPL), States ( ). Kaiser Health News. (2012). Medicaid Official Outlines State Flexibility in Health Law s Medicaid Expansion. Retrieved October 8, Mercer Government Human Services Consulting (2010). Managed Care Cost Avoidance Model. Minneapolis MN. MERIC (Missouri Economic Research and Information Center), Missouri Department of Economic Development. Retrieved October 14, 2012 from Minnesota IMPLAN Group, Inc Data. Missouri Foundation for Health. (2011). The Significance of Missouri s Uninsured. SignificanceMOUninsured2011.pdf Moomaw, R. L. (1995). Adjustment to Equilibrium Unemployment in Local Labor Markets. The Journal of Economics, 21(1), National Conference of State Legislatures. (2012). State Legislation and Actions Challenging Certain Health Reforms, Retrieved September 13, aspx Public Law (1998). Workforce Investment Act of Washington DC: Government Printing Office. Retrieved October 15, Robinson J. (2011). Hospitals respond to Medicare payment shortfalls by both shifting costs and cutting them, based on market concentration. Health Affairs 30(7): Schoen C., Fryer A.K., Collins S.R. & Radley D.C. (2011). State Trends in Premiums and Deductibles, : The Need for Action to Address Rising Costs. New York: The Commonwealth Fund. Sommers, B.D. & Epstein, A.M. (2010). Medicaid Expansion The Soft Underbelly of Health Care Reform. New England Journal of Medicine, 363, The Hilltop Institute. (2012). Maryland Health Care Reform Simulation Model: Detailed Analysis and Methodology. Retrieved August 19, Simulation%20Model%20final.pdf Page 20
28 APPENDIX Detailed Tables Table 1a: Total Population Ages in Missouri, WIA/Year % Change Northwest 169, , , , , , , % Northeast 184, , , , , , , % West Central 182, , , , , , , % Central 465, , , , , , , % Southwest 203, , , , , , , % Ozark 377, , , , , , , % South Central 130, , , , , , , % Southeast 238, , , , , , , % St. Louis 1,384,450 1,385,849 1,384,085 1,382,322 1,380,558 1,378,794 1,377, % Kansas City 773, , , , , , , % Missouri 4,109,492 4,126,148 4,133,243 4,140,339 4,147,434 4,154,530 4,161, % The Missouri total is not the sum of the individual WIAs; it is calculated independently from the individual WIAs and accounts for leakages that occur among the WIAs. Table 2a: Total Population Ages and 138% of the FPL in Missouri, WIA/Year % Change Northwest 33,288 33,289 33,290 33,291 33,292 33,293 33, % Northeast 27,226 27,454 27,682 27,909 28,137 28,365 28, % West Central 37,411 37,433 37,455 37,477 37,498 37,520 37, % Central 82,872 83,390 83,908 84,426 84,945 85,463 85, % Southwest 46,320 46,752 47,185 47,617 48,049 48,482 48, % Ozark 66,504 67,538 68,572 69,606 70,640 71,674 72, % South Central 40,039 40,011 39,982 39,954 39,926 39,897 39, % Southeast 51,436 51,383 51,329 51,276 51,223 51,169 50, % St. Louis 171, , , , , , , % Kansas City 107, , , , , , , % Missouri 663, , , , , , , % The Missouri total is not the sum of the individual WIAs; it is calculated independently from the individual WIAs and accounts for leakages that occur among the WIAs. Page 21
29 Table 3a: Eligible Individuals, Age % of the FPL, WIA/Year % Change Northwest 10,413 10,414 10,390 10,366 10,342 10,319 10, % Northeast 7,422 7,482 7,520 7,558 7,595 7,633 7, % West Central 12,446 12,453 12,430 12,407 12,384 12,361 12, % Central 24,287 24,435 24,511 24,587 24,663 24,740 24, % Southwest 20,862 21,050 21,189 21,328 21,467 21,606 21, % Ozark 21,718 22,035 22,278 22,520 22,763 23,005 23, % South Central 13,208 13,198 13,141 13,085 13,028 12,971 12, % Southeast 16,163 16,146 16,088 16,031 15,973 15,916 15, % St. Louis 51,392 51,444 51,378 51,313 51,247 51,182 51, % Kansas City 40,503 40,702 40,860 41,019 41,178 41,336 41, % Missouri 218, , , , , , , % The Missouri total is not the sum of the individual WIAs; it is calculated independently from the individual WIAs and accounts for leakages that occur among the WIAs. Table 4a: New Medicaid Enrollees under Medicaid Expansion Program, WIA/Year % Change Northwest 7,602 7,602 7,585 7,567 7,550 7,533 7, % Northeast 5,418 5,462 5,490 5,517 5,544 5,572 5, % West Central 9,086 9,091 9,074 9,057 9,041 9,024 9, % Central 17,729 17,837 17,893 17,949 18,004 18,060 18, % Southwest 15,229 15,366 15,468 15,569 15,671 15,772 15, % Ozark 15,854 16,086 16,263 16,440 16,617 16,794 16, % South Central 9,642 9,635 9,593 9,552 9,510 9,469 9, % Southeast 11,799 11,786 11,745 11,703 11,661 11,619 11, % St. Louis 37,516 37,554 37,506 37,458 37,411 37,363 37, % Kansas City 29,567 29,712 29,828 29,944 30,060 30,176 30, % Missouri 159, , , , , , , % The Missouri total is not the sum of the individual WIAs; it is calculated independently from the individual WIAs and accounts for leakages that occur among the WIAs. Page 22
30 Table 5a: Comparison of Federal and State Contributions to Missouri Medicaid Expansion Program, WIA/ Year Source Northwest Northeast West Central Central Southwest Ozark South Central Southeast St. Louis Kansas City Missouri Federal $58,015,242 $59,409,461 $60,696,718 $58,968,498 $59,669,622 $60,371,931 $59,747,402 $416,878,873 State $0 $0 $0 $2,948,425 $3,580,177 $4,226,035 $5,974,740 $16,729,378 Federal $43,588,023 $44,995,445 $46,306,561 $45,316,170 $46,188,492 $47,071,128 $46,921,229 $320,387,047 State $0 $0 $0 $2,265,808 $2,771,310 $3,294,979 $4,692,123 $13,024,220 Federal $74,794,821 $76,634,525 $78,328,951 $76,131,814 $77,070,682 $78,012,030 $77,239,050 $538,211,873 State $0 $0 $0 $3,806,591 $4,624,241 $5,460,842 $7,723,905 $21,615,579 Federal $126,009,329 $129,820,620 $133,350,931 $130,254,202 $132,514,653 $134,797,787 $134,122,601 $920,870,123 State $0 $0 $0 $6,512,710 $7,950,879 $9,435,845 $13,412,260 $37,311,694 Federal $94,234,478 $97,364,401 $100,359,405 $98,365,950 $100,413,870 $102,488,530 $102,315,945 $695,542,580 State $0 $0 $0 $4,918,298 $6,024,832 $7,174,197 $10,231,595 $28,348,921 Federal $100,429,002 $104,344,629 $108,024,353 $106,333,311 $109,005,226 $111,718,962 $111,985,734 $751,841,217 State $0 $0 $0 $5,316,666 $6,540,314 $7,820,327 $11,198,573 $30,875,880 Federal $64,704,884 $66,210,821 $67,507,979 $65,451,657 $66,093,481 $66,732,777 $65,904,626 $462,606,226 State $0 $0 $0 $3,272,583 $3,965,609 $4,671,294 $6,590,463 $18,499,949 Federal $89,047,646 $91,089,868 $92,943,881 $90,180,678 $91,134,172 $92,086,131 $91,013,538 $637,495,913 State $0 $0 $0 $4,509,034 $5,468,050 $6,446,029 $9,101,354 $25,524,467 Federal $264,105,344 $270,717,284 $276,861,674 $269,250,491 $272,728,237 $276,219,188 $273,641,106 $1,903,523,324 State $0 $0 $0 $13,462,525 $16,363,694 $19,335,343 $27,364,111 $76,525,673 Federal $217,115,002 $223,417,718 $229,671,734 $224,511,426 $228,582,771 $232,698,151 $231,707,685 $1,587,704,486 State $0 $0 $0 $11,225,571 $13,714,966 $16,288,871 $23,170,768 $64,400,177 Federal $1,132,043,771 $1,164,004,770 $1,194,052,187 $1,164,764,198 $1,183,401,207 $1,202,196,615 $1,194,598,916 $8,235,061,664 State $0 $0 $0 $58,238,210 $71,004,072 $84,153,763 $119,459,892 $332,855,937 The Missouri total is not the sum of the individual WIAs; it is calculated independently from the individual WIAs and accounts for leakages that occur among the WIAs. Page 23
31 Table 6a: Employment Generated by Type of Effect by WIA, WIA/Year Type of Effect Northwest Northeast West Central Central Southwest Ozark South Central Southeast St. Louis Kansas City Missouri Direct Indirect Induced Total 1,040 1,032 1, Direct Indirect Induced Total Direct 1,136 1,128 1,118 1,054 1,035 1, Indirect Induced Total 1,457 1,448 1,435 1,353 1,328 1,318 1,279 Direct 1,729 1,729 1,723 1,634 1,614 1,609 1,569 Indirect Induced Total 2,422 2,422 2,415 2,291 2,263 2,257 2,201 Direct 1,249 1,254 1,255 1,195 1,186 1,186 1,160 Indirect Induced Total 1,769 1,776 1,778 1,693 1,680 1,681 1,644 Direct 1,309 1,320 1,328 1,270 1,264 1,270 1,248 Indirect Induced Total 2,043 2,062 2,074 1,984 1,976 1,985 1,950 Direct Indirect Induced Total 1,234 1,225 1,212 1,141 1,118 1,106 1,071 Direct 1,256 1,246 1,233 1,160 1,137 1,126 1,091 Indirect Induced Total 1,723 1,710 1,692 1,593 1,562 1,547 1,498 Direct 3,363 3,418 3,240 3,125 3,070 3,048 2,959 Indirect Induced 1,417 1,440 1,366 1,319 1,296 1,287 1,249 Total 5,318 5,407 5,128 4,948 4,863 4,827 4,686 Direct 2,715 2,710 2,702 2,563 2,532 2,527 2,466 Indirect Induced 1,078 1,076 1,074 1,019 1,007 1, Total 4,236 4,230 4,219 4,003 3,956 3,947 3,852 Direct 15,868 15,118 15,112 15,112 15,112 15,112 15,112 Indirect 2,285 2,220 2,158 2,098 2,039 1,999 1,959 Induced 5,856 5,663 5,543 5,427 5,313 5,208 5,104 Total 24,008 23,002 22,813 22,636 22,465 22,318 22,175 The Missouri total is not the sum of the individual WIAs; it is calculated independently from the individual WIAs and accounts for leakages that occur among the WIAs. Page 24
32 Table 7a: Labor Income Generated by Type of Effect by WIA, WIA/Year Northwest Northeast West Central Central Southwest Ozark South Central Southeast St. Louis Kansas City Missouri Type of Effect Total Direct $31,615,157 $32,023,195 $32,364,888 $31,108,091 $31,145,568 $31,512,151 $31,186,165 $220,955,215 Indirect $2,538,668 $2,575,903 $2,607,987 $2,511,212 $2,518,819 $2,548,466 $2,522,103 $17,823,158 Induced $5,962,102 $6,039,854 $6,105,125 $5,868,857 $5,876,749 $5,945,919 $5,884,410 $41,683,016 Total $40,115,927 $40,638,952 $41,078,000 $39,488,159 $39,541,137 $40,006,536 $39,592,677 $280,461,388 Direct $22,832,562 $24,295,585 $24,759,226 $23,996,252 $24,225,933 $24,688,878 $24,610,254 $169,408,690 Indirect $1,574,307 $1,679,999 $1,717,054 $1,669,065 $1,690,094 $1,722,391 $1,716,906 $11,769,816 Induced $3,512,551 $3,738,339 $3,810,423 $3,693,736 $3,729,845 $3,801,120 $3,789,015 $26,075,029 Total $27,919,419 $29,713,923 $30,286,703 $29,359,054 $29,645,871 $30,212,389 $30,116,175 $207,253,534 Direct $38,747,770 $39,262,428 $39,691,608 $38,160,412 $38,216,787 $38,683,571 $38,300,273 $271,062,849 Indirect $3,008,796 $3,056,856 $3,098,614 $2,987,251 $3,000,002 $3,036,644 $3,006,555 $21,194,718 Induced $5,839,421 $5,918,139 $5,984,023 $5,754,344 $5,764,037 $5,834,440 $5,776,629 $40,871,033 Total $47,595,986 $48,237,424 $48,774,245 $46,902,007 $46,980,827 $47,554,655 $47,083,458 $333,128,602 Direct $73,017,933 $74,515,429 $75,828,083 $73,386,083 $73,982,852 $75,257,525 $74,880,565 $520,868,470 Indirect $6,209,112 $6,356,450 $6,489,102 $6,300,453 $6,372,501 $6,482,294 $6,449,825 $44,659,737 Induced $16,312,373 $16,651,040 $16,948,625 $16,406,996 $16,544,707 $16,829,760 $16,745,461 $116,438,962 Total $95,539,418 $97,522,918 $99,265,810 $96,093,532 $96,900,060 $98,569,580 $98,075,851 $681,967,169 Direct $49,812,586 $51,008,181 $52,115,121 $50,637,554 $51,250,823 $52,309,722 $52,221,632 $359,355,619 Indirect $5,314,559 $5,454,076 $5,584,783 $5,438,566 $5,516,829 $5,630,812 $5,621,330 $38,560,955 Induced $10,984,771 $11,250,777 $11,497,361 $11,173,771 $11,311,534 $11,545,243 $11,525,800 $79,289,257 Total $66,111,916 $67,713,034 $69,197,265 $67,249,892 $68,079,185 $69,485,777 $69,368,762 $477,205,831 Direct $52,953,942 $54,546,062 $55,992,562 $54,658,181 $55,574,156 $56,957,701 $57,093,707 $387,776,311 Indirect $8,844,700 $9,124,227 $9,380,207 $9,170,395 $9,338,083 $9,570,560 $9,593,412 $65,021,584 Induced $18,167,306 $18,717,325 $19,217,600 $18,763,449 $19,081,799 $19,556,850 $19,603,548 $133,107,877 Total $79,965,947 $82,387,613 $84,590,368 $82,592,025 $83,994,038 $86,085,110 $86,290,667 $585,905,768 Direct $33,583,738 $34,048,798 $34,400,844 $33,054,974 $33,085,584 $33,405,608 $32,991,044 $234,570,590 Indirect $2,868,406 $2,910,379 $2,942,761 $2,829,846 $2,834,696 $2,862,115 $2,826,597 $20,074,800 Induced $5,640,288 $5,718,747 $5,778,236 $5,552,521 $5,558,013 $5,611,773 $5,542,131 $39,401,709 Total $42,092,432 $42,677,924 $43,121,842 $41,437,341 $41,478,293 $41,879,496 $41,359,772 $294,047,100 Direct $49,222,160 $49,874,008 $50,413,738 $48,464,542 $48,532,626 $49,039,582 $48,468,382 $344,015,038 Indirect $4,831,668 $4,900,331 $4,958,160 $4,771,138 $4,782,593 $4,832,550 $4,776,262 $33,852,702 Induced $10,712,188 $10,854,975 $10,973,395 $10,550,046 $10,565,806 $10,676,174 $10,551,820 $74,884,404 Total $64,766,016 $65,629,314 $66,345,294 $63,785,725 $63,881,025 $64,548,306 $63,796,464 $452,752,144 Direct $153,802,789 $159,533,370 $154,368,625 $151,952,293 $152,350,094 $154,300,196 $152,860,033 $1,079,167,400 Indirect $27,185,047 $28,250,933 $27,388,429 $27,011,802 $27,135,545 $27,482,884 $27,226,371 $191,681,011 Induced $65,339,485 $67,793,133 $65,617,214 $64,608,923 $64,797,220 $65,626,633 $65,014,106 $458,796,714 Total $246,327,322 $255,577,436 $247,374,267 $243,573,018 $244,282,859 $247,409,713 $245,100,510 $1,729,645,125 Direct $125,826,173 $128,143,310 $130,387,856 $126,175,220 $127,186,410 $129,476,264 $128,925,149 $896,120,382 Indirect $20,676,914 $21,106,034 $21,525,724 $20,879,424 $21,097,098 $21,476,929 $21,385,512 $148,147,635 Induced $48,246,798 $49,151,941 $50,030,111 $48,430,654 $48,836,134 $49,715,376 $49,503,762 $343,914,776 Total $194,749,885 $198,401,284 $201,943,691 $195,485,298 $197,119,642 $200,668,568 $199,814,423 $1,388,182,791 Direct $640,236,318 $651,789,326 $662,075,716 $658,946,957 $643,654,406 $653,867,340 $649,725,119 $4,560,295,182 Indirect $101,390,218 $103,414,748 $105,247,398 $104,755,120 $102,717,581 $104,352,498 $103,696,464 $725,574,027 Induced $235,478,593 $239,790,309 $243,638,954 $242,489,153 $236,987,875 $240,749,747 $239,226,152 $1,678,360,783 Total $977,105,129 $994,994,383 $1,010,962,068 $1,006,191,230 $983,359,862 $998,969,585 $992,647,735 $6,964,229,992 The Missouri total is not the sum of the individual WIAs; it is calculated independently from the individual WIAs and accounts for leakages that occur among the WIAs. Page 25
33 Table 8a: Value Added Generated by Type of Effect by WIA, WIA/Year Northwest Northeast West Central Central Southwest Ozark South Central Southeast St. Louis Kansas City Missouri Type of Effect Total Direct $36,505,371 $36,998,342 $37,415,632 $35,984,787 $36,050,698 $36,475,015 $36,097,690 $255,527,535 Indirect $5,242,886 $5,317,958 $5,382,325 $5,180,778 $5,194,622 $5,255,763 $5,201,393 $36,775,725 Induced $12,071,277 $12,228,764 $12,360,985 $11,882,681 $11,898,728 $12,038,776 $11,914,238 $84,395,449 Total $53,819,534 $54,545,065 $55,158,941 $53,048,246 $53,144,049 $53,769,554 $53,213,321 $376,698,710 Direct $27,021,730 $28,772,455 $29,341,504 $28,457,005 $28,749,572 $29,298,962 $29,205,657 $200,846,885 Indirect $3,401,083 $3,627,381 $3,705,288 $3,599,675 $3,642,931 $3,712,546 $3,700,723 $25,389,627 Induced $7,590,151 $8,078,071 $8,233,859 $7,981,736 $8,059,786 $8,213,804 $8,187,647 $56,345,054 Total $38,012,964 $40,477,907 $41,280,652 $40,038,416 $40,452,290 $41,225,312 $41,094,027 $282,581,568 Direct $47,767,529 $48,486,162 $49,102,867 $47,293,527 $47,450,008 $48,029,567 $47,553,664 $335,683,324 Indirect $6,529,419 $6,632,121 $6,721,069 $6,477,897 $6,503,893 $6,583,332 $6,518,101 $45,965,832 Induced $12,773,474 $12,945,855 $13,090,170 $12,587,933 $12,609,331 $12,763,343 $12,636,876 $89,406,982 Total $67,070,422 $68,064,138 $68,914,107 $66,359,357 $66,563,232 $67,376,242 $66,708,641 $471,056,139 Direct $84,589,108 $86,391,123 $87,982,485 $85,217,403 $85,980,366 $87,461,747 $87,023,657 $604,645,889 Indirect $13,439,008 $13,752,161 $14,033,234 $13,619,464 $13,769,287 $14,006,523 $13,936,365 $96,556,042 Induced $32,533,494 $33,208,951 $33,802,477 $32,722,265 $32,996,937 $33,565,451 $33,397,324 $232,226,899 Total $130,561,610 $133,352,236 $135,818,196 $131,559,133 $132,746,590 $135,033,721 $134,357,346 $933,428,832 Direct $58,527,725 $59,987,771 $61,346,902 $59,664,122 $60,444,755 $61,693,611 $61,589,718 $423,254,604 Indirect $10,464,122 $10,735,773 $10,989,907 $10,699,085 $10,849,884 $11,074,055 $11,055,406 $75,868,232 Induced $21,524,918 $22,046,266 $22,529,561 $21,895,579 $22,165,639 $22,623,606 $22,585,507 $155,371,076 Total $90,516,765 $92,769,810 $94,866,371 $92,258,786 $93,460,278 $95,391,272 $95,230,631 $654,493,913 Direct $62,181,845 $64,105,004 $65,860,768 $64,346,389 $65,481,560 $67,111,756 $67,272,007 $456,359,329 Indirect $17,307,260 $17,852,591 $18,351,728 $17,939,544 $18,265,829 $18,720,566 $18,765,267 $127,202,785 Induced $33,820,895 $34,844,954 $35,776,415 $34,931,073 $35,523,861 $36,408,245 $36,495,182 $247,800,625 Total $113,310,000 $116,802,549 $119,988,911 $117,217,006 $119,271,250 $122,240,566 $122,532,457 $831,362,739 Direct $39,256,212 $39,834,861 $40,282,699 $38,741,815 $38,813,366 $39,188,792 $38,702,459 $274,820,204 Indirect $5,789,527 $5,875,070 $5,941,293 $5,714,162 $5,724,816 $5,780,190 $5,708,458 $40,533,516 Induced $11,641,495 $11,803,448 $11,926,247 $11,460,386 $11,471,736 $11,582,697 $11,438,956 $81,324,965 Total $56,687,233 $57,513,379 $58,150,239 $55,916,363 $56,009,917 $56,551,679 $55,849,873 $396,678,683 Direct $56,321,099 $57,111,417 $57,775,171 $55,586,017 $55,709,562 $56,291,486 $55,635,818 $394,430,570 Indirect $8,844,407 $8,970,739 $9,077,270 $8,735,529 $8,757,174 $8,848,649 $8,745,582 $61,979,350 Induced $20,634,855 $20,909,802 $21,137,809 $20,322,217 $20,352,473 $20,565,069 $20,325,532 $144,247,757 Total $85,800,361 $86,991,959 $87,990,250 $84,643,764 $84,819,209 $85,705,204 $84,706,932 $600,657,679 Direct $174,776,798 $181,425,659 $175,686,993 $173,072,092 $173,663,094 $175,886,005 $174,244,370 $1,228,755,011 Indirect $46,160,374 $47,973,131 $46,511,286 $45,874,427 $46,087,315 $46,677,239 $46,241,576 $325,525,348 Induced $112,013,025 $116,219,375 $112,489,147 $110,760,613 $111,083,417 $112,505,300 $111,455,230 $786,526,107 Total $332,950,197 $345,618,165 $334,687,426 $329,707,131 $330,833,826 $335,068,544 $331,941,175 $2,340,806,464 Direct $143,671,606 $146,435,484 $149,122,792 $144,425,379 $145,706,450 $148,329,737 $147,698,372 $1,025,389,820 Indirect $36,364,918 $37,120,302 $37,859,097 $36,723,005 $37,106,437 $37,774,499 $37,613,711 $260,561,969 Induced $84,009,254 $85,585,586 $87,114,967 $84,330,179 $85,036,496 $86,567,486 $86,199,012 $598,842,980 Total $264,045,778 $269,141,372 $274,096,856 $265,478,562 $267,849,383 $272,671,722 $271,511,095 $1,884,794,768 Direct $736,724,580 $750,617,005 $763,080,560 $759,490,819 $743,079,573 $754,886,308 $750,120,188 $5,257,999,033 Indirect $180,884,833 $184,497,314 $187,767,689 $186,890,492 $183,255,700 $186,173,524 $185,004,106 $1,294,473,658 Induced $421,374,612 $429,090,621 $435,978,009 $433,920,465 $424,077,216 $430,808,847 $428,082,415 $3,003,332,185 Total $1,338,984,025 $1,364,204,940 $1,386,826,258 $1,380,301,776 $1,350,412,489 $1,371,868,679 $1,363,206,709 $9,555,804,876 The Missouri total is not the sum of the individual WIAs; it is calculated independently from the individual WIAs and accounts for leakages that occur among the WIAs. Page 26
34 Table 9a: Impact of Job Creation, in Terms of Current Major Employer, per WIA, 2014 WIA Major Employer, 2012 # Employees New Job Creation Impact Northwest Missouri Western State University 535 1, x Northeast A.T. Still University x West Central University of Central Missouri 1,394 1, x Central Columbia MO Public Schools 2,413 2, x Southwest Mercy Hospital, Joplin 1,671 1, x Ozark Bass Pro Shops 2,363 2, x South Central Ozarks Medical Center 1,200 1, x Southeast Proctor and Gamble Co. 1,737 1, x St. Louis Saint Louis University 5,946 5, x Kansas City Ford Motor Co. 3,800 4, x Missouri BJC Health System 24,815 24, x *Source: Department of Economic Development, Missouri Economic Research Information Center, Missouri Division of Business & Community Services; organizational websites. Table 10a: Taxes Generated from Medicaid Expansion by WIA, WIA Northwest Northeast West Central Central Southwest Ozark South Central Southeast St. Louis Kansas City Missouri Tax Type Employee Compensation Proprietor Income Indirect Business Tax Households Corporations Total State/Local $1,179,846 $0 $25,601,251 $6,393,460 $354,706 $33,529,263 Federal $23,120,263 $477,642 $10,665,129 $12,696,179 $3,419,340 $50,378,553 State/Local $1,027,447 $0 $22,103,188 $4,826,466 $265,581 $28,222,682 Federal $24,218,376 $542,730 $3,909,834 $11,450,182 $3,468,299 $43,589,421 State/Local $1,612,616 $0 $37,442,419 $8,098,437 $509,704 $47,663,176 Federal $35,124,381 $1,774,180 $5,837,566 $19,282,236 $6,656,337 $68,674,700 State/Local $4,002,052 $0 $68,926,531 $16,377,178 $921,284 $90,227,045 Federal $68,343,290 $2,555,372 $12,038,154 $38,732,938 $12,031,281 $133,701,035 State/Local $1,369,933 $0 $51,938,012 $10,852,775 $619,374 $64,780,094 Federal $52,747,587 $1,459,565 $9,906,529 $25,876,115 $8,088,570 $98,078,366 State/Local $1,650,780 $0 $62,259,998 $13,579,460 $914,747 $78,404,985 Federal $68,180,535 $1,955,050 $13,541,591 $32,213,022 $11,945,908 $127,836,106 State/Local $1,259,254 $0 $32,810,358 $6,312,638 $344,121 $40,726,371 Federal $37,128,423 $1,423,226 $5,721,848 $15,337,951 $4,493,957 $64,105,405 State/Local $1,663,528 $0 $43,898,818 $9,793,328 $515,011 $55,870,685 Federal $50,051,117 $2,057,033 $8,468,734 $23,385,801 $6,725,667 $90,688,352 State/Local $3,148,640 $0 $148,795,695 $40,796,636 $2,321,799 $195,062,770 Federal $186,213,340 $5,053,710 $30,941,109 $95,003,608 $30,320,957 $347,532,724 State/Local $3,464,345 $0 $126,042,986 $32,818,118 $1,864,902 $164,190,351 Federal $128,971,242 $3,778,054 $38,960,306 $70,512,808 $21,139,446 $263,361,856 State/Local $19,637,029 $0 $660,415,812 $165,897,606 $9,702,918 $855,653,365 Federal $754,733,151 $22,792,548 $129,665,253 $389,959,539 $126,712,864 $1,423,863,355 The Missouri total is not the sum of the individual WIAs; it is calculated independently from the individual WIAs and accounts for leakages that occur among the WIAs. Page 27
35 Table 11a: Basic Multipliers by WIA, WIA/Year Total Northwest Northeast West Central Central Southwest Ozark South Central Southeast St. Louis Kansas City Missouri The Missouri total is not the sum of the individual WIAs; it is calculated independently from the individual WIAs and accounts for leakages that occur among the WIAs. Health Insurance Exchanges Beginning in 2014, individuals earning between 139% and 400% of the FPL will be eligible for tax credits and subsidies toward the purchase of private insurance in state-based health insurance exchanges to make obtaining health insurance more financially feasible. Also, individuals with incomes at or below 250% of the FPL also are eligible for reduced cost sharing (deductibles and co-payments) to be paid for by the federal government. Citizens and legal residents in families between 100% and 400% of the FPL who purchase insurance coverage through a state health insurance exchange are eligible for a tax credit, reducing the Table 12a: Applicable Percentage Table for Health Insurance Exchanges Household income percentage of Federal poverty line Percentage of income Less than 133% 2.00 At least 133% but less than 150% 4.00 At least 150% but less than 200% 6.30 At least 200% but less than 250% 8.05 At least 250% but less than 300% 9.50 At least 300% but less than 400% 9.50 cost of the premium (Sommers & Epstein, 2010; Kaiser Family Foundation, 2012). However, individuals eligible for public coverage are not eligible for assistance with premiums in the exchange. If a state does not participate in the Medicaid expansion program, then individuals with incomes below 100% of the FPL will not be eligible for exchange subsidies, although those above 100% of the FPL will be eligible to participate in the exchange (Kaiser Family Foundation, 2012). Individuals who are offered coverage through an employer are not eligible for a tax credit toward their premiums unless the plan offered by the employer does not have an actuarial value of at least 60% or if the employees premium exceeds 9.5% of their income. If these thresholds are met, then the employer-sponsored insurance is considered unaffordable, and the individuals are eligible to enroll in a health insurance exchange and may be eligible to receive tax credits to assist with the cost of coverage purchased through the exchange (Kaiser Family Foundation, 2012). The amount of the tax credit an individual can receive is based on the premium for the second-lowest-cost silver plan (one that provides essential benefits and has an actuarial value of 70%) in the exchange and the area and varies with income. The premium that an individual would be required to pay would not exceed a specified percentage of their income (adjusted for family size). If the individual purchases a plan that is more expensive than the secondlowest-cost silver plan, then the individual would be required to pay the full difference between the cost of the second-lowest-cost silver plan and the plan they purchase. The following table provides details on the premium amounts (Federal Register, 2012, p ). Premium tax credits are refundable and available, even if the individual has no tax liability. The tax credits also are available to the individual at the time the individual purchases insurance, rather than paying for the premium out of pocket and then waiting to receive reimbursement for the premium when filing an annual income tax return. Page 28
36 Maps Page 29
37 Page 30
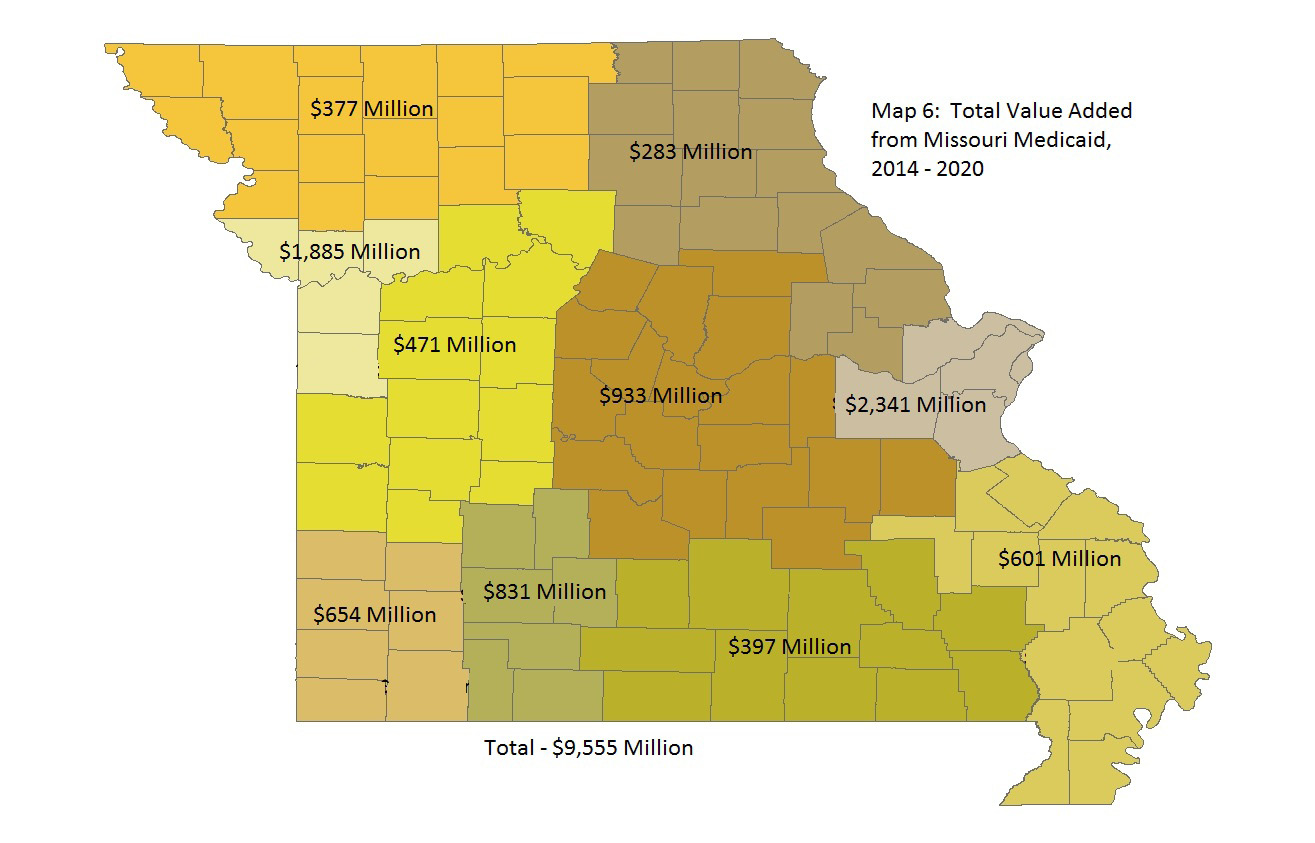
38 Page 31
The Negative Employment Impacts of the Medicare Cuts in the Budget Control Act of 2011. September 2012
 The Negative Employment Impacts of the Medicare Cuts in the Budget Control Act of 2011 September 2012 Table of Contents Executive Summary... 3 Introduction... 4 Methodology Employed in the Economic Impact
EXAMINING THE IMPACT OF THE PATIENT PROTECTION AND AFFORDABLE CARE ACT IN NORTH CAROLINA MEDICAID EXPANSION OPTION ISSUE BRIEF
 EXAMINING THE IMPACT OF THE PATIENT PROTECTION AND AFFORDABLE CARE ACT IN NORTH CAROLINA MEDICAID EXPANSION OPTION ISSUE BRIEF As originally passed, the Patient Protection and Affordable Care Act (ACA)
issue brief Medicaid: A Key Source of Insurance in New Hampshire
 issue brief April 20, 2011 Medicaid: A Key Source of Insurance in New Hampshire As state and federal policymakers come to grips with substantial budget shortfalls both now and into the future one public
The Economic Impact of the Medicaid Expansion on Virginia s Economy
 12.7.2012 The Economic Impact of the Medicaid Expansion on Virginia s Economy The economic impact from expanding Medicaid is nearly four times larger with the opting in scenario when compared to opting
The Current and Future Role and Impact of Medicaid in Rural Health
 The Current and Future Role and Impact of Medicaid in Rural Health Prepared by the RUPRI Health Panel Keith J. Mueller, PhD, Chair Andrew F. Coburn, PhD Jennifer P. Lundblad, PhD, MBA A. Clinton MacKinney,
Health Reform: The Cost of Failure and the Implications of Success
 Health Reform: The Cost of Failure and the Implications of Success Bowen Garrett John Holahan June 17, 2010 National Association for Business Economics www.healthpolicycenter.org The Affordable Care Act
The Economic Benefits of Health Care Reform in New Mexico
 The Economic Benefits of Health Care Reform in New Mexico Introduction June 2011 Updated August 2011 Federal health care reform, known officially as the Patient Protection and Affordable Care Act (PPACA,
Missouri Medicaid Basics
 Missouri Medicaid Basics Spring 2011 Introduction The Medicaid program, enacted through Title XIX of the federal Social Security Act in 1965 at the same time as Medicare, exists as the largest of the federal-state
THE MEDICAID PROGRAM AT A GLANCE. Health Insurance Coverage
 on on medicaid and and the the uninsured March 2013 THE MEDICAID PROGRAM AT A GLANCE Medicaid, the nation s main public health insurance program for low-income people, covers over 62 million Americans,
Section 5: Public Health Insurance Programs
 1 Section 5: Public Health Insurance Programs Medicare Medical Assistance (Medicaid) MinnesotaCare General Assistance Medical Care (GAMC) Minnesota Comprehensive Health Association (MCHA) A summary of
Health Reform Employer Impact Analysis. Sample Employer. Prepared for. Date
 Health Reform Employer Impact Analysis Prepared for Sample Employer Date 2 Health Reform Employer Impact Analysis Overview Beginning in 2014, an applicable large employer becomes subject to what are referred
National Training Program
 National Training Program Module 12 Medicaid and the Children s Health Insurance Program Session Objectives This session will help you Describe eligibility, benefits, and administration of Medicaid Define
Economic Impacts of Extending Health Care Coverage in Florida
 Economic Impacts of Extending Health Care Coverage in Florida Sponsored Project Report to the Florida Hospital Association By Alan W. Hodges, Ph.D. and Mohammad Rahmani, Ph.D. University of Florida, Food
Analysis of the Costs and Impact of Universal Health Care Coverage Under a Single Payer Model for the State of Vermont
 Analysis of the Costs and Impact of Universal Health Care Coverage Under a Single Payer Model for the State of Vermont Prepared for: The Vermont HRSA State Planning Grant, Office of Vermont Health Access
Fiscal Policy Project
 Fiscal Policy Project The Tax Revenue Benefits of Health Care Reform in New Mexico Executive Summary by Kelly O Donnell, Ph.D. for New Mexico Voices for Children August 2011 Updated August 2012* The Patient
Health Insurance Coverage in Nebraska Kelly Shaw-Sutherland and Jim P. Stimpson
 Health Insurance Coverage in Nebraska Kelly Shaw-Sutherland and Jim P. Stimpson S U M M A R Y 217,100 Nebraskans lack health insurance. Nebraska s uninsured rate for the population younger than 65 years
Affordable Care Act (ACA) Health Insurance Exchanges and Medicaid Expansion
 Health Insurance Exchanges and Medicaid Expansion") Affordable Care Act (ACA) Health Insurance Exchanges and Medicaid Expansion Table of Contents Expanded Coverage... 2 Health Insurance Exchanges... 3 Medicaid Expansion... 8 Novartis Pharmaceuticals Corporation
Affordable Care Act (ACA) Health Insurance Exchanges and Medicaid Expansion Table of Contents Expanded Coverage... 2 Health Insurance Exchanges... 3 Medicaid Expansion... 8 Novartis Pharmaceuticals Corporation
Economic Impact of Proposed Tax and Spending Reductions in Kansas Final Report Prepared by: John D. Wong, J.D., Ph.D.
 Economic Impact of Proposed Tax and Spending Reductions in Kansas Final Report Prepared by: John D. Wong, J.D., Ph.D. For Kansas Economic Progress Council 212 SW 8th Avenue, Suite 200 Topeka, KS 66612
Patient Protection and Affordable Care Act (H.R. 3590)
") on Health Reform Passing comprehensive health care reform has been a priority of the President and Congress. The U.S. House of Representatives passed the Affordable Health Care for America Act on November
on Health Reform Passing comprehensive health care reform has been a priority of the President and Congress. The U.S. House of Representatives passed the Affordable Health Care for America Act on November
The Continued Need for Reform: Building a Sustainable Health Care System
 The Continued Need for Reform: Building a Sustainable Health Care System Sustainable reform must address cost and quality, while expanding coverage through a vibrant and functional marketplace As the largest
THE PATIENT Protection and Affordable Care Act,
 1 BEA BRIEFING Affordable Care Act Transactions in the National Income and Product Accounts Benjamin A. Mandel THE PATIENT Protection and Affordable Care Act, often called the Affordable Care Act (ACA),
THE PROJECTED ECONOMIC AND FISCAL IMPACTS OF A TENNESSEE HISTORIC REHABILITATION INVESTMENT INCENTIVE
 THE PROJECTED ECONOMIC AND FISCAL IMPACTS OF A TENNESSEE HISTORIC REHABILITATION INVESTMENT INCENTIVE February 2014 Prepared by: Economic Impact Group, LLC. Copyright 2014 Economic Impact Group, LLC. EXECUTIVE
How Will the Medicaid Expansion Benefit New Mexico?
 A Report from New Mexico s Internal Medicine Physician Specialists: How Will the Medicaid Expansion Benefit New Mexico? Introduction In light of the Supreme Court s ruling on the Affordable Care Act s
Analysis of the Costs and Impact of Universal Health Care Models for the State of Maryland: The Single-Payer and Multi-Payer Models
 Analysis of the Costs and Impact of Universal Health Care Models for the State of Maryland: The Single-Payer and Multi-Payer Models Final Report Presented to: The Maryland Citizens Health Initiative Education
Pennsylvania s Medicaid program (Medical Assistance) has dozens of eligibility groups and programs, each with its own qualifying criteria.
 has dozens of eligibility groups and programs, each with its own qualifying criteria.") 1 Pennsylvania s Medicaid program (Medical Assistance) has dozens of eligibility groups and programs, each with its own qualifying criteria. Non Financial Factors include: Age; Disability (temporary, permanent
1 Pennsylvania s Medicaid program (Medical Assistance) has dozens of eligibility groups and programs, each with its own qualifying criteria. Non Financial Factors include: Age; Disability (temporary, permanent
Household health care spending: comparing the Consumer Expenditure Survey and the National Health Expenditure Accounts Ann C.
 Household health care spending: comparing the Consumer Expenditure Survey and the National Health Expenditure Accounts Ann C. Foster Health care spending data produced by the Federal Government include
OVERVIEW OF KENTUCKY Outreach MEDICAID AND KCHIP
 OVERVIEW OF KENTUCKY Outreach MEDICAID AND KCHIP Lisa Lee Director, Medicaid Division of Provider Operations Program Director, Kentucky Children s Health Insurance Program (KCHIP) September 2011 Background
Medicaid Expansion and the Affordable Care Act. AUGUST 2012 David Blatt Director, Oklahoma Policy Institute dblatt@okpolicy.
 Medicaid Expansion and the Affordable Care Act AUGUST 2012 David Blatt Director, Oklahoma Policy Institute dblatt@okpolicy.org 918-794-3944 Summary of the Supreme Court Decision What Was At Issue Whether
Setting the Record Straight about Medicare
 Fact Sheet Setting the Record Straight about Medicare Keith D. Lind, JD, MS As the nation considers the future of Medicare, it is important to separate the facts from misconceptions about Medicare coverage,
Why Accept Medicaid Dollars: The Facts
 Why Accept Medicaid Dollars: The Facts If we accept federal Medicaid dollars, nearly 500,000 North Carolinians will gain access to health insurance. As many as 1,100 medically unnecessary deaths per year
 Prescription drugs are a critical component of health care. Because of the role of drugs in treating conditions, it is important that Medicare ensures that its beneficiaries have access to appropriate
The Florida Legislature has a historical opportunity to extend health care coverage to
 2425 TORREYA DRIVE TALLAHASSEE, FL 32303 PHONE: 850.385.7900 FAX: 850.385.9998 MARY ANNE DePETRILLO PRESIDENT WHITE PAPER: MEDICAID EXPANSION KENT R. SPUHLER DIRECTOR I. SUMMARY The Florida Legislature
West Virginia s Economy Will Benefit from Expanding Medicaid
 West Virginia s Economy Will Benefit from Expanding Medicaid Families USA and West Virginians for Affordable Health Care West Virginia s Economy Will Benefit from Expanding Medicaid February 2013 by Families
How To Calculate The Cost Of A Health Insurance Tax Credit In Oregona
 Oregon Health Fund Board INITIAL ECONOMETRIC MODELING FOR THE OREGON HEALTH FUND BOARD Final Report February 2009 SUMMARY The Oregon Health Fund Board worked with consultants from the Massachusetts Institute
The Affordable Care Act: Medicaid Expansion & Healthcare Exchanges
 The Affordable Care Act: Medicaid Expansion & Healthcare Exchanges Government Relations Division 1133 Connecticut Avenue, NW Suite 1100 Washington, DC 20036 Summary Points The Affordable Care Act requires
And Changes under Healthcare Reform affecting businesses
 And Changes under Healthcare Reform affecting businesses 1 Individual Mandate 2 First there were two choices Under the Affordable Care Act every individual must have Minimum Essential Healthcare Coverage
The economic impact of Minnesota State Colleges and Universities
 The economic impact of Minnesota State Colleges and Universities F E B R U A R Y 2 0 1 3 The economic impact of Minnesota State Colleges and Universities February 2013 Prepared by: Jose Y. Diaz and Gabriel
New Mexico Health Care Reform Fiscal Model: Detailed Analysis and Methodology
 New Mexico Health Care Reform Fiscal Model: Detailed Analysis and Methodology March 2012 Suggested Citation: Fakhraei, S. H. (2012). New Mexico health care reform fiscal model: Detailed analysis and methodology.
FEDERAL GOVERNMENT WILL PICK UP NEARLY ALL COSTS OF HEALTH REFORM S MEDICAID EXPANSION By January Angeles and Matthew Broaddus
 820 First Street NE, Suite 510 Washington, DC 20002 Tel: 202-408-1080 Fax: 202-408-1056 center@cbpp.org www.cbpp.org Updated March 28, 2012 FEDERAL GOVERNMENT WILL PICK UP NEARLY ALL COSTS OF HEALTH REFORM
THE GOVERNOR S FY 2015 BUDGET PROPOSAL FOR MASSHEALTH (MEDICAID) AND HEALTH REFORM PROGRAMS
 AND HEALTH REFORM PROGRAMS") THE GOVERNOR S BUDGET PROPOSAL FOR MASSHEALTH (MEDICAID) AND HEALTH REFORM PROGRAMS BUDGET BRIEF MARCH 2014 On January 22, the Governor released his budget proposal for the upcoming fiscal year (FY) 2015,
THE GOVERNOR S BUDGET PROPOSAL FOR MASSHEALTH (MEDICAID) AND HEALTH REFORM PROGRAMS BUDGET BRIEF MARCH 2014 On January 22, the Governor released his budget proposal for the upcoming fiscal year (FY) 2015,
Medicare Design Part A: Inpatient care, hospice, and some home health care Part B: Physician services + outpatient care Part C ( Medicare Advantage
 Medicare Design Part A: Inpatient care, hospice, and some home health care Part B: Physician services + outpatient care Part C ( Medicare Advantage ): Private plan alternative to Parts A and B Part D:
WM RECYCLE AMERICA, L.L.C.
 WM RECYCLE AMERICA, L.L.C. CITY OF SPOKANE MRF ECONOMIC IMPACT STUDY Conducted by: BUSINESS RESEARCH DIVISION Leeds School of Business University of Colorado at Boulder 420 UCB Boulder, CO 80309-0420 Telephone:
A Healthy Florida Works Program. Policy Proposal. The smart choice for individuals and businesses in Florida
 A Healthy Florida Works Program Policy Proposal The smart choice for individuals and businesses in Florida TABLE OF CONTENTS Introduction Executive Summary Program Description 3 5 6 Coverage Population
Department of Human Services Health Care Reform Review Committee Representative George Keiser, Chairman September 29, 2015
 Department of Human Services Health Care Reform Review Committee Representative George Keiser, Chairman September 29, 2015 Chairman Keiser, members of the Health Care Reform Review Committee, I am Stephanie
ANALYSIS OF THE AFFORDABLE CARE ACT (ACA) MEDICAID EXPANSION IN KENTUCKY. Kentucky Cabinet for Health and Family Services
 MEDICAID EXPANSION IN KENTUCKY. Kentucky Cabinet for Health and Family Services") ANALYSIS OF THE AFFORDABLE CARE ACT (ACA) MEDICAID EXPANSION IN KENTUCKY Kentucky Cabinet for Health and Family Services EXECUTIVE SUMMARY The Commonwealth of Kentucky faces a critical choice, perhaps
ANALYSIS OF THE AFFORDABLE CARE ACT (ACA) MEDICAID EXPANSION IN KENTUCKY Kentucky Cabinet for Health and Family Services EXECUTIVE SUMMARY The Commonwealth of Kentucky faces a critical choice, perhaps
HHealth HEALTH INSURANCE EXCHANGE FAQs
 HHealth HEALTH INSURANCE EXCHANGE FAQs Page 1 TABLE OF CONTENTS Introduction... 3 Background... 3 Health Insurance Exchange FAQs... 4 What is the Patient Protection and Affordable Care Act (PPACA)?...
kaiser medicaid and the uninsured commission on The Cost and Coverage Implications of the ACA Medicaid Expansion: National and State-by-State Analysis
 kaiser commission on medicaid and the uninsured The Cost and Coverage Implications of the ACA Medicaid Expansion: National and State-by-State Analysis John Holahan, Matthew Buettgens, Caitlin Carroll,
The economic impact of Winona State University
 The economic impact of Winona State University F E B R U A R Y 2 0 1 3 The economic impact of February 2013 Prepared by: Jose Y. Diaz and Gabriel Pina Wilder Research 451 Lexington Parkway North Saint
The Cost of Care for the Uninsured: What Do We Spend, Who Pays, and What Would Full Coverage Add to Medical Spending?
 The Cost of Care for the : What Do We Spend, Who Pays, and What Would Full Coverage Add to Medical Spending? Issue Update 2004 Jack Hadley, Ph.D. and John Holahan, Ph.D. Prepared for the Kaiser Commission
Maryland Data as of July 2003. Mental Health and Substance Abuse Services in Medicaid and SCHIP in Maryland
 Mental Health and Substance Abuse Services in Medicaid and SCHIP in Maryland As of July 2003, 638,662 people were covered under Maryland's Medicaid/SCHIP programs. There were 525,080 enrolled in the Medicaid
and the uninsured June 2005 Medicaid: An Overview of Spending on Mandatory vs. Optional Populations and Services
 I S S U E kaiser commission on medicaid and the uninsured June 2005 P A P E R Medicaid: An Overview of Spending on vs. Optional Populations and Services Medicaid is a federal-state program that provides
Issue Brief. How States Stand to Gain or Lose Federal Funds by Opting In or Out of the Medicaid Expansion. Sherry Glied and Stephanie Ma OVERVIEW
 December 2013 Issue Brief How States Stand to Gain or Lose Federal Funds by Opting In or Out of the Medicaid Expansion Sherry Glied and Stephanie Ma The mission of The Commonwealth Fund is to promote a
I O W A S C U R R E N T H E A L T H C O V E R A G E M A R K E T P L A C E : B A C K G R O U N D R E S E A R C H
 I O W A S H E A L T H BEN E F I T E X C H A N G E P R O J E C T I O W A S C U R R E N T H E A L T H C O V E R A G E M A R K E T P L A C E : B A C K G R O U N D R E S E A R C H P R E P A R E D B Y : V E
Health Care in Rural America
 Health Care in Rural America Health care in rural communities has many aspects access to physicians, dentists, nurses, and mental health services; the financial circumstances of rural hospitals; federal
Economic Impact Analysis of School Facility Construction
 Wright State University CORE Scholar Economic Development Center for Urban and Public Affairs 2010 Economic Impact Analysis of School Facility Construction Wright State University, Center for Urban and
STATE CONSIDERATIONS ON ADOPTING HEALTH REFORM S BASIC HEALTH OPTION Federal Guidance Needed for States to Fully Assess Option by January Angeles
 820 First Street NE, Suite 510 Washington, DC 20002 Tel: 202-408-1080 Fax: 202-408-1056 center@cbpp.org www.cbpp.org March 13, 2012 STATE CONSIDERATIONS ON ADOPTING HEALTH REFORM S BASIC HEALTH OPTION
DEPARTMENT OF HEALTH & HUMAN SERVICES MEDICAID PROGRAM OVERVIEW
 DEPARTMENT OF HEALTH & HUMAN SERVICES MEDICAID PROGRAM OVERVIEW North Carolina General Assembly Fiscal Research Division February 2005 Overview Purpose of Medicaid Impact of Medicaid - On the State Economy
The Importance of the Health Care Sector to the Economy of Cherokee County
 The Importance of the Health Care Sector to the Economy of Cherokee County Kansas Hospital Association November 2013 Funding for this report provided by the Kansas Hospital Association This report prepared
Getting Ready for 2014: The Big Year for Healthcare Reform Anne Arundel County SHRM. David Johnson jdjohnson@rcmd.com November 15, 2012
 Getting Ready for 2014: The Big Year for Healthcare Reform Anne Arundel County SHRM David Johnson jdjohnson@rcmd.com November 15, 2012 0 Topics for Discussion 1. Recap of Supreme Court Decision on Affordable
Summary of the Major Provisions in the Patient Protection and Affordable Health Care Act
 Summary of the Major Provisions in the Patient Protection and Affordable Care Act Updated 10/22/10 On March 23, 2010, President Barack Obama signed into law comprehensive health care reform legislation,
Medicaid Expansion in South Carolina
 Medicaid Expansion in South Carolina The Economic Impact of the Affordable Care Act Prepared for the South Carolina Hospital Association December 2012 Executive Summary If South Carolina opts into the
Office of Medical Assistance Programs Mission and Goals. Historical Perspective
 Mission Department of Human Services Office of Medical Assistance Programs Mission and Goals To plan and implement medical programs assuring access to basic care for eligible clients Goals Increase access
State Health Care Spending on Medicaid Definitions, Data, and Methodologies
 A methodology from The Pew Charitable Trusts and the John D. and Catherine T. MacArthur Foundation July 2014 State Health Care Spending on Medicaid Definitions, Data, and Methodologies This document provides
Texas Affordable Care Act Implementation: Challenges and Opportunities
 Texas Affordable Care Act Implementation: Challenges and Opportunities Texas Robert Greenwald Clinical Professor of Law Director, Center for Health Law and Policy Innovation of Harvard Law School January
Utah Data as of July 2003. Mental Health and Substance Abuse Services in Medicaid and SCHIP in Utah
 Mental Health and Substance Abuse Services in Medicaid and SCHIP in Utah As of July 2003, 196,600 people were covered under Utah s Medicaid/SCHIP programs. There were 157,322 enrolled in the Medicaid program,
Expanding Medicaid in Texas - A Real Rational Choice
 October 2012 Only One Rational Choice: Texas Should Participate in Medicaid Expansion Under the Affordable Care Act Provided as a Public Service by THE PERRYMAN GROUP 510 N. Valley Mills Dr., Suite 300
california Health Care Almanac
 california Health Care Almanac : Slow But Steady august 2012 Introduction In 2014, implementation of the Affordable Care Act (ACA) will cause a spike in US health spending; analysts project an increase
The Patient Protection and Affordable Care Act. Implementation Timeline
 The Patient Protection and Affordable Care Act Implementation Timeline 2009 Credit to Encourage Investment in New Therapies: A two year temporary credit subject to an overall cap of $1 billion to encourage
Health Insurance Continuation Coverage Under COBRA
 Health Insurance Continuation Coverage Under COBRA Janet Kinzer Information Research Specialist July 11, 2013 CRS Report for Congress Prepared for Members and Committees of Congress Congressional Research
GAO PATIENT PROTECTION AND AFFORDABLE CARE ACT. Effect on Long-Term Federal Budget Outlook Largely Depends on Whether Cost Containment Sustained
 GAO United States Government Accountability Office Report to the Ranking Member, Committee on the Budget, U.S. Senate January 2013 PATIENT PROTECTION AND AFFORDABLE CARE ACT Effect on Long-Term Federal
Colorado Community Health Centers. Strengthening Colorado s Health and the Economy
 Colorado Community Health Centers Strengthening Colorado s Health and the Economy Colorado Community Health Centers Employment Impact, 2011 6,025 3,621 2,404 Colorado Community Health Centers Contribute
Medicaid 101: The SoonerCare Safety Net By Kate Richey, Policy Analyst
 January 2012 Medicaid 101: The SoonerCare Safety Net By Kate Richey, Policy Analyst he health care system in the United States is experiencing an unprecedented period of upheaval. T Decades of rising costs,
The economic impact of Dakota County Technical College
 The economic impact of Dakota County Technical College F E B R U A R Y 2 0 1 3 The economic impact of February 2013 Prepared by: Jose Y. Diaz and Gabriel Pina Wilder Research 451 Lexington Parkway North
City of Beverly. Impact ECONOMIC STUDY. conducted for ENDICOTT RESEARCH CENTER ENDICOTT COLLEGE BEVERLY, MASSACHUSETTS
 City of Beverly Impact ECONOMIC STUDY conducted for by ENDICOTT RESEARCH CENTER ENDICOTT COLLEGE BEVERLY, MASSACHUSETTS City of Beverly Impact ECONOMIC STUDY conducted for CONTENTS Executive Summary.............................
Economic Impact of Proposed Tax and Spending Reductions in Kansas
 Economic Impact of Proposed Tax and Spending Reductions in Kansas Final Report Prepared by: John D. Wong, J.D., Ph.D. For Kansas Economic Progress Council 212 SW 8th Avenue, Suite 200 Topeka, KS 66612
Debbie Cestaro Seifer, MS, RN
 HIV Case Conference: The U.S. Territories Healthcare Reform Debbie Cestaro Seifer, MS, RN Clinical Trainer and Faculty Member, Florida/Caribbean AIDS Education and Training Center 2010 Rate of Uninsured
Medicaid Topics Impact of Medicare Dual Eligibles Stephen Wilhide, Consultant
 Medicaid Topics Impact of Medicare Dual Eligibles Stephen Wilhide, Consultant Issue Summary The term dual eligible refers to the almost 7.5 milion low-income older individuals or younger persons with disabilities
PPACA Subsidy Model Description
 PPACA Subsidy Model Description John A. Graves Vanderbilt University November 2011 This draft paper is intended for review and comments only. It is not intended for citation, quotation, or other use in
THE FISCAL YEAR 2015 BUDGET FOR MASSHEALTH AND HEALTH REFORM PROGRAMS
 THE FISCAL YEAR 2015 BUDGET FOR MASSHEALTH AND HEALTH REFORM PROGRAMS BUDGET BRIEF SEPTEMBER 2014 On July 10, 2014, Governor Deval Patrick signed the budget for fiscal year (FY) 2015, one week into the
The economic impact of Saint Paul College
 The economic impact of M A R C H 2 0 1 3 The economic impact of March 2013 Prepared by: Jose Y. Diaz and Gabriel Pina Wilder Research 451 Lexington Parkway North Saint Paul, Minnesota 55104 651-280-2700
Oregon Data as of July 2003. Mental Health and Substance Abuse Services in Medicaid and SCHIP in Oregon
 Mental Health and Substance Abuse Services in Medicaid and SCHIP in Oregon As of July 2003, 398,874 people were covered under Oregon s Medicaid/SCHIP programs. There were 380,546 enrolled in the Medicaid
Home Care Association of Washington Conference. MaryAnne Lindeblad, State Medicaid Director Washington Health Care Authority
 Home Care Association of Washington Conference MaryAnne Lindeblad, State Medicaid Director Washington Health Care Authority April 25, 2013 Overview Overview of Health Care Authority Public Employees Benefits
Health Reform and the AAP: What the New Law Means for Children and Pediatricians
 Health Reform and the AAP: What the New Law Means for Children and Pediatricians Throughout the health reform process, the American Academy of Pediatrics has focused on three fundamental priorities for
Currently, for the very low-income, Medicaid is available for children, parents, and individuals who are disabled, elderly, or pregnant.
 0 Currently, for the very low-income, Medicaid is available for children, parents, and individuals who are disabled, elderly, or pregnant. Parents are typically covered at very low income levels, and most
Implementation. Attached:
 From: Katie Mason, MPP, Research Analyst II, NCSL Health Program Date: August 4, 2010 Health Provider and Industry State Fees and Taxes A Colorado Story Colorado Medicaid Background Colorado s Medicaid
HEALTH INSURANCE EXCHANGE FAQS
 HEALTH INSURANCE EXCHANGE FAQS 0 TABLE OF CONTENTS INTRODUCTION... 1 BACKGROUND... 1 HEALTH INSURANCE EXCHANGE FAQS... 1 1 INTRODUCTION IN EARLY 2010, CONGRESS PASSED THE PATIENT PROTECTION AND AFFORDABLE
State of New York Department of Health/Insurance Department PARTNERSHIP FOR COVERAGE
 State of New York Department of Health/Insurance Department PARTNERSHIP FOR COVERAGE Report of the Commissioner of Health and Insurance Superintendent to Governor David A. Paterson on the Partnership for
kaiser medicaid commission on and the uninsured May 2009 Community Care of North Carolina: Putting Health Reform Ideas into Practice in Medicaid
 P O L I C Y B R I E F kaiser commission on medicaid SUMMARY and the uninsured Community Care of North Carolina: Putting Health Reform Ideas into Practice in Medicaid May 2009 Why is Community Care of North
Panorama Rooms Thursday 5 March, 2015 14:00. Mr David Abernethy. Health Policy & Government Relations Consultant, Washington, DC
 Panorama Rooms Thursday 5 March, 2015 14:00 Mr David Abernethy Health Policy & Government Relations Consultant, Washington, DC U.S. Private Insurance Solutions in the US Social Insurance System for the
RUPRI Center for Rural Health Policy Analysis Rural Policy Brief
 RUPRI Center for Rural Health Policy Analysis Rural Policy Brief Brief No. 2009-5 June 2009 www.unmc.edu/ruprihealth A Rural-Urban Comparison of a Building Blocks Approach to Covering the Uninsured By
Florida Data as of July 2003. Mental Health and Substance Abuse Services in Medicaid and SCHIP in Florida
 Mental Health and Substance Abuse Services in Medicaid and SCHIP in Florida As of July 2003 2,441,266 people were covered under Florida's Medicaid and SCHIP programs. There were 2,113,820 enrolled in the
Federal Health Reform FAQs
 Federal Health Reform FAQs Individuals 1. What is an exchange? An exchange, as created under the Affordable Care Act (ACA), is a place where consumers can purchase subsidized health insurance coverage.
How To Save Money On Health Insurance In Minnesota
 Cost and Economic Impact Analysis of a Single-Payer Plan in Minnesota Final Report Prepared for: Growth & Justice Submitted by: John Sheils and Megan Cole The Lewin Group Date: March 27, 2012 Cost and
The Economic Impact of AAMC-Member Medical Schools and Teaching Hospitals
 The Economic Impact of AAMC-Member Medical Schools and Teaching Hospitals Conducted for the AAMC by Tripp Umbach September 2009 Association of American Medical Colleges For additional information about
Office of Health Transformation Extend Medicaid Coverage and Automate Enrollment
 Office of Health Transformation Extend Medicaid Coverage and Automate Enrollment Background: Eligibility determination for health and human services programs in Ohio are fragmented, overly complex, and
The Economic Impact of Health Services on the Economy of Sumter County, Alabama
 The Economic Impact of Health Services on the Economy of Sumter County, Alabama Hospitals Nursing Homes Physicians, Dentists, Etc. Pharmacies Other Services Prepared by: National Center for Rural Health
Health Care Reform Overview How Will People with Hepatitis Benefit?
 Health Care Reform Overview How Will People with Hepatitis Benefit? A N N E D O N N E L L Y, H E A L T H C A R E P O L I C Y, P R O J E C T I N F O R M R A C H E L M C L E A N, A D U L T V I R A L H E
Health Care Law Implementation: What Nonprofits Need to Know WELCOME!
 Health Care Law Implementation: What Nonprofits Need to Know WELCOME! Health Care Law Implementation: What Nonprofits Need to Know (PPACA) Health Care Law Implementation: What Nonprofits Need to Know Heather
Maryland Health Care Reform Simulation Model: Detailed Analysis and Methodology
 Maryland Health Care Reform Simulation Model: Detailed Analysis and Methodology July 2012 Revised February 24, 2014 Suggested Citation: Fakhraei, S. H. (rev. 2014). Maryland health care reform simulation
13.8% Inflation-adjusted GDP (billions) Cumulative growth 2009 to Q3 2015. Exhibit 1 Steady U.S. Economic Growth After a Severe Recession $17,000
 Cumulative growth 2009 to Q3 2015. Exhibit 1 Steady U.S. Economic Growth After a Severe Recession $17,000") Exhibit 1 Steady U.S. Economic Growth After a Severe Recession Inflation-adjusted GDP (billions) $17,000 $16,000 $15,000 $14,000 $13,000 13.8% Cumulative growth 2009 to Q3 2015 $12,000 $11,000 $10,000
Exhibit 1 Steady U.S. Economic Growth After a Severe Recession Inflation-adjusted GDP (billions) $17,000 $16,000 $15,000 $14,000 $13,000 13.8% Cumulative growth 2009 to Q3 2015 $12,000 $11,000 $10,000