ROTTNEROS INTERIM REPORT JANUARY TO MARCH 2014
|
|
|
- Sophie Fleming
- 8 years ago
- Views:
Transcription
1 ROTTNEROS INTERIM REPORT JANUARY TO MARCH 2014 Period in rewiev Jan-Mar 2014 Oct-Dec 2013 change Jan-Mar 2013 change Net turnover, SEK m Operating Income, SEK m including items affecting comparability Income after net financial items, SEK m Profit/loss after tax, SEK m Earnings per share after tax, SEK including items affecting comparability Cash flow before investments, SEK m Profit after net financial items amounted to SEK 20 million for the first quarter of 2014, compared with losses of SEK -43 million for the fourth quarter of 2013 and SEK -4 million for the first quarter of Net turnover SEK m Earnings after net financial items, SEK m 400 The average PIX price for NBSK amounted to USD 916 for the first quarter of The price increase in Swedish kronor is twelve per cent compared with the same period of The price increase is two per cent compared with the previous quarter and was affected negatively by the weak dollar Stable production at Vallviks Bruk during the first quarter resulted in lower direct costs, which had a positive impact on the result. Cash flow from operating activities amounted to SEK 9 (21) million for the first quarter of Net borrowing amounted to SEK -25 (-33) million on 31 March Q1 Q2 Q3 Q4 Q1 Q2 Q3 Q4 Q ROTTNEROS QUARTERLY REPORT JANUARY-MARCH

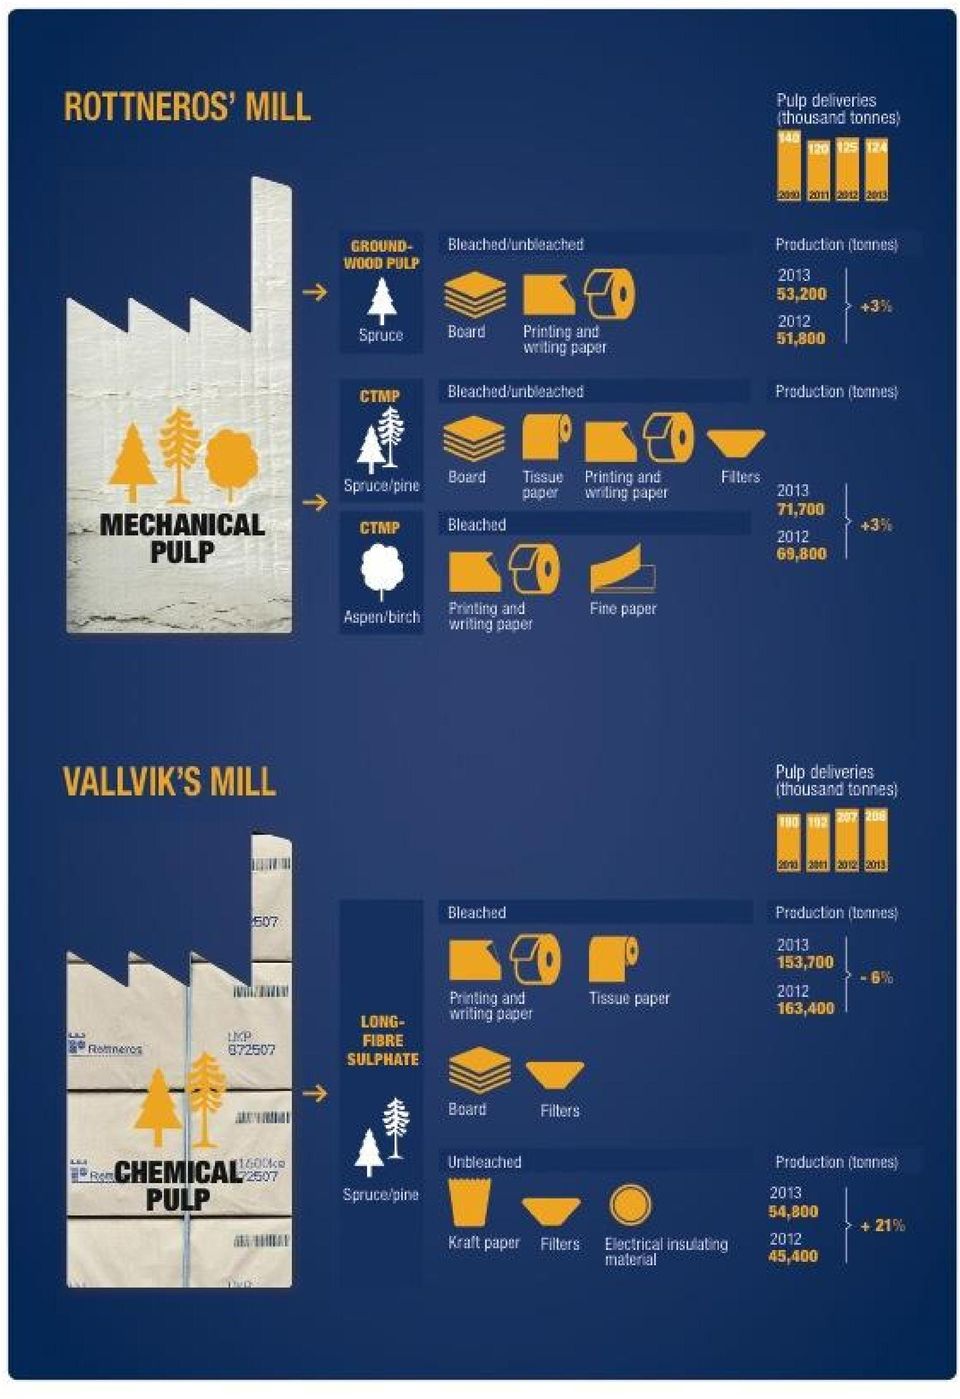
2 CEO S STATEMENT It is both gratifying and inspiring to report an improvement in our results for the first quarter. Our operating profit increased by SEK 27 million, to SEK 21 million, compared with the same quarter of last year. This improvement was primarily driven by higher pulp prices, although it was also helped by lower variable costs attributable to better production stability at Vallviks Bruk. The extensive programme of change that we initiated in the autumn of 2013 is continuing on track and on time. The objective of these changes is to strengthen our competitiveness and assure our long-term profitability. The first phase of this programme (Focus 15) will be completed by January Focus 15 is primarily targeted at improving operational efficiency and boosting production volumes. We expect to see the impact of Focus15 even more clearly towards the end of the year when the measures we have implemented will start to bear fruit in the form of among other things increased volumes, mainly at Vallviks Bruk. We are focusing on establishing clear routines and areas of responsibility where safety continues to represent a common theme within all of our activities. We are also making greater efforts to provide clear leadership and will reinforce our common set of core values. The market has developed strongly during the first quarter, with continuing increase of demand for chemical pulp. The CTMP market also strengthened and demonstrated good balance during the quarter, with a price rise that was primarily driven by growing demand in Asia. I rejoice at the positive and open attitude I meet in many parts of the organisation, which represents a basic precondition for bringing about change. I am firmly convinced that our intensive work will provide us with the availability and productivity and, not least, also establish the culture required for our long-term profitability. Carl-Johan Jonsson THE PULP MARKET 1200 NBSK PIX IN USD /Tonne NBSK PIX IN SEK/Tonne 7600 MARKETS AND PRODUCTS Pulp market internationally Demand for paper pulp intensified during the first quarter of 2014 and improvements to the PIX price continue, although at a slower pace compared with the fourth quarter of The price of NSBK PIX increased during the first quarter, from USD 906 per tonne at the beginning of the year to USD 922 per tonne on 31 March The PIX price for bleached long-fibre sulphate pulp was USD 136 per tonne higher than short-fibre sulphate pulp at the beginning of The price difference continued to grow to approximately USD 160 per tonne during the first quarter of The price difference between these paper pulps is now historically high. The NBSK market demonstrates a good balance between capacity and demand. Producer stock levels are normal, corresponding to 29 days' production, two days more than at the beginning of the year. There are few announcements about price increases for April, but the producers are working to fully implement the price increase announced in March and also to raise the companies net prices. A good balance also prevails in the CTMP market. Several price increases have been implemented since the autumn of 2013 and continued during the first quarter of 2014, although these have been at a slower pace than for NBSK. This resulted in prices at the end of the first quarter lying around USD 620 to 640 per tonne PRODUCTION AND DELIVERIES The Group's pulp mills at Rottneros Bruk and Vallviks Bruk have a combined annual production capacity of approximately 400,000 tonnes. Production amounted to 85,000 (88,100) tonnes for January to March Rottneros Bruk s production of groundwood pulp represents the most significant deviation. This reduced when the mill produced groundwood pulp to build up stock for customers during the first quarter of the previous year prior to the planned closure of the groundwood line, which subsequently was not implemented. Deliveries amounted to 87,200 (85,500) tonnes during the first quarter of Vallviks Bruk s deliveries of sulphate pulp have increased by 4,000 tonnes compared with the same period of the previous year. Deliveries of CTMP also increased during the first quarter of Deliveries of groundwood pulp were higher during the first quarter of 2013 owing to stock being built up at customers prior to the planned shutdown of the groundwood pulp line ROTTNEROS QUARTERLY REPORT JANUARY-MARCH

3 Production (tonnes) Jan-Mar 2014 Oct-Dec 2013 Jan-Mar 2013 Sulphate pulp 52,300 48,200 52,200 Groundwood pulp 12,700 10,600 17,100 CTMP 20,000 20,100 18,800 TOTAL 85,000 78,900 88,100 Deliveries (tonnes) Jan-Mar 2014 Oct-Dec 2013 Jan-Mar 2013 Sulphate pulp 55,600 44,600 51,600 Groundwood pulp 11,600 9,300 15,500 CTMP 20,000 22,300 18,400 TOTAL 87,200 76,200 85,500 Maintenance shutdowns and seasonal variations A holiday shutdown is normally held at the mill in Rottneros in July and August, which is combined with annual maintenance work. A maintenance shutdown will take place at Vallviks Bruk during the fourth quarter. Costs relating to maintenance shutdowns are recognised in the period during which the shutdown takes place. Otherwise, the Rottneros Group is not affected by seasonal variations to any appreciable extent. INVOICING AND RESULTS January to March 2014 compared with January to March 2013 Deviation analysis Jan-Mar 2014 Jan-Mar 2013 NBSK PIX SEK/USD NBSK SEK 5,919 5,295 OPERATING INCOME 21-6 Price 24 Currency 2 Volume -3 Variable costs 9 Hedging activities realised -4 Other -1 TOTAL 27 The average price of long-fibre sulphate pulp (NBSK) in USD increased by eleven per cent, from USD 823 to USD 916, while the average price of NBSK pulp converted into SEK increased from SEK 5,295 to 5,919 per tonne, an increase of twelve per cent due to the development of a slightly higher dollar. Group net turnover amounted to SEK 380 (354) million for January to March 2014, an increase of seven per cent. The deviation in relation to the price increase is largely explained by lower timber sales to external customers in our Latvian company. More stable production at Vallviks Bruk during the quarter resulted in lower direct costs. The average price of electricity on the Nord Pool electricity exchange amounted to SEK 0.27 (0.35) per kwh for the period January to March 2014 and had a positive impact on variable costs. Group operating profit amounted to SEK 21 (-6) million for the first quarter of The outcome of hedging activities realised for currency and pulp during the first quarter of 2014 amounted to SEK 0 (4) million. Group profit after net financial items amounted to SEK 20 (-4) million and includes net financial items of SEK -1 (2) million. Profit after tax amounted to SEK 16 (-4) million. Earnings per share after tax amounted to SEK 0.10 (-0.03). Cash flow per share amounted to SEK (0.09). January to March 2014 compared with October to December 2013 Deviation analysis Jan-Mar 2014 Oct-Dec 2013 NBSK PIX SEK/USD NBSK SEK 5,919 5,821 OPERATING INCOME Price 12 Currency -3 Volume 8 Variable costs 4 Hedging activities realised -2 Other 1 44 TOTAL 63 1 Including deviation of approx. SEK 30 Million related to the maintenance shutdown. Group net turnover amounted to SEK 380 million for the first quarter of 2014 compared with SEK 317 million for the fourth quarter of The average price of long-fibre sulphate pulp (NBSK) in USD increased from USD 894 to USD 916, an increase of two per cent. The weak dollar had a negative impact on the average prices for NBSK converted into SEK and produced an increase of just under two per cent. The average price of electricity on the Nord Pool electricity exchange amounted to SEK 0.27 per kwh for the first quarter of 2014, compared with SEK 0.33 per kwh for the fourth quarter of Group operating profit amounted to SEK 21 (-42) million for the first quarter of The annual maintenance shutdown at Vallviks Bruk had a negative impact of SEK 30 million on the result for the fourth quarter of The outcome of hedging activities realised for currency and pulp for the first quarter of 2014 amounted to SEK 0 (2) million. ROTTNEROS QUARTERLY REPORT JANUARY-MARCH

4 Group profit after net financial items amounted to SEK 20 million for the first quarter of 2014, compared with a loss of SEK -43 million for the fourth quarter of INVESTMENTS AND FINANCIAL POSITION Group investments in fixed assets amounted to SEK 10 (2) million for January to March The Group had liquid funds amounting to SEK 25 million at the end of March 2014, compared with SEK 35 million at the end of December The Group had total interest-bearing liabilities of SEK 50 million on 31 March 2014 (SEK 72 million on 31 March 2013). Interestbearing net liabilities amounted to SEK 25 (33) million. Approved but unutilised credit facilities amounted to SEK 100 million in total at the end of the year and total approved credit facilities amounted to SEK 150 million. The equity/assets ratio amounted to 73 (74) per cent as of 31 March Equity per share amounted to SEK 5.49 (SEK 6.46 on 31 March 2013). CASH FLOW Cash flow from operating activities before investments amounted to SEK 9 (21) million for January to March 2014 and included cash flow of SEK -1 (6) million from financial hedging. The increase in working capital had a negative impact on cash flow of SEK 24 million. Cash flow after investments amounted to SEK -1 (19) million for January to March AVERAGE NUMBER OF EMPLOYEES The average number of employees was 252 (266) for January to March TAX Deferred tax assets amounted to SEK 43 million on 31 March The utilisation of previously capitalised loss carry-forwards affected this amount by SEK 4 million. Recorded deferred tax assets correspond to unutilised loss carry-forwards of SEK 195 million. There were also tax loss carry-forwards of SEK 174 million, for which deferred tax assets have not been recorded. PARENT COMPANY The parent company's loss after net financial items amounted to SEK -12 (-2) million for January to March The result after net financial items includes hedging activities realised of SEK -5 (4) million. SHARE INFORMATION Number of shares 31 of March 2014 Registered number of shares 153,393,890 - of which treasury shares 821,965 Largest shareholders 31 of march 2014 Shareholder Number of shares (=votes) Percentage of capital Arctic Paper SA 78,230, Peter Gyllenhammar genom bolag 17,487, Robur Försäkring 7,620,998 5 Clearstream Banking S.A., W8IMY 5,600,280 4 Åkesson, Morgan 2,400,000 2 BBVA Ireland P.L.C 2,323,139 2 Försäkrings AB Skandia 1,573,840 1 Försäkringsaktiebolaget, Avanza Pension 1,549,714 1 Larsson Bo 1,489,104 1 Sten Malmer Holding AB 1,309,452 1 Total holdings of 10 largest shareholders 119,584, Rottneros AB (treasury stock from buy-back) 821,965 1 Other shareholders 32,987, TOTAL 153, Treasury shares The number of shares in Rottneros amounts to 153,393,890. Rottneros holding of treasury shares amounts to 821,965 shares. Transactions with related parties Rottneros sold pulp to the Arctic Paper S.A. Group (a related party), amounting to SEK 25 (36) million. Outstanding receivables from Arctic Paper amounted to SEK 9 million on 31 March. Transactions were conducted on normal market conditions but with a lower level of credit insurance, primarily owing to the group relationship between Arctic Paper and Rottneros. Dividend The general meeting will make a decision on dividends for the company at the annual general meeting of Rottneros to be held on 25 April The Board of Directors proposed that no dividend be declared for the financial year ROTTNEROS QUARTERLY REPORT JANUARY-MARCH
. Interestbearing net liabilities amounted to SEK 25 (33) million.")
5 RISK MANAGEMENT The company's operational work involves a number of measures and strategies for example, focusing on niches and various specific customer segments aimed at reducing the Group's dependence on market pulp list prices and moderating fluctuations in profitability over a business cycle. The factors that have the greatest impact on the Group s results are linked to exchange rates and the price of pulp, timber and electricity. The scope and nature of financial assets and liabilities are in all essential respects the same as at 31 December The carrying amounts are the same as actual values, which was also the case at the end of Currency exposure, USD and EUR Although Rottneros issues invoices in different currencies, the main underlying currency for the pulp price is predominantly USD. The underlying exposure to USD is thus very high, and the direct inflow of USD (the real flow) corresponds to approximately 60% and approximately 20% in EUR. However, the impact of exchange rate fluctuations on indirect exposure is delayed, as the normal duration of a contract is between one and three months. The average USD exchange rate was 0.5 per cent higher for January to March, amounting to an average of SEK 6.46/USD for the period compared with SEK 6.43/USD for January to March The impact on revenue of a higher average rate amounted to SEK 2 million compared with the first quarter of In addition to this, currencies were hedged in the form of forward contracts concluded for EUR 9 million, at an average rate of SEK 9.16/EUR, for electricity purchases for the period 2014 to Pulp price The price of pulp (NBSK) is set in USD, while production costs are largely incurred in SEK. Contracts for 2014 were concluded at the beginning of the year for 2,000 tonnes per month at a price of SEK 5,720 per tonne for the period April to December. Nothing was realised during the first quarter. Profit/loss after financial items Group I IV III II I Full year Profit/loss after financial items Whereof: Currency hedges Pulp price hedges Electricity hedges Total hedges Green electricity Electricity All physical electricity for the Swedish mills is purchased directly via the Nord Pool electricity exchange. Electricity prices are listed in EUR. The amount of electricity hedged at the end of March 2014 corresponded to the proportion of forecast consumption shown in the table. The table shows average prices in EUR/MWh, together with average prices in SEK/kWh. Electricity Hedging at 31 of march 2014 Year Part hedged SEK/kWh % % % 33.3 The average price level for electricity on Nord Pool amounted to SEK 0.27 (0.35) per kwh for January to March See pages 25 to 29 of the Annual Report for 2013 for further information on risks. Market value (SEK million) march 2014 Hedging Hedged volume Hedge price Market value Currency EUR, forward sell EUR 1 m 8.84 SEK/EUR 0 Currency EUR, forward buy EUR 9 m 9.16 SEK/EUR -2 Pulp price, SEK 18,0000 tonnes SEK (PIX) -5 Electricity MWh 0.39 SEK /kwh -27 Total market value -34 Market value (SEK million) march 2013 hedging Hedged volume Hedge price Market value Currency USD, forward sell USD 15 m 6,46 SEK/USD -1 Currency EUR, forward buy EUR 13 m 9,18 SEK/EUR -9 Pulp price, SEK 12,000 tonnes 5,700 SEK (PIX) 3 Electricity 300,615 MWh 0.41 SEK /kwh -14 Total market value -21 Reference - spot rate 31 Mar SEK/EUR 8.99 SEK/EUR 5,981 SEK (PIX) 0.29 SEK/kWh Reference - spot rate 31 Mar SEK/USD 8.34 SEK/EUR 5,454 SEK (PIX) 0.36 SEK/kWh The table above shows the market values of all hedging. The value refers to the liquidation value; i.e. a valuation is made in accordance with forward contracts on 31 March The reference value refers to the spot rate on 31 March and is provided as supplementary information. As a result of the application of IFRS/IAS, these market values are reflected in the balance sheet and in some cases in the income statement, but are also shown here as supplementary information. ROTTNEROS QUARTERLY REPORT JANUARY-MARCH

6 ACCOUNTING POLICIES This interim report has been prepared in accordance with IAS 34 Interim Financial Reporting, which complies with Swedish law through the application of the Swedish Financial Reporting Board s Recommendation RFR 1 Supplementary Accounting Rules for Groups together with RFR 2 Accounting for Legal Entities, in respect of the parent company. The accounting policies, definitions of key ratios and calculation methods are the same as those used in the last annual report. FORTHCOMING FINANCIAL INFORMATION 23 July 2014 Interim Report, January-June October 2014 Interim Report, January-September 2014 For more information, please visit Rottneros updated website, Stockholm, 25 April 2014 Carl-Johan Jonsson President and CEO This report has not been reviewed by the company s auditors. Rottneros discloses the information provided herein pursuant to the Securities Markets Act and/or the Financial Instruments Trading Act. This information was submitted for publication on 25 April 2014 at A Swedish and an English version of this report have been drawn up. The Swedish version shall prevail in the event of differences between the two reports. Rottneros AB (publ) Corp. ID no Box 144, SE Söderhamn Tel , fax ROTTNEROS QUARTERLY REPORT JANUARY-MARCH

7 DEFINITIONS OF KEY RATIOS Equity/assets ratio Shareholders equity as a percentage of the balance sheet total. Interest-bearing net assets/liabilities Liquid assets minus interest-bearing liabilities. Debt/equity ratio Interest-bearing net assets/liabilities divided by shareholders equity. Operating margin Operating profit after depreciation as a percentage of net turnover for the period. Profit margin Profit after net financial items as a percentage of net turnover for the period. Net income Net income is the profit/loss after tax. Earnings per share Net profit/loss divided by the average number of shares. Return on capital employed Profit after net financial items plus interest expense for the past twelve-month period divided by the average capital employed for the period in question. Capital employed Balance sheet total less non-interest-bearing operating liabilities including deferred tax liabilities. Return on equity Net income for the past twelve-month period as a percentage of average shareholders' equity for the period in question. Interest coverage ratio Profit/loss after net financial items plus interest expense, divided by interest expense. P/E ratio Share price at the end of the period in relation to earnings per share after tax. Direct yield Dividend as a percentage of the share price at the end of the period. Operating cash flow/share Cash flow from operating activities and normal investments divided by the number of shares. Cash flow before investments/share Cash flow from operating activities divided by the number of shares. GLOSSARY Glossary BEK Bleached Eucalyptus Kraft, bleached eucalyptus pulp Mechanical pulp Chemical pulp CTMP ECF Groundwood pulp (SGP) Paper pulp produced by cooking raw timber together with chemicals. Has higher brightness and strength than mechanical pulp. Chemi Thermo Mechanical Pulp. Development of TMP, where the raw material is impregnated with chemicals. Stronger than TMP. Elementary Chlorine Free. Sulphate pulp bleached using chlorine dioxide only. Mechanical pulp based on roundwood as a raw material. NBSK TMP UKP Pulp produced using a mechanical process for fibre separation and processing. Has a higher level of bulk, stiffness and opacity than chemical pulp. Northern Bleached Softwood Kraft: bleached long-fibre sulphate pulp. The leading indicator of world market prices. Thermo Mechanical Pulp. Mechanical pulp produced using a technique in which the chips are preheated with steam. Unbleached Kraft Pulp, unbleached sulphate pulp ROTTNEROS QUARTERLY REPORT JANUARY-MARCH

8 GROUP PROFIT/LOSS CONSOLIDATED PROFIT/LOSS ACCOUNTS (SEK MILLION) Jan-Mar 2014 Jan-Mar 2013 Full year 2013 Net turnover ,389 Change in inventories, finished goods Other income TOTAL INCOME ,438 Raw materials and consumables Other costs Personnel costs Depreciation/amortisation and write-downs TOTAL OPERATING COSTS ,592 OPERATING INCOME Financial income Financial expenses Net financial items INCOME AFTER NET FINANCIAL ITEMS Tax on income for the year NET PROFIT/LOSS AFTER TAX Earnings after tax/share (SEK) Profit after tax per share, after dilution, is the same as the profit after tax per share. CONSOLIDATED STATEMENT OF COMPREHENSIVE INCOME (SEK MILLION) Jan-Mar 2014 Jan-Mar 2013 Full year 2013 NET PROFIT/LOSS AFTER TAX Other comprehensive income Cash-flow hedging, income before tax Cash-flow hedging, tax effect Exchange rate differences TOTAL OTHER COMPREHENSIVE INCOME TOTAL COMPREHENSIVE INCOME FOR THE PERIOD KEY INDICATORS THAT AFFECT TURNOVER Pulp price NBSK, USD SEK/USD Pulp price NBSK, SEK 5,919 5,295 5,582 Rottneros' deliveries, tonnes 87,200 85, ,100 1 Source: PIX/Market Pulse. 2 Source: Swedish central bank yearly average. ROTTNEROS QUARTERLY REPORT JANUARY-MARCH
 1 0.10-0.03-1.04 1 Profit after tax per share, after dilution, is the same as the profit after tax per share.")
9 GROUP BALANCE SHEET CONSOLIDATED BALANCE SHEET (SEK MILLION) Mar 2014 Mar 2013 Dec 2013 Intangible fixed assets Tangible fixed assets Financial fixed assets Total fixed assets Inventories Current receivables Liquid funds Total current assets TOTAL ASSETS 1,151 1,328 1,161 Shareholders' equity Longterm liabilities Non interest-bearing Total longterm liabilities Current liabilities Interest-bearing Non interest-bearing Total current liabilities TOTAL SHAREHOLDERS' EQUITY AND LIABILITIES 1,151 1,328 1,161 GROUP CASH FLOW CASH-FLOW ANALYSIS (SEK MILLION) Jan-Mar 2014 Jan-Mar 2013 Full year 2013 Operating income Adjustment for non cash-flow items Depreciation/amortisation and write-downs Received/paid financial items Received/paid taxes Cash-flow from current operations before change in working capital Change in working capital Cash-flow from current operations Acquisition of fixed assets Cash-flow from investing activities Repayment of loans Cash-flow from financing activities Cash-flow for the year Liquid funds at beginning of year Cash-flow for the year Liquid funds at end of year ROTTNEROS QUARTERLY REPORT JANUARY-MARCH
 Jan-Mar 2014 Jan-Mar 2013 Full year 2013 Operating income 21-6 -154 Adjustment for")
10 CHANGE IN SHAREHOLDERS' EQUITY (SEK MILLION) Jan-Mar 2014 Jan-Mar 2013 Full year 2013 Opening shareholders' equity Total comprehensive income for the period Dividend Closing shareholders' equity SHARE DATA¹ Jan-Mar 2014 Jan-Mar Shares, opening 2 No. 152, , , , ,572 1,525, , ,212 Shares issued 2 No ,345,507 - No. of company's own shares bought back 2 No ,373, Shares closing 2 No. 152, , , , , ,572 1,525, ,212 Average number of shares 2 No. 152, , , , , ,572 26,884 18,021 Operating profit or loss/share 2,5 SEK Earnings after tax/share 5 SEK Operating cash flow/share 3,5 SEK Equity/share 5 SEK Dividend 5 SEK Dividend/equity/share % Share price at end of period 5 SEK Share price/equity/share Times P/E ratio/share Times 20.2 Neg Neg Neg Neg 5.3 Neg Neg Direct yield 4 % ¹ No key ratios were influenced by any dilution effect. ² The number of shares is stated in thousands, excluding treasury shares held by Rottneros. ³ Cash-flow after normal investments but excluding strategic investments. 4 Direct yield is calculated in relation to the closing listed price. 5 There was a reverse share split in April 2010, where ten existing shares were combined into one share. The comparison periods have been adjusted for this reverse split.. ROTTNEROS QUARTERLY REPORT JANUARY-MARCH

11 QUARTERLY DATA (SEK MILLION) I IV III II I IV III II I Net turnover Operating profit/loss before depreciation Depreciation/amortisation and write-downs Operating profit/loss Net financial items Profit/loss after financial items Tax Profit/loss after tax Pulp production, 1,000 tonnes Pulp deliveries, 1,000 tonnes Operating margin, % 5.7 Neg Neg Neg Neg 0.3 Neg 9.7 Neg Return on equity after full tax, % 1.9 Neg Neg Neg Neg Neg Neg Neg Neg Return on capital employed, % 1.5 Neg Neg Neg Neg Neg Neg Equity/assets ratio, % Equity/share, SEK Earnings after tax/share, SEK Cash flow before investments/share, SEK Operating cash flow/share, SEK ROTTNEROS QUARTERLY REPORT JANUARY-MARCH

12 PARENT PROFIT/LOSS PARENT COMPANY PROFIT/LOSS ACCOUNTS (SEK MILLION) Jan-Mar 2014 Jan-Mar 2013 Full year 2013 Net turnover Other income TOTAL INCOME Other costs Personnel costs TOTAL OPERATING COSTS OPERATING INCOME Profit from participations in group companies -45 Financial income, other Financial expenses, other Net financial items INCOME AFTER NET FINANCIAL ITEMS Tax on income for the year NET PROFIT/LOSS AFTER TAX PARENT COMPANY STATEMENT OF COMPREHENSIVE INCOME (SEK MILLION) Jan-Mar 2014 Jan-Mar 2013 Full year 2013 NET PROFIT/LOSS AFTER TAX Other comprehensive income TOTAL COMPREHENSIVE INCOME FOR THE PERIODTOTALRESULTAT FÖR PERIODEN PARENT BALANCE SHEET PARENT COMPANY BALANCE SHEET (SEK MILLION) Mar 2014 Mar 2013 Dec 2013 Intangible fixed assets Tangible fixed assets Financial fixed assets Total fixed assets Current receivables Liquid funds Total current assets TOTAL ASSETS 948 1, Shareholders' equity Current liabilities Interest-bearing Non interest-bearing Total current liabilities TOTAL SHAREHOLDERS' EQUITY AND LIABILITIES 948 1, Including receivable on subsidiaries SEK 681 (542) Million. ROTTNEROS QUARTERLY REPORT JANUARY-MARCH

13 GROUP REVIEW SIX YEAR REVIEW KEY INDICATORS THAT AFFECT TURNOVER Jan-mar 2014 Jan-mar Pulp price NBSK, USD SEK/USD Pulp price NBSK, SEK 5,919 5,295 5,582 5,519 6,229 6,705 4,989 Rottneros' deliveries, tonnes 87,200 85, , , , , ,700 Turnover and income, SEK million Net turnover ,389 1,437 1,513 1,684 1,508 Profit/loss before depreciation Depreciation Operating profit/loss after depreciation Net financial items Profit/loss after net financial items Profit/loss after tax Balance sheet items, SEK million Fixed assets Inventories Current receivables Liquid funds Shareholders' equity ,014 1,228 1,089 Long-term interest-bearing liabilities Long-term non interest-bearing liabilities Current interest-bearing liabilities Current non interest-bearing liabilities Balance sheet total 1,151 1,328 1,161 1,294 1,347 1,494 1,405 Finaical ratios Operating margin, % 5.5 neg neg Profit margin, % 5.3 neg neg Return on capital employed, % 10.4 neg Neg - Neg 11.6 Neg Return on equity after full tax, % 1.9 neg Neg Neg Neg 10.8 Neg Equity/assets ratio, % Debt/equity ratio, Times Interest cover, Times 20 Neg Neg 2.2 Neg 26 Neg Other Capital expenditure, SEK m Average no. of employees ¹ Source: FOEX NBSK PIX. ² Source: Swedish central bank yearly average. ROTTNEROS QUARTERLY REPORT JANUARY-MARCH

14 ROTTNEROS QUARTERLY REPORT JANUARY-MARCH

15 ROTTNEROS QUARTERLY REPORT JANUARY-MARCH
16 Rottneros, a company that was originally established in the 17 th century, is an independent and flexible supplier of customised paper pulp of high quality. Rottneros has been able to adapt in order to meet high customer expectations by continually developing its products and maintaining high levels of delivery reliability, technical support and service. Rottneros has an annual total production capacity of almost 400,000 tonnes of pulp at two mills in Sweden. Increasingly intensive product development in line with the requirements of customers will result in profitability that is higher and more stable throughout the business cycle. Rottneros AB (publ) Vallviks Bruk AB Vallvik Visiting address: Vallviks Bruk, Vallvik Telephone , fax

ROTTNEROS. Jan-Mar 2014
 ROTTNEROS INTERIM REPORT (JANUARY-JUNE ) Period in review Jan-Mar change change change Net turnover, SEK m 394 380 13 369 24 773 723 50 Operating Income, SEK m 31 21 10-16 47 53-22 75 including items affecting
Interim Report January June 2001
 556025-5001 31 July 2001 Interim Report January June 2001 Quarter January-June MSEK 2001 II 2001 I 2000 II 2001 2000 Net turnover, MSEK 1,742 1,840 1,612 3,582 3,200 Operating profit, MSEK 319 469 290
Increasing market share in a receding market
 Interim report for the first quarter of the financial year 2008/2009 Increasing market share in a receding market First quarter (September November 2008) KappAhl s net sales (excluding VAT) for the period
Howellust
 Year-end report 1 January 31 December 2013 Net sales rose to SEK 479.4 M (433.8), up approximately 12%.* Order bookings totalled SEK 460.5 M (447.6), up about 4%.* Operating profit amounted to SEK 48.0
EVENTS AFTER THE END OF THE PERIOD
 BE Q1 Interim report BE Group AB (publ) January March 2015 Malmö, April 28, 2015 FIRST QUARTER 2015 Net sales rose by 2 percent compared with the year-earlier period, amounting to SEK 1,104 M (1,083).
Interim Report. Interim Report. 1 January 30 June 2005
 Interim Report SVENSKA CELLULOSA AKTIEBOLAGET SCA (publ) Communications and Investor Relations Box 7827, 103 97 Stockholm, Sweden Tel +46 8 788 51 00, Fax +46 8 660 74 30 www.sca.com Reg.No. 556012-6293
Interim Report for the period 1 January 31 March 2015
 Interim Report for the period 1 January 31 March 2015 ALL FIGURES IN THIS REPORT ARE EXPRESSED IN SEK, UNLESS STATED OTHERWISE. FIGURES IN PARENTHESES REFER TO THE CORRESPONDING FIGURES FOR THE PREVIOUS
July September 2013. July September 2014
 Interim Report Interim Report Sales in the quarter increased to SEK 225.1 (216.9) million. In local currencies the decrease was 1.1 per cent. Operating profit for the quarter was SEK 12.9 (5.7) million.
Year-end report. President s comments. The fourth quarter. January - December
 Year-end report The fourth quarter > > Net sales increased by 17 percent during the fourth quarter to SEK 1,758 M (1,504). In local currencies, net sales increased by 7 percent > > Operating profit increased
Interim Report January 1 st March 31 st, 2003
 Interim Report January 1 st March 31 st, 2003 First Quarter 2003 Earnings before taxes increased by 23 per cent to 70 MSEK. Earnings after taxes increased by 36 per cent to 45 MSEK. Earnings per share
BROSTRÖM AB (publ) Reg No 556005-1467
 Reg No 556005-1467") Broström is one of the leading logistics companies for the oil and chemical industry, focusing on industrial product and chemical tanker shipping and marine services. Broström is based all over the world
Broström is one of the leading logistics companies for the oil and chemical industry, focusing on industrial product and chemical tanker shipping and marine services. Broström is based all over the world
Net sales increased with 16% to SEK 76.1 m (65.6). Net sales for the last four quarters totalled SEK 255.0 m (306.6)
. Net sales for the last four quarters totalled SEK 255.0 m (306.6)") HMS Networks AB (publ) Interim report January-March 2010 First quarter 2010 Net sales increased with 16% to SEK 76.1 m (65.6). Net sales for the last four quarters totalled SEK 255.0 m (306.6) Operating
HMS Networks AB (publ) Interim report January-March 2010 First quarter 2010 Net sales increased with 16% to SEK 76.1 m (65.6). Net sales for the last four quarters totalled SEK 255.0 m (306.6) Operating
INTERIM REPORT, JANUARY-MARCH 2003 5 th May 2003
 Boliden reports an improved profit after financial items. The profit totalled SEK 54 million for the first quarter of 2003, compared to SEK 17 million for the first quarter of 2002. The cash flow for the
INTERIM REPORT JANUARY 1 JUNE 30, 2010
 INTERIM REPORT JANUARY 1 JUNE 3, 21 April to June quarter totalled 334.6 (324.2) The operating profit/loss was.7 (4.9) The profit/loss before tax was.6 (5.6) The profit/loss after tax was.2 (3.9), corresponding
FINANCIAL RESULTS FOR THE PERIOD 1 JANUARY 31 MARCH 2003
 FINANCIAL RESULTS FOR THE PERIOD 1 JANUARY 31 MARCH 2003 The consolidated income after financial items amounted to SEK 75.3 (3.3) million for the period, including capital gain of SEK 90.6 (30.8) million.
Interim Report 1 January 31 March Volvofinans Bank AB
 Interim Report 1 January 31 March Volvofinans Bank AB Message from the President January March highlights Pre-tax profit SEK 75.7 million (58.7) Return on equity 7.5% (5.8) Lending at 31 March of SEK 23.9
INTERIM REPORT Q2 2013
 INTERIM REPORT Q2 2013 April June 2013 Betting turnover: 127,865 KEUR (170,589) Net turnover after trading fees: 502 KEUR (842) Gross margin: 0.39% (0.49) 1 Operating income: -255 KEUR (3) Operating margin:
Orc Software AB Interim report January 1 March 31, 2005
 Orc Software AB Interim report January 1 March 31, 2005 Revenue for January-March 2005 increased by 2 percent compared to the equivalent period in the previous year and amounted to SEK 66 (65) million.
Interim report. January-March 2015. President s comments. The first quarter
 Interim report January-March The first quarter > > Net sales increased by 20 percent during the first quarter to SEK 1,354 M (1,129). In local currencies, net sales increased by 2 percent > > Operating
Resco AB (publ) Interim Report January - March 2003
 Interim Report January - March 2003") Resco AB (publ) Interim Report January - March 2003 Total sales for the first quarter 2003 amounted to SEK 63 million (88), representing a decline of 28 percent. Pro forma 1, sales increased by 1 percent.
Resco AB (publ) Interim Report January - March 2003 Total sales for the first quarter 2003 amounted to SEK 63 million (88), representing a decline of 28 percent. Pro forma 1, sales increased by 1 percent.
Growth in the business area Fingerprint Technology
 LUND, MAY 12 th, 2015 Growth in the business area Fingerprint Technology PRECISE BIOMETRICS AB (PUBL), CORPORATE IDENTIYTY NR 556545-6596 INTERIM REPORT JANUARY-MARCH 2015 The group s net sales for the
Year-end Report January December 2003
 Year-end Report January December 2003 Anoto Group reported decreased sales by 13 per cent to SEK 192M (221), of which SEK 41M (96) in the fourth quarter. The decreased sales are attributable to C Technologies.
Interim Report for the period 1 January 30 September 2015. Revenue in the third quarter increased by 24 per cent
 Interim Report for the period 1 January 30 September 2015 ALL FIGURES IN THIS REPORT ARE EXPRESSED IN SEK, UNLESS STATED OTHERWISE. FIGURES IN PARENTHESES REFER TO THE CORRESPONDING PERIOD FOR THE PREVIOUS
PONSSE PLC, STOCK EXCHANGE RELEASE, 26 OCTOBER 2010, 9:00 a.m. PONSSE S INTERIM REPORT FOR 1 JANUARY 30 SEPTEMBER 2010
 PONSSE PLC, STOCK EXCHANGE RELEASE, 26 OCTOBER 2010, 9:00 a.m. PONSSE S INTERIM REPORT FOR 1 JANUARY 30 SEPTEMBER 2010 - Net sales were EUR 171.8 (Q1-Q3/2009 EUR 98.9) million. - Q3 net sales were EUR
Year-end report for the period 1 January 31 December 2015. Revenue in the fourth quarter increased by 28 per cent
 Year-end report for the period 1 January 31 December 2015 ALL FIGURES IN THIS REPORT ARE EXPRESSED IN SEK, UNLESS STATED OTHERWISE. FIGURES IN PARENTHESES REFER TO THE CORRESPONDING PERIOD FOR THE PREVIOUS
INTERIM REPORT JANUARY 1 SEPTEMBER 30, 2011
 Q3 INTERIM REPORT JANUARY 1 SEPTEMBER 30, 2011 Helsinki, October 27, 2011 Fiskars Corporation Interim Report January 1 - September 30, 2011 October 27, 2011 Third quarter: Net sales and operating profit
Interim report January March 2009
 14 May, 2009 Interim report January March 2009 STRONG FIRST QUARTER EBIT INCREASED BY 20 PER CENT Revenues increased by 19 per cent to SEK 744 M (626). EBIT increased by 20 per cent to SEK 57 M (48) and
How To Profit From A Strong Dollar
 For Immediate Release MERCER INTERNATIONAL INC. REPORTS STRONG 2015 THIRD QUARTER RESULTS ANNOUNCES QUARTERLY CASH DIVIDEND OF $0.115 NEW YORK, NY, October 29, 2015 - Mercer International Inc. (Nasdaq:
Trig Social Media AB (publ) Corporate Identity Number: 556788-2807. Three Months Report. January 1 March 31, 2015
 Corporate Identity Number: 556788-2807. Three Months Report. January 1 March 31, 2015") EN Trig Social Media AB (publ) Corporate Identity Number: 556788-2807 Three Months Report January 1 March 31, 2015 First Quarter, January - March 2015 Net sales amounted to 26 337 Euro Operating loss amounted
EN Trig Social Media AB (publ) Corporate Identity Number: 556788-2807 Three Months Report January 1 March 31, 2015 First Quarter, January - March 2015 Net sales amounted to 26 337 Euro Operating loss amounted
Investment AB Kinnevik
 Investment AB Kinnevik Skeppsbron 18 P.O. Box 2094 SE-103 13 Stockholm Sweden www.kinnevik.se (Publ) Reg no 556047-9742 Phone +46 8 562 000 00 Fax +46 8 20 37 74 INTERIM REPORT 1 JANUARY-31 MARCH Highlights
Interim report for the period April 1 December 31, 2001 (9 months)
") Addtech Group Interim report for the period April 1 December 31, (9 months) Net revenues amounted to MSEK 1 793 (1 784). Operating income, not including items affecting comparability, amounted to MSEK
Addtech Group Interim report for the period April 1 December 31, (9 months) Net revenues amounted to MSEK 1 793 (1 784). Operating income, not including items affecting comparability, amounted to MSEK
SEMI-ANNUAL REPORT, JANUARY 1 JUNE 30, 2009
 SEMI-ANNUAL REPORT, JANUARY 1 JUNE 30, 2009 1 Second quarter, April - June 2009 Net sales amounted to 401 652 Euro Operating loss amounted to 392 417 Euro Earnings after taxes amounted to 554 802 Euro
THREE MONTH REPORT, JANUARY 1 MARCH 31, 2014
 THREE MONTH REPORT, JANUARY 1 MARCH 31, 2014-1 - First Quarter, January March 2014 Net sales amounted to 0 Euro (0) Operating profit/loss amounted to -42 007 Euro (-12 094) Net profit/loss for the period
Studsvik AB (publ) Interim Report, January September 2002
 Interim Report, January September 2002") PRESS RELEASE 1 (11) Studsvik AB (publ) Interim Report, January September 2002 Studsvik s net sales increased by 13 per cent to SEK 743.2 million (656.4). The result before tax improved considerably during
PRESS RELEASE 1 (11) Studsvik AB (publ) Interim Report, January September 2002 Studsvik s net sales increased by 13 per cent to SEK 743.2 million (656.4). The result before tax improved considerably during
Interim report January 1 March 31, 2014
 Odd Molly International AB (publ) Stockholm, Sweden, April 29, 2014 Interim report January 1 March 31, 2014 More stores and new sales organization January 1 March 31, 2014 Net sales amounted to SEK 82.8
Smartphone with Precise BioMatch Mobile launched by leading vendor
 Page 1 of 16 Smartphone with Precise BioMatch Mobile launched by leading vendor PRECISE BIOMETRICS AB (PUBL), CORPORATE IDENTITY NO. 556545-6596 INTERIM REPORT FOR THE PERIOD JANUARY SEPTEMBER 2014 The
Metsä Board Metsä Board
 Metsä Board Financial 215 Financial statements statements review review 215 Highlights in 215 Paperboard delivery volumes increased by 12% compared to 214 Operating profit improved 32% Strong operating
Condensed consolidated income statement
 RESTATED AND PREVIOUSLY COMMUNICATED (OLD) QUARTERLY INFORMATION FOR Fortum signed the agreement to sell its Swedish distribution business on 13 March 2015, which concludes Fortum s divestment of its electricity
Total comprehensive income/loss N/A N/A N/A -46 69 23 67 28 95-2 -15-17 -639-85 -724
 Effects of amendments to IAS 19 Employee Benefits Up until 31 December, Nobia applied the corridor method when recognising the Group's pension liabilities. The updated standard, IAS 19 Employee Benefits,
ZetaDisplay. Europe leads the way. EPaccess
 EPaccess Media Sweden 22 November 213 Equity Research +46 8 463 8 analys@penser.se ZetaDisplay Europe leads the way Risk and Return Potential Return Potential Risk High High Risk Current Price 4,8 High/Low
Carnegie Investment Bank AB (publ) Year-end report
 Year-end report") Carnegie Investment Bank AB (publ) (Corp. reg. no. 516406-0138) Year-end report 1 January 31 December 2009 Carnegie Investment Bank AB (publ) is a leading independent investment bank with Nordic focus.
Carnegie Investment Bank AB (publ) (Corp. reg. no. 516406-0138) Year-end report 1 January 31 December 2009 Carnegie Investment Bank AB (publ) is a leading independent investment bank with Nordic focus.
PRESIDENT AND CEO ERIK STRAND S COMMENTS ON POOLIA S THIRD QUARTER. Press information, November 5
 PRESIDENT AND CEO ERIK STRAND S COMMENTS ON POOLIA S THIRD QUARTER Press information, November 5 Poolia AB Poolia halved its rate of losses compared with the year-earlier period. The improved operating
Order bookings 48,719 55,565-12 12,835 14,845 Sales 48,331 56,492-14 13,166 17,076
 28 January, 2002 SCANIA YEAR-END REPORT JANUARY - DECEMBER 2001 After the unsatisfactory 2001, our measures to adjust production to lower global demand, structural changes related to cab production and
CONSOLIDATED STATEMENT OF INCOME
 CONSOLIDATED STATEMENT OF INCOME 4 th quarter (a) 3 rd quarter 4 th quarter 2009 Sales 40,157 40,180 36,228 Excise taxes (4,397) (4,952) (4,933) Revenues from sales 35,760 35,228 31,295 Purchases, net
Scania Interim Report, January-September 2011
 21 October 2011 Scania Interim Report, January-September 2011 Summary of the first nine months of 2011 Operating income rose to SEK 9,657 m. (9,021), and earnings per share rose to SEK 9.11 (7.63) Net
Auriant Mining AB (publ)
") Auriant Mining AB (publ) Interim report for the period from January March Highlights: Total gold production in the first quarter was 84 kg (2,699 oz) which was the same as in Q1 : 84 kg (2,690 oz). Consolidated
Auriant Mining AB (publ) Interim report for the period from January March Highlights: Total gold production in the first quarter was 84 kg (2,699 oz) which was the same as in Q1 : 84 kg (2,690 oz). Consolidated
Release no. 04 2014 Report on first quarter 2014 To NASDAQ OMX Nordic Exchange Copenhagen A/S
 Page 1/10 22 May 2014 for ROCKWOOL International A/S Today the Board of ROCKWOOL International A/S has discussed and approved the following report on first quarter 2014. Highlights Sales in first quarter
Weak 2003 positive outlook for 2004
 Teleca AB (publ) Year-end Report, January - December, 2003 Weak 2003 positive outlook for 2004 Sales increased 17% to SEK 2,456 M (2,090). International sales corresponded to 48% of total sales Earnings
Interim report January-March 2016
 Quality through specialisation Interim report January-March Good development in key areas First phase in United Arab Emirates ongoing and proceeding according to plan Improving results for GHP Vårdsamverkan
INTERIM REPORT JANUARY-JUNE 2014 CHRONTECH PHARMA
 ChronTech has developed and further develops a patent pending new type of injection needle for a more effective uptake of genetic vaccines (IVIN) and vaccine and therapy for hepatitis D. The ChronTech
In addition, Outokumpu has adopted the following amended standards as of January 1, 2009:
 1. Corporate information Outokumpu Oyj is a Finnish public limited liability company organised under the laws of Finland and domiciled in Espoo. The parent company, Outokumpu Oyj, has been listed on the
Interim report January-December 2015
 (All figures in brackets refer to the corresponding period in 2014 and Hygena is recognised as a discontinued operation, refer to page 7.) October-December 2015 Net sales excluding items affecting comparability
COLUMNA FASTIGHETER AB (publ) HALF-YEARLY REPORT TO 30 JUNE 2000 THE GROUP
 HALF-YEARLY REPORT TO 30 JUNE 2000 THE GROUP") COLUMNA FASTIGHETER AB (publ) HALF-YEARLY REPORT TO 30 JUNE 2000 THE GROUP Principal activities Columna Fastigheter is a property development company operating in the European real estate market. The company
COLUMNA FASTIGHETER AB (publ) HALF-YEARLY REPORT TO 30 JUNE 2000 THE GROUP Principal activities Columna Fastigheter is a property development company operating in the European real estate market. The company
Interim report April-June 2003
 Interim report April-June 2003 Pre-tax profit for the second quarter amounted to SEK -34m, which is a SEK 30m improvement compared to last year (SEK -64m). Software revenue grew by 5% during the second
ELEKTA AB (publ) Interim report for the three months ended July 31, 2001
 Interim report for the three months ended July 31, 2001") ELEKTA AB (publ) Interim report for the three months ended July 31, 21 Operating profit was improved by SEK 5 M to SEK 33 M (loss: 17) and the operating margin increased to 6 percent (neg: 4). Strong order
ELEKTA AB (publ) Interim report for the three months ended July 31, 21 Operating profit was improved by SEK 5 M to SEK 33 M (loss: 17) and the operating margin increased to 6 percent (neg: 4). Strong order
Year ended 31 Dec 2009
 PACE PLC CHANGE OF FUNCTIONAL AND PRESENTATIONAL CURRENCY AND COMPARATIVES RE-PRESENTED IN US DOLLARS Introduction Pace announced at the time of its preliminary results announcement that the Board had
FINANCIAL REPORT H1 2014
 FINANCIAL REPORT H1 2014 HIGH SPEED BY PASSION 02_Key Figures 03_Group Status Report 05_Consolidated Financial Statements 10_Notes 11_Declaration of the Legal Representatives 02 PANKL KEY FIGURES EARNING
Composition of net asset value SEK billion SEK per share 2003 2003 2002 2003 2003 2002 Parent company Aug. 4 June 30 Dec. 31 Aug. 4 June 30 Dec.
 Interim Report January 1 - June 30, 2003 Industrivärden s net asset value was SEK 27,682 M on August 4, an increase of SEK 3,267 M since year-end 2002. On June 30 the net asset value was SEK 25,642 M (29,645).
An income statement and statement of comprehensive income (continued)
") FIRST RESOURCES LIMITED Unaudited Financial Statements for the Third Quarter ( 3Q ) and Nine Months ( 9M ) Ended 30 September 2015 1(a) An income statement and statement of comprehensive income or a statement
FIRST RESOURCES LIMITED Unaudited Financial Statements for the Third Quarter ( 3Q ) and Nine Months ( 9M ) Ended 30 September 2015 1(a) An income statement and statement of comprehensive income or a statement
Aalberts Industries Net profit and earnings per share +15%
 PRESS RELEASE 1 ST HALF YEAR 2015 Aalberts Industries Net profit and earnings per share +15% Langbroek, 13 August 2015 Highlights o Revenue EUR 1,244 million, increase +18% (organic +2%). o Operating profit
Notice convening the Annual General Meeting of Rottneros AB on 19 April 2011
 PRESS RELEASE Rottneros AB (publ) Box 70 370, SE-107 24 Stockholm, Sweden Tel +46 8 590 010 00 www.rottneros.com Stockholm, 16 March 2011 Notice convening the Annual General Meeting of Rottneros AB on
Annual report for the financial year 2014-05-28-2014-12-31
 1 PZU Finance AB (publ) Org nr Office translation Annual report for the financial year 2014-05-28-2014-12-31 The Board of Directors presents the following annual report Contents Page - Administration Report
Q4 2003. Outlook. Getinge Group Financial Statement 2003
 Getinge Group Financial Statement 2003 Orders received totalled SEK 9,153.8 million (8,772.9) Net sales rose to SEK 9,160.2 million (8,640.1) Profit before tax climbed by 25 % to SEK 1,095.4 million (875.6)
Glossary and Formulas
 A-B Accounts Payable Includes, but is not limited to, Trade Accounts Payable and Trade Acceptances, that is, amounts owed to vendors for goods and services purchased from outside suppliers and due within
An overview of FX Exposure Risk: Assessment and Management
 An overview of FX Exposure Risk: Assessment and Management June 2015 1. Introduction This report presents an overview of various types of foreign currency exposure, their impact on the financial statements,
ACADIAN TIMBER CORP. REPORTS FOURTH QUARTER AND YEAR-END RESULTS
 News Release Investors, analysts and other interested parties can access Acadian Timber Corp. s 2015 Fourth Quarter Results conference call via webcast on Thursday, February 11, 2016 at 1:00 p.m. ET at
INTERIM REPORT Q3 2013
 INTERIM REPORT Q3 2013 July - September 2013 Betting turnover: 132,779 KEUR (159,829) Net turnover after trading fees: -173 KEUR (802) Gross margin: -0.13% (0.50) 1 Operating income: -1,105 KEUR (-34)
Significant reduction in net loss
 press release 12 May 2015 Royal Imtech publishes first quarter 2015 results Significant reduction in net loss Order intake in Q1 at a satisfactorily level of 912 million Revenue 3% down excluding Germany
Average annual change, % Change, % Five years, Ten years Jan. 1-Aug.2 Aug. 00-Aug. 05 Aug. 95-Aug. 05
 Interim Report January 1 June 30, 2005 Industrivärden s net asset value was SEK 41,171 M on August 2, 2005, compared with SEK 36,563 M at the start of the year, entailing an increase of SEK 4,608 M for
PRESS RELEASE FROM SCRIBONA AB (publ), corp. reg. no. 556079-1419. Interim report January September 2004 for the Scribona Group
, corp. reg. no. 556079-1419. Interim report January September 2004 for the Scribona Group") PRESS RELEASE FROM SCRIBONA AB (publ), corp. reg. no. 556079-1419 October 20, 2004 Interim report January September 2004 for the Scribona Group Third quarter sales reached MSEK 2,308 (2,357). Sales for
PRESS RELEASE FROM SCRIBONA AB (publ), corp. reg. no. 556079-1419 October 20, 2004 Interim report January September 2004 for the Scribona Group Third quarter sales reached MSEK 2,308 (2,357). Sales for
Overview of Business Results for the 2nd Quarter of Fiscal Year Ending March 31, 2012 (2Q FY2011)
") November 8, 2011 Overview of Business Results for the 2nd Quarter of Fiscal Year Ending March 31, 2012 () Name of the company: Iwatani Corporation Share traded: TSE, OSE, and NSE first sections Company
November 8, 2011 Overview of Business Results for the 2nd Quarter of Fiscal Year Ending March 31, 2012 () Name of the company: Iwatani Corporation Share traded: TSE, OSE, and NSE first sections Company
Reece Australia Limited (ABN 49 004 313 133) and controlled entities Financial Information
 and controlled entities Financial Information") Reece Australia Limited (ABN 49 004 313 133) and controlled entities Financial Information FOR THE YEAR ENDED 30 JUNE PROVIDED TO THE ASX UNDER LISTING RULE 4.3A Reece Australia Limited (ABN 49 004 313
Reece Australia Limited (ABN 49 004 313 133) and controlled entities Financial Information FOR THE YEAR ENDED 30 JUNE PROVIDED TO THE ASX UNDER LISTING RULE 4.3A Reece Australia Limited (ABN 49 004 313
Our brands and our businesses outside the UK continue to perform well and we are determined to create a stronger foundation for profitable growth.
 3 August 2011 Thomas Cook Group plc Interim Management Statement Underlying operating profit was 20.1m for the three months to 30 June 2011 (2010: 25.8m). Group results impacted by weak performance in
Interim Report For the period January March 2010 May 3, 2010
 Interim Report For the period January March 2010 May 3, 2010 The report period in brief Ålandsbanken Sverige AB was consolidated for the first time on March 31,, which means that the company s balance
1 HALF-YEAR REPORT 1 JANUARY 30 JUNE, 2008
 1 HALF-YEAR REPORT 1 JANUARY 30 JUNE, 2008 Contents High lights of the first 6 months 2008 3 Letter to Shareholders 4 Management and Board of directors 5 Selected consolidated financial data 6 Reinhold
Exchange Rate History, Including Profit and Loss
 INTERIM REPORT FIRST QUARTER 215 PRESS RELEASE 27 APRIL 215 Q1 SANDVIK INTERIM REPORT 215 EARNINGS GROWTH AND STRONG CASH FLOW CEO S COMMENT: In the first quarter adjusted earnings increased by 18% year-on-year,
Note 2 SIGNIFICANT ACCOUNTING
 Note 2 SIGNIFICANT ACCOUNTING POLICIES BASIS FOR THE PREPARATION OF THE FINANCIAL STATEMENTS The consolidated financial statements have been prepared in accordance with International Financial Reporting
SIGNIFICANT GROUP ACCOUNTING POLICIES
 SIGNIFICANT GROUP ACCOUNTING POLICIES Basis of consolidation Subsidiaries Subsidiaries are all entities over which the Group has the sole right to exercise control over the operations and govern the financial
First quarter of 2015 (Q1 2014) Events during the first quarter of 2015. Summary of the first quarter
 Events during the first quarter of 2015. Summary of the first quarter") Interim Report January March 2015 Evolution Gaming Group AB (publ) First quarter of 2015 (Q1 2014) Revenues increased by 43% to EUR 15.4 million (10.8) Profit for the period amounted to EUR 1.4 million
Interim Report January March 2015 Evolution Gaming Group AB (publ) First quarter of 2015 (Q1 2014) Revenues increased by 43% to EUR 15.4 million (10.8) Profit for the period amounted to EUR 1.4 million
Year-end Report January 1 st December 31 st, 2003
 Fourth Quarter 2003 Year-end Report January 1 st December 31 st, 2003 Net sales were 1 826 MSEK (1 931). Using fixed exchange rates and a comparable group structure, net sales increased by 1 per cent.
ADVANCED SYSTEMS AUTOMATION LIMITED (Company Registration No: 198600740M) (Incorporated in the Republic of Singapore)
 (Incorporated in the Republic of Singapore)") Financial Statements and Related Announcement::Second Quarter and/ or Half Yearly... http://infopub.sgx.com/apps?a=cow_corpannouncement_content&b=announcem... Page 1 of 1 8/13/2015 Financial Statements
Financial Statements and Related Announcement::Second Quarter and/ or Half Yearly... http://infopub.sgx.com/apps?a=cow_corpannouncement_content&b=announcem... Page 1 of 1 8/13/2015 Financial Statements
Investeringsselskabet. Nasdaq OMX Copenhagen A/S Announcement No 7 Nikolaj Plads 6 page 1 of 19 PO Box 1040 date 27 August 2015
 Investeringsselskabet LUXOR Frederiksborggade 50, 1360 København K Telefon 33 32 50 15 Telefax 33 12 41 70 CVR-nr. 49 63 99 10 Nasdaq OMX Copenhagen A/S Announcement No 7 Nikolaj Plads 6 page 1 of 19 PO
H & M Hennes & Mauritz AB
 Full-year report (1 Dec - 30 Nov ) H & M Hennes & Mauritz AB Full-year report Full-year (1 December 30 November ) Well-received collections for all brands in the H&M Group resulted in good sales and increased
Interim report January June 2015
 Interim report January June Second quarter Gross cash collections SEK 834m EBIT margin 30% Acquisition of loan portfolios SEK 665m CET1 ratio 12.58% April June, year-on-year Gross cash collections increased
YEAR-END REPORT January December 2015
 Quarterly financials hampered by production problems YEAR-END REPORT January December KEY HIGHLIGHTS Net sales for the quarter was SEK 5 213 million (5 4). Earnings per share for the quarter was SEK.9
Equity per share (NOK) 147 123 131 Equity ratio 39 % 38 % 36 % Non-current net asset value per share (NOK) (EPRA NNNAV) 2) 184 152 165
 147 123 131 Equity ratio 39 % 38 % 36 % Non-current net asset value per share (NOK) (EPRA NNNAV) 2) 184 152 165") REPORT FOR Q2 AND THE FIRST 6 MONTHS OF 2015 KEY FIGURES Amounts in NOK million Q2 2015 Q2 2014 30.06.15 30.06.14 2014 Net rental income 501 450 1 005 904 1 883 Fair value adjustments in investment properties
REPORT FOR Q2 AND THE FIRST 6 MONTHS OF 2015 KEY FIGURES Amounts in NOK million Q2 2015 Q2 2014 30.06.15 30.06.14 2014 Net rental income 501 450 1 005 904 1 883 Fair value adjustments in investment properties
INTERIM REPORT JANUARY SEPTEMBER
 The upcoming fourth quarter is strongly influenced by Christmas sales both in promo and retail, and it is mainly the same products that are in demand in both sales channels. INTERIM REPORT JANUARY SEPTEMBER
CONSOLIDATED INTERIM FINANCIAL STATEMENTS
 CONSOLIDATED INTERIM FINANCIAL STATEMENTS AND GROUP INTERIM MANAGEMENT REPORT SECOND QUARTER OF 2008 JUNE 30, 2008 FRANCONOFURT AG FRANKFURT AM MAIN FRANCONOFURT AG, FRANKFURT AM MAIN CONSOLIDATED INTERIM
INTERIM REPORT, JANUARY - SEPTEMBER 2003 24 th October 2003
 Turnover for the first nine months of 2003 totalled SEK 6,962 million (SEK 7,252 m) and SEK 2,326 million (SEK 2,196 m) for the third quarter. Earnings after net financial items increased to SEK 80 million
Fastighets AB Balder Interim report January September 2011
 Fastighets AB Balder Interim report January September Profit from property management before tax amounted to SEK 370m (328) corresponding to SEK 2.21 per ordinary share (2.19) Rental income amounted to
Results For The Financial Year Ended 31 December 2014 Unaudited Financial Statements and Dividend Announcement
 Financial Statements and Related Announcement::Full Yearly Results http://infopub.sgx.com/apps?a=cow_corpannouncement_content&b=announcem... Page 1 of 1 2/27/2015 Financial Statements and Related Announcement::Full
THREE MONTH REPORT, JANUARY 1 MARCH 31, 2012
 THREE MONTH REPORT, JANUARY 1 MARCH 31, 2012 1 First Quarter, January March 2012 Net sales amounted to 276 306 Euro Operating loss amounted to 765 548 Euro Losses after taxes amounted to 765 548 Euro Losses
INTERIM REPORT 1997 1ST QUARTER
 INTERIM REPORT 1997 1ST QUARTER OPERATIONS Group structure Kinnevik's Board proposed to the Annual General Meeting held on May 23 that shares in Modern Times Group MTG AB should be distributed to shareholders.
Quarterly report 2/2004
 Quarterly report 2/2004 Operating revenues increase to NOK 1573.4 million (1306.7) The new businesses Are and Mobilarum are performing as anticipated Operating profit in the second quarter totalled NOK
Half Year Financial Statement And Announcement for the Period Ended 31/12/2010
 AUSSINO GROUP LTD Company Registration No.: 199100323H Half Year Financial Statement And Announcement for the Period Ended 31/12/2010 PART I - INFORMATION REQUIRED FOR ANNOUNCEMENTS OF QUARTERLY (Q1, Q2
Quarterly Report 3/2003
 Quarterly Report 3/2003 Residential repair and maintenence demand close to normal level. Slower construction market in Norway and Sweden. Revenues and profit after nine months on same level as last year.
CORRAL PETROLEUM HOLDINGS AB (publ)
") CORRAL PETROLEUM HOLDINGS AB (publ) REPORT FOR THE FOURTH QUARTER AND YEAR ENDED DECEMBER 31, 2011 FOR IMMEDIATE RELEASE Date: March 30, 2012 London Nr. of pages 14 This report includes unaudited consolidated
CORRAL PETROLEUM HOLDINGS AB (publ) REPORT FOR THE FOURTH QUARTER AND YEAR ENDED DECEMBER 31, 2011 FOR IMMEDIATE RELEASE Date: March 30, 2012 London Nr. of pages 14 This report includes unaudited consolidated
Unaudited financial report for the. sixt-month period ended 30 June 2015. Deutsche Bahn Finance B.V. Amsterdam
 Unaudited financial report for the sixt-month period ended 30 June 2015 Deutsche Bahn Finance B.V. Table of contents Annual report of the directors 3 Balance sheet as at 30 June 2015 4 Profit and loss
LAFE CORPORATION LIMITED Un-audited Q1 2014 Financial Statement and Dividend Announcement (All in US Dollars)
") LAFE CORPORATION LIMITED Un-audited Q1 2014 Financial Statement and Dividend Announcement (All in US Dollars) PART I INFORMATION REQUIRED FOR ANNOUNCEMENTS OF QUARTERLY (Q1, Q2 & Q3), HALF-YEAR AND FULL
LAFE CORPORATION LIMITED Un-audited Q1 2014 Financial Statement and Dividend Announcement (All in US Dollars) PART I INFORMATION REQUIRED FOR ANNOUNCEMENTS OF QUARTERLY (Q1, Q2 & Q3), HALF-YEAR AND FULL
Management s Discussion and Analysis
 Management s Discussion and Analysis of Financial Conditions and Results of Operations For the quarter and six months ended June 30, 2012 All figures in US dollars This Interim Management s Discussion