This chapter deals with the description of the sample of 1000 policyholders focused
|
|
|
- Jennifer York
- 8 years ago
- Views:
Transcription
1 CHAPTER -5 DATA ANALYSIS, INTERPRETATION AND FINDINGS This chapter deals with the description of the sample of 1000 policyholders focused on demographic factors (gender, age, religion, residence) data analysis and its interpretation. The chapter has been divided into three major sections. Section 5.1 deals with important descriptive statistics, demographic profile of the policyholders, and frequency distribution. The section 5.2 deals with designing of the constructs with respect to objective and hypotheses of the study, analyzing the validity of various constructs related to the study. The construct validity includes convergent, discriminant as well as face validity. After analyzing the constructs validity the structural model was tested and explained. Section 5.3 provides associations with the variables with respect to various demographic characteristics of the policyholders. In this section comparison of mean values, p-values, z-statistics and t-statistics is also provided for the purpose of testing various hypotheses. 5.1 DEMOGRAPHIC PROFILE OF THE POLICYHOLDERS The marketing concept was born out of the awareness that marketing starts with the determination of policyholder wants and ends with satisfaction of those wants. The entire business environment operates in a dynamic scenario where it is not easy to solve the puzzle of buyer decision making. Policyholders vary tremendously in terms of age, income and educational levels. Marketers also find it useful to distinguish different policyholder groups and segments and to develop product and services tailored to these needs. Thus presentation of sample profile would provide a clearer understanding of the marketing environment in which policyholders are placed. Policyholders purchase decisions are significantly influenced by their cultural, social and geographical factors that are uncontrollable by marketers. Therefore this section elaborates profile of the policyholders. 211
2 TABLE 5.1: Characteristics of the policyholders on the basis of location or residence (N=1000) Region Frequency Percent Rural % Urban % Total % As policyholder behaviour of Indian policyholder forms a part of this study, an attempt has been made to draw a broad sketch of rural and urban policyholders. As the country is vast geographically, market by great diversity in climate, religion, region, language, life style, educational level and economic status, Indian policyholder present a varied view. Hence the sample comprised of rural and urban areas, from different regions and religions. The total numbers of policyholders were 1000, where 500 policyholders were those from rural background and 500 policyholders were from urban areas as shown in table 5.1. The graphical representation is also provided herewith. TABLE 5.2: Characteristics of the policyholders on the basis of Gender (N=1000) Gender Frequency Percent Male % Female % Total % 212
3 The second important demographic variable was gender which is an important variable for marketers in more than one aspect. In this chapter it is proposed to discuss demographic and socio-economic profile of the policyholders. Demographic characteristics deal with vital statistics about the policyholder such as their age, sex, religion, location, marital status and education whereas socio-economic characteristics deal with financial position, occupation, income, wealth and other such attributes. The total number of policyholders was 1000 where 230 (23%) policyholders were females and 770 (77%) policyholders were males as shown in table 5.2. The graph also represents that there was a fair percentage of male policyholders. TABLE 5.3: Characteristics of the policyholders on the basis of Age groups (N=1000) Age Group Frequency Percent Below 25 years % years % years % years % years % 64 or Above % Total % 213
4 People buy goods and services during their life time. Segmenting the market by age provides useful insight into the potential size of markets. As shown in the table 5.3 the policyholders were grouped in six categories and 195 (19.5%) policyholders were below 25 years of age, 309 (30.9%) policyholders were years old, 192 policyholders (19.2%) were years old, 96 (9.6%) policyholders were years old, 176 (17.6%) policyholders were years old and only 32 (3.2%) policyholders were those above 64 years of age. The graph also indicates there was a fair representation of young policyholders who purchased life insurance. TABLE 5.4: Characteristics of the policyholders on the basis of Income groups (N=1000) Income Group (Annual) Frequency Percent Less than 1 Lakh % 1 to 1.5 Lakh % 1.5 to 2.5 Lakh % 2.5 to 5 Lakh % 5 to 10 Lakh % 10 Lakh and above % Total % 214
5 It is obvious that unless people have money or assurance of acquiring it, they cannot be regarded as potential policyholders. The amount of money they can spend will also affect the types of goods they are likely to buy. For this reason most of the analyst study income data. On the social scene the emergence of a large middleclass perhaps the most significant of all developments from the marketing point of view. The middle class in now emerging as the Consumption Community in the country are recognized as educated and rational policyholders. On the basis of income groups of the policyholders it was observed that 88 (8.8%) policyholders were those earning less than `1 lakh, 109 (10.9%) policyholders were those earning between ` lakh, 184 (18.4%) policyholders were those earning between ` lakh, 257 (27.5%) policyholders were those earning between ` lakh, 264 (26.4%) were those earning between 5-10 lakh and only 80 (8%) were earning `10 lakh and above as shown in the table 5.4. The graph also represents that there was a fair percentage of policyholders falls in the middle class income group of ` lakh followed by 5-10 lakh. TABLE 5.5: Characteristics of the policyholders on the basis of owner s wealth (N =1000) Owner s Wealth Frequency Percent Below 10 Lakh % Lakh % 50 Lakh-1 Crore % 1-5 Crore % 5-10 Crore % More Than 10 Crore % 215
6 Owner s Wealth Frequency Percent Below 10 Lakh % Lakh % 50 Lakh-1 Crore % 1-5 Crore % 5-10 Crore % More Than 10 Crore % Total % Consumption is also shaped by family wealth and expenditure pattern therefore it is important to consider owners wealth for analysis. As shown in the table above the policyholders grouped in six groups on the basis of owner s wealth. The table 5.5 shows that 283 (28.3%) policyholders had wealth below ` 10 lakh, 325 (32.5%) policyholders had wealth of ` lakh, 192 (19.2%) policyholders had wealth of ` 50 lakh-1 crore, 72 (7.2%) policyholders had wealth of ` 1-5 crore, 104 (10.4%) policyholders had wealth of ` 5-10 crore and only 24 (2.4%) policyholders had wealth of more than ` 10 crore. The graph also represents that there was a fair percentage of policyholders acquired wealth between ` lakh. 216
7 TABLE 5.6: Characteristics of the policyholders on the basis of family head (N =1000) Head of family Frequency Percent Grand Father % Father % Brother/Sister % Mother % You % Spouse % Total % As shown in the table 5.6 the policyholders showed mixed responses related to heads in their families, in 69 (6.9%) cases grandfather was head of the family, in 539 (53.9%) cases father was the head of the family, in 56 (5.6%) cases sibling (brother or sister) was heads of the family, in 40 (4%) cases mother was head of the family, in 200 (20%) cases policyholders themselves were head of their family and only in 96 (9.6%) cases spouse of the policyholder was head of the family. 217
8 Table 5.7: Characteristics of the policyholders on the basis of occupations of the policyholders (N =1000) Occupation Frequency Percent Agriculture % Self Employed-Shop % Self Employed-Other % Business Owner % Service Professionals Pvt % Govt. Employees % Dependent % Retired from Pvt. Job 8.8% Retired from Govt. Job % Total % The rapid social and economic development taking place in the country is more apparent in the economic activities of policyholder in insurance. With growth in urbanization large number of policyholders entering in the job market. As shown in the table 5.7 policyholders were surveyed from different occupational backgrounds. Seventy two (7.2%) policyholders were farmers, 109 (10.9%) policyholders were shop owners, 80 (8.0%) policyholders were self employed, 125 (12.5%) policyholders were business owner, 302 (30.2%) policyholders were serving private sector, 208 (20.8%) were government employees, 50 (5.6%) policyholders were dependent, 8 (0.8%) were retired from private jobs and 40 (4.0%) policyholders were retired from government jobs. The graph also represents that there was a fair percentage of service professionals followed by 218
9 government employees in the sample size. TABLE 5.8: Characteristics of the policyholders on the basis of educational qualifications of the policyholders (N =1000) Educational Qualifications Frequency Percent Below 10 th % 10th Pass % 12th Pass % Graduate % Diploma Holder % Post Graduate % Professional % Total % Education is a means to provide systematic instruction to make the policyholders intellectually superior and rational. Spread of education certainly leads to liberal attitude, information sharing, social and legal reforms and a desire to acquire high standard of living. Education therefore is determining a factor which is likely to bring about a change for the better in the society and to enhance the status of policyholder awareness. As shown in the table 5.8 policyholders were from different educational backgrounds. In the sample surveyed 64 (6.4%) policyholders were studied up to below tenth standard, 61 (6.1%) policyholders were studied up to tenth standard, 152 (15.2%) policyholders were studied up to twelfth standard. It was also observed that out of 1000 only 301 (30.1%) policyholders were graduates, 128 (12.8%) 219
10 policyholders were diploma holders, 230 (23%) policyholders were post graduates and 64 (6.4%) policyholders were professionally qualified. The graph also represents that there was a fair percentage of graduate policyholders. TABLE 5.9: Characteristics of the policyholders on the basis of Life cycle stage (N =1000) Personal Status (Life-cycle- stage) Frequency Percent Single(Unmarried) % Married, no child % Married, child/children below 5 years % Married, children 5-18 years % Married, Children in College % Married, living with working children % Separated, without children 8.8% Married, child/children separated % Separated, living with children 8.8% Widow/widower and Single % Remarried 8.8% Total % With the tremendous economic and social changes, transformation in attitude and beliefs, increased geographical mobility in search of income, wealth, occupation, increased standard of living the extended families will becoming less popular. Nuclear family has become the vogue of family life styles in India. In the present study a family which has two adults and one to three children is treated as small or nuclear 220
11 family. Big family or extended family is one which has more than two adults and more than three children. As shown in the table 5.9 in the sample surveyed 270 (27%) policyholders were unmarried, 96 (9.6%) policyholders were married and had no child, 112 (11.2%) policyholders were married and had child/children below 5 years of age, 266 (26.6%) policyholders were married and had child/children between 5-18 years of age, 72 (7.2%) policyholders were married and had college going child/children, 112 (11.2%) policyholders had working child/children, 8 (0.8%) policyholders were not living with their child/children, 24 (2.4%) policyholders were widow or widower and only 8 (0.8%) policyholders were remarried. The graph presented above also represents that there was a sound number of singles and married policyholders who had children between 5-18 years. TABLE 5.10: Number of children in the family of policyholder (N =1000) No of children Frequency Percent Nil % % % % 4 or more % Total % The family is defined as two or more persons related by blood, marriage or adoption who resides together. In a more dynamic sense individual who constitute a family might be described as members of the most basis social group who live together and interact to satisfy their personal and mutual needs. Family is a primary group 221
12 exercising considerable influence on policyholder behaviour. The table 5.10 shows that 381(38.1%) policyholders had no child, 219 (21.9%) policyholders had single child, 240 (24%) policyholders had two children, 128 (12.8%) policyholders had three children and only 32 (3.2%) policyholders had four or more children. The graph also represents that there was a fair percentage of policyholders who had no child in their family followed by number of policyholders who had two children in their family. TABLE 5.11: Earning members in family of policyholder (N =1000) Earning Members Frequency Percent % % % 4 or more % Total % Family may be extended, joint or nuclear. Policyholder behaviour researches have revealed that in every family there is role specialisation for example Karta in joint family decides the household products to be bought, in extended family the decider may be one of the grand parent and in nuclear it is the housewife who has a more decisive role to play. The table 5.11 shows that 269 (26.9%) policyholders had only one earning member in their family, 571 (57.1%) policyholders had two earning members in their family, 120 (12%) policyholders had three earning members in their 222
13 family and only 40 (4.0%) policyholders had four or more earning members in their family. The graph also represents that there was a fair percentage of policyholders who had 2 earning members in their family. TABLE 5.12: Religion of policyholders (N =1000) Religion Frequency Percent Hindu % Muslim % Sikh % Christian % Others % Total % The table 5.12 shows that the policyholders were surveyed from different religions, 896 (89.6%) policyholders were Hindus, 24 (2.4%) policyholders were Muslims, 48 (4.8%) policyholders were Sikhs, 16 (1.6%) were Christians and 16 (1.6%) were from other religions not listed in the questionnaire. The graph also represents that there was a fair percentage of Hindu policyholders followed by Sikhs and Muslims. 223
14 TABLE 5.13: Home ownership of policyholders (N =1000) Home ownership Frequency Percent Yes % No % Total % The table 5.13 shows that 771 (77.1%) policyholders had home ownership whereas 229 (22.9%) policyholders had no home ownership. The graph also represents that there was a fair percentage of home owners in the sample size. TABLE 5.14: Type of vehicle policyholders posses (N =1000) Type of Vehicle Frequency Percent Heavy Motor Vehicle % Light Motor Vehicle % Motor Cycle/Scooter geared % Scooter non-geared % None % Total % 224
15 The table 5.14 shows that in the sample surveyed 117 (11.7%) policyholders had heavy motor vehicle, 547 (54.7%) had light motor vehicle, 192 (19.2%) policyholders had geared motor cycle/scooter, 40 (4%) had non-geared scooter whereas only 104 (10.4%) policyholders had no vehicle. The graph also represents that there was a fair percentage of policyholders those who posses light motor vehicle. TABLE 5.15: Type of back accounts policyholders operates (N =1000) Type of Bank Account Frequency Percent Personal % Joint % Both % Total % The table 5.15 shows that 643 (64.3%) policyholders were operating personal bank account, 96 (9.6%) had joint account whereas 261 (26.1%) were operating both joint as well as personal accounts. The graph also represents that there was a fair percentage of policyholders who were operating personal account. 225
16 TABLE 5.16: Property of policyholders (N =1000) Own Property (Agriculture/ Commercial land) Frequency Percent Yes % No % Total % The table 5.16 shows that 640 (64%) policyholders were property owner (agriculture or commercial) whereas 360 (36%) policyholders were not owner of any kind of property. TABLE 5.17: Card policyholders operates (N =1000) Type of credit/debit card Frequency Percent Credit Card % Debit Card/ATM % Kisan Credit Card % Master/Visa card % Total % The table 5.17 shows that 189 (18.9%) policyholders were credit card holders, 739 (73.9%) were debit card holders, 24 (2.4%) were kisan credit card holders and only
17 (4.8%) were master/visa card holders. DEMOGRAPHIC PROFILE OF RURAL AND URBAN POLICYHOLDERS TABLE 5.18: Gender and Region (N =1000) Gender Gender Regionality Rural Urban Total Male Female Total The table 5.18 shows that the number of male policyholders was more in rural (407) as well as urban areas (363) as compare to female policyholders in rural (93) and urban areas (137). TABLE 5.19: Age Group and Region (N =1000) Age Group Age Group Regionality Rural Urban Total Below 25 years years years years years or Above Total
 as well as in urban area (below 25 years was 49 and below 35 was 147), followed by the")
18 The table-5.19 shows that number of young policyholders was more in rural (below 25 years 146, below 35 years was 162) as well as in urban area (below 25 years was 49 and below 35 was 147), followed by the policyholders of 55 to 64 years of age (69 in rural and 107 in urban area)there was a fare participation of each age group in the sample. TABLE 5.20: Income Group and Region (N =1000) Income Group (Annual) Regionality Rural Urban Total Less than 1 Lakh to 1.5 Lakh to 2.5 Lakh to 5 Lakh to 10 Lakh Lakh and above Total Income group of an individual plays a vital role in buying insurance policy. The above table 5.20 provide the details about the income groups of the policyholders. In 228
19 the sample surveyed 59 rural and 29 urban policyholders were earning less than ` 1 lakh, 78 rural and 31 urban policyholders were earning between ` lakh, 91 rural and 93 urban policyholders were earning between ` 1.5 to 2.5 lakh, 176 rural and 99 urban policyholders were earning between ` 2.5 to 5 lakh, 74 rural and 190 urban policyholders were earning between ` 5 to 10 lakh and 22 rural and 58 urban policyholders were earning above ` 10 lakh per annum. TABLE 5.21: Owner s Wealth and Region (N =1000) Owner's Wealth in family Regionality Rural Urban Total Below 10 Lakh Lakh Lakh-1 Crore Crore Crore More Than 10 Crore Total It was observed on the basis of owners wealth of a household that in the sample surveyed owners of 194 rural and 89 urban policyholders had a wealth below 10 lakhs,191 rural and 31 urban policyholders had wealth between ` lakhs 229
20 followed by 58 rural policyholders and 134 urban policyholders had the wealth between ` 50 to 1 Crore as shown in table TABLE 5.22: Head of Family and Region (N =1000) Owner/head of your family Rural Regionality Urban Total Grand Father Father Brother/Sister Mother You Spouse Total The table 5.22 shows that in case of 57 rural and 12 urban policyholders head of the family was Grand Father where as in case of 255 rural policyholders and 284 urban policyholders father was the head of family. It was also observed in case of 114 rural and 86 urban policyholders were the head in their families. 230
21 TABLE 5.23: Occupation and Region (N =1000) Occupation Regionality Total Rural Urban Agriculture Self Employed-Shop Self Employed-Other Business Owner Service Professionals Pvt Govt. Employees Dependent Retired from Pvt. Job Retired from Govt. Job Total The table 5.23 shows that there were a fair percentage of service professionals (121 in rural and 181 urban areas), government employees (93 rural and 115 urban policyholders) followed by self-employed and farmers in the sample surveyed. 231
22 TABLE 5.24: Educational Qualifications and Region (N =1000) Educational Qualifications Regionality Total Rural Urban Below 10th th Pass th Pass Graduate Diploma Holder Post Graduate Professional Total The information in the table 5.24 reveals that 48 rural and 16 urban policyholders were not educated up to 10 th standard, 49 rural and 12 urban policyholders were studied up to 10 th standard, 114 rural and 38 urban policyholders were educated up to 12 th standard. It was also observed that 131 rural and 170 urban policyholders were graduates, 48 rural and 80 urban policyholders were diploma holders, 90 rural and 140 urban policyholders were post graduates whereas 20 rural and 44 urban policyholders were professionally qualified. 232
23 TABLE 5.25: Personal Status (Life-stage) and Region (N =1000) Personal Status of the policyholders Rural Regionality Urban Total Single (Unmarried) Married, no child Married, child/children below 5 years Married, children 5-18 years Married, Children in College Married, living with working children Separated, without children Married, child/children separated Separated, living with children Widow/widower and Single Remarried Total The table 5.25 make clear that there was 181 rural and 89 urban policyholders were unmarried, 33 rural and 63 policyholders were married without children, 68 rural and 44 urban policyholders were married and living with children. It was also observed that 1 rural and 7 urban policyholders were separated and have no issues, 11 rural and 233
24 13 urban policyholders were married and their children were not living with them, 8 rural policyholders were separated and living with their children, 18 rural and 6 urban policyholders were widow/widowers. There were a fair percentage of married policyholders in urban 147 and rural 119 areas that had children aged between 5-18 years of age. TABLE 5.26: Earning Members in Family and Region (N =1000) Earning Members in family Rural Regionality Urban Total or more Total The information in the table 5.26 reveals that 121 rural and 147 urban policyholders had only one earning member in their family, 323 rural and 248 urban policyholders had two earning members in their family, 29 rural and 91urban policyholders had 234
25 three earning members in their family followed by 26 rural and 14 urban policyholders had four or more earning members in their family. TABLE 5.27: Number of Children and Region (N =1000) Number of Children Regionality Total Rural Urban Nil or more Total The information in the table 5.27 reveals that 212 rural and 169 urban policyholders had no child, 122 rural and 97 urban policyholders had one child, 74 rural and 166 urban policyholders has two children, 68 rural and 60 urban policyholders had three children and 24 rural and 8 urban policyholders had four or more children in their family. 235
26 TABLE 5.28: Religion and Region (N =1000) Religion of the policyholders Regionality Total Rural Urban Hindu Muslim Sikh Christian Others Total The table 5.28 shows that there were 465 rural and 431 urban policyholders were Hindus, 9 rural and 15 urban policyholders were Muslims, 9 rural and 39 policyholders were Sikhs, 9 rural and 7 urban policyholders were Christians and 8 rural and 8 urban policyholders were from other religion. 236
27 TABLE 5.29: Home Ownership and Region (N =1000) Home Ownership Regionality Rural Urban Total Yes No Total The table 5.29 shows 372 rural and 399 urban policyholders had home ownership whereas 128 rural and 101 urban policyholders do not have their own homes. TABLE 5.30: Type of Vehicle and Region (N =1000) Type of Vehicle Rural Regionality Urban Total Heavy Motor Vehicle Light Motor Vehicle Motor Cycle/Scooter geared Scooter non-geared None Total
28 The information in the table 5.30 reveals that 48 rural and 69 urban policyholders were owner of heavy motor vehicle, 215 rural and 332 urban policyholders were owner of light motor vehicle, 141 rural and 51 urban policyholders had geared two wheeler, 24 rural and 16 urban policyholders had non-geared two wheeler and only 72 rural and 32 urban policyholders were not owner of any vehicle. TABLE 5.31: Type of Bank Account and Region (N =1000) Type of bank account Regionality Rural Urban Total Personal Joint Both Total
29 The information in the table 5.31 reveals that 48 rural and 69 urban policyholders were owner of heavy motor vehicle, 215 rural and 332 urban policyholders were owner of light motor vehicle, 141 rural and 51 urban policyholders had geared two wheeler, 24 rural and 16 urban policyholders had non-geared two wheeler and only 72 rural and 32 urban policyholders were not owner of any vehicle. TABLE 5.32: Property Ownership and Region (N =1000) Own property(agriculture/commercial/land) and Regionality Regionality Total Rural Urban Yes No Total The table 5.32 shows 316 rural and 324 urban policyholders were owner of property whereas 184 rural and 174 urban policyholders do not own property. 239
30 TABLE 5.33: Type of Card and Region (N =1000) Type of credit/debit Rural Regionality Urban Total Credit Card Debit Card/ATM Kisan Credit Card Master/Visa card Total The information in the table 5.33 reveals that 77 rural and 112 urban policyholders were owner of credit cards, 383 rural and 356 urban policyholders were owner of debit cards/atms, 16 rural and 8 urban policyholders were owner of kisan credit cards whereas 24 rural and 24 urban policyholders were owner of master visa cards. TABLE 5.34: Insured Amount and Region (N =1000) Approximate amount insured by the policyholders in life insurance policy/policies Rural Urban Frequency Percent Frequency Percent 1-3 Lakh Lakh More than 7Lakh Total
31 The information in the table 5.34 reveals that 83.2 percent rural and 72.6 percent urban policyholders insured approximately ` 1 to 3 laks of, 13 percent rural and 20 percent urban policyholders insured ` 4 to 7 laks and 3.8 rural and 8.4 percent urban policyholders insured more than ` 7 laks. PREFERENCES OF INSURANCE POLICIES AND REGION The information collected from the respondent revealed that policyholders posses more than one policy of same company of different companies. Therefore, the data related to types of insurance plan chosen by policy holders and detail of the insurer provided below: TABLE 5.35: Whole Life Scheme Whole Life Scheme Rural Urban Frequency Percent Frequency Percent Yes No Total The information in the table 5.35 reveals that only 14 percent rural and 16.4 percent urban policyholders had whole life insurance policy. The whole life policies were not popular among rural and urban policyholders. 241
32 TABLE 5.36: Endowment Scheme Endowment Scheme Rural Urban Frequency Percent Frequency Percent Yes No Total The information in the table 5.36 reveals that 67.8 percent rural and 53.8 percent urban policyholders had endowment life insurance scheme. Therefore it is stated that endowment schemes were quite popular among rural and urban policyholders. TABLE 5.37: Term Insurance Plan Term Insurance Plan Rural Urban Frequency Percent Frequency Percent Yes No Total
33 The information in the table 5.37 reveals that only 12 percent rural and 10.4 percent urban policyholders had Term insurance plans. Term insurance plans were not popular among rural and urban policyholders. TABLE 5.38: Periodic Money Back Plan Periodic Money Back Plan Rural Urban Frequency Percent Frequency Percent Yes No Total
34 The information in the table 5.38 reveals that only 6.8 percent rural and 2.8 percent urban policyholders had periodic money back plan. Periodic money bank plans were least preferred by the sample policyholders. TABLE 5.39: Medical Benefits Linked Insurance Medical Benefits Linked Insurance Rural Urban Frequency Percent Frequency Percent Yes No Total The information in the table 5.39 reveals that only 7.6 percent rural and 16.4 percent urban policyholders had medical benefit linked insurance. Medical benefit linked insurance plans were least preferred by the sample policyholders. 244
35 TABLE 5.40: Children Plan Children Plan Rural Urban Frequency Percent Frequency Percent Yes No Total The information in the table 5.40 reveals that only 21 percent rural and 16.8 percent urban policyholders had children plan. Children plan were opted by rural and urban policyholders but were not popular among sample policyholders. TABLE 5.41: Joint Life Plan Joint Life Plan Rural Urban Frequency Percent Frequency Percent Yes No Total
36 The information in the table 5.41 reveals that only 12.2 percent rural and 18.2 percent urban policyholders had whole life insurance policy. The joint life plan were least preferred by the sample policyholders. TABLE 5.42: Capital Market Limited Plan Capital Market Limited Plan Rural Urban Frequency Percent Frequency Percent Yes No Total
37 The information in the table 5.42 reveals that only 3.6 percent rural and 1.2 percent urban policyholders had capital market linked plan. Capital market linked plans were least preferred by the sample policyholders. TABLE 5.43: Group Schemes Group Schemes Rural Urban Frequency Percent Frequency Percent Yes No Total The information in the table 5.43 reveals that only 4.8 percent rural policyholders had group life insurance schemes. Group schemes were least preferred by the sample policyholders in rural as well as urban segment. TABLE 5.44: Social Security Social Security Rural Urban Frequency Percent Frequency Percent Yes No Total
38 The information in the table 5.44 reveals that only 3.2 percent rural policyholders had social security schemes. Social security plans were least preferred by the sample policyholders. TABLE 5.45: Education Plan Education Plan Rural Urban Frequency Percent Frequency Percent Yes No Total
39 The information in the table 5.45 reveals that only 3.6 percent rural and 1.2 percent urban policyholders had educational plan. Educational plans were least preferred by the sample policyholders. TABLE 5.46: Pension Plan Pension Plan Rural Urban Frequency Percent Frequency Percent Yes No Total The information in the table 5.46 reveals that only 5.2 percent rural and 7.6 percent urban policyholders had pension plan. Pension plans were least preferred by the sample policyholders in rural and urban segments. 249
40 TABLE 5.47: Growth Plan Growth Plan Rural Urban Frequency Percent Frequency Percent Yes No Total The information in the table 5.47 reveals that only 7.4 percent rural and 7 percent urban policyholders had capital market linked plan. Growth plans were least preferred by the sample policyholders. TABLE 5.48: Unit Linked Plan Unit Linked Plan Rural Urban Frequency Percent Frequency Percent Yes No Total
41 The information in the table 5.48 reveals that only 13.6 percent rural and 20 percent urban policyholders had unit linked plan. Unit linked plans were less poplar among the sample policyholders. TABLE 5.49: Systematic Investment Plan Systematic Investment Plan Rural Urban Frequency Percent Frequency Percent Yes No Total
42 The information in the table 5.49 reveals that only 4.8 percent rural and 1.6 percent urban policyholders had systematic investment plan. Systematic investment plans were least preferred by the sample policyholders. TABLE 5.50: Individual Plan Individual Plan Rural Urban Frequency Percent Frequency Percent Yes No Total The information in the table 5.50 reveals that only 61.2 percent rural and 28.4 percent urban policyholders had individual plan. Individual plans were quite popular among the rural policyholders. TABLE 5.51: Money Back Plan Money Back Plan Rural Urban Frequency Percent Frequency Percent Yes No Total
43 The information in the table 5.51 reveals that only 28.8 percent rural and 11.2 percent urban policyholders had capital money back plan. Money back plans were also less preferred by the sample policyholders in both the segments. TABLE 5.52: Special Plan Special Plan Rural Urban Frequency Percent Frequency Percent Yes No Total The information in the table 5.52 reveals that only 3.2 percent rural policyholders had special plan. Special plans were least preferred by the sample policyholders. 253
44 TABLE 5.53: Health Plan Health Plan Rural Urban Frequency Percent Frequency Percent Yes No Total The information in the table 5.53 reveals that only 5 percent rural and 4.6 percent urban policyholders had health plan. Health plans were least preferred by the sample policyholders in rural and urban segments. TABLE 5.54: Multiplier Plan Multiplier Plan Rural Urban Frequency Percent Frequency Percent Yes No Total
45 The information in the table 5.54 reveals that only 3.2 percent rural and 1.6 percent urban policyholders had Multiplier plan. Multiplier plans were least preferred by the sample policyholders. TABLE 5.55: Plan with Flexible Investment Option Plan with Flexible Investment Option Rural Urban Frequency Percent Frequency Percent Yes No Total
46 The information in the table 5.55 reveals that only 3.2 percent rural and 1.6 percent urban policyholders had plan with flexible investment option. Plans with flexible investment option were least preferred by the sample policyholders in both the segments. TABLE 5.56: Security Security Rural Urban Frequency Percent Frequency Percent Yes No Total The information in the table 5.56 reveals that only 76.8 percent rural and 60.8 percent urban policyholder s posses a policy with security. Social security is one of the criteria thee policyholders expect to be part of most of the policies. 256
47 TABLE 5.57: Security and Critical Pension Security and critical pension Rural Urban Frequency Percent Frequency Percent Yes No Total The information in the table 5.57 reveals that only 12 percent rural and 20 percent urban policyholders had a policy with security and critical pension plan features. TABLE 5.58: Systematic Investment Plan Systematic Investment Plan Rural Urban Frequency Percent Frequency Percent Yes No Total
48 The information in the table 5.58 reveals that only 3 percent rural and 13 percent urban policyholders opted for a policy with systematic investment plan. TABLE 5.59: Saving Plan Saving Plan Rural Urban Frequency Percent Frequency Percent Yes No Total The information in the table 5.59 reveals that only 73.2 percent rural and 48.4 percent urban policyholders preferred a policy offering saving plan. 258
49 TABLE 5.60: Risk Disability Risk Disability Rural Urban Frequency Percent Frequency Percent Yes No Total The information in the table 5.60 reveals that only 3.2 percent rural and 1.6 percent urban policyholders preferred a policy with risk disability plan. TABLE 5.61: Critical Plan Critical Pension Rural Urban Frequency Percent Frequency Percent Yes No Total
50 The information in the table 5.61 reveals that only 3 percent rural and 9.8 percent urban policyholders chosen life insurance with critical pension plan. TABLE 5.62: Security Illness Security Illness Rural Urban Frequency Percent Frequency Percent Yes No Total The information in the table 5.62 reveals that only 1.8 percent rural and 6.2 percent urban policyholders preferred a policy with security illness plan. TABLE 5.63: Annuity Insurance Annuity Insurance Rural Urban Frequency Percent Frequency Percent Yes No Total
51 The information in the table 5.63 reveals that only 1.6 percent rural and 1.6 percent urban policyholders chosen a policy with annuity schemes. TABLE 5.64: Flexibility Investment Portfolio Flexible Investment Portfolio Rural Urban Frequency Percent Frequency Percent Yes No Total
52 The information in the table 5.64 reveals that only 1.6 percent rural and 6.4 percent urban policyholders opted for life insurance with flexible investment portfolio plan. TABLE 5.65: Payer s Benefit Payer's Benefit Frequency Percent Frequency Percent Yes No Total The information in the table 5.65 reveals that only 1.6 percent rural and 1.6 percent urban policyholders opted for life insurance with payer s benefit plan. TABLE 5.66: Risk Coverage Risk Coverage Frequency Percent Frequency Percent Yes No Total
53 The information in the table 5.66 reveals that only 68.2 percent rural and 50.2 percent urban policyholders favored life insurance with maximum risk coverage plan. TABLE 5.67: Investment in Equity Funds Investment in equity funds Frequency Percent Frequency Percent Yes No Total The information in the table 5.67 reveals that only 1.6 percent rural and 8 percent urban buyer preferred a policy where investment in equity funds is offered to the policyholders. 263

54 TABLE 5.68: Investment in Growth Funds ` Frequency Percent Frequency Percent Yes No Total The information in the table 5.68 reveals that only 1.6 percent rural and 3.2 percent urban policyholders had preferred a policy with growth funds. TABLE 5.69: Investment in Debts Funds Investment in debts funds Frequency Percent Frequency Percent Yes No Total
55 The information in the table 5.69 reveals that only 2.6 percent rural and 5.4 percent urban policyholders opted for a policy with debt funds. TABLE 5.70: Investment in Liquid Funds Investment in liquid funds Frequency Percent Frequency Percent Yes No Total The information in the table 5.70 reveals that only 1.6 percent rural policyholders preferred policy where money is invested in liquid funds. 265
56 TABLE 5.71: Maturity Safety Switch Options Maturity Safety Switch Options Frequency Percent Frequency Percent Yes No Total The information in the table 5.71 reveals that only 43.6 percent rural and 24.6 percent urban policyholders opted for life insurance with maturity safety switch options. TABLE 5.72: Auto Fund Rebalancing Auto Fund Rebalancing Frequency Percent Frequency Percent Yes No Total
57 The information in the table 5.72 reveals that only 1.6 percent rural policyholders opted for a life insurance policy where the money is invested in auto fund rebalancing scheme. TABLE 5.73: Milestone Withdrawals Milestone Withdrawals Frequency Percent Frequency Percent Yes No Total The information in the table 5.73 reveals that only 1.6 percent rural policyholders 267
58 preferred a plan where milestone withdrawals are possible. TABLE 5.74: Partial Withdrawals Partial Withdrawals Frequency Percent Frequency Percent Yes No Total The information in the table 5.74 reveals that only 16.0 percent rural and 9.6 percent urban policyholders preferred a policy where partial withdrawals are possible. TABLE 5.75: Settlement Options Settlement Options Frequency Percent Yes No Total The information in the table 5.75 reveals that only 11.2 percent rural and 12.8 percent urban policyholders preferred a life insurance where settlement options is provided to them. 268
59 TABLE 5.76: Revival Policy Revival of Policy Frequency Percent Frequency Percent Yes No Total The information in the table 5.76 reveals that only 60.4 percent rural and 38.8 percent urban policyholders preferred a life insurance where revival of policy is easier. 269
60 TABLE 5.77: Policyholders of Different Life Insurance Companies Insurance Company No. of Policyholders Bajaj 189 HDFC 112 SBI Life 355 Aviva 16 Canara Bank HSBC 24 AMP Sanmar 0 ICICI 200 ING Vysya 24 Birla Sunlife 24 Sahara 16 Max New York 149 Shriram Life 8 LIC 920 Tata AIG 235 Reliance Life 32 Kotak Mahindra 40 Metlife India 0 Others 16 Total 2360 The table values indicated that the approached policyholders were holding different life insurance policies from different companies and there were many policyholders who had more than one policy from the same or different companies. The majority of policyholders bought LIC policy and they preferred to continue the association with the company. SBI life, Tata AIG and ICICI are also holding good position in the minds of policyholder. 270
61 The graph 5.77 indicates that there was a fair representation of LIC policyholders in the sample size (920) followed by SBI life insurance and TATAAIG. Therefore it is inferred that LIC is holding major market share in the insurance sector and winning policyholders faith. 271
62 CORRELATIONS ANALYSIS TABLE 5.78: Correlation between Region and Type of Insurance Policy Rationality Type of Insurance Policy Rural Urban Whole Life Scheme.451** Endowment Scheme.125**.118** Term Insurance Plan.492** Periodic Money Back Plan.673** -.122* Medical Benefits Linked Insurance.634** -.156* Children Plan.353** Joint Life Plan.488** Capital Market Limited Plan.041* Group Schemes.810**.00 Social Security 1.000** 1.000** Education Plan.969** Pension Plan.776**.445** Growth Plan.643** -.135* Unit Linked Plan.458** -.164* Systematic Investment Plan Individual Plan.145** Money Back Plan.286** -.145* Special Plan Health Plan.793** Multiplier Plan Plan with Flexible Investment Option.000* The above table reveals the information that Endowment Scheme, Periodic Money Back Plan, Medical Benefits Linked Insurance, ULIPS, Social Security, Pension Plan are closely linked with the urban region as there is a significant correlation between urban region and above plans. Therefore because of information search and awareness of urban respondents these plans were popular among urban policyholders. Periodic, Money Back Plan, Medical Benefits Linked Insurance, ULIPS and Growth Plan show 272
63 negative correlation with rural region due to poor awareness of rural policyholders. TABLE 5.79: Correlation between Gender and Type of Insurance Policy Gender Type of Insurance Policy Rural Urban Whole Life Scheme * Endowment Scheme ** Term Insurance Plan ** Periodic Money Back Plan.129**.104* Medical Benefits Linked Insurance * Children Plan.146**.084 Joint Life Plan.162** Capital Market Limited Plan.092*.068 Group Schemes.107* 0.00 Social Security Education Plan.090*.073 Pension Plan.112*.041 Growth Plan.135**.169** Unit Linked Plan.175**.049 Systematic Investment Plan.107*.078 Individual Plan.094* -.150** Money Back Plan.304** -.123** Special Plan Health Plan ** Multiplier Plan Plan with Flexible Investment Option The above table reveals the information that Periodic Money Back Plan, Children Plan, Joint Life Plan, Capital Market Limited Plan, Pension Plan, ULIPS, Systematic Investment Plan, Individual Plan, Money Back Plan are closely linked with the gender in urban region as there is a significant positive correlation. Whereas Endowment, 273
64 Term Insurance Plan, Individual, Money back plans shows negative correlation with gender in rural region. TABLE 5.80: Correlation between Occupation and Type of Insurance Plan Occupation Type of Insurance Policy Rural Urban Whole Life Scheme -.191** Endowment Scheme Term Insurance Plan ** Periodic Money Back Plan Medical Benefits Linked Insurance -.161** Children Plan -.243**.081 Joint Life Plan ** Capital Market Limited Plan -.214** -.295** Group Schemes -.168** 0.00 Social Security -.178** 0.00 Education Plan -.176** Pension Plan -.179** -.290** Growth Plan -.172**.056 Unit Linked Plan -.135**.171** Systematic Investment Plan -.202** Individual Plan.251**.222** Money Back Plan ** Special Plan -.178** 0.00 Health Plan -.227**.107* Multiplier Plan -.178** Plan with Flexible Investment Option -.178** The above table reveals that occupation has negative correlation with several plans rural and urban segments such as Capital market plan, Pension plan, ULIPs etc. 274
65 TABLE 5.81: Correlation between Age and Type of Insurance Plan Age Type of Insurance Policy Rural Urban Whole Life Scheme -.202** -.281** Endowment Scheme.214**.312** Term Insurance Plan -.375**.026 Periodic Money Back Plan -.366** -.162** Medical Benefits Linked Insurance -.204** -.109* Children Plan -.223** -.172** Joint Life Plan -.312**.262** Capital Market Limited Plan -.400** -.225** Group Schemes -.279** 0.00 Social Security -.370** 0.00 Education Plan -.370** Pension Plan -.244** Growth Plan -.168** Unit Linked Plan.367**.193** Systematic Investment Plan -.330** -.168** Individual Plan.331**.040 Money Back Plan -.286**.194** Special Plan -.370** 0.00 Health Plan -.270**.078 Multiplier Plan -.370**.109* Plan with Flexible Investment Option -.370**.017 The above table reveals that age is also associated with type of Insurance plans. Endowment schemes and ULIPs had a positive correlation with age whereas Whole life, Money back, Children and Capital market linked plans had negative correlation with age of the policyholders. 275
66 TABLE 5.82: Correlation between educational level and type of insurance Education Type of Insurance Policy Rural Urban Whole Life Scheme -.202** -.281** Endowment Scheme.214**.312** Term Insurance Plan -.375**.026 Periodic Money Back Plan -.366** -.162** Medical Benefits Linked Insurance -.204**.262** Children Plan -.223**.168** Joint Life Plan -.312**.262** Capital Market Limited Plan -.400** -.177** Group Schemes -.279**.085 Social Security -.370**.065 Education Plan -.370**.470** Pension Plan -.244**.114* Growth Plan.168**.145** Unit Linked Plan -.367**.193** Systematic Investment Plan -.330** -.168** Individual Plan.331**.613** Money Back Plan -.286**.194** Special Plan -.370**.008 Health Plan -.270**.078 Multiplier Plan -.370**.109* Plan with Flexible Investment Option -.370**.017 The above table reveals that education is also linked with type of insurance plan selected by the policyholders. Education level have negative correlation with different types of insurance plans such as Systematic investment plan, Capital market plan, Whole life and periodic money back plans in both the region. Education was positively correlated with Endowment and Growth plans in both the regions. 276
67 TABLE 5.83: Correlation between income group and type of insurance Income Type of Insurance Policy Rural Urban Whole Life Scheme.260**.208** Endowment Scheme.132**.275** Term Insurance Plan -.149** -.183** Periodic Money Back Plan.187**.174** Medical Benefits Linked Insurance.169**.253** Children Plan.252** -.161** Joint Life Plan.205**.356** Capital Market Limited Plan -.311** -.154** Group Schemes.268**.098 Social Security -.285**.078 Education Plan.298**.167** Pension Plan.166**.033 Growth Plan.264** Unit Linked Plan.184** Systematic Investment Plan.213** Individual Plan.249**.582** Money Back Plan Special Plan.285** Health Plan.281** 136** Multiplier Plan -.285**.203** Plan with Flexible Investment Option -.285** -.179** The above table reveals that income of respondents had positive correlation with type of Insurance plans. Whole Life Scheme, Endowment Scheme, Periodic Money Back Scheme, Medical Benefit Linked Scheme, Joint Life Plan, Individual Plan and Health Plan have positive correlation with income group whereas Capital Market Plan and Term Insurance had negative correlation with income group. 277
68 TABLE 5.84: Correlation between Personal status and type of insurance Personal Status Type of Insurance Policy Rural Urban Whole Life Scheme -.159** -.164** Endowment Scheme ** Term Insurance Plan -.186**.073 Periodic Money Back Plan -.252** -.285** Medical Benefits Linked Insurance -.201** Children Plan -.223** -.148** Joint Life Plan -.308**.118** Capital Market Limited Plan -.306** -.108* Group Schemes -.173**.073 Social Security -.296**.063 Education Plan -.292** Pension Plan -.192** -.111* Growth Plan Unit Linked Plan -.275**.229** Systematic Investment Plan -.269** -.125** Individual Plan.123**.544** Money Back Plan -.246**.237** Special Plan -.296**.023 Health Plan -.200**.018 Multiplier Plan -.296**.051 Plan with Flexible Investment Option -.296** The above table reveals that personal status of respondents also shown negative correlation with type of Insurance plans in rural and urban segment in case of Whole Life Scheme, Periodic Money Back Plan, Children Plan, Capital Market Linked Plan, Pension Plan and Systematic Plan. 278
69 TABLE 5.85: Correlation between amount insured and other variables Approximate amount insured by you in life insurance policy/policies Gender -.096* Age Group.302** Income Group (Annual).303** Owner's Wealth in family.461** Owner/head of your family.257** Your Occupation.358** Educational Qualifications Personal Status.366** Earning Members in family residing with you.152** Number of Children you have.237** Regionality.258* Religion.273** Home Ownership.184** Type of Which Vehicle you posses -.111* Type of bank account you have.458** Own property(agriculture/commercial/land) Type of credit/debit card used.191** The above table reveals that amount of life insurance is positively correlated with age, income, wealth, occupation, head in family, personal status of respondents, earning members in family, region, religion, home ownership, type of bank account etc. 279
70 5.2 CONFIRMATORY FACTOR ANALYSIS AND DESIGNING OF THE CONSTRUCTS Confirmatory factor analysis (CFA) is a statistical technique used to verify the factor structure of a set of observed variables. CFA allows the researcher to test the hypothesis that a relationship between observed variables and their underlying latent constructs exists. The researcher uses knowledge of the theory, empirical research, or both, postulates the relationship pattern a priori and then tests the hypothesis statistically CFA allows the researcher to test the hypothesis that a relationship underlying latent construct(s) exists. The researcher uses knowledge of the theory, empirical research, or both, postulates the relationship pattern a priori and then tests the hypothesis statistically. The use of CFA could be impacted by: The research hypothesis being testing The requirement of sufficient sample size (e.g., 5-20 cases per parameter estimate) Measurement instruments Multivariate normality Parameter identification Outliers Missing data Interpretation of model fit indices A suggested approach to CFA proceeds through the following process: Review the relevant theory and research literature to support model specification Specify a model (e.g., diagram, equations) Determine model identification (e.g., if unique values can be found for parameter estimation; the number of degrees of freedom, (df), for model testing is positive) collect data Conduct preliminary descriptive statistical analysis (e.g., scaling, missing data, 280
71 collinearity issues, outlier detection) estimate parameters in the model assess model fit present and interpret the results. Confirmatory factor analysis (CFA) provides enhanced control for assessing unidimensionality (i.e., the extent to which items on a factor measure one single construct) than exploratory factor analysis (EFA) and is more in line with the overall process of construct validation. In this study, confirmatory factor analysis model is run through AMOS software. Confirmatory Factor Analysis is a statistical technique used to verify the factor structure of a set of observed variables. Confirmatory Factor Analysis (CFA) allows the researcher to test the hypothesis that a relationship between observed variable and the underlying latent construct exists. The researcher uses the knowledge of the theory, empirical research or both, postulates the relationship patter a priori and than tests the hypothesis statistically. Confirmatory Factor Analysis could occur with the development of measurement instruments such as satisfaction scales, attitude or policyholder service questionnaires. In this research a blueprint is developed, questions written, appropriate scales were determined. The research instrument was used after conducting spade work and pilot survey, data collected and Confirmatory Factor Analysis completed. Confirmatory Factor Analysis allows the researcher to test the hypothesis that a relationship between the observed variables and their underlying latent construct (s) exists. Various dimensions of Confirmatory Factor Analysis are defined below: Validity Analysis The validity of scale may be defined as the extant to which differences in observed scale reflect true differences among objects on the characteristics being measured, rather than systematic or random errors. Some of the important validity tests generally considered includes content, construct, discriminant and criterion related validity. Content validity Content validity also called face validity which consists of a subjective but systematic evaluation of the repetitiveness of the contents of a scale. The content validity of a 281
72 construct can be defined as the degree to which the measure spans the domain of the constructs. For the present study, the content validity of the instrument was ensured as the service quality dimensions and items were identified from the literature and were thoroughly reviewed by professionals and academicians. Construct Validity Construct validity is a type of validity that addresses the construct or characteristic of the defined measuring scale. Construct validity require the a sound theory of the nature the construct being measured and how it is related to other construct. It involves the assessment of the degree to which an operationalization correctly measures its targeted variables. Establishing construct validity involves the empirical assessment of unidimensionality, reliability and validity (convergent and discriminant validity). In the present study, in order to check for unidimensionality, a measurement model was specified for each construct and CFA was run for all the constructs. Individual items in the model were examined to see how closely they represent the same construct. A comparative fit index (CFI) of 0.90 or above for the model implies that there is a strong evidence of unidimensionality. The CFI values obtained for all the six dimensions in the scale are equal to or above 0.90 as shown in the respective constructs. This indicates a strong evidence of unidimensionality for the scale. Once unidimensionality and reliability of a scale is established, it is further subjected to validation analysis. Convergent Validity It is a measure of construct validity that measures the extant to which the scale correlates positively with other measures of the same construct. It is the degree to which multiple methods of measuring a variable provide the same results. Convergent validity can be established using a coefficient called Bentler-Bonett coefficient. Scale with values of 0.90 or above shows strong evidence of convergent validity (Bentler and Bonett, 1980). The values for the Bentler- Bonett coefficient are summarized for all the six dimensions. All the dimensions have a value of more than 0.90, thereby demonstrating strong convergent validity. 282
73 Discriminant Validity Discrminant validity assesses the extant to which a measure does not correlate with other construct from which it is suppose to differ. It involves demonstrating a lack of correlation among differing a construct. It is the degree to which the measures of different latent variables are unique. Discriminant validity is ensured if a measure does not correlate very highly with other measures from which it is supposed to differ. For assessing discriminant validity, two chi-square comparison models were considered. The two comparison models are referred as Model 1 and Model 2. The comparison of chi-square statistic for Model 1 and Model 2 provides support for discriminant validity. Criterion-related Validity It is a type of validity that examines whether a scale performs as expected in to other variables selected as meaningful criteria.it is established when a criterion, external to the measurement instrument is correlated with the factor structure. In the present study, criterion validity is established by correlating the policyholder perceived service quality scale scores with overall service quality, which is considered to be the outcome construct. The correlations values also supports that all the dimensions have significant positive correlations with overall service quality. Thus, criterion related validity is established for all the dimensions. A construct can be defined as the latent variable which cannot or difficult to be measured directly from the policyholders. Hence a set of variables is to be included in the construct for its measurement. Before finalizing the set of variables in the construct the content validity is to be assured. The best practice to ensure the content validity is to show the set of possible variables in the construct to five academicians as well as five industry experts. After analyzing the advice received from these experts the constructs along with the set of variables is finalized. In this way the issue of content validity is resolved. After ascertaining the content validity the next issue was to analyze the validity of each individual construct. The construct validity consists of convergent validity, discriminant validity and face validity. The 283
74 convergent validity can be tested with help of factor loadings of each individual variable to the construct. The high Factor loadings indicate convergent validity and since high factor loadings indicate that the variable is highly explained by the construct, hence it will not be explained by any other construct which indicates the presence of discriminant validity. The description of various constructs, the set of variables in each construct and their factor loadings are shown as below:- Table 5.86: Possible Construct Name of Construct First Construct: Second Construct: Third Construct: Fourth Construct: Fifth Construct: Sixth Construct: Seventh Construct: Eight Construct: Ninth Construct: Parameter Selection Criteria (recommendation) Source of Information Purpose of Buying Feeling and Attitude Service Attributes Product Attributes Service Attributes Agents Attributes Other Attributes Structural Equation Modeling Traditional statistical methods normally utilize one statistical test to determine the significance of the analysis. However, Structural Equation Modeling (SEM), CFA specifically, relies on several statistical tests to determine the adequacy of model fit to the data. The chi-square test indicates the amount of difference between expected and observed covariance matrices. A chi-square value close to zero indicates little difference between the expected and observed covariance matrices. In addition, the probability level must be greater than 0.05 when chi-square is close to zero. The Comparative Fit Index (CFI) is equal to the discrepancy function adjusted for sample size. CFI ranges from 0 to 1 with a larger value indicating better model fit. Acceptable model fit is indicated by a CFI value of 0.90 or greater (Hu &Bentler, 1999). 284
75 Policyholder decision making process an analysis The policyholder decision to purchase or reject a product is the moment of final truth for the marketer. It signifies whether the marketing strategy has been wise, insightful and effective or whether it was poorly planned and missed the mark. Thus the marketers are particularly interested in policyholder decision making process. Therefore various aspects of decision making process were considered and constructs were designed accordingly. Root Mean Square Error of Approximation (RMSEA) is related to residual in the model. RMSEA values range from 0 to 1 with a smaller RMSEA value indicating better model fit. Acceptable model fit is indicated by an RMSEA value of 0.06 or less (Hu & Bentler, 1999). If model fit is acceptable, the parameter estimates are examined. The ratio of each parameter estimate to its standard error is distributed as a z statistic and is significant at the 0.05 level if its value exceeds 1.96 and at the 0.01 level it its value exceeds 2.56 (Hoyle, 1995). Unstandardized parameter estimates retain scaling information of variables and can only be interpreted with reference to the scales of the variables. Standardized parameter estimates are transformations of unstandardized estimates that remove scaling and can be used for informal comparisons of parameters throughout the model. Standardized estimates correspond to effect-size estimates. 285
76 Table 5.87: Construct Selection criteria on the basis of Recommendations (buying decision) Source of Information Purpose of buying Feelings and attitude Service attribute Product attributes Agents attributes Other factors My own decision. My employer s suggestion. Recommended by family member My Friend s suggestion Insurance agent s suggestion. My spouse s suggestion. Recommended during advertisement News paper /magazines Television Internet / s Agent Office/Workplace Circular/Notices Spouse/children Friends Insurance Experts/advisors Extra money at the time of my retirement. Extra money at the time of my retirement. Extra money in case of emergency (illness, accident). To avoid incurring unnecessary costs of insurance in future To maintain same life style over years Death protection for family members To provide financial support to spouse To save tax Premium amount gives me adequate coverage Feel secure after buying adequate insurance Insurance is better than investment in stock market Premium instalments are affordable for me I will receive guaranteed fund value Insurance policy will grant loan facility Flexible investment option plans are risky Reputation and loyalty Ambience and experience Comfort and promptness Quality of services offered Hassel free paper work and documentation Presentation, appearance and surroundings Clarity of contract and terms in document SMS/Reminders about premium payment Type of insurance plan Risk coverage Premium or cost of coverage Variety and associated range of products Tax benefits Payment option (mode of payment) Product flexibility (surrender, loan, revival) Maturity period and grace period Agent provides error free services Committed to fulfill promises timely Perform the service right in first instance Provides accuracy (such as payment record) Providing satisfactory services. Prompt, responsive and reliable. Cooperative and friendly. Known and trustworthy. The State financial policy and interest rates Novelty products on the insurance market. Details of insurance terms and conditions. Legal aspects of the policy I consider. 286
77 Selection criteria on the basis of Recommendations (buying decision) Source of Information Purpose of buying Feelings and attitude Service attribute Product attributes Agents attributes Other factors Word of mouth SMS/Reminder alerts about new products Growth and benefits Properly remind about the due premium. Bankers Information brochures, leaflets and letters Explain features, advantages and benefits of the policy Promotional telephone call/sms Application of latest technology in providing services Memorable advertisement Thoroughness of follow up on questions/ enquiries/ requests prior to purchase decision Attire of the agent is acceptable Attitude of agent towards policyholders is good Behaviour of agent is good with policyholders Agent have enough past experience in the field Attention focused on your priorities Awareness about terms and conditions of policy. 287
78 5.2.1 Analyzing the Construct Validity After ascertaining the content validity the next issue is to analyze the validity of each individual construct. The construct validity consists of convergent validity, discriminant validity and face validity. The convergent validity can be tested with help of factor loadings of each individual variable to the construct. The high Factor loadings indicate convergent validity and since high factor loadings indicate that the variable is highly explained by the construct, hence it will not be explained by any other construct which indicates the presence of discriminant validity. In describing a construct three types of variables were used in this structural modeling. Manifest variable (Observed behavior, usually dependent) Latent Variable (Unobserved behavior, explanatory) Residual Variable (Unobserved behavior, unexplained) The description of various constructs, the set of variables in each construct and their factor loadings are shown as below: Factors Influencing Policyholders in Selecting the Insurance Policy (Selection Criteria) The first construct defined as the factors influencing policyholders in selecting the insurance policy along with the set of variables are shown below in figure 5.1. The first construct consists of seven manifest, seven residual and one latent variable. The regression weights of each variable as result of the construct are shown in table As shown in the table all the regression weights are high and significant. Hence the construct validity is ensured and can be concluded that the construct significantly explains the variables. The standardized regression weights as well as the multiple squared correlations are shown in table The high value of the standardized weights indicates the higher influence of the construct to the variable. The squared multiple correlations indicate the percentage of variance of the measured variable that can be explained with the help of the variations in the construct. The results as shown in table 5.88 indicate that the agent of the insurance company is the most influencing 288
79 criteria for the policyholder of the insurance policy followed by the friends and family members. The agents being the most informed source has maximum influence on the policyholders as compared to other sources especially in rural segment. The advertisements of the insurance companies also influence the policyholders in deciding the insurance policy. The squared multiple correlation of insurance agent indicates that the 67 percent of the variance of the impact of insurance agent that can be explained with the help of the selection criteria. The fit of the model is shown in table The results indicate that the model is fit. TABLE 5.88: Regression Weights Selection Criteria Suggestion of Buying the Insurance Nobody influenced me, it was my own decision. My employer s suggestion. Recommended by family member My Friend s suggestion Insurance agent s suggestion. My spouse s suggestion. Recommended during advertisement Estimate Standardised Regression Weight Squared Multiple Correlation S.E. C.R. P *** *** *** *** *** *** TABLE 5.89: Model Fit Selection Criteria Model Fit Statistic Chi-square CFI.725 NFI.722 RFI.583 RMSEA.210 LO HI
 for acceptable model. The model fit statistics from AMOS output is shown in the table 5.89.")
80 The Chi-square value is presented in the matrices. The RMSEA value indicates the amount of unexplained variance or residual is large than 0.06 or less critical. CFI and NFI value are not in complete agreement but are very close to the criteria (0.90 or larger) for acceptable model. The model fit statistics from AMOS output is shown in the table FIGURE: Sources of Information Influencing Policyholders in Selecting the Insurance Policy In order to increase the awareness about the importance of insurance policies among the investors, the insurance companies uses different sources to pass on the necessary 290
81 information to their prospective policyholders. The various source of information may be TV, newspapers, agents, phone calls, internet, s, mobile SMS, print media etc. The second construct represents the impact of various sources of information in influencing the policyholders in selecting the insurance policy along with the set of variables. The construct consists of eleven manifest, eleven residual and one latent variables are shown below in fig People have easy access to news papers and variety of other sources of communication due to which policyholders are exposed to new products, opinions and advertisements. In the present study the importance of various sources of communication was analysed. The regression weights of each variable as result of the construct are shown in table As shown in the table all the regression weights are high (more than 0.5) and significant. Hence the construct validity is ensured and can be concluded that the construct significantly explains the variables. The standardized regression weights as well as the multiple squared correlations are shown in table 5.90.The standardizes regression weights indicates comparative influence of the construct to its variables. The high value of the standardized weights indicates the higher influence of the construct to the variable. The squared multiple correlations indicate the percentage of variance of the measured variable that can be explained with the help of the construct. It is found from the results that the most influential source of information for policyholders was insurance agent and friends. This is due to the fact that still today the policyholders from the rural background do not have the enough awareness about the websites and internet. The insurance agents in most of the rural areas are actually the persons who commands good position in the society and can influence the policyholders in deciding and buying the insurance policies. The office workplace notifications/ circulars also influence the policyholders in selecting the insurance policy especially for the service class policyholders. The squared multiple correlations of insurance agent and friends indicate that the 81 percent of the variance of the impact of insurance agent and friends that can be explained with the help of the selection criteria. The fit of the model is shown in table The results indicate that the construct is fit. 291
82 TABLE 5.90: Regression Weights Sources of Information Sources of Information News paper /magazines Estimate Standardised Regression Weight Squared Multiple Correlation S.E. C.R. P Television *** Internet / s Agent *** Office/Workplace Circular/Notices *** Spouse/children *** Friends *** Insurance Experts/advisors *** Word of mouth *** Bankers Promotional telephone call/sms *** TABLE 5.91: Model Fit Sources of Information Model Fit Statistic Chi-square CFI.538 NFI.535 RFI.419 RMSEA.275 LO HI The Chi-square value is presented in the matrices. The RMSEA value indicates the amount of unexplained variance or residual is large than 0.06 or less critical. CFI and NFI value are not in complete agreement but are very close to the criteria (0.90 or larger) for acceptable model. The model fit statistics from AMOS output is shown in the table

83 FIGURE: Purpose of Buying the Insurance Policy The policyholder buy the product or a service in order to satisfy some need or wants. The insurance policy is a service which actually covers the risk of loss due to some unwanted happenings with the person insured. The insurance policies also help the persons in saving their income tax and provide them lump sum money at the time of maturity of the policy so that the long term liabilities can be fulfilled with that money. The third construct is defined as the purpose of buying the insurance policy consists of eight manifest, eight residual and one latent variable. The third construct represents the perception of the policyholders about the different purpose of buying the insurance policy. The construct along with the set of variables are shown below in fig The regression weights of each variable as result of the construct are shown in table As shown in the table all the regression weights are high and significant. Hence the construct validity is ensured and can be concluded that the construct significantly explains the variables. The standardized regression weights as well as the multiple squared correlations are shown in table 5.92.The standardizes regression weights indicates comparative influence of the construct to its variables. The high 293
84 value of the standardized weights indicates the higher influence of the construct to the variable. The squared multiple correlations indicate the percentage of variance of the measured variable that can be explained with the help of the construct. The results indicate that the most important purpose of buying insurance policy is to provide death protection for family members in case of any untoward incident as well as the saving of the income tax. The results also indicate that another important purpose of buying insurance to provided once self some extra money in case of emergency (illness, accident). It can be concluded from the results that the purpose to cover the risk of life and to save the family members from the financial loss due to unwanted events in the life is the main purpose to buy the insurance policies. For service class policyholders the saving of income tax is another main reason to buy the insurance policy. TABLE 5.92: Regression Weights Purpose of Buying Purpose of Buying Estimate Standardised Regression Weight Squared Multiple Correlation S.E. C.R. P To provide myself with some extra money at the time of my retirement. To provide my dear ones with some extra money at the time of my retirement. To provide myself with some extra money in case of emergency (illness, accident). To avoid incurring unnecessary costs of insurance in future To invest/save money to maintain same life style over years To provide death protection for family members in case of any untoward incident To provide financial support to spouse *** *** *** *** *** *** To save tax *** 294
85 TABLE 5.93: Model Fit Purpose of Buying Model Fit Statistic Chi-square CFI.602 NFI.600 RFI.439 RMSEA.281 LO HI The squared multiple correlation of death protection, indicates that the 78 percent of the variance of the impact of insurance agent and friends can be explained with the help of the selection criteria. The statistics for goodness of fit of the model is shown in table The results indicate that the model is fit. The Chi-square value is presented in the matrices. The RMSEA value indicates the amount of unexplained variance or residual is large than 0.06 or less critical. CFI and NFI value are not in complete agreement but are very close to the criteria (0.90 or larger) for acceptable model. The model fit statistics from AMOS output is shown in the table FIGURE:
86 5.2.5 Buying Experience of the Policyholders Every policyholder is having the experience (good or bad) with the product or a service after buying it. To analyse the buying experience of the policyholder after the purchase of product is one of the purpose of the companies. Hence in the study the policyholders were asked to provide their perceptions regarding various aspects of their experience related with the insurance policy after buying it. The fourth construct is defined as the buying experience consists of 15 variable; seven manifest, seven residual and one latent variable. The fourth construct represents the factors related with various aspects of the buying experience of policyholders consists of seven manifest, seven residual and one latent variable. The construct along with the set of variables are shown below in figure 5.4. The regression weights (unstandardised and standardized) of each variable as result of the construct are shown in table As shown in the table all the regression weights are high and significant. Hence the construct validity is ensured and can be concluded that the construct significantly explains the variables. The standardized regression weights as well as the multiple squared correlations are shown in table 5.94.The standardizes regression weights indicates comparative influence of the construct to its variables. The high value of the standardized weights indicates the higher influence of the construct to the variable. The squared multiple correlations indicate the percentage of variance of the measured variable that can be explained with the help of the construct. The results indicate that the policyholder found that insurance is better than investing in stock market and also consider flexible investment plans to be risky. The rural policyholders with most of the urban policyholders may be risk averse and avoids investments in stocks and instruments related to stocks. When they compare the insurance policies with these instruments, they found it safe and feel better with the insurance policies. It can be concluded that although most of the insurance policies are not the investment products (except the ULIP or stock market related policies) but the policyholders have a tendency to compare then with the other investment plans and found it safe to put their money in insurance policies and feel safe. The squared multiple correlation of insurance is better than investment in stock market and flexible investment plans indicates that the 61 percent of the variance can be explained with 296
87 the help of buying experience. The fit of the model is shown in table The results indicate that the model is fit. TABLE 5.94: Regression Weights Buying Experience Buying Experience Premium amount gives me adequate coverage I feel secure after buying adequate insurance Insurance is better than investment in stock market Premium installments affordable for me I will receive guaranteed fund value Insurance policy will grant loan facility Flexible investment option plans are risky Estimate Standardise d Regression Weight Squared Multiple Correlation S.E. C.R. P *** *** *** *** *** *** TABLE 5.95: Model Fit Buying Experience Model Fit Statistic Chi-square CFI.787 NFI.784 RFI.676 RMSEA.215 LO HI The Chi-square value is presented in the matrices. The RMSEA value indicates the amount of unexplained variance or residual is large than 0.06 or less critical. CFI and NFI value are not in complete agreement but are very close to the criteria (0.90 or larger) for acceptable model. The model fit statistics from AMOS output is shown in the table

88 FIGURE: Service Attributes Influencing Policyholders in Selecting the Insurance Policy The services associated with the products increases the perceptive quality in the mind of policyholders. Their buying behavior and level of satisfaction also depends with the various attributes of services rendered by the company, agents, regulatory bodies etc. The fifth construct named as the service attributes influencing policyholders in selecting the insurance policy along with the set of variables are shown below in figure 5.5. The regression weights of each variable as result of the construct are shown in table 5.96 The fifth construct represents the various aspects of the service attributes and consists of twelve manifest, twelve residual and one latent variable. As shown in the table all the regression weights are high and significant. Hence the construct validity is ensured and can be concluded that the construct significantly explains the variables. The standardized regression weights as well as the multiple 298
89 squared correlations are shown in table 5.96.The standardizes regression weights indicates comparative influence of the construct to its variables. The high value of the standardized weights indicates the higher influence of the construct to the variable. The squared multiple correlations indicate the percentage of variance of the measured variable that can be explained with the help of the construct. The results indicate that the quality of services offered to the policyholders and reputation of the insurance company is the most influencing criteria for the policyholder of the insurance policy followed comfort and promptness provided to the policyholder. Ambience and experience of service provider also influence the policyholders in deciding the insurance policy. The squared multiple correlation of quality of services of insurance company indicates that the 90 percent of the variance of the impact quality of services can be explained with the help of the services attributes. The fit of the model is shown in table The results indicate that the model is fit. Service attributes TABLE 5.96 Regression Weights Service Attributes Estimate Standardised Regression Weight Squared Multiple Correlation Reputation and loyalty S.E C.R. P Ambience and experience *** Comfort and promptness *** Quality of services offered *** Hassel free paper work and documentation Presentation, appearance and surroundings Clarity of contract and terms in document SMS/Reminders about premium payment SMS/Reminder alerts about new products Information brochures, leaflets and letters Application of latest technology in providing services Company is having memorable advertisement *** *** *** *** *** *** *** *** 299

90 TABLE 5.97: Model Fit Service Attributes Model Fit Statistic Chi-square CFI.664 NFI.661 RFI.585 RMSEA.260 LO HI The Chi-square value is presented in the matrices. The RMSEA value indicates the amount of unexplained variance or residual is large than 0.06 or less critical. CFI and NFI value are not in complete agreement but are very close to the criteria (0.90 or larger) for acceptable model. The model fit statistics from AMOS output is shown in the table FIGURE:
91 5.2.7 Product Attributes Influencing Policyholders in Selecting the Insurance Policy Insurance companies are offering various products with tremendous benefits to satisfy the policyholders. These insurance products are developed after immense efforts, research, financial analysis and policyholder involvement. Therefore before conducting any parallel study it is important to describe product attributes. The sixth construct named as the product attributes influencing policyholders in selecting the insurance policy along with the set of variables are shown below in figure 5.7. The sixth construct represents the various aspects of the product attributes and consists of nine manifest, nine residual and one latent variable. The regression weights of each variable as result of the construct are shown in table As shown in the table all the regression weights are high and significant. Hence the construct validity is ensured and can be concluded that the construct significantly explains the variables. The standardized regression weights as well as the multiple squared correlations are shown in table The standardizes regression weights indicates comparative influence of the construct to its variables. The high value of the standardized weights indicates the higher influence of the construct to the variable. The squared multiple correlations indicate the percentage of variance of the measured variable that can be explained with the help of the construct. The results indicate that the tax benefits given to the policy holders is the most influencing criteria for the policyholder of the insurance policy. The squared multiple correlation of tax benefits given to the policy holders indicates that the 73 percent of the variance of the impact of tax benefits that can be explained with the help of the product attribute. The fit of the model is shown in table The results indicate that the model is fit. The Chi-square value is presented in the matrices. The RMSEA value indicates the amount of unexplained variance or residual is large than 0.06 or less critical. CFI and NFI value are not in complete agreement but are very close to the criteria (0.90 or larger) for acceptable model. The model fit statistics from AMOS output is shown in the table
92 Table 5.98: Regression Weights Product Attributes Product Attributes Estimate Standardised Regression Weight Squared Multiple Correlation S.E. C.R. P Type of insurance plan (pension, growth, term) Risk coverage Premium or cost of coverage Variety and associated range of products Tax benefits Payment option (mode of payment) Product flexibility (surrender, loan, revival) Maturity period and grace period Growth and benefits TABLE 5.99 Model Fit Product Attributes Model Fit Statistic Chi-square CFI.677 NFI.674 RFI.565 RMSEA.247 LO HI

93 FIGURE: The Agents Attributes Influencing Policyholders in Selecting the Insurance Policy The operations in insurance industry are influenced by strong agent s network. Most of the insurance companies are running on the shoulders of insurance agents and marketing of insurance, increasing base, providing policyholder satisfaction, retaining policyholders and customer relationship management is the whole sole responsibility of the agents. The strong network of agents and insurance advisors are significantly contributing for the development and marketing of insurance products. The seventh construct named as the factors influencing policyholders in selecting the insurance policy along with the set of variables are shown below in figure 5.7. The fifth construct represents the various aspects of the agents attributes and consists of seventeen manifest, seventeen residual and one latent variable. The regression weights of each variable as result of the construct are shown in table As shown in the table all the regression weights are high and significant. Hence 303
94 the construct validity is ensured and can be concluded that the construct significantly explains the variables. The standardized regression weights as well as the multiple squared correlations are shown in table The standardizes regression weights indicates comparative influence of the construct to its variables. The high value of the standardized weights indicates the higher influence of the construct to the variable. The squared multiple correlations indicate the percentage of variance of the measured variable that can be explained with the help of the construct. Agent s Attributed Agent provides error free services Committed to fulfill promises timely Perform the service right in first instance Provides accuracy (such as payment record) TABLE Regression Weights Agents Attributes Estimate Standardised Regression Weight Squared Multiple Correlation S.E. C.R. P *** *** *** Providing satisfactory services *** Prompt, responsive and reliable *** Cooperative and friendly *** Known and trustworthy *** Properly remind about the due premium. Explain features, advantages and benefits of policy Thoroughness of follow up on questions/ enquiries/ requests prior to purchase decision *** *** *** Attire of the agent is acceptable *** Attitude of agent towards policyholders is good Behaviour of agent is good with policyholders Agent have enough past experience in the field Attention focused on your priorities Awareness about terms and conditions of policy *** *** *** *** *** 304
95 TABLE 5.101: Model Fit Statistics Agents Attributes Model Fit Statistic Chi-square CFI.869 NFI.841 RFI.864 RMSEA.162 LO HI The results indicate that tthoroughness of follow up on questions/ enquiries/ requests prior to purchase decision of the agent is the most influencing criteria for the policyholder of the insurance policy followed by the positive attitude of agent towards policyholders. Several other attributes also influence the policyholders of insurance policy such as good behaviour of agent, his extended cooperation and help to the policyholders, trustworthiness, accuracy in record keeping and explanation given to the policyholder. The squared multiple correlation of tthoroughness of agent and follow up on questions/ enquiries/ requests prior to purchase decision indicates that the 87 percent of the variance of the impact of insurance agent on buying that can be explained with the help of the agents attributes. The fit of the model is shown in table The results indicate that the model is fit. The Chi-square value is presented in the matrices. The RMSEA value indicates the amount of unexplained variance or residual is large than 0.06 or less critical. CFI and NFI value are not in complete agreement but are very close to the criteria (0.90 or larger) for acceptable model. The model fit statistics from AMOS output is shown in the table

96 FIGURE: Other Attributes Influencing Policyholders in Selecting the Insurance Policy Financial practices, insurance regulations, saving pattern, tax benefits and certain other factors also influence a policyholder while finalizing an insurance plan. Therefore it is important to understand insurance market and various other factors that may influence a policyholder. The eight construct named as the other factors influencing policyholders in selecting the insurance policy along with the set of variables are shown below in figure 5.8. The fifth construct represents the other attributes influencing buying decisions consists of four manifest, four residual and one latent variable. The regression weights of each variable as result of the construct are shown in table As shown in the table all the regression weights are high and significant. Hence the construct validity is ensured and can be concluded that the construct significantly explains the variables. The standardized regression weights as well as the multiple squared correlations are shown in table The standardizes regression weights indicates comparative influence of the construct to its variables. The high value of the 306
97 standardized weights indicates the higher influence of the construct to the variable. The squared multiple correlations indicate the percentage of variance of the measured variable that can be explained with the help of the construct. The results indicate that the agent of the insurance company is the most influencing criteria for the policyholder of the insurance policy is the State Financial Policy and interest rates followed by novelty of products in the insurance market. The squared multiple correlation of State Financial Policy and interest rates indicates that the 70 percent of the variance of the impact of State Financial Policy and interest rates that can be explained with the help of the other influential factors. The fit of the model is shown in table The results indicate that the model is fit. TABLE Regression Weights Other Attributes Other Attributes Estimate Standardised Regression Weight Squared Multiple Correlation S.E. C.R. P The State financial policy and interest rates Novelty products on the insurance market. Details of insurance terms and conditions. Legal aspects of the policy I consider *** *** *** TABLE Model Fit Other Attributes Model Fit Statistic Chi-square CFI.855 NFI.854 RFI.563 RMSEA.322 LO HI The Chi-square value is presented in the table The RMSEA value indicates the 307
 for acceptable model. The model fit statistics from AMOS output is shown. FIGURE: 5.")
98 amount of unexplained variance or residual is large than 0.06 or less critical. CFI and NFI value are not in complete agreement but are very close to the criteria (0.90 or larger) for acceptable model. The model fit statistics from AMOS output is shown. FIGURE: 5.8 CONSTRUCT MODEL - 1 The policyholders until and unless realize the need or a want, cannot go for actual buying the product. The policyholder if aware tries to get the information about the product as much as possible. For a policyholder there are various sources of getting information. These are friends, family members, employers, agents, advisors, relatives etc. These persons not only provide the information to the policyholder but also influence the buying behavior of the policyholder. In addition to this the insurance companies also take the help of many media for passing the information to the policyholders. These sources include TV, internet, websites, phone calls, s, 308
99 agents etc. Hence it can be said that the policyholder is having influence from his possible contacts as well as the sources of information used by the companies. Both will increase the level of awareness in the mind of policyholders and make him felt the need of having the insurance policy. The policyholder becomes aware about the nature, variety and the advantage of the product. Hence the policyholder at this stage has the purpose of buying the insurance policies. After buying the policy the policyholder have after sales experience with the product which influences from the purpose of buying the product. The above explained theory was tested using structural equation modeling using the software AMOS. The degree of freedom was 100 and probability level was less than The model along with the required out is shown in table The number of the variables in this model is provided below: TABLE 5.104: Summary of Model 1 Number of variables in model: 38 Number of observed variables: 16 Number of unobserved variables: 22 Number of exogenous variables: 20 Number of endogenous variables: 18 The results indicates that the suggestions from agents, friends etc have significant impact on the purpose of buying. Although the different sources of information used by the company is having negative impact of the purpose of buying. The purpose of buying significantly influences the buying experiences of the policyholder with the product. The squared multiple correlation of indicates that 80 percent of the variations in the buying experience can be explained by the variations in the purpose of buying. The results also indicate the positive correlations of between the suggestions and the different sources of information. The goodness of fit indices Are sown in table indicates that the tested structural model is fit. 309
100 TABLE 5.105: Regression Weights Model- 1 Name of the Variable Estimate S.E. C.R. P Purpose of Buying Suggestions *** Purpose of Buying Buying Experience Source of Information Purpose of Buying *** *** TABLE 5.106: Standardized Regression Weights Model- 1 Name of the Variable Standardised Regression Weight Squared Multiple Correlation Purpose of Buying Suggestions Purpose of Buying Source of Information Buying Experience Purpose of Buying TABLE 5.107: Correlations Model- 1 Name of the Variable Estimate Sourse of Information <--> Suggestions.591 TABLE: Model Fit Statistics Model- 1 Model Fit Statistic Chi-square CFI.722 NFI.795 RFI.754 RMSEA.156 LO HI
 for acceptable model. The model fit statistics from AMOS output is shown in the table.")
101 The Chi-square value is presented in the table The RMSEA value indicates the amount of unexplained variance or residual is large than 0.06 or less critical. CFI and NFI value are not in complete agreement but are very close to the criteria (0.90 or larger) for acceptable model. The model fit statistics from AMOS output is shown in the table. The goodness of fit indices (CFI, NFI and RFI are greater than 0.7) indicates the fitness of the model also the badness of fit the RMSEA, LO 90 and HI 90 found to be very low hence it can be concluded that the product and the agents attributes significantly influences the purpose of buying which ultimately influence the buying behavior of the policyholder. FIGURE: 5.9 CONSTRUCT MODEL-1 311
102 CONSTRUCT MODEL-2 The product is a combination of different associated attributes related to the service, agent and other factors. These all attributes are supposed to have significant influence on the purpose of buying the insurance policy. As studied in the theory of marketing the intangible services related to the product are the marketing tools in the hands of companies influence the buying behavior of the policyholders. The efficient use of these tools which comes under 3Ps of marketing of services can increase the demand and hence the sales of insurance products in the market. After buying the insurance product the experience of the policyholder with the insurance policy is supposed to be influence the purpose of buying. When the performance of the product matches with the expectations of the policyholders, while buying the product the policyholder will feel satisfied otherwise dissatisfaction cause in the mind of policyholders. The above explained theory was tested applying structural equation modeling using the software AMOS. The degree of freedom was 241 and probability level was less than The model along with the required out is shown in table The number of the variables in this model is provided below: TABLE 5.109: Summary of Model 2 Number of variables in your model: 56 Number of observed variables: 24 Number of unobserved variables: 32 Number of exogenous variables: 30 Number of endogenous variables: 26 The above proposed theory was tested by applying the structural equation modeling assuming that the different attributes associated in the buying process with the product influences the buying behavior of the policyholder which also results into the structural equation model is shown form table no to The structural model is also shown in figure The results indicate that the product attributes having the most significant impact in explaining the purpose of buying the insurance 312
103 policy followed by the agents attributes. The results also indicate that service attributes as well as other attributes are not significantly influenced the purpose of buying the insurance policy. The purpose of buying has a significant impact on the buying experience as shown by the standardized regression weight The goodness of fit indices (CFI, NFI and RFI are greater than 0.7) indicates the fitness of the model also the badness of fit the RMSEA, LO 90 and HI 90 found to be very low hence it can be concluded that the product and the agents attributes significantly influences the purpose of buying which ultimately influence the buying behavior of the policyholder. TABLE 5.110: Regression Weights Model- 2 Name of the Variable Estimate S.E. C.R. P Purpose Service Purpose Product *** Purpose Agent *** Purpose Others Buying Experience Purpose *** TABLE 5.111: Standardized Regression Weights Model- 2 Endogenous variable Exogenous variable Estimate Purpose Service.130 Purpose Product.457 Purpose Agent.276 Purpose Others Buying Experience Purpose
104 TABLE 5.112: Correlations Model- 2 Name of the variable Estimate Agent Product.681 Agent Others.249 Service Product.762 Agent Service.912 Service Others.276 Product Others.156 TABLE 5.113: Model Fit Statistics Model- 2 Model Fit Statistic Chi-square CFI.773 NFI.766 RFI.732 RMSEA.151 LO HI The Chi-square value is presented in the table The RMSEA value indicates the amount of unexplained variance or residual is large than 0.06 or less critical. CFI and NFI value are not in complete agreement but are very close to the criteria (0.90 or larger) for acceptable model. The model fit statistics from AMOS output is shown in the table TABLE 5.114: Comparisons of Models Model Fit Model 1 Model 2 Chi-square P CFI NFI RFI RMSEA LO HI
 in best possible manner as compared to model-1. FIGURE: 5.")
105 Since the CFI, NFI, RFI and RMSEA values are more closed to acceptable criteria in case of Model 2. It is concluded that Model 2 is explaining the constructs (higher CFI value and low RMSEA, LO 90 and HI90 as compared to model -1) in best possible manner as compared to model-1. FIGURE: 5.10 CONSTRUCT MODEL MEAN SCORE AND STANDARD DEVIATIONS OF DIFFERENT ASPECTS OF BUYING BEHAVIOR OF POLICYHOLDERS IN CASE OF INSURANCE PRODUCTS TABLE 5.115: Mean Values Selection Criteria Selection Criteria Mean Std. Deviation Nobody Influenced me, it was my own decision My Employer's suggestion Recommended by family member My Friend's Suggestion Insurance agent's Suggestion My Spouse's Suggestion Recommended during advertisement
106 The table shows mean values of the factors related to selection criteria used by the sample policyholders for buying insurance plan. Insurance agent plays crucial role while suggesting insurance policy to the policyholders with mean value TABLE Mean Values Source of Information Source of information Mean Std. Deviation Television Internet/ s Agent Office/Workplace Circular/Notices Spouse/Children Friends Insurance Experts/Advice Word of Mouth Bankers Promotional telephone call/sms
107 The table shows mean values of the sources of information used by the sample policyholders for buying insurance plan. The role of insurance agent and insurance expert was found to be significant while suggesting insurance policy to the sample policyholders with their respective mean values 4.44 and TABLE 5.117: Mean Values Purpose of Buying Source of information Mean Std. Deviation Extra money at the time of retirement Some extra money at the time of my retirement to my dear ones Extra money in case of emergency, illness, accident To avoid incurring un necessary cost of insurance in future To invest/ save money to maintain same life style over years To provide death protection for family To provide financial support to spouse To save tax
108 The table shows mean values of the basic purpose of buying insurance plan. It was observed that the policyholders buy insurance for various purposes such as to provide death protection for family, to provide financial support to spouse, to save tax, to provide themselves with extra money in case of emergency or illness and to provide extra money at the time of retirement. With mean value 4.62 death protections was considered to as the most basic purpose of buying insurance plan. TABLE Mean Values Buying Experience Source of information Mean Std. Deviation Premium amount gives adequate coverage Feel secure after buying adequate insurance Insurance is better than investment in stock market Premium installments are affordable for me I will receive guaranteed fund value Insurance policy will grant loan facility Flexible investment option plans are risky
109 The table shows mean values of the buying experience related to insurance policy. It was observed that the policyholders shown differed responses related to their buying experiences. With mean value 4.29 policyholders felt secure after buying insurance policy. With mean value 4.18 policyholders also felt that insurance is better than investment in stock market. TABLE 5119: Mean Value Service attributes Source of information Mean Std. Deviation Reputation and loyalty Ambience and experience Comfort and promptness Quality of services offered Hassle free paperwork and documentation Presentation appearance and surroundings Clarity of contract and terms in documents SMS/Reminders about the premium installments SMS/Reminders about new products Information brochures, leaflets and letters Application of latest technology in their services Company is having memorable advertisement
110 The table shows mean values of the influential service attributes while buying an insurance policy. With mean value 4.18 policyholders felt that quality of services offered was the most influential parameter followed hassle free paper work and documentation, clarity of contract, reputation and ambience. TABLE 5.120: Mean Value Product Attributes Product Attributes Mean Std. Deviation Type of insurance plan Risk coverage Premium or cost of coverage Variety and associated range of products Tax benefits Payment option Product flexibility Maturity period and grace period Growth benefits
111 The table shows mean values of the influential product attributes related to insurance policy. With mean value 4.6 policyholders felt product flexibility was the most influential criteria followed by premium amount with mean value TABLE 5.121: Mean Values Agents Attributes Agent Attribute Mean Std. Deviation Error free services Committed to fulfil promises timely Perform the service right in the first instance Provides accuracy Providing satisfactory services Prompt responsive and reliable Cooperative and friendly Known and trustworthy Properly remind about the due premium Explain features advantages and benefits of the policy Thoroughness of follow up of questions/ inquiries/request Attire of agent Attitude of agent towards policyholder Behaviour of agent is good Past experience Attention focused on priorities Awareness about terms and conditions of policy
 was the most influential parameters followed by agent s commitment. TABLE 5.")
112 The table shows mean values of the influential agents attributes at the time of buying insurance policy. With mean value 4.34 policyholders felt error free services, agent s awareness about terms and conditions of policy (mean value.9) was the most influential parameters followed by agent s commitment. TABLE Mean Values Other Attributes Other Factors Mean Std. Deviation Novelty products in insurance market Details of insurance terms and conditions Legal aspects of the policy
113 The table shows mean values of the other influential factors while buying insurance policy. With mean value 3.77 the details of terms and conditions provided to the policyholder was the most influential parameters followed by legal aspects of the insurance contract. 5.4 POLICYHOLDER BUYING BEHAVIOR FOR INSURANCE POLICIES WITH RESPECT TO URBAN AND RURAL BACKGROUND Insurance as a product now becomes a necessarily for every policyholder irrespective of their different demographic, psychographic and geographic profiles. In the study the responses of different policyholders/buyer from different regions were collected through personal contact method with the help of self-designed questionnaire. The background of the policyholder in terms of region (urban and rural) supposed to be influences the buying behavior of the policy holder. In order to analyze the difference in the buying pattern and decision making process of the policyholder in case of insurance policy independent sample t-tests were applied. The inferences were drawn between urban and rural policyholders with respect to their buying pattern and decision process in different aspects of selection of insurance policies and buying experience. Here, the independent sample t-test was applied in order to test the significance of difference between policyholders from different regional background (Rural and Urban) in terms of various aspects of their attitude, information search and buying behavior with respect to insurance policies offered by different companies. The results of independent sample t-test are shown below from table no to Hypothesis-1 H O : There is no significant difference between urban and rural policyholders in terms of suggestions received by policyholders for buying Insurance policies. H A : There is a significant difference between urban and rural policyholders in terms of suggestions received by policyholders for buying Insurance policies. 323
114 The above mentioned hypothesis was tested and chi-square test was applied for understanding association between variables. As shown in the table the p value of the chi-square statistics is less than.05 hence the null hypothesis that there is no association between rural and urban region and decision of selecting insurance policy is rejected. Hence it is inferred that there is a significant association between rural and urban region and decision of selecting insurance policy The above mentioned hypothesis was tested and independent sample t-test was applied to draw the inferences between rural and urban policyholders. The independent sample t-test, in general, is used to analyze the difference between two independent samples in terms of interval or ratio variable. The rule of thumb in case of independent sample t-test is that, with 95% confidence level if the p-value is less than 0.05 or t statistic is more than 2, the null hypothesis was rejected in the favour of alternate hypothesis. The results of independent sample t-test to analyze the difference between rural and urban policyholder in terms of different factors influencing their decision for selecting the insurance policy is shown in table no The result indicates that there exists a significant difference in the behavior of rural and urban policyholders since the p value in most of the cases was less than 0.05 (except in case of employer suggestion and recommendation by the family members). The results also indicate that rural policyholders take their decisions at their own consciousness followed by the suggestion from the insurances agents. Whereas in case of urban policyholders the most influential source of information were suggestions received from the agents, suggestion from spouse, family members and the friends. Hence it can be concluded from the results that urban policyholders select the insurance policy by consulting the decision with agent, friends, family members and spouse etc. the result also indicated that advertisement and suggestion from the employer were the least significant factors influencing the buying decisions. 324
115 TABLE 5.123: Independent Sample T-Test W.R.T. Different Factors Influencing The Policyholder s Decision Of Selecting Of The Insurance Policy. Rural Urban T- Statistic (P value) Remark Chisquare Remark Nobody Influenced me, it was my own decision a Difference My Employer's suggestion (0.194) No Difference a Recommended by family member (0.058) Border line difference a My Friend's Suggestion (0.000) Difference a Insurance agent's Suggestion (0.000) a Difference My Spouse's Suggestion (0.000) Difference a Recommended during advertisement (0.000) Difference a Hypothesis-2 H O : The source of information has a significance influence on selection of policy and post-purchase behavior among rural and urban policyholders. H A : The source of information has a significance influence on selection of policy and post-purchase behavior among rural and urban policyholders. The above mentioned hypothesis was tested and chi-square test was applied for understanding association between variables. As shown in the table the p value of the chi-square statistics is less than.05 hence the null hypothesis that there is no association between rural and urban region and source of information for buying insurance policy is rejected. Hence it is inferred that there is a significant association between rural and urban region and source of information in selecting life insurance policy 325
116 The above mentioned hypothesis was tested and independent sample t-test was applied to draw the inferences between rural and urban policyholders. The independent sample t-test, in general used to analyze the difference between two independent samples in terms of interval or ratio variable. The rule of thumb in case of independent sample t-test is that, with 95% confidence level if the p-value is less than 0.05 or t statistic is more than 2, the null hypothesis was rejected in the favour of alternate hypothesis. The results of independent sample t-test to analyze the difference between rural and urban policyholder in terms of different factors influencing their decision of selecting the insurance policy is shown in table no The result indicates that there exists a significant difference in the behavior of rural and urban policyholders since the p value in most of the cases was less than The different sources of information about insurance policies add the level of awareness and importance to the policyholders. The necessity of insurance policies influences the buying decision of the policyholders. The companies in insurance sector take the help of different sources to provide the information about their insurance policies through different sources. The various sources of providing the information are the newspaper, magazine, advertisement through television, insurance experts, bankers, workplace circulars, spouse, promotional telephone calls, internet, word of mouth, insurance agent and friends. Therefore independent sample t-test was applied to analyze the difference of the importance of these sources between urban and rural policyholders. The results indicated that there was significant difference between urban and rural policyholders in terms of the role of different sources of information except in case of insurance agents and insurance experts and advisor. Hence the null hypothesis is rejected in the favour of alternate hypothesis. However in case of the role of insurance experts and advisors is found to be same for both urban and rural policyholders. The results indicated that the mean score of urban policyholders was significantly higher than rural policyholders and the most influencing sources of information for urban policyholders was insurance agents, experts and advisor. In case of rural policyholders the major sources of information were insurance agent and advisors. 326

117 TABLE : T-Statistics Sources of Information Region Rural Urban T-Statistic Remark Chisquare Value Remark News paper /magazines Difference a Signific ant Television Difference a Signific ant Internet / s Difference.139 a Signific ant Agent Difference a Signific ant Office/Workplace Circular/Notices Difference a Signific ant Spouse/children Difference a Signific ant Friends Difference a Signific ant Insurance Experts/advisors (.793) Border line difference a Signific ant Word of mouth Difference a Signific ant Bankers Difference a Signific ant Promotional telephone call/sms Difference a Signific ant 327

118 Hypothesis-3 H O : The purpose of buying insurance policy is not different among rural and urban policyholders. H A: The purpose of buying insurance policy is different among rural and urban policyholders. The above mentioned hypothesis was tested and chi-square test was applied for understanding association between variables. As shown in the table the p value of the chi-square statistics is less than.05 hence the null hypothesis that there is no association between rural and urban region and purpose of buying insurance policy is rejected. Hence it is inferred that there is a significant association between rural and urban region and purpose of buying life insurance policy Every product or a service has a purpose of satisfying some need or want of the policyholder. If a policyholder buys the insurance policy, this is because he wants to fulfill his need or some requirement. It is also possible that the purposes of buying insurance policy for different policyholders are different. The efforts were made in the study to analyze the importance of various identified purpose of buying insurance policy for rural and urban policyholders. The independent sample t-test was applied to test the null hypothesis of no difference between rural and urban policyholders in terms of their purpose of buying the insurance policy. The mean score and t-statistics of independent sample t-test is shown in the table Hence the null hypothesis is rejected in the favour of alternate hypothesis. The results indicates that there exists significant difference between rural and urban policyholder except in case of providing extra money at the time of their retirement 328
119 (p value = 0.462). In case of rural policyholders the basic purpose of buying insurance policy is to provide death protection to their family members, availability of extra money in case of emergency and to have financial support to family members in future whereas in case of urban policyholders the purpose is slightly different. The urban policyholders buy insurance policy to save tax, to provide extra money against unwanted happenings and to provide financial support to family members in future. TABLE : T-Statistics Purpose of Buying the Insurance Policy. Purpose of buying the Insurance policy. To provide myself with some extra money at the time of my retirement. To provide my dear ones with some extra money at the time of my retirement. To provide myself with some extra money in case of emergency (illness, accident). To avoid incurring unnecessary costs of insurance in future To invest/save money to maintain same life style over years To provide death protection for family members in case of any untoward incident To provide financial support to spouse Rural Region Urban To save tax T- Statistic (.004).735 (.462) (.024) P value Border line difference Border line difference Difference Difference Difference Border line difference Difference Difference Chisquare Value a a a a a a a a Remark 329

120 Hypothesis-4 H O : The buying experience of insurance policy is not different among rural and urban policyholders. H A: The buying experience of insurance policy is different among rural and urban policyholders. The above mentioned hypothesis was tested and chi-square test was applied for understanding association between variables. As shown in the table the p value of the chi-square statistics is less than.05 hence the null hypothesis that there is no association between rural and urban region and buying experience is rejected. Hence it is inferred that there is a significant association between rural and urban region and buying experience. After buying the insurance policy different policyholders have different buying experiences from their insurance policies. The independent sample t- test was applied to test the null hypothesis between rural and urban and policyholders in term of their buying experience after buying their insurance policies. The results of independent sample t-test along with their individual mean scores are shown in table 330
121 The result indicates that there exists no significant difference in terms of adequate coverage by the premium, feeling of security and affordable premium installments for both rural and urban policyholders. Hence the alternate hypothesis is rejected in the favour of null hypothesis. The results also indicates that there exists significant difference between rural and urban policyholders in terms of their perceptions of insurance policies as an investment, receiving guaranteed fund values, loan facility available with insurance policy and the comparison of insurance policies with other investment plans. The urban policyholder feel adequately secured after buying insurance policy and consider insurance policy better than other investment plans whereas the rural policyholder is not aware of other investments plans and consider it much safer and feel adequately safe with affordable premium installments. TABLE : T-Statistics Region Rural Urban T- Statistic P value Chisquare Value Remark Premium amount gives me adequate coverage (.587) Border line difference a (.345) Not significant I feel secure after buying adequate insurance (.621) Border line difference a (.063) Not significant Insurance is better than investment in stock market (.040) Border line difference a Premium instalments are affordable for me (.201) Border line difference a (.031) I will receive guaranteed fund value (.001) Border line difference a Insurance policy will grant loan facility Difference a Flexible investment option plans are risky Difference a 331

122 Hypothesis-5 H O : The service attributes influencing selection of insurance policy are not different among rural and urban policyholders. H A: The service attributes influencing selection of insurance policy are different among rural and urban policyholders. The above mentioned hypothesis was tested and chi-square test was applied for understanding association between variables. As shown in the table the p value of the chi-square statistics is less than.05 hence the null hypothesis that there is no association between rural and urban region and service attributes influencing selection of insurance policy is rejected. Hence it is inferred that there is a significant association between rural and urban region and service attributes influencing selection of insurance policy. The service attributes of insurance agent, insurance company also play very important role in selection process of insurance product by the policyholder in order to analyze 332
123 the relative importance of these service attributes with respect to the rural and urban policyholders. Independent sample t-test was applied the results of independent sample t-tests were shown in the table The result indicates there exists significant difference between rural and urban policyholders in term of their perception about various service attributes between rural and urban policyholders the results indicate that for a rural policyholder the most influencing service attributes are the quality of service offered, clarity of contract and term in documents, hassle free paper work and proper documentation, reputation and loyalty and ambience and experience whereas urban policyholders is more concerned about the quality of services offered, reputation and loyalty and ambience and experience. Hence the null hypothesis is rejected in the favour of alternate hypothesis. 333
124 TABLE 5.127: T-Statistics Service Attributes Region Rural Urban T- Statistic P value Chisquare Value Remark Reputation and loyalty Difference a Ambience and experience Difference a Comfort and promptness Difference a Quality of services offered Difference a Hassel free paper work and documentation (.001) Border line difference a Presentation, appearance and surroundings (.431) Border line difference a Clarity of contract and terms in document Difference a SMS/Reminders about premium payment Difference a SMS/Reminder alerts about new products Difference a Information brochures, leaflets and letters Difference a Application of latest technology in providing services Difference a Company is having memorable advertisement (.003) Border line difference a 334

125 Hypothesis-6 H O : The products attributes influencing selection of insurance policy are not different among rural and urban policyholders. H A: The products attributes influencing selection of insurance policy are different among rural and urban policyholders. The above mentioned hypothesis was tested and chi-square test was applied for understanding association between variables. 335
126 As shown in the table the p value of the chi-square statistics is less than.05 hence the null hypothesis that there is no association between rural and urban region and products attributes influencing selection of insurance policy is rejected. Hence it is inferred that there is a significant association between rural and urban region and products attributes influencing selection of insurance policy. It was found that there the association between rural or urban region and growth and benefit is insignificant. The product attributes of types of insurance policy, benefits provided by insurance company also play very important role in selection process of insurance product by the policyholder in order to analyse the relative importance of these product attributes with respect to the rural and urban policyholders. Independent sample t-test was applied the results of independent sample t-tests were shown in the table The results indicate that the product attributes play most important role in selection of insurance policy for both rural and urban policyholders as the mean score of different aspect of product attribute is more than 4 in the scale of 1-5.No statistical difference is found in between rural and urban policyholders in case of type of insurance plan, premium, product flexibility, grace period since these factors are same for both the type of policyholders, whereas significant difference between rural and urban policyholder is found in case of risk coverage, variety in the products, tax benefits, payment options and growth and benefits. Hence the alternate hypothesis is rejected in the favour of null hypothesis. The result indicates that the behavior of rural and urban is different in case of the qualitative parameters associated with the insurance policies such as risk coverage, variety of products and growth and benefits from insurance policy in case of tax benefits there is also significant difference is found between rural and urban policyholders. For a rural policyholder the most influencing product attribute is found to be flexibility in the product, risk coverage, payment option and cost of payment whereas for urban policyholders the most important policyholder attributes is found to be product flexibility, premium payment option and tax benefits. 336
 Border line difference 20.155 a Risk coverage 4.55 4.33 4.538 Difference 33.062 a Premium or cost of coverage 4.51 4.46 1.084 (.279) Border line difference 15.660 a (.")
127 TABLE 5.128: T-Statistics Product Attributes Region Rural Urban T- Statistic P value Chisquare Value Remark Type of insurance plan (pension, growth, term) (.306) Border line difference a Risk coverage Difference a Premium or cost of coverage (.279) Border line difference a (.001) Variety and associated range of products Difference a Tax benefits Difference a (.037) Payment option (mode of payment) (.024) Border line difference a Product flexibility (surrender, loan, revival) (.0530) Border line difference a Maturity period and grace period (.050) Border line difference a Growth and benefits (.042) Border line difference a (.118) Not significant 337

128 Hypothesis-6 H O : The agent s attributes influencing selection of insurance policy are not different among rural and urban policyholders. H A: The agent s attributes influencing selection of insurance policy are different among rural and urban policyholders. The above mentioned hypothesis was tested and chi-square test was applied for understanding association between variables. As shown in the table the p value of the chi-square statistics is less than.05 hence the null hypothesis that there is no association between rural and urban region and agent s attributes influencing selection of insurance policy is rejected. Hence it is inferred that there is a significant association between rural and urban region and agent s attributes influencing selection of insurance policy. In order to analyse the relative importance of these agent attributes with respect to the rural and urban policyholders. Independent sample t-test was applied the results of independent sample t-tests were shown in the table The result indicates that the exists significant difference in the perception of rural and urban policyholders in terms of various attributes of insurance agents. For a rural policyholder the most influencing attribute of the agent is error free services from the agent, awareness about terms and conditions about the policy, behavior of the agent, friendly nature of the agent and commitment of agent to fulfill the promises. For urban policyholders in addition to error free services by the agent which is the most influencing attribute of insurance agent are satisfactory services, friendly behavior, responsiveness to the queries and explanation about the police are the most influencing attributes. 338
129 TABLE 5.129: T-Statistics Agent Attributes Rural Region Urban T- Statistic P value Chisquare Value Remark Agent provides error free services Difference a Committed to fulfill promises timely Difference a Perform the service right in first instance Difference a (.001) Provides accuracy (such as payment record) Difference a Providing satisfactory services Difference a Prompt, responsive and reliable Difference a Cooperative and friendly Difference a Known and trustworthy Difference a Properly remind about the due premium Difference a Explain features, advantages and benefits of the policy Difference a Thoroughness of follow up on questions/ enquiries/ requests prior to purchase decision Difference a Attire of the agent is acceptable Difference a Attitude of agent towards policyholders is good Difference a Behaviour of agent is good with policyholders Difference a Agent have enough past experience in the field Difference a Attention focused on your priorities Difference a Awareness about terms and conditions of policy Difference a 339
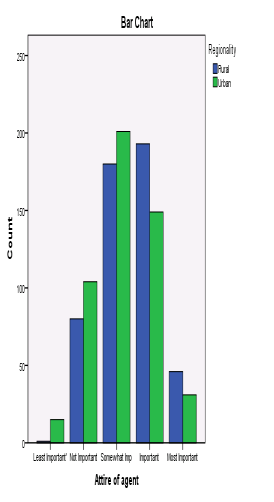
130 340

131 Other factors The other factors also play important role in buying therefore in order to analyse the relative importance of these factors with respect to the rural and urban policyholders. Independent sample t-test was applied the results of independent sample t-tests were shown in the table TABLE 5.130: T-Statistics Other Factors Rural Region Urban T- Statistic P value Chisquare Value Remark The State Financial Policy and Interest rates (.396) Border line difference a Novelty products in insurance market (.019) Border line difference a (.001) Details of insurance terms and conditions Difference a Legal aspects of the policy Difference a 341
Summary A Contemporary Study of Factors Influencing Urban and Rural Consumers for Buying Different Life Insurance Policies in Haryana.
 Summary The topic of research was A Contemporary Study of Factors Influencing Urban and Rural Consumers for Buying Different Life Insurance Policies in Haryana. Summary of the thesis presents an overview
A Comparative Analysis of Investor s Risk Perceptions towards Public & Selected Private Life Insurers in Jabalpur District of Madhya Pradesh.
 A Comparative Analysis of Investor s Risk Perceptions towards Public & Selected Private Life Insurers in Jabalpur District of Madhya Pradesh Dr. Anshuja Tiwari & Ms. Babita Yadav Abstract The deregulation
Chapter 7 SUMMARY- FINDINGS AND SUGGESTIONS
 Chapter 7 SUMMARY- FINDINGS AND SUGGESTIONS In academic field the research is an ongoing process that knows no limits and no full stops. Even then the main findings emerging out of the present study have
A STUDY ON FACTORS AFFECTING CUSTOMERS INVESTMENT TOWARDS LIFE INSURANCE POLICIES
 106 A STUDY ON FACTORS AFFECTING CUSTOMERS INVESTMENT TOWARDS LIFE INSURANCE POLICIES ABSTRACT MS. BABITA YADAV*; DR. ANSHUJA TIWARI** *Research Scholar, Faculty of Commerce, R.D.V.V, Jabalpur. **Assistant
EXECUTIVE SUMMARY OF MINOR RESEARCH PROJECT (UGC) _ Mr Ishwara Gowda
 _ Mr Ishwara Gowda") EXECUTIVE SUMMARY OF MINOR RESEARCH PROJECT (UGC) _ Mr Ishwara Gowda TITLE: AWARENESS OF RURAL INSURANCE SCHEMES:-A SPECIAL STUDY OF RURAL INSURANCE AND LIC WITH REFERENCE TO BELTHANGADY TALUK. It is a
EXECUTIVE SUMMARY OF MINOR RESEARCH PROJECT (UGC) _ Mr Ishwara Gowda TITLE: AWARENESS OF RURAL INSURANCE SCHEMES:-A SPECIAL STUDY OF RURAL INSURANCE AND LIC WITH REFERENCE TO BELTHANGADY TALUK. It is a
Attitude of Working Women towards Investing In Life Insurance with Special Reference to Private Bank Employees Of Coimbatore City
 Attitude of Working Women towards Investing In Life Insurance with Special Reference to Private Bank Employees Of Coimbatore City S.VINOTH Assistant Professor RVS Institute of Management Studies and Research
CHAPTER 5 FINANCIAL REPORTING PRACTICES OF LIFE INSURANCE COMPANIES
 CHAPTER 5 FINANCIAL REPORTING PRACTICES OF LIFE INSURANCE COMPANIES CHAPTER 5 FINANCIAL REPORTING PRACTICES OF LIFE INSURANCE COMPANIES Life Insurance Corporation of India (LIC) was a sole player in the
A Study on the Behaviour of Micro (Life) Insurance Policy Holders with Reference to Coimbatore, India
 Insurance Policy Holders with Reference to Coimbatore, India") Research Journal of Recent Sciences ISSN 2277-2502 Vol. 3(ISC-), 87-94 (14) A Study on the Behaviour of Micro (Life) Insurance Policy Holders with Reference to Coimbatore, India D. Geetha and S. Vijayalakshmi
Research Journal of Recent Sciences ISSN 2277-2502 Vol. 3(ISC-), 87-94 (14) A Study on the Behaviour of Micro (Life) Insurance Policy Holders with Reference to Coimbatore, India D. Geetha and S. Vijayalakshmi
Chapter - VI FUND UTILISATION OF LIFE INSURANCE COMPANIES
 Chapter - VI FUND UTILISATION OF LIFE INSURANCE COMPANIES The previous chapters have given the details pertaining to the direct and indirect funding made by LIC in Kerala, the sector wise and industry
4.2 ANALYSIS OF THE PRIVATE LIFE INSURERS AND THEIR COMPARISON WITH THE PUBLIC LIFE INSURANCE SECTOR:
 4.2 ANALYSIS OF THE PRIVATE LIFE INSURERS AND THEIR COMPARISON WITH THE PUBLIC LIFE INSURANCE SECTOR: The structure of the insurance industry has undergone a drastic change since liberalization, privatization
THE INTERNATIONAL JOURNAL OF BUSINESS & MANAGEMENT
 THE INTERNATIONAL JOURNAL OF BUSINESS & MANAGEMENT Performance of ULIP Schemes in Indian Insurance Market D. Jogish Professor & Head of the Department, Sai Vidya Institute of Technology, Bangalore, India
Profiles and Data Analysis. 5.1 Introduction
 Profiles and Data Analysis PROFILES AND DATA ANALYSIS 5.1 Introduction The survey of consumers numbering 617, spread across the three geographical areas, of the state of Kerala, who have given information
Analysis report on Term insurance
 Analysis report on Term insurance Project by Mithun Surpur Intern @ The right Life Insurance policy goes a long way in providing risk cover for the insured as well as saving hard earned money. The Term
Impact Factor 0.348 E- ISSN - 2349-6746 ISSN -2349-6738
 BUYING BEHAVIOUR OF INVESTORS OF SMALL TOWNS WITH RESPECT TO INSURANCE POLICIES: A STUDY ON BARPETA DISTRICT OF ASSAM Dr. Bidyut Jyoti Bhattacharjee Assistant Professor, Department of Commerce, B.H.College,
QUESTIONNAIRE ON HEALTH INSURANCE
 QUESTIONNAIRE ON HEALTH INSURANCE Section A Name : Tel No : Area of Residence : Locality : Urban/Rural (Constituency) 1. Age Group a) 18-30 b) 31-40 c) 41-50 d) 51-60 e) Above 60 2. Gender a) Male b) Female
Indian Life Insurance Industry The Changing Trends
 _ Indian Life Insurance Industry The Changing Trends 1 Sriman Srichandan, 2 Narges Ebrahimi 1 Research Scholar Fakir Mohan University, Balasore 2 Azad University of Ahvaz, Department of Management Email:
Unit-Linked Insurance Policies in the Indian Market- A Consumer Perspective
 Unit-Linked Insurance Policies in the Indian Market- A Consumer Perspective R. Rajagopalan 1 Dean (Academic Affairs) T.A. Pai Management Institute Manipal-576 104 Email: raja@mail.tapmi.org 1 The author
AWARENESS ON PRIVATE LIFE INSURANCE
 AWARENESS ON PRIVATE LIFE INSURANCE 4.1 INTRODUCTION The Life Insurance Corporation of India (LIC) enjoyed the monopoly status till opening up of the insurance market for the private players in the year
The life insurance sector
 BY: DR A. MUTHUSAMY AND A. MEERA WINDS OF CHANGE MARK LIFE INSURANCE MARKET IN INDIA India is still an under-insured country and holds the 18th position in the life insurance market of the world. The life
Changes in Life Insurance Industry in India
 Changes in Life Insurance Industry in India S. Suresh, Assistant Professor of Commerce, SRR Government Arts & Science College, Karimnagar Introduction The growing complexity of life, trade and commerce,
Everyone wishes to see their child graduate. For the Child s Benefit. 14 Insurance Plans Compared BFSI
 For the Child s Benefit 14 Plans Compared As a parent or guardian, it is but your instinct to want to secure your ward s future and financial planning is a critical part of it. You want to make sure that
INDIAN LIFE INSURANCE INDUSTRY THE CHANGING TRENDS
 INDIAN LIFE INSURANCE INDUSTRY THE CHANGING TRENDS Dr. Arnika Srivastava, Dr. Sarika Tripathi, Assistant Professor Assistant Professor Faculty of Commerce, Faculty of Commerce Sunbeam College for Women,
Opportunities and Challenges of Insurance Industry in India
 Opportunities and Challenges of Insurance Industry in India G. Chandrayya, Lecturer in Commerce, Govt.Degree College (A).Rajahmundry I. Introduction The insurance industry in our country is on the threshold
Online Life Insurance Market in India 2015-2019
 Brochure More information from http://www.researchandmarkets.com/reports/3196694/ Online Life Insurance Market in India 2015-2019 Description: Online life insurance products and services Life insurance
PRODUCTIVITY OF LIFE INSURANCE COMPANIES IN INDIA
 CHAPTER V PRODUCTIVITY OF LIFE INSURANCE COMPANIES IN INDIA 5.1 INTRODUCTION An economic measured of output per unit of input. Inputs include labor and capital, while output is typically measured in revenues
(FOR OFFICE USE ONLY)
") PUNJAB NATIONAL BANK ACCOUNT OPENING FORM (All BRANCHES) The Manager, Branch Office.. Dist. No. Customer ID No: (Sole/first A/c holder only) Account No. (16 digits) FOR RESIDENT INDIVIDUALS (SINGLE/ JOINT)
PUNJAB NATIONAL BANK ACCOUNT OPENING FORM (All BRANCHES) The Manager, Branch Office.. Dist. No. Customer ID No: (Sole/first A/c holder only) Account No. (16 digits) FOR RESIDENT INDIVIDUALS (SINGLE/ JOINT)
A Comparative Study on the Performance of ULIPs Offered by the Selected Insurance Companies-A Study in Indian Capital Markets
 A Comparative Study on the Performance of ULIPs Offered by the Selected Insurance Companies-A Study in Indian Capital Markets 1 Mr Kantesha Sanningammanavara Research Scholar, BMS College of Engineering,Bangalore.
A study on Awareness of Health Insurance among people with special reference to Rajasthan (India)
") A study on Awareness of Health Insurance among people with special reference to Rajasthan (India) Sonal Kala Research Scholar Department of Accountancy & Business Statistics University of Rajasthan, Jaipur
A study on Awareness of Health Insurance among people with special reference to Rajasthan (India) Sonal Kala Research Scholar Department of Accountancy & Business Statistics University of Rajasthan, Jaipur
Chapter VII. Summary of Findings, Suggestions and Conclusion
 Chapter VII Summary of Findings, Suggestions and Conclusion 269 SUMMARY OF FINDINGS, SUGGESTIONS AND CONCLUSION Introduction The summary and conclusion made in this chapter is purely based on the Analysis
RGI, Mohali, Punjab, India
 Life Insurance Industry in India - Current Scenario 1 Dr. Sonika Chaudhary, 2 Priti Kiran 1,2 RGI, Mohali, Punjab, India I. Introduction The insurance is primarily a social device adopted by civilized
Recruitment of Quality Advisor Among the Private Life Insurance Companies in India
 Indian Journal of Development Research and Social Action 2011 Volume 7 v Numbers 1-2, Jan.-Dec., 2011 v pp. 157-172 Recruitment of Quality Advisor Among the Private Life Insurance Companies in India Shailendra
Growth of life Insurance Business: Public and Private Insurance Players in India Abstract-
 Growth of life Business: Public and Private Players in India Mrs. Sushma K. Kotgiri Abstract- Investment is primary requirement of common man to give fight to the uncontrollable circumstances to reduce
Financial Planning Questionnaire
 Form No. (To be filled in by FPSB India) Financial Planning Questionnaire Candidate s Name FPSBI No. / NCFM No. Candidate s Signatures Mode of Registration Education Provider Name of the Education Provider
Innovate or Evaporate : Redefining Channels of Distribution in Insurance Sector
 ISSN: 2348-7666 Vol.2, Issue -2(3), April-June, 2015 Innovate or Evaporate : Redefining Channels of Distribution in Insurance Sector G.A.Narasimham, Lecturer in Commerce, Govt College(A), Rajahmundry Introduction
Policyholder s Satisfaction of Private Life Insurance Companies With Reference To Tirupur District, Tamilnadu
 International Journal of Computational Engineering Research Vol, 03 Issue, 9 Policyholder s Satisfaction of Private Life Insurance Companies With Reference To Tirupur District, Tamilnadu Dr.N.Kathirvel*
International Association of Scientific Innovation and Research (IASIR) (An Association Unifying the Sciences, Engineering, and Applied Research)
 (An Association Unifying the Sciences, Engineering, and Applied Research)") International Association of Scientific Innovation and Research (IASIR) (An Association Unifying the Sciences, Engineering, and Applied Research) International Journal of Engineering, Business and Enterprise
International Association of Scientific Innovation and Research (IASIR) (An Association Unifying the Sciences, Engineering, and Applied Research) International Journal of Engineering, Business and Enterprise
Pension Fund Regulatory and Development Authority
 Pension Fund Regulatory and Development Authority PFRDA, First Floor, ICADR Building, Phase II, Plot No 6, Vasant Kunj Institutional Area, New Delhi-110070 1 Presentation Topics Indian Pension Scenario
WHY SHOULD ONE INVEST IN A LIFE INSURANCE PRODUCT? AN EMPIRICAL STUDY
 WHY SHOULD ONE INVEST IN A LIFE INSURANCE PRODUCT? AN EMPIRICAL STUDY Dr. Ganesh Dash, Assistant Professor, SBM (SIILAS Campus) Jaipur National University, Jaipur, India Tulika Sood, Assistant Professor,
FDI in the Insurance Sector A Short Note (Submitted by the Left Parties to the UPA)
") FDI in the Insurance A Short Note (Submitted by the Left Parties to the UPA) The Finance Minister, while presenting the first Budget of the UPA government, has proposed to raise the FDI cap in three sectors.
FDI in the Insurance A Short Note (Submitted by the Left Parties to the UPA) The Finance Minister, while presenting the first Budget of the UPA government, has proposed to raise the FDI cap in three sectors.
SHIV SHAKTI International Journal of in Multidisciplinary and Academic Research (SSIJMAR) Vol. 4, No. 2, April 2015 (ISSN 2278 5973)
 Vol. 4, No. 2, April 2015 (ISSN 2278 5973)") SHIV SHAKTI International Journal of in Multidisciplinary and Academic Research (SSIJMAR) Vol. 4, No. 2, April 2015 (ISSN 2278 5973) A Study Socio Economic Status And Buying Behaviour Of Rural Life Insurance
SHIV SHAKTI International Journal of in Multidisciplinary and Academic Research (SSIJMAR) Vol. 4, No. 2, April 2015 (ISSN 2278 5973) A Study Socio Economic Status And Buying Behaviour Of Rural Life Insurance
IJPSS Volume 2, Issue 6 ISSN: 2249-5894
 LIFE INSURANCE CORPORATION OF INDIA: A GIANT IN INDIA S INSURANCE SECTOR Dr. Ravi N. Kadam* _ ABSTRACT INTRODUCTION The history of life insurance in India started after the establishment of a British firm,
GROWTH OF ULIP POLICIES IN LIFE INSURANCE SECTOR - A COMPARATIVE STUDY OF TRADITIONAL AND ULIP POLICIES
 GROWTH OF ULIP POLICIES IN LIFE INSURANCE SECTOR - A COMPARATIVE STUDY OF TRADITIONAL AND ULIP POLICIES Ravi Akula, Asst. Professor, Department of Commerce & Business Management, Mahatma Gandhi University,
International Journal of Management, Innovation & Entrepreneurial Research Vol 1 (1), April 2015, Pg 10-14
, April 2015, Pg 10-14") IMPACT OF DEMOGRAPHIC VARIABLES ON PURCHASE OF E-INSURANCE IN URBAN AREAS IN INDIA Dr. Syed Shahid Mazhar, Dr. Anisur Rehman and Mr. Shahab Ud Din Assistant Professor, Integral University, Department Of
IMPACT OF DEMOGRAPHIC VARIABLES ON PURCHASE OF E-INSURANCE IN URBAN AREAS IN INDIA Dr. Syed Shahid Mazhar, Dr. Anisur Rehman and Mr. Shahab Ud Din Assistant Professor, Integral University, Department Of
PERFORMANCE MEASUREMENT OF CLAIMS PAID AND UNPAID: COMPARATIVE STUDY OF LIFE INSURANCE COMPANIES IN INDIA
 PERFORMANCE MEASUREMENT OF CLAIMS PAID AND UNPAID: COMPARATIVE STUDY OF LIFE INSURANCE COMPANIES IN INDIA Dr. P. B. Ashturkar* Abstract: The most important service that an insurance company gives to its
A STUDY ON MUTUAL FUNDS WITH DUE REFERENCE TO SBI MUTUAL FUNDS
 A STUDY ON MUTUAL FUNDS WITH DUE REFERENCE TO SBI MUTUAL FUNDS MR. BADRIVISHAL Asst-Professor, Signodia Arts, Commerce and P.G. center, Charkaman, Hyderabad Abstract The mutual fund industry is a lot like
Chapter VIII Customers Perception Regarding Health Insurance
 Chapter VIII Customers Perception Regarding Health Insurance This chapter deals with the analysis of customers perception regarding health insurance and involves its examination at series of stages i.e.
Useful websites directory
 Useful websites directory Important Government websites 1. Government of India : www.india.gov.in 2. Railway Booking : www.indianrail.gov.in 3. Govt. of India Web Directory : http://goidirectory.nic.in/
APPENDIX 1 QUESTIONNAIRE TO BENEFICIARIES PLEASE ANSWER FOR THE FOLLOWING QUESTIONS, YOUR IDENTITY IS GUARDED. PLEASE FEEL FREE TO GIVE YOUR COMMENTS.
 396 APPENDIX 1 QUESTIONNAIRE TO BENEFICIARIES PLEASE ANSWER FOR THE FOLLOWING QUESTIONS, YOUR IDENTITY IS GUARDED. PLEASE FEEL FREE TO GIVE YOUR COMMENTS. GENERAL INFORMATION : 1. Policy number (optional)
A STUDY ON PERFORMANCE OF UNIT-LINKED INSURANCE PLANS (ULIP) OFFERED BY INDIAN PRIVATE INSURANCE COMPANIES
 OFFERED BY INDIAN PRIVATE INSURANCE COMPANIES") A STUDY ON PERFORMANCE OF UNIT-LINKED INSURANCE PLANS (ULIP) Dr. G Nagarajan * Mr. A. Asif Ali ** Mr. N. Sathyanarayana** OFFERED BY INDIAN PRIVATE INSURANCE COMPANIES Abstract: Indian Insurance Industry
A STUDY ON PERFORMANCE OF UNIT-LINKED INSURANCE PLANS (ULIP) Dr. G Nagarajan * Mr. A. Asif Ali ** Mr. N. Sathyanarayana** OFFERED BY INDIAN PRIVATE INSURANCE COMPANIES Abstract: Indian Insurance Industry
HOW EQUITABLE ARE EQUITY-LINKED INSURANCE PRODUCTS? Abstract
 HOW EQUITABLE ARE EQUITY-LINKED INSURANCE PRODUCTS? -Dr. S. Uma & C.S.Kumar Abstract Insurance markets around the world are changing. Policyholders want to enjoy the benefits of equity investment in conjunction
INSURANCE April 2010
 INSURANCE April 2010 INSURANCE April 2010 Contents Advantage India Market overview Policy and regulatory framework Opportunities Industry associations 2 ADVANTAGE INDIA Advantage India India is among the
EMERGING TRENDS IN INSURANCE A STUDY IN INDIAN LIFE INSURANCE INDUSTRY
 Volume 3, Issue 6 (June, 2014) Online ISSN-2277-1166 Published by: Abhinav Publication Abhinav National Monthly Refereed Journal of Research in EMERGING TRENDS IN INSURANCE A STUDY IN INDIAN LIFE INSURANCE
Enhancing Transparency and Monitoring of Insurance Markets 26-27 January, 2012 Bangkok, Thailand
 Growth of Indian Insurance Industry and Determinants of Solvency Subir Sen, PhD subir.sen@teri.res.in TERI University, India nd OECD-Asia Regional Seminar on Insurance Statistics: ti ti Enhancing Transparency
The Indian institutes available on MONEY MONITOR are as follows:
 The Indian institutes available on MONEY MONITOR are as follows: S. No. Institute Type Institute 1 Bank - Corporate YES BANK (Corporate) (India) - Bank 2 Bank - Corporate Axis Bank (Corporate) (India)
Society of Actuaries Middle Market Life Insurance Segmentation Program (Phase 1: Young Families)
") Society of Actuaries Middle Market Life Insurance Segmentation Program (Phase 1: Young Families) September 2012 Sponsored By: SOA Marketing and Distribution Section SOA Product Development Section SOA
Society of Actuaries Middle Market Life Insurance Segmentation Program (Phase 1: Young Families) September 2012 Sponsored By: SOA Marketing and Distribution Section SOA Product Development Section SOA
IJMT Volume 2, Issue 7 ISSN: 2249-1058
 A STUDY ON CONSUMER SATISFACTION TOWARDS LIFE INSURANCE CORPORATION OF INDIA Prof.Sanjaykumar Jagannath Patil* Abstract: Life Insurance Corporation of India (LIC) is the India s largest Life Insurance
A Study On Indian Consumers Attitude Towards SMS Advertising Through Mobile Phones
 38 Opinion-Volume 1, No. 1, December 2011 A Study On Indian Consumers Attitude Towards SMS Advertising Through Mobile Phones Abstract Ravindra Reddy. T* Dr. Rajyalakshmi N** The rapid increase in the usage
How To Know The Effect Of Demographic Factors On The Preference For Wealth Management In Udaipur
 PREFERENCES FOR WEALTH MANAGEMENT SERVICES: AN EMPIRICAL STUDY IN UDAIPUR, RAJASTHAN Dr. Dhiraj Jain, Asistant Professor, Pacific Institute of Management, Udaipur, India Ms. Anupama Jhala, Research Scholar,
I. Personal and Family Information... 2. II. Current Estate Plan Information... 5. III. Advanced Directives... 6. IV. Assets... 7. a. Real Estate...
 Evaluating Your Estate Plan: Ag Decision Maker Estate Planning Questionnaire File C4-57 Table of Contents * I. Personal and Family Information... 2 II. Current Estate Plan Information... 5 III. Advanced
Utkarsh Gupta 1, Dr. Richa Sinha 2
 IOSR Journal of Business and Management (IOSR-JBM) e-issn: 2278-487X, p-issn: 2319-7668. Volume 17, Issue 2.Ver. I (Feb. 2015), PP 13-17 www.iosrjournals.org A Comparative Study on Factors Affecting Consumer
Study into the Sales of Add-on General Insurance Products
 Study into the Sales of Add-on General Insurance Quantitative Consumer Research Report Prepared For: Financial Conduct Authority (FCA) March, 2014 Authorised Contact Persons Frances Green Research Director
Can Annuity Purchase Intentions Be Influenced?
 Can Annuity Purchase Intentions Be Influenced? Jodi DiCenzo, CFA, CPA Behavioral Research Associates, LLC Suzanne Shu, Ph.D. UCLA Anderson School of Management Liat Hadar, Ph.D. The Arison School of Business,
International Journal of Advance Research in Computer Science and Management Studies
 Volume 2, Issue 11, November 2014 ISSN: 2321 7782 (Online) International Journal of Advance Research in Computer Science and Management Studies Research Article / Survey Paper / Case Study Available online
PERCEPTIONS OF INVESTORS ON MUTUAL FUNDS A COMPARATIVE STUDY ON PUBLIC AND PRIVATE SECTOR MUTUAL FUNDS
 6 PERCEPTIONS OF INVESTORS ON MUTUAL FUNDS A COMPARATIVE STUDY ON PUBLIC AND PRIVATE SECTOR MUTUAL FUNDS Manasa Vipparthi* Ashwin Margam** Abstract: Indian Mutual Fund (MF) industry provides reasonable
Theoretical Perspective of Indian Insurance Industry Profile
 Chapter III Theoretical Perspective of Indian Insurance Industry Profile Contents in Third Chapter. 3.1. Introduction to Indian Life Insurance. 3.2. New reforms - The Insurance regulatory and development
ROLE OF INSURANCE IN ECONOMIC DEVELOPMENT OF INDIA
 81 ROLE OF INSURANCE IN ECONOMIC DEVELOPMENT OF INDIA MONALISA GHOSAL* ABSTRACT The economic development of India was dominated by socialist influenced policies, stateowner sector, and red tape and extensive
AN ANALYSIS OF INVESTORS PREFERENCE ON VARIOUS LIFE INSURANCE POLICIES
 AN ANALYSIS OF INVESTORS PREFERENCE ON VARIOUS LIFE INSURANCE POLICIES Abstract Divya Joseph* The business of insurance is related to the protection of the economic values of asset every asset has a value
Annexure I STATE BANK OF IDNIA APPLICATION FORM FOR BUSINESS FACILITATORS (INDIVIDUALS)
") Annexure I STATE BANK OF IDNIA APPLICATION FORM FOR BUSINESS FACILITATORS (INDIVIDUALS) 1. Location (Village / Town) - Location 2. Name (IN BLOCK LETTERS) 3. Father s / Husband s Name 4. Date of Birth
Annexure I STATE BANK OF IDNIA APPLICATION FORM FOR BUSINESS FACILITATORS (INDIVIDUALS) 1. Location (Village / Town) - Location 2. Name (IN BLOCK LETTERS) 3. Father s / Husband s Name 4. Date of Birth
This briefing is divided into themes, where possible 2001 data is provided for comparison.
 Information Action 2011 Census Second Release December 2012 Consultation The Office for National Statistics (ONS) has now begun the Second Release of outputs from the 2011 Census at local authority level.
2012 Protection Gap Study - Singapore
 Life Insurance Association Singapore 2012 Protection Gap Study - Singapore End of 2011 Protection Gap 28 August 2012 Life Insurance Association Singapore i Table of Contents Section 1 : Executive Summary...1
NEW BUSINESS PRODUCT MIX FOR INDIVIDUAL REGULAR PREMIUM BUSINESS
 The reduction in ULIP sales has been most noticeable for the tied agency channel. The bancassurance distribution channel is relatively less affected due to the reduced commission level on ULIPs given the
Valuable Papers INVENTORY AND RECORD OF
 INVENTORY AND RECORD OF Valuable Papers Every person has important papers relating to personal records, property ownership, insurance, finances, and other business affairs. Good management dictates that
PERCEPTION OF SENIOR CITIZEN RESPONDENTS AS TO REVERSE MORTGAGE SCHEME
 CHAPTER- V PERCEPTION OF SENIOR CITIZEN RESPONDENTS AS TO REVERSE MORTGAGE SCHEME 5.1 Introduction The present study intended to investigate the senior citizen s retirement planning and their perception
Interbank Mobile Payment Service (IMPS) Merchant Payments User Group Meeting
 Merchant Payments User Group Meeting") Interbank Mobile Payment Service (IMPS) Merchant Payments User Group Meeting Current merchant payments scenario Remote payments E-commerce Face-to-face payments Fixed POS E-commerce statistics Growth of
Interbank Mobile Payment Service (IMPS) Merchant Payments User Group Meeting Current merchant payments scenario Remote payments E-commerce Face-to-face payments Fixed POS E-commerce statistics Growth of
A Study on Consumer Perception Regarding Birla Sun Life Mutual Fund, Jalandhar
 A Study on Consumer Perception Regarding Birla Sun Life Mutual Fund, Jalandhar 1 Khurshid Ahmad Bhat, 2 Ruchi Singh Maurya 1 Awadhesh Pratap Singh University, Rewa, Madhya Pradesh, India, 2 College of
International Journal of Scientific Research and Modern Education (IJSRME) ISSN (Online): 2455 5630 (www.rdmodernresearch.com) Volume I, Issue I,
 ISSN (Online): 2455 5630 (www.rdmodernresearch.com) Volume I, Issue I,") A COMPREHENSIVE STUDY ON FACTORS AFFECTING PURCHASE DECISION OF LIFE INSURANCE CUSTOMERS K. Kavyashree * & Fathima Safira** Assistant Professor, SDM College, Ujire, Karnataka Abstract: Liberalization,
A COMPREHENSIVE STUDY ON FACTORS AFFECTING PURCHASE DECISION OF LIFE INSURANCE CUSTOMERS K. Kavyashree * & Fathima Safira** Assistant Professor, SDM College, Ujire, Karnataka Abstract: Liberalization,
A RESEARCH ON CONSUMER PERCEPTION ABOUT LIFE INSURANCE POLICIES
 A RESEARCH ON CONSUMER PERCEPTION ABOUT LIFE INSURANCE POLICIES PROJECT REPORT SUBMITTED IN PARTIAL FULFILMENT OF THE REQUIREMENTS FOR THE AWARD OF MASTERS DEGREE IN BUSINESS ADMINISTRATION OF UNIVERSITY
Life Insurance Industry An Overview
 Life Insurance Industry An Overview Dr. Rajas Parchure Professor, National Insurance Academy & RBI Chair Professor, Gokhale Institute of Politics and Economics, Pune Historical Perspective Entry of Life
ESTATE PLANNING INFORMATION
 ESTATE PLANNING INFORMATION I PERSONAL AND FAMILY DATA A. Husband Husband's Name: (First) (Middle) (Last) Social Security Number Home Phone Employer Business Address Business Phone Place of Birth: U.S.
Private Life Insurance Companies -A Long Way to Go
 Variorum, Vol.-I, Issue-1, August 21 1 Private Life Insurance Companies -A Long Way to Go - V.S.Kannan Kamalanathan: Vice Principal, Head Department of Commerce, KES Shroff College of Arts & Commerce,
Personal Pension Account
 Personal Pension Account Contents Introduction... 1 A Closer Look At Our Personal Pension Account... 2 What Are The Tax Advantages?... 3 Flexible Contribution Options... 4 You Control Your Investment...
Analysis of Children Insurance Plans in the Present Context
 IJMT, Volume 2 Number 1 January-June, 2012 pp. 39-45 Analysis of Children Insurance Plans in the Present Context G. BALACHANDAR 1, PANCHANATHAM 2 & K. SHEIK MYTHEEN 3 INTRODUCTION Life insurance in our
CMFAS M9 Life Insurance And Investment Linked Policies
 CMFAS M9 Life Insurance And Investment Linked Policies Module Description: The objectives of this module are to provide candidates with the knowledge on and understanding of traditional life insurance
Medicare Advantage National Senior Survey 600 Senior Registered Voters in the Medicare Advantage Program February 24-28, 2015
 Medicare Advantage National Senior Survey 600 Senior Registered Voters in the Medicare Advantage Program February 24-28, 2015 1. In what year were you born? 1. Before 1950 (CONTINUE TO QUESTION 2) 100
CRISIL - AMFI Diversified Equity Fund Performance Index. Factsheet September 2015
 CRISIL - AMFI Diversified Equity Fund Performance Index Factsheet September 2015 Table of Contents About the Index... 3 Features and Characteristics... 3 Methodology... 3 CRISIL - AMFI Diversified Equity
This is a licensed product of AM Mindpower Solutions and should not be copied
 1 TABLE OF CONTENTS 1. India Heath Insurance Industry Introduction 2. India Health Insurance Industry Size 2.1. By Premium Underwritten, FY 2006-2.2. By Number of Policies and Premium per Policy, FY 2010-3.
Socio-economic and demographic characteristics of alcohol and other substance abusers, undergoing treatment in Sikkim, a north east state of India
 Available online at www.scholarsresearchlibrary.com Archives of Applied Science Research, 2014, 6 (2):106-110 (http://scholarsresearchlibrary.com/archive.html) ISSN 0975-508X CODEN (USA) AASRC9 Socio-economic
CHAPTER 4 A COMPARATIVE STUDY BETWEEN PUBLIC SECTOR LIFE INSURANCE AND PRIVATE SECTOR LIFE INSURANCE
 CHAPTER 4 A COMPARATIVE STUDY BETWEEN PUBLIC SECTOR LIFE INSURANCE AND PRIVATE SECTOR LIFE INSURANCE The Insurance sector plays a vital role in the economic development of our nation. It acts as a mobiliser
Insurance Business: focusing on tactical opportunities to improve their
 Insurance Business: focusing on tactical opportunities to improve their performance in India. Abstract This study is conduct to know the approach of the insurance sector in Indian economy and to measure
Distribution of Population by Religions
 Drop-in-Article on Census - No.4 Distribution of Population by Religions Religious profile of the populace is an important socio-cultural and demographic feature noticeable from the first Census in 1872
Demand for Life Insurance in Malaysia
 Demand for Life Insurance in Malaysia Yiing Jia Loke 1+ and Yi Yuern Goh 2 1 School of Social Sciences, Universiti Sains Malaysia 2 HSBC Bank, Penang. Abstract. The insurance sector in Malaysia has shown
A Comparative Study of Traditional Policies and ULIP Policies with reference to Life Insurance Companies in India
 A Comparative Study of Traditional Policies and ULIP Policies with reference to Life Insurance Companies in India ABSTRACT Debabrata Mitra* & Piyali Chandra Khan** Unit Linked Insurance Plan (ULIP) is
FINANCIAL LIFE CHECKUP
 FINANCIAL LIFE CHECKUP Full Legal Name Nick Name Client Spouse Gender Male Female Male Female Home Address City, State, Zip Home Phone ( ) ( ) Work Phone ( ) ( ) Cell Phone ( ) ( ) Fax ( ) ( ) Best Time/Method
Pension Reform in India and PFRDA
 Presentation on Pension Reform in India and PFRDA By Ms. Mamta Rohit Chief General Manager Pension Fund Regulatory and Development Authority Pension History In 13 th century B.C. Roman Emperor, Augustus
PERFORMANCE EVALUATION OF SELECT EQUITY FUNDS IN INDIA
 PERFORMANCE EVALUATION OF SELECT EQUITY FUNDS IN INDIA DR. KUBERUDU BURLAKANTI*; RAVI VARMA CHIRUVOORI** *PROFESSOR & HEAD - DEPARTMENT OF MANAGEMENT STUDIES ANDHRA UNIVERSITY CAMPUS, KAKINADA - 533005
Mutual fund: SIP vis-à-vis lump sum investment
 Volume: 2, Issue: 7, 395-400 July 2015 www.allsubjectjournal.com e-issn: 2349-4182 p-issn: 2349-5979 Impact Factor: 3.762 DM Jha Msc (Ag), CAIIB, NCMP (IInd level), MBA (Finance) DM Jha Mutual fund: vis-à-vis
CHAPTER - Vll. Need for the study. Findings. Conclusions. Suggestions. Conclusion
 217 CHAPTER - Vll Need for the study Findings Conclusions Suggestions Conclusion 218 NEED FOR STUDY In the recent times, life Insurance have become a very important area of research in all most all the
ELDER ABUSE IN INDIA
 REPORT ON ELDER ABUSE IN INDIA Don t Ignore it. Prevent it. HelpAge India (headoffice): C 14, Qutab Institutional Area. New Delhi 110016. Ph: 011-41688955 56. www.helpageindia.org Consultant: Sigma Research
Home Equity Line of Credit Application
 Applicant s Name 322 East Main Avenue Bismarck, ND 58501 (701) 250-3000 Lender Please tell us about yourself and co-applicant, if applicable Co-Applicant s Name Home Equity Line of Credit Application Home
Competition in Life Insurance Sector of India
 Competition in Life Insurance Sector of India Abstract - My research is aimed at understanding the life insurance sector in India and flagging issues relating to competition in this sector. The life insurance