User Guide & Administrator Guide
|
|
|
- Blaze Mason
- 8 years ago
- Views:
Transcription
1 6.7 User Guide & Administrator Guide
2 2 ELM Help Table of Contents Foreword Part I Legal/Copyright Notice Part II Getting Started Features... Introduced in ELM Quick... Start Configuration 18 3 Product... Activation 20 4 Architecture... Overview 22 5 ELM Data... Flow 23 6 Optional... Installs 24 ELM Advisor ELM Publisher ELM Web View... er 32 Part III User Guide 35 1 ELM Console ELM Server Server Properties ELM At A Glance Control Panel Home and Standby Database Settings Connections Retention Policy Archive Connect to Archive... Database 55 Properties Monitoring and... Managem ent 57 Agents and... Monitors Library 57 All Monitors Agent Monitor Cluster Monitor Event Alarm Event Filter Event Collector Event Filter Event File Collector File Monitor FTP Monitor IIS Monitor Inventory Collector Link Monitor Performance Alarm Performance Collector Ping Monitor... 94

3 Contents 3 Process Monitor Service Monitor SMTP Monitor SNMP Alarm SNMP Collector SNMP Receiver SQL Server Monitor Syslog Receiver TCP Port Monitor Web Page Monitor Window s Configuration... Monitor 117 WMI Monitor All Agents Agent Folders Outages Inventory System Information SNMP Data Agent Installation IP Virtual Agents Virtual Agents Service Agents Agent Maintenance Agent Properties Monitoring... Categories 142 Maintenance... Categories 142 View ing and... Notifying 144 Filters and... Methods Library 144 All Exclude Filters All Include Filters All Correlation Filters All Notification Methods Command Script Forw ard Event Pager Pager (Numeric) Pager (Alpha-Numeric) Post Web Form SNMP OID/Trap Syslog Message Mail Notification... (SMTP) 174 ELM Advisor Notification Event View... s 179 Event View Properties Event Properties Event Filters Security View... s 187 Event View Properties Event Properties Event Filters Correlation... View s 192 Correlation View... Properties 194 Reporting Performance... Tables 197 3

4 4 ELM Help Performance Objects Adding Performance... Counters 198 ELM Editor Modify ELM Editor... Report Glossary Part IV Administrator Guide Planning... Guide 212 Introduction Best Practices Sizing Guidelines Database Guidelines Netw ork Guidelines Backup Guidelines Backup and... Restore the ELM Configuration Data 219 Backup and... Restore ELM Objects Installation... Guide 225 System Requirem... ents 225 Installing the... ELM Server 230 Installing the... ELM Console 231 Installing a Second... ELM Console 232 Installing Service... Agents 232 Silent Install Install ELM... Advisor 246 Install TNT... Agent 247 Install All and... Create Databases 248 Install All and... Connect to Databases 251 Install Console Install Server... and Create Databases 255 Install Server,... Web View er, Console and Create Databases 257 Uninstall Features Security... Guide 261 Security Introduction Security Guidelines Configuring ELM... Server Security Windows... Cluster Guide 266 Introduction Installing ELM... Server into a Cluster 267 Uninstalling ELM... Server from a Cluster Troubleshooting... Guide 271 Introduction Troubleshooting... Installation 272 Troubleshooting... Service Agents 273 Troubleshooting... Agent Com m unications 276 Troubleshooting... ELM Console Technical... Resources 280 Database Settings... Entries 281 Server and Agent... Events 283 Event IDs Event IDs Event IDs

5 Contents 5 Event IDs Event IDs Event IDs Event IDs Event IDs Event IDs Event IDs Registry Entries ELM Wizard... Registry Entries 301 ELM Console... Registry Entries 302 ELM Server... Registry Entries 303 ELM Service... Agent Registry Entries 311 Com m and Line... Sw itches 316 ELM Server... Command Line Options 316 TNT Agent... Command Line Options Tools ELM Size ELM Event Generator ELM Tracing... Tool 323 Index 325 5

6 Legal/Copyright Notice Part 1

7 Legal/Copyright Notice 1 7 Legal/Copyright Notice Copyright Notice This document is provided for informational purposes only. TNT Software, Inc. makes no warranties, either express or implied, in this or about this document. Information herein, including references, cites, URLs and other references, is subject to change without notice. The entire risk of the use or the results of the use of this document remains with the user. Complying with all applicable copyright laws is the responsibility of the user. This document and its contents are Copyright TNT Software, Inc. All rights reserved. Without limiting any rights, no part of this document or file may be reproduced, stored in or introduced into a retrieval system, or transmitted in any form or by any means (electronic, mechanical, photocopying, recording, or otherwise), or for any purpose, without the express written permission of TNT Software, Inc. TNT Software, Inc. may have patents, patent applications, trademarks, service marks, copyrights, or other intellectual property rights covering this document and/or its subject matter. Except as expressly provided in any written software license agreement (SLA) from TNT Software, Inc., the furnishing of this document does not give you any license to these patents, trademarks, copyrights, or other intellectual property. The names of actual companies and products mentioned herein may be the trademarks of their respective owners. Legal Notice TNT Software, Inc. provides this document "as is" without warranty of any kind, either express or implied, including, but not limited to, the implied warranties of merchantability or fitness for a particular purpose. Some states do not allow disclaimers of express or implied warranties in certain transactions; therefore, this statement may not apply to you. This document and the software described in this document are furnished under a license agreement or a non-disclosure agreement and may be used only in accordance with the terms of the agreement. This document may not be lent, sold, or given away without the written permission of TNT Software, Inc.. No part of this publication may be reproduced, stored in a retrieval system, or transmitted in any form or by any means, electronic, mechanical, or otherwise, without the prior written consent of TNT Software, Inc.. U.S. Government Restricted Rights: Use, duplication, or disclosure by the Government is subject to the restrictions as set forth in subparagraph (c)(1)(ii) of the Rights in Technical Data and Computer Software clause of the DFARs and FAR (c) and any successor rules or regulations. TNT Software, Inc Main Street Vancouver, WA Phone: FAX:

8 8 ELM Help
9 Getting Started Part 2

10 10 2 ELM Help Getting Started The TNT Getting Started pages provide a high level introduction to ELM. They are intended as a guide to get you up and running quickly. Pages in this section include: Features Introduced in ELM This page describes the new features in ELM 6.7. Architecture Overview - This page shows a high level overview of a typical ELM deployment. ELM Data Flow - High level overview of the data flow in the ELM Console. Quick Start Configuration - This page is a guided tour of configuring ELM and testing your setup. It guides you through a simple example so that you can quickly see ELM in action. Product Activation - Overview of the Product Activation process and licenses. Optional Installs - The Optional Installs pages describe the features that are available to install when running setup. They are not required in order for ELM to work but may need additional components installed before setup. In the ELM Help contents, topics Below the Getting Started pages provide more in-depth details about ELM. The context-sensitive help accessed by pressing the F1 key from inside the ELM Console<%Z_ELM_C ONSOLE%> takes you to one of these more focused pages.

11 Getting Started 2.1 Features Introduced in ELM 6.7 Features Introduced in ELM

12 12 ELM Help This new release includes several new enhancements for ease of use, new features, better performance and reliability to name just a few. Monitoring server performance and event logs and the vast data available is now even easier thanks to version 6.7. This latest version of ELM pushes the bar even higher with an updated and improved Console layout, new features such as Event Correlation, and Maintenance Windows. Listed below you'll find the highlights of the newest features in ELM Enterprise Manager 6.7. ELM Console UI Updates - Monitoring, Categories, Views & More Right away you'll notice some great improvements with ELM the first time you launch the console. We've restructured the categories to provide better organization and management of your systems as well as the monitoring features within. From the top you'll see that the 'Monitoring' category has been broken out into 'Monitoring and Management', 'Monitoring Categories', and 'Maintenance Categories'. The Agents and Monitors Library contains the All Agents Container as well as the list of All Monitors available within ELM (based on your licensing). Monitoring Categories are the new landing place for the contents of the old Monitoring Container familiar ground. Maintenance Categories is a new feature introduced with version 6.7 and is described in more detail below. In the next section be sure to take a look at how the Results container has been removed and Event Views have been expanded and improved!


13 Getting Started 13 Event Views, Security Views & Filters With the ever growing importance of categorizing events for operational and forensic use, the Event Views in ELM have been reorganized and streamlined. In ELM 6.7 the Event Views have been separated from Security Views providing easier access and visibility. The Event Filters and Notification Methods have also been grouped together into their own container or "Library" as it is called. In the sample below you can see the difference between the ELM 6.5 and ELM 6.7 console layout. Starting at the top, there is the Viewing and Notifying top level container that includes: Filters And Methods Library - The Filters and Methods Library is the home of all Filters, both Exclude and Include, as well as Correlation specific Filters. All Notification Methods available can also be found here. A new feature in ELM 6.7 is that Exclude and Include Filters are no separate from one another for easier distinction of their use within the product. Event Views - These are the same Event Views that ELM is famous for, but now they are in their own unique container for a cleaner appearance resulting in a shorter list. Security Views - The Security Views in ELM are slightly different than a normal Event View. Not only are they configured to display only the security events that come in but they also display different columns of data for these events, specifically related to security, within the View itself. Correlation Views - Correlation Views are new with the release of ELM 6.7. Please see the section below for more details on Event Correlation.


14 14 ELM Help Event Correlation - Correlation Views This new feature is based on Views and combines Filters for 'Start' events together with advanced filters and automated timers for 'End' Events to provide a powerful forensic tool for your environment. Correlation Views can be used a number of different ways. When an event matches the Include Filter, it is designated as the "start event" and the timer begins counting down. If an event matching the Correlation Filter is found before the timer expires, then it is designated as the "end event" and a correlation pair has been found. A Notification Method can be assigned to alert ELM users that a match or pair has been found.

15 Getting Started 15 Alternatively, if the timer counts down to zero, then a separate Notification Method can be triggered alerting ELM users that a correlation pair was not found. Some samples of how Event Correlation could be used in ELM include: Server reboot takes too long Service restart is too slow Object Access events For more information on Event Correlation, click here. Maintenance Window - Categories When it comes time for system maintenance and planned down time, the last thing you want is an overload of notifications from ELM telling you about problems or unavailability of those systems you are already aware of. A new feature introduced in ELM Enterprise Manager 6.7 is the ability to add a "Maintenance Window" by using what we refer to as Maintenance Categories. These categories pause the launching of notifications during scheduled maintenance when the systems may be offline or generating events which would unnecessarily trigger notifications. ELM will continue to monitor the systems you assign to Maintenance Categories during your maintenance window periods, you just don't have the frustration of being barraged by notification methods during the configured time period. Time periods can be one-offs or regularly intervals based on your maintenance calendar and needs. Maintenance Categories, as well as Agents within Maintenance Categories, that are currently active are represented by a glowing icon in the console. New Formats, Options and More in ELM Editor Reporting

 format.")
16 16 ELM Help New Reporting Formats The ELM Editor reporting engine features some great new improvements that users will surely appreciate. To start with the file output type has been upgraded and options now include the popular PDF format as well as CSV (comma separated values) format. These new formats will allow users to distribute and manipulate reports to their liking even more easily! Assign Reports to Categories ELM Editor now allows you to quickly and easily assign reports to specific Monitoring Categories or groups of systems within your environment. This new shortcut option makes customizing reports even easier! Select Reporting Time Frames With Ease

17 Getting Started 17 Adjusting reporting time frames within ELM Editor used to require editing of the SQL queries. Now with the release of ELM 6.7, adjusting the time frames for your reports is simple with built-in shortcuts. These can be used to quickly produce and deliver a report for a specific time frame. When you're done, you can revert back to any custom time frames you had for each report section by choosing the 'User Pre-defined Range' option. Faster Report Previews ELM Editor reports within the ELM Console will now display much faster by showing a preview of the data rather than all of the data available. This is accomplished by using 'Top Clause' filtering. A smaller cross section of the data is shown, allowing you to take a quick look at the report layout and formatting, make any changes necessary and review the results quickly. Once the report is scheduled or the date range changed, the top clause is automatically removed so that you get all data available displayed. Heartbeat Event in Agent Properties Service Agents now have a new feature for more complete end-to-end monitoring - which is especially helpful on some quieter systems.


18 18 ELM Help The Event Heartbeat, found in the Agent properties, allows the system to generate a specific heartbeat event at a time interval you specify, on an on-going basis. ELM can be configured to look for this event to verify the system is up and running and generating events, and they are being collected. A full loop self-check monitoring cycle so to speak. This new Heartbeat Event is very valuable in large, highly scaled environments where there may be hundreds of systems reporting in to ELM. 2.2 Quick Start Configuration Welcome to ELM 6.7. Once installed, you're probably looking forward to getting ELM configured to do useful work. The steps below will guide you in creating an Agent with a few Monitor Items, and an SMTP Notification Method. We'll assign the Notification Method to a preconfigured Event View and then verify the setup. These step are for installing the ELM Server on a server based operating system such as Windows 2003/2008. This walk-through should take less than 15 minutes. Open the ELM Console on the ELM Server computer.

19 Getting Started 19 Monitoring and Management - The first time you connect the ELM Console to the ELM Server, you're prompted to activate ELM, review your database configuration, and install an Agent with the Agent Installation Wizard. To manually start the Agent Wizard, right-click on Monitoring and Management and select New Agent. You will be collecting local Windows Event Log records for this walk-through. Setup a local Service Agent using these steps: 1. Start the Agent Deployment Wizard, then in the Welcome to the agent deployment wizard dialog, click Next. 2. In the System Names dialog, One System, enter the name of the ELM server, then click Next. Note The wizard provides a "Browse" button for searching network servers. This browse function requires that Network Discovery is enabled on the domain and the following services are enabled and running: DNS Client, Function Discovery Resource Publication, SSDP Discovery and UPnP Discovery. 3. In the Systems Found dialog, your ping should have Succeeded, click Next. 4. In the System Scan Summary dialog, verify that the information is correct. By default, it will choose for the Install Type: Service Agent. Verify that all of the error settings are giving the status of OK, click Next. 5. In the Monitoring Products dialog, select the type of monitoring that you want to have ELM licensed for, such as System Class I, click Next. 6. In the Install Agents dialog, click Next. 7. In the Install Summary dialog, verify that the Service Agent has installed with a Complete status, click Finish. As you performed these steps, an Event Collector was assigned to the Agent via the Windows -Servers. Viewing and Notifying - Several Filters and Event Views are fully pre-configured, others are partially pre-configured. Since ELM cannot predict your preferred address or SMTP server, we'll configure this object next: 1. Expand the Viewing and Notifying container. 2. Expand the Filters and Methods Library 3. Select the All Notification Methods sub-container. 4. In the right panel, double-click Sample SMTP Notification. 5. Select the SMTP Host tab. Enter the name or IP address of your SMTP Server. Enter a valid address in the From field. 6. Select the Mail Message tab. Enter your address in the To: field, and click the Test button. 7. If the test was successful, click No in answer to the test results question and look for a test in your in-box. 8. If the test failed, verify that your address is correct, then return to the SMTP Host tab to verify that the SMTP Server and From fields are correct. 9. Select the Views tab. 10. Add a checkmark next to All Messages -- Errors.

20 20 ELM Help 11. Click OK to save these changes to the Sample SMTP Notification Method. As you performed these steps, ELM assigned a pre-configured Filter, that matches all errors, to the All Messages -- Errors Event View. Now that we have a working Notification Method assigned to an Event View, all errors received by the ELM Server will trigger an Notification. Verification - Now you can generate some events to verify that everything is configured correctly: 1. Right-click on the ELM Server name that appears in the Agents and Monitoring Library, below Monitoring and Management, and select Tools ELM Event Generator. This will open a new window titled Event Generator. 2. In the list of Event Sources, scroll down to WSH and select it. 3. In the right panel list of Events, select 1 from the Event ID list. 4. Click the Generate events button. 5. Click the Open Event Viewer button. This will open the Windows Event Viewer. 6. Select the Application log and look for an Error Event from source WSH to verify the event can be written. 7. Close the Windows Event Viewer. 8. In the ELM Console, select Viewing and Notifying Event Views All -- Errors, and look for an Error Event from WSH. This verifies the ELM Event Collector is gathering event log records. 9. Finally look in your in-box. You should have an with details about a test WSH error. 10. Close Event Generator. By following the trail of data from the Windows Event Log, to the ELM Server, then to your in-box, you can verify data is being properly transmitted each step of the way. This troubleshooting technique validates basic ELM functionality. Now that you have an overall understanding of how ELM is organized, please explore the full power of ELM in depth. 2.3 Product Activation Once your evaluation is complete, and you have purchased a license for ELM, you will need to activate the ELM Server. Enter the ELM Serial Number from your Registration document, and activate using Web Activation or File Activation. For more details, see the Licensing section under the Server Properties. Licensing

21 Getting Started 21 We offer six levels of monitoring functionality (licenses) within a single product. A license is assigned to each system you are monitoring with ELM. This allows you to mix and match licenses to meet both your monitoring and budget needs. The table below identifies the monitoring features found in each license.

22 ELM Help Architecture Overview
23 Getting Started ELM Data Flow The flow and organization of data in ELM Enterprise Manager can best be described in three separate segments. Monitoring, Results, and Reporting as you will see in the ELM Console. Monitoring & Management Monitor Items are what collect the data. They are assigned to Monitoring Categories so they know where to look for data. Agents are assigned to Monitoring Categories for organizational purposes as well as providing the ability to use monitoring "templates" across the systems on your network. Viewing & Notifying The data collected flows into different Event Views, Security Views, and Correlation Views based upon unique and customizable Event Filters. Notifications can be assigned to Views to alert you of specific event activity occurring. Reporting Reports are based upon SQL queries that run against the ELM Database. Reports can also be generated from an Event, Security, or Correlation View and will utilize the same unique include and exclude filters that specify the data showing in that View.

24 ELM Help Optional Installs The Optional Installs pages describe the features that are available to install when running setup. They are not required in order for ELM. Included in this Section: Using ELM Advisor - Describes the Notification Method and application that provides a convenient method for being alerted the moment an event occurs ELM Advisor ELM Advisor provides a convenient method for being alerted the moment an event occurs. Use the ELM Console to configure an ELM Advisor Notification Method. The ELM Advisor Notification configuration settings identify which users will receive events. The Notification is then assigned to an Event View with Event Filters that determine which events will be sent to the ELM Advisor desktops. Prerequisites An Event View with the ELM Advisor Notification Method has been defined in the ELM Console. The ELM Advisor Notification Method is configured with your username or with the All connected ELM Advisor users checkbox. ELM Advisor Window The ELM Advisor Window displays events that have been received. The window maintains a list of events that have not been read in bold. Events that have been read are displayed in regular font weight.

25 Getting Started 25 Using ELM Advisor The ELM Advisor is not selected by default on install but can be added or selected by running the installation file. By default, the ELM Advisor is started automatically from an entry under the HKEY_LOCAL_MACHINE\SOFTWARE\Microsoft\Windows\CurrentVersion\Run registry key. To Open the ELM Advisor Window To open the ELM Advisor, right-click on the ELM Advisor icon in the toolbar and select Open ELM Advisor, double-click the icon, or click on an ELM Advisor pop-up. ELM Advisor in Windows Notification Area ELM Advisor Settings Configure the ELM Advisor through the Options dialog. To Open the ELM Advisor Settings dialog: Right-click on the ELM Advisor icon in the Windows Notification Area and select Options. Or open the ELM Advisor and select Tools Options from the menu. General Settings Tab Configures general settings for the ELM Advisor. The Startup setting automatically places the ELM Advisor in your Windows Notification Area. The Retention setting allows you to control the number of events maintained by the ELM Advisor. Note that this effects the amount of memory used by the ELMAdvisor.exe process. When the Console file field is blank, selecting ELM Console from the menu will open the default ELM Console snap-in, if the ELM Console was installed locally. If you have integrated the ELM Console into another MMC Console, you can specify that custom.msc file in this field.

26 26 ELM Help Servers Tab Displays the status and name of ELM Servers registered with your ELM Advisor. During install of the ELM Server and ELM Console, the local ELM Server is automatically registered with the local ELM Advisor. Remote ELM Servers need to be registered by clicking the Add button. ELM Server status is checked approximately every 5 minutes. So if the ELM Server is temporarily unavailable, then the ELM Advisor may show a status of Disconnected for up to 5 minutes after the ELM Server has come back on-line. The connection can be re-establish more quickly by selecting the ELM Server that's back on-line and clicking the Test button. If the ELM Advisor does not get a response from the ELM Server, it then checks for the NormalShutdown registry key on the computer running the ELM Server. If this is missing, then ELM Advisor will attempt to restart the ELM Server service. There must be RPC connectivity to the ELM Server and the logged on user running the ELM Advisor must have permissions to the registry and to services on the ELM Server for this to succeed.

27 Getting Started 27 Responses Tab Configures the type of response when events are received at the desktop. Responses can be independently configured for each of the five event types: Information, Warning, Error, Audit Success, and Audit Failure. As illustrated in the screenshot, the four responses are: Popup Window
28 28 ELM Help Sound File Beep Note: Not Supported with 64-bit Operating Systems Do Nothing
29 Getting Started ELM Publisher ELM Publisher reports in ELM uses ASP.NET to produce and manage reports. Predefined reports are grouped into categories for easy reference. Reports are configured by selecting Monitoring Categories, which triggers the report to import appropriate Monitor Items. The reports can be run ad-hoc or scheduled to run at specific times. Reports can be viewed through the ELM Console or a web browser. The URL to the Reports folder is defined during setup by specifying the name of the virtual directory. Check IP Address restrictions under Directory Security in Internet Information Services manager on the ELM Server computer. Managing Reports Reports can be viewed through the ELM Console or a web browser connected to the ELM Reports virtual directory. Expand Results -> Reporting and click on the ELM Publisher container to view the report options. The top section of the ELM Publisher Reports page has links for Assign, Schedule, and Directory. Assign can be used to configure and assign reports to standardized Monitoring Categories. It is an effective tool for configuring many reports at once. Schedule is used to setup schedules for individual configured reports. Directory provides links to scheduled reports which have completed. The lower section of the ELM Publisher Reports page has links for groups of reports. Click on a group, Applications, Security, Inventory, or Health and Performance, to see the individual reports. Within a group, click on the Report Name and select View Report. Note The first time a report is run, it must be assigned to Monitoring Categories. A screen will appear prompting you to assign the report to one or more Monitoring Categories. The assignment will publish monitor items to the ELM Server which collect data to support the report. Until the monitor items have been run there may not be data in the database to support the report. Also note that if the assigned Monitoring Categories contain no Agents, then the report will display data for all Agents. When previewing reports, ASP.NET cache life timing may prevent a graph from displaying, although a data grid with equivalent data is displayed. To resolve this, wait a few minutes and refresh the report chapter. Using the report viewer The Report Viewer includes a navigator listing the chapters in the report and a filter criteria selection. Open the Report Viewer by clicking on a Report and selecting View Report Chapters displays a list of the chapters in the report. Each chapter name is a hyperlink to more information in the report.
30 30 ELM Help Filter Criteria defines the data to be included in the report. Most reports can be filtered using the Date Range and Agents selections. Options Print View opens the report for print preview without the navigator. Settings opens the settings dialog to adjust the settings for the report. Close Window closes the report viewer. Managing Scheduled Reports Scheduling reports allows you to run the report at regular intervals. To Open the Report scheduler 1. Click on the Reports container. 2. Click on Report Scheduler. To Add a Report Schedule 1. Click on Add New in the report Schedule window. The Report Scheduler Wizard dialog will appear. 2. The dialog will offer a list of the reports that have been assigned to Monitoring Categories. If the report you want to schedule is not in the list, go back to view the report settings in order to assign it to Monitoring Categories. 3. Select the report you want to schedule and click Next. 4. The Report Filter Settings page will appear. Select the date range for the report and click Next to continue. 5. The Report Frequency Page will appear. The Report Start Time determines the time of day the report will be run. The Report Start Date determines the first time the report will be run. The Report Frequency determines how often the report is run. Click Next to continue. 6. The Report Delivery Settings page will appear. Enter the Directory in which to store the report, and enter the Name of the report file to be created. Click Next to continue. 7. The Report Schedule Name dialog will appear. Enter a Name under which to store the schedule settings and click Next to continue. 8. The Review Changes dialog will appear. Click Finish to store the report schedule. Note Variables can be used in the Directory and Name fields. Using variables, you may replace or create new files as needed. To replace files, ensure the name will be identical each time the report is run. To create new files ensure it is different by using the appropriate variables. To Change a Report Schedule 1. Click on the Schedule Name and select Settings from the menu. The Report Scheduler Wizard dialog will appear. 2. Enter values for the Scheduler Wizard dialog pages as in steps 4 through 8 of the To Add a Report Schedule section. To Delete a Report Schedule 1. Click on the Schedule Name and select Delete from the menu. The Schedule dialog will appear. 2. To delete any files that resulted from the scheduled report running, put a checkmark next to Do you want to delete all scheduled output files also? 3. Click OK to delete the Report Schedule.
31 Getting Started Viewing Scheduled Reports ELM Publisher Reports Result Directory will not show reports created in custom locations. To view a report through the Reports Folder: 1. Open the Directory container. 2. Click on Scheduled_Reports to open the completed reports folder. 3. Click on the Schedule Name to see all the completed reports for the schedule. 4. Click on the report name of the date you want to view. 31
32 ELM Help ELM Web Viewer The Web Viewer provides a read-only view of your ELM Server data. You may also enable and disable items, and view reports that have been saved and output in HTML format. If IIS is installed on your ELM Server, during installation of the ELM Server you are presented with an option to automatically create an ELM virtual directory on the ELM Server. If your IIS server is running multiple Web Sites (also known as Virtual Web Servers), you can select which Web Site should contain the ELM virtual directory. The virtual directory should point to the WebSite directory on your ELM Server (by default, C:\Program Files \ ELM Enterprise Manager \ WebSite). The Web Viewer provides access to the following items: Monitoring All Monitors All Notification Methods Event Views Performance Data ELM Publisher Reports The Web Viewer is implemented using COM objects within ASP.NET Web Server Pages documents. It uses the Extensible Markup Language (XML) as the transport mechanism for the data, making it lightweight and fast, and XSL (XML Styles) to format the data's appearance. The Web Viewer can be installed on Internet Information Server/Services 5.0, 5.1, 6.0, 7.0, and 7.5. Integration with IIS means that you can secure the Web Viewer from unauthorized use. In addition, you can control the name of the virtual directory, the port, and other properties. The Web Viewer server components must run on the ELM Server computer. After installation on the server, the Web Viewer can be accessed by pointing a Web browser at the virtual directory (by default ELM). For example, to access the Web Viewer on the local machine, point a Web browser to Web Viewer Security Secure the Web Viewer against unauthorized usage or access in three ways: Secure IIS - Microsoft has several security documents for Internet Information Services. These documents should be reviewed carefully, and steps should be taken to secure the IIS server. Secure Containers and Items in the ELM Console - You can use native Windows access control lists (ACLs) to secure containers or individual items. These settings are made through the ELM Console snap-in, and are respected by the ELM Web Viewer. DCOM Security - Windows Component Services can be used to restrict or grant access for remote Web Viewer users. To grant access, give the user Launch and Activation permissions to the TNT Software application registered with DCOM. See Web Viewer Security for more details. Web Viewer User Interface The Web Viewer presents ELM Server and Agent data within a Web site. The hierarchy and
33 Getting Started 33 presentation is very similar to that in the ELM Console. On the left side is the navigation menu. When you click one of the menu options on the left, the resulting page will be shown in the larger right-hand frame. There are several menu items on the left side (which are duplicated with icons on the Web Viewer home page as shown above): Monitoring - Displays a list of Agents. Click on an Agent Category to display details. Clicking on items on each page displays more details. All Monitors - Displays a list of all monitors configured within ELM with a description for each. The right column displays the monitor item state, enabled or disabled. Click on an individual Monitor item to see a selection to display settings for schedule, action method, and a selection to disable or enable the monitor item. Event Views - Displays a list of all Event Views. Click on an individual Event View to display all matching events, include event filters, or exclude event filters for that view. Click on the number in the Count column to display details about an individual event. Performance Data - Displays a list of items that are monitored for performance information. Click on an individual item to display details. Reports - Accesses the ELM Publisher pages. Search Events - Search for events in the database based on a variety of criteria. Help File - Click on this link to download the compiled HTML Help file (.CHM file) which contains the ELM product documentation. On detail pages, these selections can be found: Properties - Click Properties to view the current item's properties. Disable/Enable - Where appropriate, you may enable or disable individual items from the Web Viewer. When an item is enabled, the Menu Option will read Disable. When the item is disabled, the Menu Option will read Enable.
34 User Guide Part 3

35 User Guide 3 35 User Guide Welcome to ELM Enterprise Manager 6.7. This is the on-line help for the next generation of TNT Software's award-winning monitoring, notifying, reporting, and archiving solution. Enterprise Manager is the flagship product from TNT Software, Inc., encompassing the capabilities of ELM Log Manager, ELM Performance Manager, ELM Event Log Monitor, and more. Building on the success of its many predecessors, ELM 6.7 adds features for larger environments while maintaining its indispensability for administrators in small to medium size deployments. The ELM Console has been leveraged to provide a wide variety of monitoring, notifying, and result viewing options. Initial configuration can be accomplished quickly by using the Agent Deployment Wizard, Report Assignment Wizard, and pre-configured Event Views. Generational Archive Databases provide manageable sets of historical data, and Editor Reports give ELM administrators access to all data collected by ELM. The updated Help file has glossary items. They appear in green bold font and highlight ELM technical terms throughout the Help Pages. When you want a quick reminder for a term, click the green words. There is a navigation aid on each page in the top right corner, the ELM logo will scroll you "to the top" of the page. Below is a list of links to major sections of the Help file. More detailed pages are listed in the Table of Contents. Legal/Copyright Notice Getting Started ELM Console Glossary 3.1 ELM Console The Microsoft Management Console (mmc) based ELM Console is divided up into five main areas. These areas are: ELM Server - Describes ELM At a Glance, explains the properties of the ELM server and ELM icon in the Windows Control Panel, and explains the concept of Home and Standby. Database Settings - Describes the Connections, Retention Policy, Archive, and Properties concerning setting up the ELM Primary, ELM Failover, and ELM Archive databases. Monitoring and Management - Describes the Monitoring container, the purpose of the Monitoring Categories, and explains the Monitor Items. Viewing and Notifying - Describes the purpose and configuration of the Event Views, Notification Methods, and Performance Data. Reporting - Describes ELM Editor reporting engine.
36 ELM Help ELM Server Default ELM Install Folder When ELM 6.7 is installed for the first time on a computer, the default install folder for a 32 bit system is: c: \ Program Files \ ELM Enterprise Manager and for a 64 bit system: c: \ Program Files (x86) \ ELM Enterprise Manager. The ELM Server is the engine behind the user interface that handles all of the processing of Monitor Items, Virtual Agents, and Event Views. It consists of: Server Properties - Describes the components that make up the ELM Server and Licensing. ELM-at-a-Glance - Describes the At-A-Glance display. Control Panel - Describes the settings that the ELM Server uses such as port information, forwarding events to other ELM Servers, ELM Server logging levels, and database settings. Home and Standby - Describes the functionality available for disaster recovery plans Server Properties The ELM Server properties dialog displays diagnostic and licensing information about the ELM Server. Licensing If you are running ELM in evaluation or with a temporary license, the Licensing tab will indicate when the evaluation period expires. If you have purchased ELM, you will receive a Serial Number which must be entered into the ELM Server Properties - Licensing tab. Enter the information exactly as it appears on your Software License Agreement. If you did not receive an SLA with your purchase, or if you cannot locate your SLA, please contact Sales@TNTSoftware.com You must activate your license within 7 days after your Serial Number has been entered. If the product is not activated within 7 days, the product is locked until it is activated. If you have Internet access on your ELM Console computer, you may activate over the Web. If you don't have Internet access from your ELM Console, you may call or TNT Software to request an activation file for your license. We will send a TNTKEY file to you to activate the license. To view the Licensing tab: 1. Open the ELM Console. 2. Right-click on an ELM Server and select Properties. 3. Click on the Licensing tab. Note If the evaluation period has expired or if you received a temporary serial number which has expired, you must close and re-open the ELM Console after entering a valid serial number for the unlock procedure to complete. To activate your license:

37 User Guide Open the Licensing tab. 2. To enter your Serial Number, select Edit/Activate. 3. If you have Internet access, select Web Activation, and click the Activate button. If you do not have Internet access: 1. Contact TNT Software at or by telephone at TNT Software will you a TNTKEY file. Save this file to the file system. 3. Select File Activation and use the Browse button to select the TNTKEY file. 4. Click the Activate button. Once activated, the number of Agents in-use and total number of Agents for the license, by class, are displayed in the Licensing dialog. In the example figure below, this license allows a maximum of 1 of each type of license is allowed. It also shows that no licenses are in use. If you have any licensing or registration questions, please contact TNT Software's Sales Department: Sales@TNTSoftware.com. Modules This tab displays module (DLL), process, thread, and other diagnostic information about the ELM Server and ELM Console. TNT Software's Product Support Group may request this information. To view the Modules tab: 1. Open the ELM Console. 2. Right-click on an ELM Server and select Properties. 3. Click on the Modules tab. To copy the Module information: 1. Right-click anywhere in the module details. 2. Click Select All to highlight all the module details. 3. Right-click the highlighted area and click Copy. 4. Open a text editor and paste the module details to a text file. You can gather additional diagnostic information through the Server Properties Diagnostic tab. Properties Tab This read-only tab displays the properties of the selected object and the values for those
38 38 ELM Help properties.

39 User Guide ELM At A Glance There are several At-a-Glance Views in the ELM Console and optional ELM Web Viewer. A global view of ELM monitoring can be displayed by selecting the ELM Server root node in the console tree. It shows a summary of application or system outages, the status of Agents, ELM Database, and ELM Server. Similar views can be displayed for each agent by selecting the Agent, or one of its sub-containers, in the console tree. Current Application or Server Outages - If there is an Inventory Collector assigned to Agents monitoring Windows systems, the Inventory Collector will record application outages and data for the Server Reliability and Inventory reports. If there is a current outage, or a server or application that is not currently running, there will be a record of it here. The outages container within the Agent node will display current and historical information. Agent Status - Displays if an Agent is not responding or it is sending information to the ELM Server that it is not working properly. ELM Database Status - Displays the current status of the database. If a database is nearing capacity or it is offline, an alert appears here indicating the issue. Click on Show Details to see the database settings and how much space is being used by each database.
40 40 ELM Help ELM Server Status - Displays the current system resources in use by the ELM Server Control Panel The ELM Server includes the ELM Control Panel applet, which appears in the Windows Control Panel. To access it, open Control Panel and choose the ELM Enterprise Manager applet. Note For Windows 2003/ bit systems, in the control panel, the ELM applet is located under the "View x86 Control Panel Icons". It contains the following tabs: Options ELM Server Listen Port - Enter the port number on which the ELM Server listens. By default, an ELM Server will listen on port Unknown Agents - Enables the ELM Server to automatically add systems that send data to the ELM Server (e.g., Syslog messages, SNMP traps, etc.), provided there are licenses available. By default, this checkbox is checked. If you do not want systems that send data to the ELM Server to be automatically added as Agents, uncheck this box. Note For auto add to work, an appropriate Syslog or SNMP receiver monitor item needs to be assigned. If there's no receiver, the ELM Server isn't listening for incoming traffic. For example, unless there's an SNMP Receiver monitor item created, regardless of this option being checked, an agent won't be created if a trap is sent to the ELM Server. Real-Time Console - Toggle the streaming of new events from the ELM Server to the ELM Console on and off. When this checkbox is checked, Event Views in the ELM Console are database driven and must be manually refreshed in order to display data. When this checkbox is empty, events stream into and are displayed in the ELM Console as they are received by the ELM Server. Forwarded Events This is only for ELM Enterprise Manager. ELM has the functionality to forward events to another ELM Server using a Forward Event Notification Method. Events forwarded from another ELM Server are accepted only if the sending ELM Server's IP Address is listed. Diagnostics
41 User Guide 41 The Start Diagnostics button launches the ELM Diagnostics Tool (TNTDiag.exe). The ELM Diagnostic Tool (TNTDiag) is a troubleshooting tool used to trace some or all activity of an ELM Server, an ELM Console, and/or a Service Agent. The diagnostic output produced by this tool is intended for TNT Software's Product Support Group. This tool adds overhead to the system and should be used only under the direction of TNT Software support personnel. TNTDiag installs itself as a service when performing its operations. It can be used by administrators only. TNTDiag can also be started from a command prompt. This enables starting a diagnostic trace from a Windows scheduled task. Syntax is: /Quiet - Starts a TNTDiag trace using the options in TNDiagConfig.xml /Save - Saves a currently running TNTDiag trace started using the Quiet command line /Stop - Stops and saves a currently running TNTDiag trace started using the Quiet command line /? or H[elp] - Display this text and exit Logging Set the level of logging activity to one of three pre-defined settings. In general the three levels control logging by event type as indicated below. Low - Log errors only. Medium - Log errors and warnings. High - Log errors, warnings and informational events. Only events that are written to the Application log respect logging level and logging cannot be completely turned off. Database This tab displays current database configuration information. You may click the Database Settings button to configure database settings.
 from Agents")
42 ELM Help Home and Standby Premise ELM provides additional Fault Tolerance by providing the option to employ a Standby ELM Server which will accept data (Events, Performance Data) from Agents should the primary (now referred to as the Home) ELM Server become unavailable for an extended period of time. The Standby server may be another active ELM Server on the network servicing its own group of Agents, or may be simply another server on the network with an idle instance of ELM running. In the active-active ELM Server scenario, each ELM Server may be configured as the Standby server for the other. However, each Agent can have only 1 Home ELM Server, and 1 Standby ELM Server. This is illustrated below: ELM Server A is the Home Server for Workstations 1 and 2, plus it is the Standby Server for Workstations 3 and 4. ELM Server B is the Home Server for Workstations 3 and 4, and the Standby Server for Workstations 1 and 2. Active-Active ELM Servers Only ELM Service Agents can be configured to Switchover and Switchback to the ELM Standby Server. Virtual Agents and IP Virtual Agents cannot be configured for use with this feature. The ELM Standby Server must have sufficient unallocated licenses available to accommodate the Agents it receives during Switchover from the ELM Home Server. Note that these licenses are allocated on a first-come, first-served basis. Any Agents that attempt to Switchover without an unallocated license will fail to Switchover and will remain in Mode. Configuration All Agents should be deployed from their Home ELM Server. To configure Agents with Home/ Standby properties, the following keys must be edited in the appsettings.xml file, found in the
43 User Guide 43 ELM installation directory on the Home ELM Server: 1. StandbyELMServerName 2. StandbyELMServerIPAddresses 3. StandbyELMServerPort 4. StandbyELMServerIndex - This can be found on the Standby ELM Server, in the following registry key: HKLM\SOFTWARE\TNT Software\ELM Enterprise Manager\6.7\Settings::Console Item Index 5. StandbyELMServerLicenseKey - This can be found on the Activation tab of the Standby ELM Server. 6. StandbyELMServerAgentCategoryName - All agents switching over to the standby server will be assigned to this category. This appsettings key is optional on the Standby Server, and the home server ignores this key. The category will be created by the standby ELM server when Agents switchover. If not present, Agents in Standby mode will appear only in the All Agents container in the Standby ELM Server Console. 7. HomeELMServerAgentCategoryName - This Category will be created by the ELM Home Server when it is restarted, and all agents assigned to this Category will have Home and Standby properties. 8. HomeELMServerCacheDurationInMinutes - See Switchover for more details. 9. HomeELMServerRetryIntervalInMinutes - See Switchback for more details. The following sample appsettings.xml entries can be found near the bottom of the file. In a default ELM install, the keys are commented-out. The Home Server keys in the example below are commented-in to facilitate copy/paste. <!-- ELM Home/Standby server keys The below keys must all be set in the Home Server's appsettings file to enable the Home/Standby feature. Search for 'Standby' in the Help file for more information. --> <add <add <add <add <add <add put in it <add <add key="standbyelmservername" value="netbios Name of Standby Server" /> key="standbyelmserveripaddresses" value=" " /> key="standbyelmserverport" value="1251" /> key="standbyelmserverindex" value="{ }" /> key="standbyelmserverlicensekey" value="{ }" /> key="homeelmserveragentcategoryname" value="this Category will be created, and agents will have the Home/Standby behavior" /> key="homeelmservercachedurationinminutes" value="1" /> key="homeelmserverretryintervalinminutes" value="1" /> <!-- optional for the standby server appsettings file --> <!-- add key="standbyelmserveragentcategoryname" value="if this category exists, agents switching to the standby on this server will exist in this category" / --> All Agents desired to Switchover to the Standby server must be placed in the Category defined in the "HomeELMServerAgentCategoryName" appsettings.xml key. After restarting the Home ELM Server, this Category will be created and visible in the ELM Console.
44 44 ELM Help Tip After editing appsettings.xml, open it using Internet Explorer to verify there are no xml formatting errors. Both ELM Server services must be restarted to activate changes to appsettings.xml. Note If testing switchover functionality, be sure to generate at least 1 test event to create a cache file, and at least 1 test event after the "Cache Duration" timer has elapsed. The cache file starts the timer, and the 2nd event triggers switchover. Functionality Switchover The ELM Service Agent caches for HomeELMServerCacheDuration (this value could be zero). This timer is started when a cache file is created. If this duration has been exceeded before adding data to the cache file, the Agent will attempt to open a socket connection to the Standby server. If it fails to open a connection it will continue to cache as normal. If the socket connection succeeds and it can get a license, then the agent informs the Standby server that it is switching over (which may involve sending some configuration information). The Agent then sets its server properties to point to the Standby server and begins sending the cache to the Standby server. Sending configuration to the Standby ELM Server requires that the Agent know the Standby ELM Server s Index, and does not depend on the AutoAdd flag on the Standby server. A 5318 event is written to the Agent's Application event log. Switchback Each time at least HomeELMServerRetryIntervalInMinutes has elapsed and there is data to send or an Agent Heartbeat occurs, the agent tries to connect to the Home ELM Server. This timer is started when the Agent successfully switches over to the Standby Server. If the HomeELMServerRetryIntervalInMinutes is set to zero, Agents will wait for the Home server to initiate switchback. Switchback can be initiated automatically by an Agent Monitor on the Home Server, or manually by running Update Agent Configuration for one or more Agents. When switching back to the Home server, the Agent must first tell the Standby server that it has reestablished communication with its Home server (this causes the Agent to release its license on the Standby Server and be marked as staged). A 5317 event is written to the Agent's Application event log. Blackout condition If an ELM Service Agent is unable to contact either the Home or the Standby server, it enters Blackout mode. It will go into cache mode, and begin caching data for the currently configured server (Home or Standby). Deleting an ELM Standby Agent Before deleting an Agent configured for Home/Standby operation, make sure the following criteria
45 User Guide 45 are met: The Agent is reporting to the Home Server. The Agent is deleted from the Home Server Console or from Add or Remove Programs on the Agent computer. Deleting an Agent when in Standby mode, or from the Standby Server will leave Agent components behind.
46 ELM Help Database Settings During installation, ELM requires two databases, a primary and a failover database. These databases can be in any combination of: Microsoft SQL 2008 Express/R2/Standard/Enterprise, Microsoft 2012 Standard/Enterprise. the same instance or separate instances local to the ELM Server computer or on a computer available on the network default instances or named instances ELM will need write permissions so that it can create the databases. Given an instance and permissions, ELM will create the database, tables, indices, and constraints required. To open Database Settings, right click on the ELM Server computer name and select Database Settings from the menu. Database Settings is used to configure: Connections - Setup the connections to the ELM Primary, ELM Failover, and Archive databases. Retention Policy - Data management, area to configure when to delete/archive data. Archive - Database archive management, when to rollover archive databases. Properties - A summary of the Database Settings in an easy to read format. Primary Database The primary database is the database used by ELM for storing data gathered from monitored systems. Types of data collected include: Windows event log entries Events generated by the ELM Server and Agents SNMP Traps SNMP Values Syslog Data Performance Data Maintenance Microsoft SQL job An optional database maintenance plan is enabled by default for the ELM primary database to run at midnight every night. The plan runs in the ELM server process and will perform integrity checks on the database, rebuild indexes to optimize the database, and backup the database. These settings are located in the databasesettings.xml file. Failover Database The ELM Server has built-in database failover protection to minimize data loss in the event the ELM Server's primary database is unavailable. During normal operation, there will be no tables created in this database by ELM. When ELM is using the failover database, tables will be created as necessary.
47 User Guide 47 When the ELM Server detects a connectivity problem with its primary database, ELM will log the following event: Event Type: Warning Event Source: EEMSVR Event Category: None Event ID: 5214 Date: 4/26/2010 Time: 1:15:02 PM User: N/A Computer: ELMSERVERCOMPUTER Description: A critical database failure occurred and the temporary database ELM_FAILOVER on SQLSERVER\INSTANCENAME has been enabled. Data in this temporary database will be merged with the configured database when it becomes available. Error: 0x , Microsoft OLE DB Provider for SQL Server, [DBNETLIB][ConnectionOpen (Connect()).]SQL Server does not exist or access denied. SQL Error: 0x , When this happens, ELM begins using the configured failover database and stores data in matching table names. When connectivity to the primary database is restored, the following event will be logged: Event Type: Information Event Source: EEMSVR Event Category: None Event ID: 5216 Date: 4/26/2010 Time: 1:22:22 PM User: N/A Computer: ELMSERVERCOMPUTER Description: The configured database has returned on-line. Temporary data written to ELM_FAILOVER on SQLSERVER\INSTANCENAME is now being merged with the database. When ELM has completed merging data back into the primary database, the tables in the failover database will be deleted and the following event will be logged: Event Type: Information Event Source: EEMSVR Event Category: None Event ID: 5217 Date: 4/26/2010 Time: 1:22:26 PM User: N/A Computer: ELMSERVERCOMPUTER Description: Success, recovery attempt completed for the database. Table: TNTEvents Status: Success Rows processed: 1 [Succeeded: 1 Duplicate: 0 Failed: 0] Processing Time: 0h:0m:1s Table: TNTEvents Status: Success Rows processed: 112 [Succeeded: 112 Duplicate: 0 Failed: 0] Processing Time: 0h:0m:1s Table: TNTSecurity Status: Success
48 48 ELM Help Rows processed: 38 [Succeeded: 38 Duplicate: 0 Failed: 0] Processing Time: 0h:0m:1s Total Processing Time: 0h:0m:3s All data written to the failover database will be automatically merged into the primary database. Note The ELM Server will try once to failback the temporary database and merge with its original database. If this process fails, tables in the failover database will be renamed ERR%y%m%d-%H%M%S, where %y%m%d-%h %M%S represents the Year, Month, Day, Hour, Minute, Second at which the renaming took place. During database failover, it is possible for Events to appear in the ELM Console that are stored only in the ELM Server's primary database, and not in the temporary database. An attempt to open one of these items will fail because the record will not be in the database currently in use. When the database has failed back to the primary database, all Events will be accessible. Archive Database The Archive database is an optional database that can be used to minimize the size of the ELM primary database, improving the responsiveness of the ELM Console. It is not required that the database be created in SQL ahead of time; ELM can create the database and tables if it has adequate permissions to SQL. To connect an Archive database, right click the Viewing and Notifying container -> Connect Archive Database.

49 User Guide Connections When entering the SQL Server name for the ELM databases, use the default: just the name of the SQL server or one of 3 possible alternate formats as described below. Note This syntax for SQL Server name can be used for all 3 ELM databases: Primary, Failover, and the optional Archive database. ELM Database Authentication ELM can authenticate to the database using either Windows Authentication (recommended) or SQL Authentication. With either type of authentication, the ELM Server service will need DDL permissions like create databases, tables, and views, and DML permissions like select, insert and delete records. These permissions are inherited when the db_owner role is assigned to a user account in SQL Management Studio.
50 ELM Help Retention Policy Event Data Event log records produce a high volume of data. It is recommended that you configure the Retention Policy to periodically archive and/or delete dated or unneeded records. In order to archive data, an archive database must be setup on the Connections tab. Retention The Retention tab controls the amount of time that events are kept in the primary ELM database. Records older than the age specified in this window are deleted at the Scheduled Interval and Scheduled Hours selected in the Schedule dialogs. Retain - Enter the amount of time to keep data in the ELM primary database. Archive - If Archive is enabled (checked), records will be copied to the Archive Database before deletion from the Primary database. The Archive checkbox is disabled (grayed out) if the archive database has not been configured.

51 User Guide 51 Event Filter Criteria The following fields are available for filtering purposes: Agent Category is Computer Name is Log Name is Username is Event Source is Event ID is Category is Message contains This dialog box has a dynamic menu behavior. The ellipsis buttons next to the Agent Category is,
52 52 ELM Help Computer Name is, Log Name is, and Event Source is fields browse and display the computer names, event log names and event sources. If the Computer Name is field is left empty, the list of event Logs and Sources is generated based on the event sources registered on the ELM Console computer (e.g., the local computer). If you enter a valid, resolvable name in the Computer Name is field and then click the ellipsis for the Log Name is or Event Source is fields, the list of event Logs and Sources from that system will be displayed. If the log or event source from which you want to collect data does not appear on the list, type it in the appropriate field. For example, if you are not running DNS on your ELM Server or Console, but want to collect events from the DNS log only, type DNS in the Log Name is field. If a field is blank, it will match every value in the field. For example, if the Computer Name is field is blank, the Filter will apply to all monitored computers. If all Event Types are unchecked when the Event Filter is saved, all of the Event Types will be checked. This is by design. Leading and trailing wildcards ( * ) and character position wildcards (? ) are supported, as are the Boolean operators Or ( ), And ( & ), and Not (! ). However regular expressions are not supported. You may use these wildcards to specify the criteria to be applied. For example, to select messages from SQL Server you may specify *SQL* as the event source to select any Source name containing the letters SQL. To match SQL messages from servers ALPHA, BRAVO, or CHARLIE you would enter ALPHA BRAVO CHARLIE in the Computer Name is field. Important Leave no white space adjacent to the operators. Note If you enter the name of an untrusted system in the Computer Name is field and then use the ellipsis buttons for Log or Event Source, the menus will not be displayed. This is because authentication fails. To work around this problem, first make an IPC$ connection to the target system using alternate credentials. For example, if the untrusted system's name is SERVERA, you could use: NET USE \\SERVERA\IPC$ /user:servera\administrator * You will be prompted for the password for the account you specify. The dynamic menu behavior will work when the IPC$ connection has been established.
53 User Guide Archive If the Archive settings are grayed out, it's because an archive database needs to be setup on the Connections tab. Note: Due to database schema changes from products earlier than ELM 6.5, only Reports will return data from an archive. The Archive database is an optional database that can be used to minimize the size of the ELM primary database, improving the responsiveness of the ELM Console. There is also a rollover option to provide generational archives based upon a default 1 Month time frame or by size, the default 20 GB. Once the archives are created, the ELM Console can be connected to these historical databases for ad hoc reports or forensic investigation. The Server can be a local or remote Microsoft SQL instance. If a named instance of SQL is used, enter the server name using the pattern: servername\instancename.

54 54 ELM Help By default, users have two choices as to when the Archive DB will rollover and create a new database: either once a month (the 1st of every month) or once every 20 GB. Changing to different time periods or database sizes requires direct editing of the databasesettings.xml file. Note: ELM checks the size of the archive database prior to the archive event and will create a new archive if the size exceeds 20GB. Because of when this check occurs you will have an archive over 20GB. Example: If you current archive is 19GB and you archive 7GB of data, you will then have an archive of 26GB. The next time the archive event occurs ELM will now see it is over the 20GB size limit and create a new archive.

55 User Guide Connect to Archive Database Right Click Viewing and Notifying > Connect Archive Database and select the Archive database to connect to: If there isn't an Archive database to connect to that ELM knows about or the Unmanaged Database button is selected, connect to the SQL server and database using the following: Connecting an Archive database will add the Archive [database name goes here] container to the ELM Console and will contain Event Views, Performance Data, and Reporting.

56 56 ELM Help Note The default Date Range for an Event View is From Date: 4 Days ago To Date: Now. The Now has been modified only in Archive databases to actually mean the newest event in the Archive database. To return events from an Archive, this Date Range may need to be changed to include dates from when those events were collected. To disconnect the Archive database, right click the Archive [database name goes here] container and select Remove Properties Provides a quick overview of the settings made on the Connections, Retention Policy, and Archive tabs.
57 User Guide Monitoring and Management The Monitoring and Management container in the ELM Console is where Agents, Monitor Items, Monitoring Categories and Maintenance Categories reside. This section includes: Agent and Monitoring Library - Describes the different agent types, agent licensing options and classes, Monitoring Categories, agent folders, and the agent(s) installation process. Monitoring Categories - Allows you to group Agents for easy management. Maintenance Categories - Allows for grouping of Agents for easy management during scheduled maintenance periods. ELM can monitor systems and collect data in real-time or at scheduled intervals. Each Monitor Item has its own schedule components: A scheduled interval, which determines how frequently the monitor item is executed. Scheduled hours, which specifies what days/hours the monitor item will run. For real-time monitoring, a Service Agent must be used. Virtual Agents cannot monitor in real-time because all Virtual Agent monitoring is performed over the network by the ELM Server. We recommend a scheduled interval of 10 seconds or greater for Monitor Items assigned to Virtual Agents. To monitor continuously, set the Scheduled Interval on the Monitor Item to Every 1 Second. The Scheduled Interval can be increased to the desired interval. For example, to collect event logs twice a day, an Event Collector's Scheduled Interval would be configured for every 12 hours Agents and Monitors Library This container includes All Monitors in ELM that are configured to monitor your systems and All Agents lists all systems being monitored by ELM. All Agents is a category within ELM, similar to other Monitoring Categories, but it cannot be modified. It will always show a list of all agents.

58 58 ELM Help Managing Monitoring Products Monitoring Capability Feature Comparison All Monitors Monitor Items control the different types of information collected by ELM. For example, to collect events from a Windows computer, you would use an Event Collector; to monitor services, you
59 User Guide 59 would use a Service Monitor; and to watch a performance counter threshold, you would use a Performance Alarm. Below are the Monitor Items included in ELM Enterprise Manager. The All Monitors container displays all of the configured monitor items. To disable all of the monitor items at the same time, right click the All Monitors container and select Disable. This disables all of the monitor items at the container level and doesn't change the specific monitor items settings. Data Collector and Real-Time Monitors Event Collector - Event Collectors collect events from the event logs on Windows 2000, Windows XP, Windows Server 2003, Vista, Windows 7, and Windows Server You can specify the events to collect based on a variety of event criteria, including event type, source, event ID, and event details. Event File Collector - Event File Collectors collect raw.evt or.evtx logs on Windows 2000, Windows XP, Windows Server 2003, Vista, Windows 7, and Windows Server You can specify which logs to collect, and optionally clear the Event Logs at each collection interval. Collected.evt files can be compressed and signed if a signing certificate is available. Inventory Collector - The Inventory Collector gathers details on the Agent operation system and on applications that have been installed on the Agent. Only applications that appear in the 'Add or Remove Programs' or 'Programs and Features' applet in the Windows Control Panel will be inventoried. This Monitor Item is for Windows Agents only. Performance Collector - The Performance Collector collects and stores performance data from Windows 2000, Windows XP, Windows Server 2003, Vista, Windows 7, and Windows Server A Performance Collector is a group of performance counters that are collected at the same time. You may use multiple Performance Collectors that contain different groups of counters, or a single Performance Collector that contains all of the counters you want to collect. Application and Server Status Monitoring Cluster Monitor - Cluster Monitor watches cluster system and cluster registry events. The Cluster Monitor thread can monitor any or all of the seven Cluster APIs: cluster events, quorum events, network events, node events, group events, resource events and registry events. Event Alarm - Event Alarms trigger action and/or notification when an event does or does not occur. Event Alarms can be configured for Windows 2000, Windows XP, Windows Server 2008, Vista, Windows 7, and Windows Server File Monitor - File Monitor monitors individual log files, an entire directory of files, or an entire directory tree of files. Monitored files must be text (ASCII)-based and non-circular in nature (i.e., they do not overwrite themselves after a certain size, etc., is reached). IIS Monitor - The IIS Monitor monitors Internet Information Services 5.0 (Windows 2000), 5.1 (Windows XP) and 6.0 (Windows 2003) only. The IIS Monitor periodically checks the state of IIS for state changes and broken paths. It executes a File Monitor internally (no separate File Monitor configuration necessary) to parse the IIS log files for failed requests and connection attempts from blocked addresses (e.g., addresses blocked via IIS security). Performance Alarm - Performance Alarms monitor performance objects, counters and instances and
60 60 ELM Help can generate a variety of Notification Methods when a counter or instance of a counter is greater than, less than or equal to a specified threshold for a specified duration. Process Monitor - The Process Monitor monitors individual processes. The Process Monitor is multifunctional; it can let you know when a process has exceeded the threshold of CPU usage you specify, and it can track when processes are initiated or terminated. Service Monitor - Service Monitor items monitor individual services and devices on Windows 2000, Windows XP, Windows Server 2003, Vista, and Windows Server Service Monitors can generate action or notification when a service or device is stopped, started, paused or resumed. The Service Monitor can write an event when it finds a service or device set to Automatic startup that is not running. SQL Server Monitor - SQL Monitors periodically execute SQL queries against a database and generate a variety of actions and notification options if the results returned are different from what is expected. SQL Monitors support Windows and SQL Server authentication, making them easy to fit into your existing SQL security environment. WMI Monitor - If you are using Windows Management Instrumentation (the Microsoft implementation of Web-Based Enterprise Management (WBEM)), WMI Monitors query a WMI namespace and database. If the results of the query change, a variety of actions and notification options can be executed. Cross Platform Monitoring Syslog Receiver - The ELM Server can receive Syslog messages from any TCP or UDP-based Syslog client. SNMP Alarm - SNMP Alarm queries an SNMP Object ID (OID) and triggers notification if the value is greater than, less than or equal to a specified value. The SNMP Monitor includes an object browser that enables you to query the objects on an SNMP-capable computer, and select specific objects for monitoring. SNMP Collector - The SNMP Collector collects and stores values from one or more OIDs provided by an SNMP agent. You may use multiple SNMP Collectors that contain different groups of OIDs, or a single SNMP Collector that contains all of the OIDs you want to collect. SNMP Receiver - The ELM Server can receive SNMP Traps and display them with and without Object IDs as part of the trap messages. Internet Service Monitoring FTP Monitor - The FTP Monitor monitors a specific FTP URL. If you are using a Service Agent, the Service Agent will periodically establish an FTP connection to the URL and port specified. If you are using a Virtual Agent or an IP Agent, the FTP polling is performed by the ELM Server. If the response is negative, or slower than expected, a variety of actions and notification options can be triggered.
61 User Guide 61 TCP Port Monitor - Port Monitor monitors a TCP port on any TCP/IP-based system or device. Specify the port you wish to monitor and the expected response time, in seconds. Ping Monitor - The Ping Monitor sends period ICMP echo requests to the Agent(s) being monitored. You can specify the size of the echo request packets and the number of packets that are sent. SMTP Monitor - The SMTP Monitor connects to the SMTP Server and times the initiating conversation from connection, through "EHLO," to "250 OK." Enabled Actions are executed depending on successful, slow, or failed responses. If you are using a Virtual Agent or an IP Agent, the SMTP polling is performed by the ELM Server. If the response is negative or slower than expected a variety of notification options can be triggered. Web Page Monitor - Web Page Monitors monitor web pages (HTTP). The system to which the Web Page Monitor is assigned (e.g., the ELM Server or a Service Agent) periodically fetches the specified URL. If the response is negative, slower than expected, or if the content has been changed, a variety of actions and notification options can be triggered. Resiliency Monitoring Agent Monitor - Agent Monitors perform regular heartbeat checks on Service Agents. If the Service Agent does not respond or is slow in responding, a variety of actions and notification options can be triggered Agent Monitor The Agent Monitor performs regular heartbeat checks on ELM Service Agents. If the Service Agent fails to respond or responds slowly, actions and notification options can be triggered. Agent Monitor Settings Attempt to restart Service Agent if connection attempt fails - When checked, attempts to restart a stopped Agent remotely by connecting to the Service Control Manager on the remote system. Warn if QoS slower than - Enter the number of seconds that are considered normal latency for socket sessions to the remote computer. If a socket communication session exceeds this value the Quality of Service Action will be triggered. If the Service Agent communicates with the ELM Server over slow or very busy network links, increase this value. Execute configured Action(s) for every failure - When checked, the Failed and Quality of Service Actions will be triggered for each interval if the condition is met. Leaving this box empty will create a monitor that generates a warning for the first failed or slow response time only. Actions Failed (Error) The ELM Server was unable to connect to the ELM Agent on the monitored computer. Success (Informational) The ELM Server successfully re-connected to the ELM Agent after previously failing to connect.
62 62 ELM Help Quality of Service (Warning) The ELM Agent is responding very slowly. Categories Displays the Monitoring Categories to which the Monitor is assigned. Click to select or deselect Monitoring Categories. Right click to create or edit Monitoring Categories. Test Monitor Test any Monitor Item against any Agent capable of running the Item using the drop-down and Test button on this dialog box. Testing a Monitor Item prior to putting it into production validates that the monitor item is configured properly. To test a monitor item: 1. Select the Agent you wish to test against from the drop-down list. 2. Click the Start Test button. If the test was successful, you will receive a pop-up indicating this and the option to see detailed results of the test. If the test failed, detailed results of the test will automatically open in Notepad. Schedule Displays the Scheduled Interval and Scheduled Hours settings which control the frequency for the Monitor Item. Scheduled Interval tab Specify the interval at which the monitoring, polling or action is to occur. Depending on the Monitor Item type, Items can be scheduled in interval increments of Seconds, Minutes, Hours and Days. The Scheduled Interval is relative to the top of the hour or top of the minute. For example, if a Scheduled Interval is configured for 10 minutes, the Monitor Item will execute at hh:10:00, hh:20:00, hh:30:00, hh:40:00, hh:50:00, h1:00:00, etc. If a Scheduled Interval is configured for 15 seconds, the Monitor Item will execute at hh:00:15, hh:00:30, hh:00:45, hh:01:00, hh:01:15, etc. Scheduled Hours tab Select the days and/or hours this item is active. By default, the schedule is set to ON for all hours and all days. Mouse clicks toggle squares between ON and OFF. Clicking on an individual square will toggle the active schedule for that hour. Clicking on an hour at the top of the grid, or on a day of the week at the left of the grid will toggle the corresponding column or row. Keyboard equivalents are the arrow keys and the space bar. Properties Tab This read-only tab displays the properties of the selected object and the values for those properties.
63 User Guide Cluster Monitor A Cluster Monitor is a cluster-aware component that provides extensive and configurable monitoring of Windows Server 2000/2003/2008 clusters via the Cluster API. A Cluster Monitor can be used to monitor any or all of the seven sets of Cluster APIs in real-time. Cluster Monitor Settings Cluster Events - Cluster Monitor uses this set of APIs to collect cluster events, information on cluster objects (including the quorum), and overall cluster state information. This includes cluster-related events that do not get logged to the event logs. Group Events - These APIs monitor cluster failover groups (also known as Resource Groups) by tracking and reporting group status and membership changes. Quorum Events - Cluster Monitor uses this set of APIs to monitor the cluster database. The cluster database, which contains data on all physical and logical elements in a cluster, is stored in the Registry. Check the Quorum Events and Registry Events checkboxes to monitor the cluster through these APIs. Resource Events - These APIs monitor clusters at the Resource level, including the initiation of operations on the resource (stopping, starting, etc.). Network Events - Cluster Monitor uses these APIs to monitor the network interface(s) and report status changes, including those interfaces monitored by the Cluster Service. The Cluster Service monitors all networks available for use by the Cluster Service as the "heartbeat" network. Registry Events - These APIs monitor cluster registry activity. Node Events - Cluster Monitor uses these APIs to monitor and track node status, cluster membership and resource ownership. A Cluster Monitor can be assigned to Cluster Agents for physical nodes only. It cannot be assigned to an IP Agent, a Workstation Agent, a Server Agent or a Cluster Resource (i.e., a virtual server or cluster resource group). When using a Cluster Monitor, the Agent type (e.g., Service Agent or Virtual Agent) must be the same for both physical nodes. For example, if you are using a Service Agent on one node, you must use a Service Agent on the other node. If you are monitoring cluster nodes, but you are not using a Cluster Monitor to monitor Cluster APIs, you may use Agents of either type for each node.
64 64 ELM Help Note Best practice is to not enable Event Log Replication on Clusters. ELM collects the events from the event log on each node of the cluster, if one node is not available, ELM would have captured all of the events up to that time frame. Actions Warning The Cluster Monitor has detected a warning condition. Error The Cluster Monitor has detected an error condition. Informational The Cluster Monitor has detected an informational condition. Categories Displays the Monitoring Categories to which the Monitor is assigned. Click to select or deselect Monitoring Categories. Right click to create or edit Monitoring Categories. Test Monitor Test any Monitor Item against any Agent capable of running the Item using the drop-down and Test button on this dialog box. Testing a Monitor Item prior to putting it into production validates that the monitor item is configured properly. To test a monitor item: 1. Select the Agent you wish to test against from the drop-down list. 2. Click the Start Test button. If the test was successful, you will receive a pop-up indicating this and the option to see detailed results of the test. If the test failed, detailed results of the test will automatically open in Notepad. Schedule Displays the Scheduled Interval and Scheduled Hours settings which control the frequency for the Monitor Item. Scheduled Interval tab Specify the interval at which the monitoring, polling or action is to occur. Depending on the Monitor Item type, Items can be scheduled in interval increments of Seconds, Minutes, Hours and Days. The Scheduled Interval is relative to the top of the hour or top of the minute. For example, if a Scheduled Interval is configured for 10 minutes, the Monitor Item will execute at hh:10:00, hh:20:00, hh:30:00, hh:40:00, hh:50:00, h1:00:00, etc. If a Scheduled Interval is configured for 15 seconds, the Monitor Item will execute at hh:00:15, hh:00:30, hh:00:45, hh:01:00, hh:01:15, etc. Scheduled Hours tab Select the days and/or hours this item is active. By default, the schedule is set to ON for all hours and all days. Mouse clicks toggle squares between ON and OFF. Clicking on an individual square will toggle the active schedule for that hour. Clicking on an hour at the top of the grid, or on a day of the week at the left of the grid will toggle the corresponding column or row. Keyboard equivalents

65 User Guide 65 are the arrow keys and the space bar. Properties Tab This read-only tab displays the properties of the selected object and the values for those properties Event Alarm Event Alarms monitor event logs for a specified event, or lack of that event, within a given time period in order to trigger one or more actions. When a new event occurs, it is checked against the Filters assigned to the Event Alarm Monitor Item. If it matches at least 1 Include Filter and no Exclude Filters, then the configured Action will be triggered. If the event does not match an Include Filter, or matches an Exclude Filter, the event will be skipped. This is true for both Service Agents and Virtual Agents. When using Event Alarms, there are two important issues: 1. On very busy systems that generate many event log records, the Event Alarm may not be able to keep up in real-time. There is a finite amount of data that can be collected and stored in a single monitor item interval. This means that there can be some lag time between when an event is logged to the event log and when it is received by the ELM Server. When collecting events, the Event Alarm bookmarks the last record read so that it knows where to start reading at its next Scheduled Interval. On very busy systems, especially domain controllers with high levels of auditing enabled, it is
66 66 ELM Help possible for the Event Alarm bookmark to roll off the event log before the records can be collected. If this happens, the bookmark is automatically reset at the most recent event. Any events that occurred between the old bookmark that rolled off the log and the new bookmark will not be collected. To prevent this from happening, we recommend setting the size of your event logs to a large enough value so that they hold at least 24 hours of event data. A large event log size should prevent the loss of a bookmark and allow the Event Alarm to monitor all events. 2. When using multiple Event Alarms or Event Collectors on the same Agent, any one of these Monitor Items can request that event logs be read. The request is initiated only if Scheduled Hours are "on" plus a Scheduled Interval has passed for the individual Monitor Item. Any request will cause the event logs to be read starting from the saved bookmarks, passing new events to all Event Alarms and Event Collectors for the Agent, and then updating the bookmarks. In the case of Event Collectors, they check only their Event Criteria before deciding to process a new event. They do not check their Scheduled Hours. In the case of Event Alarms, they check both their Event Criteria and their Scheduled Hours before deciding to process a new event. 3. If ELM is running on Windows Server 2003 or Windows XP, and it's deployed a Virtual Agent to a Windows Vista or above version of Windows, the Event Collector will not be able to be assigned to it. The ELM Console will disallow the assignment due to the lack of support in Windows Server 2003 and Windows XP for Vista and newer Event Logs. Actions Events not found (Warning) An event matching the Event Filter Criteria was not found within the Scheduled time period. Events found (Informational) An event matching the Event Filter Criteria was found within the Scheduled time period. Categories Displays the Monitoring Categories to which the Monitor is assigned. Click to select or deselect Monitoring Categories. Right click to create or edit Monitoring Categories. Test Monitor Test any Monitor Item against any Agent capable of running the Item using the drop-down and Test button on this dialog box. Testing a Monitor Item prior to putting it into production validates that the monitor item is configured properly. To test a monitor item: 1. Select the Agent you wish to test against from the drop-down list. 2. Click the Start Test button. If the test was successful, you will receive a pop-up indicating this and the option to see detailed results of the test. If the test failed, detailed results of the test will automatically open in Notepad. Schedule Displays the Scheduled Interval and Scheduled Hours settings which control the frequency for the Monitor Item.
67 User Guide 67 Scheduled Interval tab Specify the interval at which the monitoring, polling or action is to occur. Depending on the Monitor Item type, Items can be scheduled in interval increments of Seconds, Minutes, Hours and Days. The Scheduled Interval is relative to the top of the hour or top of the minute. For example, if a Scheduled Interval is configured for 10 minutes, the Monitor Item will execute at hh:10:00, hh:20:00, hh:30:00, hh:40:00, hh:50:00, h1:00:00, etc. If a Scheduled Interval is configured for 15 seconds, the Monitor Item will execute at hh:00:15, hh:00:30, hh:00:45, hh:01:00, hh:01:15, etc. Scheduled Hours tab Select the days and/or hours this item is active. By default, the schedule is set to ON for all hours and all days. Mouse clicks toggle squares between ON and OFF. Clicking on an individual square will toggle the active schedule for that hour. Clicking on an hour at the top of the grid, or on a day of the week at the left of the grid will toggle the corresponding column or row. Keyboard equivalents are the arrow keys and the space bar. Properties Tab This read-only tab displays the properties of the selected object and the values for those properties. Event Filters are common objects within ELM and can be assigned to Event Views and Event Collectors. The primary contexts are the Include and Exclude tabs for Event Views, Syslog Receivers, SNMP Receivers, Event Alarms, and Event Monitors<%Z_EVENT_MONITOR%>. The Filter criteria entered by the user controls what events are gathered and displayed.
68 68 ELM Help Name - Enter a unique name. Description - Enter a description (optional). Event Filter Criteria Event Filters provide a mechanism for isolating specific events, and multiple Event Filters can be combined to create a complex set of criteria. The same Filter can include or exclude events. They can also be created in the ELM Database Wizard to control database deleting or archiving, however these Filters will not be available in the Event Filter collections. The following fields are available for filtering purposes: Agent Category is Computer Name is Log Name is Username is Event Source is Event ID is Category is Message contains
69 User Guide 69 This dialog box has a dynamic menu behavior. The ellipsis buttons next to the Agent Category, Computer Name is, Log Name is, and Event Source is fields browse and display the agent category names, computer names, event log names and event sources. If the Computer Name is field is left empty, the list of event Logs and Sources is generated based on the event sources registered on the ELM Console computer (i.e., the local computer). If you enter a valid, resolvable name in the Computer Name is field and then click the ellipsis for the Log Name is or Event Source is fields, the list of event Logs and Sources from that system will be displayed. If the log or event source from which you want to collect data does not appear on the list, type it in the appropriate field. For example, if you are not running DNS on your ELM Server or Console, but want to collect events from the DNS log only, type DNS in the Log Name is field. If a field is blank, it will match every value in the field. For example, if the Computer Name is field is blank, the Filter will apply to all computers. If all Event Types are unchecked when the Event Filter is saved, all of the Event Types will be checked. This is by design. Leading and trailing wildcards ( * ) and character position wildcards (? ) are supported, as are the Boolean operators Or ( ), And ( & ), and Not (! ). However regular expressions are not supported. You may use these wildcards to specify the criteria to be applied. For example, to select messages from SQL Server you may specify *SQL* as the event source to select any Source name containing the letters SQL. To match SQL messages from servers ALPHA, BRAVO, or CHARLIE you would enter ALPHA BRAVO CHARLIE in the Computer Name is field. Important Leave no white space adjacent to the operators. Note If you enter the name of an untrusted system in the Computer Name is field and then use the ellipsis buttons for Log or Event Source, the menus will not be displayed. This is because authentication fails. To work around this problem, first make an IPC$ connection to the target system using alternate credentials. For example, if the untrusted system's name is dartagnan, you could use: NET USE \\SERVERA\IPC$ /user:dartagnan\administrator * You will be prompted for the password for the account you specify. The dynamic menu behavior will work after the IPC$ connection has been established. Event Views Shows the Event Views associated with this Event Filter using an Include or Exclude relationship. Select New to create or Properties to edit a highlighted Event View. Event Monitors Shows the Event Collectors associated with this Event Filter using an Include or Exclude
70 70 ELM Help relationship. Right click to create or edit an Event Collector. Properties Tab This read-only tab displays the properties of the selected object and the values for those properties.

71 User Guide Event Collector Event Collector Monitor Items collect some or all events from the Agent(s) being monitored. Events can be collected based on a combination of include and exclude Filters. Each Filter has criteria for the following event fields: Computer Name Event Log Username Event Source Event ID Event Category Event Message When a new event occurs, it is checked against the Filters assigned to the Event Collector Monitor Item. If it matches at least 1 Include Filter and no Exclude Filters, then it will be sent to the ELM Server. If the event does not match an Include Filter, or matches an Exclude Filter, the event will be skipped. This is true for both Service Agents and Virtual Agents. When using Event Collectors, there are three important issues:
72 72 ELM Help 1. On very busy systems that generate many event log records, the Event Alarm may not be able to keep up in real-time. There is a finite amount of data that can be collected and stored in a single monitor item interval. This means that there can be some lag time between when an event is logged to the event log and when it is received by the ELM Server. When collecting events, the Event Alarm bookmarks the last record read so that it knows where to start reading at its next Scheduled Interval. On very busy systems, especially domain controllers with high levels of auditing enabled, it is possible for the Event Alarm bookmark to roll off the event log before the records can be collected. If this happens, the bookmark is automatically reset at the most recent event. Any events that occurred between the old bookmark that rolled off the log and the new bookmark will not be collected. To prevent this from happening, we recommend setting the size of your event logs to a large enough value so that they hold at least 24 hours of event data. A large event log size should prevent the loss of a bookmark and allow the Event Alarm to monitor all events. 2. When using multiple Event Alarms or Event Collectors on the same Agent, any one of these Monitor Items can request that event logs be read. The request is initiated only if Scheduled Hours are "on" plus a Scheduled Interval has passed for the individual Monitor Item. Any request will cause the event logs to be read starting from the saved bookmarks, passing new events to all Event Alarms and Event Collectors for the Agent, and then updating the bookmarks. In the case of Event Collectors, they check only their Event Criteria before deciding to process a new event. They do not check their Scheduled Hours. In the case of Event Alarms, they check both their Event Criteria and their Scheduled Hours before deciding to process a new event. 3. If ELM is running on Windows Server 2003 or Windows XP, and it's deployed a Virtual Agent to a Windows Vista or above version of Windows, the Event Collector will not be able to be assigned to it. The ELM Console will disallow the assignment due to the lack of support in Windows Server 2003 and Windows XP for Vista and newer Event Logs. Reference Information Event Collectors do not trigger Actions like the other Monitor Items. For example Ping Monitors results will indicate if an ICMP echo request succeeds, Service Monitors results will indicate if a Windows service is started, etc. An Event Collector's job is to read events, expand the message, and deliver the record to the ELM Server. If it has trouble performing this task, then it or the ELM Server can create one or more of the following events: Error The bookmarked event record is no longer in the log, events are being skipped, and the bookmark reset to the beginning of the log (most recent event). Error The ELM Server had trouble receiving the event. Error The Event Collector had trouble creating or expanding the event into a record that could be delivered to the ELM Server. Error A Service Agent had trouble sending an event to the ELM Server.
73 User Guide 73 Error The ELM Server had trouble receiving an event from a Service Agent. See Also Event Filter Criteria Categories Displays the Monitoring Categories to which the Monitor is assigned. Click to select or deselect Monitoring Categories. Right click to create or edit Monitoring Categories. Test Monitor Test any Monitor Item against any Agent capable of running the Item using the drop-down and Test button on this dialog box. Testing a Monitor Item prior to putting it into production validates that the monitor item is configured properly. To test a monitor item: 1. Select the Agent you wish to test against from the drop-down list. 2. Click the Start Test button. If the test was successful, you will receive a pop-up indicating this and the option to see detailed results of the test. If the test failed, detailed results of the test will automatically open in Notepad. Schedule Displays the Scheduled Interval and Scheduled Hours settings which control the frequency for the Monitor Item. Scheduled Interval tab Specify the interval at which the monitoring, polling or action is to occur. Depending on the Monitor Item type, Items can be scheduled in interval increments of Seconds, Minutes, Hours and Days. The Scheduled Interval is relative to the top of the hour or top of the minute. For example, if a Scheduled Interval is configured for 10 minutes, the Monitor Item will execute at hh:10:00, hh:20:00, hh:30:00, hh:40:00, hh:50:00, h1:00:00, etc. If a Scheduled Interval is configured for 15 seconds, the Monitor Item will execute at hh:00:15, hh:00:30, hh:00:45, hh:01:00, hh:01:15, etc. Scheduled Hours tab Select the days and/or hours this item is active. By default, the schedule is set to ON for all hours and all days. Mouse clicks toggle squares between ON and OFF. Clicking on an individual square will toggle the active schedule for that hour. Clicking on an hour at the top of the grid, or on a day of the week at the left of the grid will toggle the corresponding column or row. Keyboard equivalents are the arrow keys and the space bar. Properties Tab This read-only tab displays the properties of the selected object and the values for those properties.
74 74 ELM Help Event Filters are common objects within ELM and can be assigned to Event Views and Event Collectors. The primary contexts are the Include and Exclude tabs for Event Views, Syslog Receivers, SNMP Receivers, Event Alarms, and Event Monitors<%Z_EVENT_MONITOR%>. The Filter criteria entered by the user controls what events are gathered and displayed. Name - Enter a unique name. Description - Enter a description (optional). Event Filter Criteria Event Filters provide a mechanism for isolating specific events, and multiple Event Filters can be combined to create a complex set of criteria. The same Filter can include or exclude events. They can also be created in the ELM Database Wizard to control database deleting or archiving, however these Filters will not be available in the Event Filter collections.
75 User Guide 75 The following fields are available for filtering purposes: Agent Category is Computer Name is Log Name is Username is Event Source is Event ID is Category is Message contains This dialog box has a dynamic menu behavior. The ellipsis buttons next to the Agent Category, Computer Name is, Log Name is, and Event Source is fields browse and display the agent category names, computer names, event log names and event sources. If the Computer Name is field is left empty, the list of event Logs and Sources is generated based on the event sources registered on the ELM Console computer (i.e., the local computer). If you enter a valid, resolvable name in the Computer Name is field and then click the ellipsis for the Log Name is or Event Source is fields, the list of event Logs and Sources from that system will be displayed. If the log or event source from which you want to collect data does not appear on the list, type it in the appropriate field. For example, if you are not running DNS on your ELM Server or Console, but want to collect events from the DNS log only, type DNS in the Log Name is field. If a field is blank, it will match every value in the field. For example, if the Computer Name is field is blank, the Filter will apply to all computers. If all Event Types are unchecked when the Event Filter is saved, all of the Event Types will be checked. This is by design. Leading and trailing wildcards ( * ) and character position wildcards (? ) are supported, as are the Boolean operators Or ( ), And ( & ), and Not (! ). However regular expressions are not supported. You may use these wildcards to specify the criteria to be applied. For example, to select messages from SQL Server you may specify *SQL* as the event source to select any Source name containing the letters SQL. To match SQL messages from servers ALPHA, BRAVO, or CHARLIE you would enter ALPHA BRAVO CHARLIE in the Computer Name is field.
76 76 ELM Help Important Leave no white space adjacent to the operators. Note If you enter the name of an untrusted system in the Computer Name is field and then use the ellipsis buttons for Log or Event Source, the menus will not be displayed. This is because authentication fails. To work around this problem, first make an IPC$ connection to the target system using alternate credentials. For example, if the untrusted system's name is dartagnan, you could use: NET USE \\SERVERA\IPC$ /user:dartagnan\administrator * You will be prompted for the password for the account you specify. The dynamic menu behavior will work after the IPC$ connection has been established. Event Views Shows the Event Views associated with this Event Filter using an Include or Exclude relationship. Select New to create or Properties to edit a highlighted Event View. Event Monitors Shows the Event Collectors associated with this Event Filter using an Include or Exclude relationship. Right click to create or edit an Event Collector. Properties Tab This read-only tab displays the properties of the selected object and the values for those properties.
77 User Guide Event File Collector Event File Collector Monitor Items collect Event Log Files (.EVT and.evtx) from the Agents being monitored. The Event File Collector operates at a scheduled interval (the default is every 24 hours). At each interval, the Event File Collector will attempt to talk with the Log service, select the appropriate log files and then copy the specified Event Log Files from the assigned Agents to a defined storage location. The files will be stored by default under the ELM Enterprise Manager installation folder in a sub-directory named EVT Files. This location can be modified on the Behavior tab of the Event File Collector properties. Log Selection Displays the Available Logs and Selected Logs the Collector is configured to copy and store. By default, the list of Selected Logs contains an asterisk, so the Monitor will collect all log files possible. Specific logs can replace the asterisk to collect a subset of log files. Use the Add and Remove buttons to move selected logs between the Available Logs and Selected Logs lists. To list logs from another system, click the Choose log source button and enter or select a computer name. If you know the name of a log, you can enter it in the Enter a log name field, and click the Add button. All events may be cleared from the selected logs after collection by checking the box labeled Clear Logs after collection. Note When clearing the event logs, if an Agent is also running any Event Collectors or Event Alarms, then the Event File Collector passes any unread events to them for processing. This may result in events being collected outside of the configured Event Collector or Event Alarm Scheduled Interval. On Windows 2008, Windows 7, and Vista systems, only logs under the registry key HKLM\SYSTEM\CurrentControlSet\Services\Eventlog can be collected. Windows 2008, Windows 7, and Vista event logs can be collected, but if they are stored on an older Windows system, they cannot be read by the older Windows Event Viewer. Behavior This tab configures where an how to store collected log files. The Destination Folder controls where to save collected Log files. This can be any existing folder local to the ELM Server. The setting Minimum Free Space Allowed For Evt File Storage protects free space on the drive hosting the Destination Folder. If the free space on the drive drops below this value, then
78 78 ELM Help the ELM Server will stop saving.evt files it receives from an Agent. When this happens, ELM will generate the error event 5595, with a message indicating it's unable to store the event file. Log Files may be compressed for storage by checking the Compress Evt Files checkbox. A cryptographic hash may be created for collected log files to help verify the log file remains unchanged. Note that both the collected log file and the hash file should be secured from tampering. Check the box labeled Create MD5 Hash File. ELM includes a tool to help verify hashed files. Right-click on the ELM Server and select Tools Verify Evt Files to launch the tool. Enter a file name in the Evt or Gz File field to select a collected event log. You can also click the ellipsis button to browse to a file. Enter an md5 file name in the.md5 File field to select a companion hash file. You can also click the ellipsis button to browse to the file. Click the Verify button to test the file. The hash value for a collected file can also be calculated with the Microsoft File Checksum Integrity Verifier tool. Please see Microsoft Knowledge Base article for more details. Actions Copy File Success (Informational) The selected Event Log file has been successfully copied. Copy File Error (Error) The selected Event Log file has NOT been successfully copied. Store File Success (Informational) The selected Event Log file has been successfully stored. Store File Error (Error) The selected Event Log file has NOT been successfully stored. Additionally, the Event File Collector may create one or more of the following events: Agent Save File Error (Error) The ELM Agent's install directory does not have enough free space. No event log files will be collected until this much space is available. Store File Warning (Warning) A cryptographic hash of the selected Event Log file has NOT been successfully created. Store File Error (Error) The selected Event Log file has NOT been successfully stored because of low disk space. Categories Displays the Monitoring Categories to which the Monitor is assigned. Click to select or deselect Monitoring Categories. Right click to create or edit Monitoring Categories. Test Monitor Test any Monitor Item against any Agent capable of running the Item using the drop-down and
79 User Guide 79 Test button on this dialog box. Testing a Monitor Item prior to putting it into production validates that the monitor item is configured properly. To test a monitor item: 1. Select the Agent you wish to test against from the drop-down list. 2. Click the Start Test button. If the test was successful, you will receive a pop-up indicating this and the option to see detailed results of the test. If the test failed, detailed results of the test will automatically open in Notepad. Schedule Displays the Scheduled Interval and Scheduled Hours settings which control the frequency for the Monitor Item. Scheduled Interval tab Specify the interval at which the monitoring, polling or action is to occur. Depending on the Monitor Item type, Items can be scheduled in interval increments of Seconds, Minutes, Hours and Days. The Scheduled Interval is relative to the top of the hour or top of the minute. For example, if a Scheduled Interval is configured for 10 minutes, the Monitor Item will execute at hh:10:00, hh:20:00, hh:30:00, hh:40:00, hh:50:00, h1:00:00, etc. If a Scheduled Interval is configured for 15 seconds, the Monitor Item will execute at hh:00:15, hh:00:30, hh:00:45, hh:01:00, hh:01:15, etc. Scheduled Hours tab Select the days and/or hours this item is active. By default, the schedule is set to ON for all hours and all days. Mouse clicks toggle squares between ON and OFF. Clicking on an individual square will toggle the active schedule for that hour. Clicking on an hour at the top of the grid, or on a day of the week at the left of the grid will toggle the corresponding column or row. Keyboard equivalents are the arrow keys and the space bar. Properties Tab This read-only tab displays the properties of the selected object and the values for those properties File Monitor File Monitor monitors a log file, ASCII file, or text file (or a directory of ASCII or text files). File Monitors parse non-circular text files for words or strings, and notify when the search criteria is found.
80 80 ELM Help Note Only Service Agents can run a File Monitor, and only local file paths are supported. Virtual Agents, UNC paths and mapped drives are unsupported. Unicode big endian format is not supported. An explanation of endian architecture can be found here. If a new copy of a monitored file is created, the File Monitor will detect this and read it as a new file even though the file name has not changed. Windows file system tunneling can mask this change. See Microsoft Knowledge Base Article for more details. When it gets to the end of the file, the File Monitor sets a bookmark. At the next Scheduled Interval it will begin reading new lines in the file after the bookmark. Since the File Monitor reads in a line-by-line fashion, a line that has additional text added to it after being bookmarked will have these characters skipped, and monitoring will begin on the line after the bookmark. By default, when the File Monitor is first created, it skips to the end of each file it monitors and sets a bookmark. It then starts watching for character string matches in new lines added to the file(s). To force File Monitor to search each file for matches from the beginning, add a checkmark next to Do Actions on First Run. Paths Each File Monitor supports one or more search paths. A search path can be a single file or, by using wildcards, a group of files. For example, to search all Internet Information Server logs, use a search path of C:\WINDOWS\SYSTEM32\LOGFILES\*.LOG, and check the Search Subfolders checkbox. This will cause all log files (HTTP, SMTP, NNTP, and FTP) in all of the sub-directories to be searched for the strings specified. Important The File Monitor path must include a filename, or a wildcard pattern. For example: C:\Windows\windowsupdate.log C:\Windows\kb*.log A path without a file name or pattern will cause the File Monitor to not do anything. Add File Path Each File Monitor supports one or more search paths. To add another file path, click the Add button.
81 User Guide 81 Note For 64-bit systems: The file monitor will not monitor files in C:\Windows \System32. On a 64-bit system, any 32-bit program (which TNTAgent is) will automatically be redirected to C:\Windows \SysWOW64 when attempting to access the System32 directory. The file monitor will monitor files in subdirectories of System32 so, a file in C:\Windows\System32\etc would be monitored. Matches Enter one or more character strings for the File Monitor search. Use the Add button to add a match, and use the Delete button to remove the selected match. Double-click any listed match string to edit it. Note There is an implied OR-operator between each line of the character strings. For example, given the following list of matches: *error* *root* *paycheck* A line added to a monitored file and containing the string root will be found by the File Monitor. Add Match Enter the word or string you want to search for. You can click the Insert Variable button to insert a variable in the search string. You can use the asterisk (*) as a wildcard character, a pipe ( ) as an OR operator, and an ampersand (&) as an AND operator. For example, to search a flat file for the word error OR the word failed, use the following syntax: *error* *failed*. Be sure to surround the character string with asterisks. Click OK to save the match criteria.
82 82 ELM Help Note It is not possible to search for strings across multiple lines because the File Monitor reads in a line-by-line fashion. For example, searching for *failed logon* will work if the text is all on one line but if the failed text is on one line, then there is a carriage return in the file with the text logon in the next line, then the File Monitor won't detect it. Each string match added to the Matches tab will add a corresponding sub-tab to the Actions tab. So File Monitor Actions can be customized for each string found. Actions Custom Action (Warning) A custom action is added to the Actions list for each search string entered in the Match list (see Add Match above). Categories Displays the Monitoring Categories to which the Monitor is assigned. Click to select or deselect Monitoring Categories. Right click to create or edit Monitoring Categories. Test Monitor Test any Monitor Item against any Agent capable of running the Item using the drop-down and Test button on this dialog box. Testing a Monitor Item prior to putting it into production validates that the monitor item is configured properly. To test a monitor item: 1. Select the Agent you wish to test against from the drop-down list. 2. Click the Start Test button. If the test was successful, you will receive a pop-up indicating this and the option to see detailed results of the test. If the test failed, detailed results of the test will automatically open in Notepad. Schedule Displays the Scheduled Interval and Scheduled Hours settings which control the frequency for the Monitor Item. Scheduled Interval tab Specify the interval at which the monitoring, polling or action is to occur. Depending on the Monitor Item type, Items can be scheduled in interval increments of Seconds, Minutes, Hours and Days. The Scheduled Interval is relative to the top of the hour or top of the minute. For example, if a Scheduled Interval is configured for 10 minutes, the Monitor Item will execute at hh:10:00, hh:20:00, hh:30:00, hh:40:00, hh:50:00, h1:00:00, etc. If a Scheduled Interval is configured for 15 seconds, the Monitor Item will execute at hh:00:15, hh:00:30, hh:00:45, hh:01:00, hh:01:15, etc. Scheduled Hours tab
83 User Guide 83 Select the days and/or hours this item is active. By default, the schedule is set to ON for all hours and all days. Mouse clicks toggle squares between ON and OFF. Clicking on an individual square will toggle the active schedule for that hour. Clicking on an hour at the top of the grid, or on a day of the week at the left of the grid will toggle the corresponding column or row. Keyboard equivalents are the arrow keys and the space bar. Properties Tab This read-only tab displays the properties of the selected object and the values for those properties FTP Monitor An FTP Monitor item monitors the status and availability of an FTP site. Any valid and accessible FTP server can be monitored by the ELM Enterprise Manager Server. An application-layer FTP connection to the FTP Server is made at your specified interval. Anonymous or authenticated connections are supported. By default, port 21 is used, but the Monitor can be configured to use any port. Because the ELM Enterprise Manager Server (and not an Agent) makes the FTP connection, you can monitor FTP server availability on any operating system running FTP server software (e.g., Unix, Linux, Novell, Solaris, etc.) Though an agent must be assigned to the FTP server. FTP Monitor Settings Username - Can be a specific username or can be set to anonymous. Password - Password for the account specified in the Username field. If you entered anonymous for the username, enter any SMTP address as the password. FTP Port - The port to which you want the FTP Monitor to connect. By default, TCP port 21 is used. However, you can specify any valid TCP port that is used by the FTP server. Warn if QoS slower than seconds - You may also monitor the FTP server's performance by monitoring how quickly a response is returned. By specifying a value for this field, you can cause a warning message to be generated whenever the response from the FTP server exceeds the threshold you specify here. Execute configured Action(s) for every failure - By default, ELM will notify you once when the FTP server is unavailable. By checking this box, you can specify that failure Actions be executed at each failure.
84 84 ELM Help Note The FTP Monitor doesn't have a FTP site setting, assign the FTP Monitor to the agent that is hosting the FTP Site. Actions Failed (Error) The FTP Monitor was unable to connect to the configured FTP site. Success (Informational) The FTP Monitor was able to connect to the configured FTP site. Quality of Service (Success) The FTP Monitor was able to connect to the configured FTP site, but not within the configured QoS time period. Categories Displays the Monitoring Categories to which the Monitor is assigned. Click to select or deselect Monitoring Categories. Right click to create or edit Monitoring Categories. Test Monitor Test any Monitor Item against any Agent capable of running the Item using the drop-down and Test button on this dialog box. Testing a Monitor Item prior to putting it into production validates that the monitor item is configured properly. To test a monitor item: 1. Select the Agent you wish to test against from the drop-down list. 2. Click the Start Test button. If the test was successful, you will receive a pop-up indicating this and the option to see detailed results of the test. If the test failed, detailed results of the test will automatically open in Notepad. Schedule Displays the Scheduled Interval and Scheduled Hours settings which control the frequency for the Monitor Item. Scheduled Interval tab Specify the interval at which the monitoring, polling or action is to occur. Depending on the Monitor Item type, Items can be scheduled in interval increments of Seconds, Minutes, Hours and Days. The Scheduled Interval is relative to the top of the hour or top of the minute. For example, if a Scheduled Interval is configured for 10 minutes, the Monitor Item will execute at hh:10:00, hh:20:00, hh:30:00, hh:40:00, hh:50:00, h1:00:00, etc. If a Scheduled Interval is configured for 15 seconds, the Monitor Item will execute at hh:00:15, hh:00:30, hh:00:45, hh:01:00, hh:01:15, etc. Scheduled Hours tab Select the days and/or hours this item is active. By default, the schedule is set to ON for all hours and all days. Mouse clicks toggle squares between ON and OFF. Clicking on an individual square will toggle the active schedule for that hour. Clicking on an hour at the top of the grid, or on a day of the week at the left of the grid will toggle the corresponding column or row. Keyboard equivalents are the arrow keys and the space bar.
85 User Guide 85 Properties Tab This read-only tab displays the properties of the selected object and the values for those properties IIS Monitor The IIS Monitor monitors only Internet Information Services 5.0 (Windows 2000), 5.1 (Windows XP) and 6.0 (Windows 2003). The IIS Monitor periodically checks for state changes and broken paths. In addition, it executes a File Monitor (no separate File Monitor configuration necessary) to parse the IIS log files for failed requests, and connection attempts from blocked addresses (e.g., addresses blocked via IIS security). Important The IIS Monitor can be used with Service Agents only. It cannot be used with Virtual Agents or IP Virtual Agents. A broken path occurs when IIS and the file system are out of sync. When this happens, and depending on where the broken path exists, Windows Internet Services Manager may display a red "stop sign" icon next to the virtual directory with the broken path. Failed requests are any HTTP response code that represents a failure. This includes all HTTP 500 and 400 level response codes, as well as all HTTP 300 responses except for HTTP 304. Any HTTP 200 response is considered a success. Note If the IIS Monitor tries to access a blocked address, it will generate 2 warnings: one for a blocked address attempt, and one for a failed URL request. By default, the IIS Monitor monitors all virtual servers. This is done through the use of an asterisk (*) wildcard. You can monitor specific virtual servers by removing the asterisk entry and replacing it with the name of the virtual servers you want to monitor. To remove the asterisk entry, click it once to select it, and then click the Delete button. To add virtual servers, enter the name of the server in the Add Virtual Servers to Monitor field and click the Add button. If the IIS Monitor should repeat failure messages during an outage, check the box that says Execute configured Action(s) for every failure. The IIS Monitor starts looking for issues (broken paths, etc.) that occur after the first Scheduled Interval. If you need the IIS Monitor to search IIS history for all issues, then add a check mark for Do Actions on First Run when first configuring it.
86 86 ELM Help Actions Enabled State Change (Warning) A web site state changed. For example if the Default Web Site is paused. Broken Path (Error) IIS is configured for a non-existent directory path. Failed Request (Warning) A client tried to access an invalid URL. Blocked Address Attempt (Warning) A client tried to access a restricted or blocked URL. Categories Displays the Monitoring Categories to which the Monitor is assigned. Click to select or deselect Monitoring Categories. Right click to create or edit Monitoring Categories. Test Monitor Test any Monitor Item against any Agent capable of running the Item using the drop-down and Test button on this dialog box. Testing a Monitor Item prior to putting it into production validates that the monitor item is configured properly. To test a monitor item: 1. Select the Agent you wish to test against from the drop-down list. 2. Click the Start Test button. If the test was successful, you will receive a pop-up indicating this and the option to see detailed results of the test. If the test failed, detailed results of the test will automatically open in Notepad. Schedule Displays the Scheduled Interval and Scheduled Hours settings which control the frequency for the Monitor Item. Scheduled Interval tab Specify the interval at which the monitoring, polling or action is to occur. Depending on the Monitor Item type, Items can be scheduled in interval increments of Seconds, Minutes, Hours and Days. The Scheduled Interval is relative to the top of the hour or top of the minute. For example, if a Scheduled Interval is configured for 10 minutes, the Monitor Item will execute at hh:10:00, hh:20:00, hh:30:00, hh:40:00, hh:50:00, h1:00:00, etc. If a Scheduled Interval is configured for 15 seconds, the Monitor Item will execute at hh:00:15, hh:00:30, hh:00:45, hh:01:00, hh:01:15, etc. Scheduled Hours tab Select the days and/or hours this item is active. By default, the schedule is set to ON for all hours and all days. Mouse clicks toggle squares between ON and OFF. Clicking on an individual square will toggle the active schedule for that hour. Clicking on an hour at the top of the grid, or on a day of the week at the left of the grid will toggle the corresponding column or row. Keyboard equivalents are the arrow keys and the space bar. Properties Tab This read-only tab displays the properties of the selected object and the values for those
87 User Guide 87 properties Inventory Collector The Inventory Collector gathers data about what is installed on each Windows-based Agent. You can collect information about the Windows operating systems and applications that have been installed and appear in the Add or Remove Programs or Programs and Features applet in the Windows Control Panel. Note: Applications installed on a per-user basis will not be collected by the Inventory Collector. The Inventory Collector can also trigger Monitor Item Actions when an item is added to or removed from the inventory. Inventory Services This is the list of services to be added to the Inventory for the Agents running an Inventory Collector. See the Add Service to Inventory section below for details. Click the Add button to add a Windows service. To remove a service, select it from the list and click the Delete button. You may include the operating system information in the inventory by checking the Include operating system in inventory checkbox. Add Service to Inventory Use this dialog to add the name of specific services you want to inventory. You must enter the full short name of the service (e.g., w3svc for the World Wide Web Publishing service). The dialog is not case sensitive. The short name for a service is listed in the properties of a Service in the Windows Services MMC snap-in (services.msc). Excluded Products By default, all products will be included in the inventory. If products should be omitted from the inventory, enter their name here. Click the Add button to add a product name. To remove an excluded product, select it from the list and click Delete. Wild cards are supported; asterisk (*) will match zero or more characters, and question mark (?) will match any one character. Actions Outage Started (Warning) An application outage has started. Outage Ended (Informational) An application outage has ended. Items Added (Warning) An item was added to the inventory. For example, an application was installed. Items Removed (Warning) An item was removed from the inventory. For example,
88 88 ELM Help an application was uninstalled. Categories Displays the Monitoring Categories to which the Monitor is assigned. Click to select or deselect Monitoring Categories. Right click to create or edit Monitoring Categories. Test Monitor Test any Monitor Item against any Agent capable of running the Item using the drop-down and Test button on this dialog box. Testing a Monitor Item prior to putting it into production validates that the monitor item is configured properly. To test a monitor item: 1. Select the Agent you wish to test against from the drop-down list. 2. Click the Start Test button. If the test was successful, you will receive a pop-up indicating this and the option to see detailed results of the test. If the test failed, detailed results of the test will automatically open in Notepad. Schedule Displays the Scheduled Interval and Scheduled Hours settings which control the frequency for the Monitor Item. Scheduled Interval tab Specify the interval at which the monitoring, polling or action is to occur. Depending on the Monitor Item type, Items can be scheduled in interval increments of Seconds, Minutes, Hours and Days. The Scheduled Interval is relative to the top of the hour or top of the minute. For example, if a Scheduled Interval is configured for 10 minutes, the Monitor Item will execute at hh:10:00, hh:20:00, hh:30:00, hh:40:00, hh:50:00, h1:00:00, etc. If a Scheduled Interval is configured for 15 seconds, the Monitor Item will execute at hh:00:15, hh:00:30, hh:00:45, hh:01:00, hh:01:15, etc. Scheduled Hours tab Select the days and/or hours this item is active. By default, the schedule is set to ON for all hours and all days. Mouse clicks toggle squares between ON and OFF. Clicking on an individual square will toggle the active schedule for that hour. Clicking on an hour at the top of the grid, or on a day of the week at the left of the grid will toggle the corresponding column or row. Keyboard equivalents are the arrow keys and the space bar. Properties Tab This read-only tab displays the properties of the selected object and the values for those properties Link Monitor The Link Monitor periodically spiders/crawls your Web site starting at the URL you specify. It can check for broken links and Quality of Service.
89 User Guide 89 Note The Link Monitor can be assigned only to Service Agents. Important Windows 2003 with SP1 provides enhanced security which can cause false warnings by the Link Monitor, even when integrated authentication is configured. To avoid this, provide a username and password in the properties of the Link Monitor. Link Monitor Starting URL Profile Customize the behavior of the Link Monitor: URL - Enter the URL you wish to use as a starting point for the Link Monitor. Username - If a username is required to access the above URL, enter it in this field. Password - If you entered a username in the Username field, enter the password for that username in this field. Max Pages - Limit the number of pages visited by the Link Monitor by entering the maximum number of pages visited in this field. This value must be a positive integer. Max Levels - Limit the number of levels traversed by entering a maximum number of levels in this field. This value must be a positive integer. Warn if average QoS response time is more than - Verify Quality of Service of the checked links by configuring the Link Monitor to warn you if any page is not retrieved within this QoS threshold. Proxy Server - If the Agent needs to go through a proxy server in order to access the page (s) to be checked, enter the name (e.g., host name or Fully Qualified Domain Name) of the Proxy Server. Port - If you are using a Proxy Server, use this field to specify the port on which the Proxy Server listens for requests. Exclude URLs To exclude a URL from Link Monitor activity, enter it in the Enter URL to be excluded field, and click Add. To remove an excluded URL, select it in the These URLs will not be visited during the spidering operation field and click Remove. Note You may use the asterisk as a wildcard to perform pattern matching in your exclusion list. For example, if you wanted to exclude everything under enter the following: Actions Success (Informational) All the links were found and responded within the quality of service time period. Quality of Service Warning (Warning) The web page was not retrieved within the quality of service time period.
90 90 ELM Help Broken Link (Error) A broken link was found. Categories Displays the Monitoring Categories to which the Monitor is assigned. Click to select or deselect Monitoring Categories. Right click to create or edit Monitoring Categories. Test Monitor Test any Monitor Item against any Agent capable of running the Item using the drop-down and Test button on this dialog box. Testing a Monitor Item prior to putting it into production validates that the monitor item is configured properly. To test a monitor item: 1. Select the Agent you wish to test against from the drop-down list. 2. Click the Start Test button. If the test was successful, you will receive a pop-up indicating this and the option to see detailed results of the test. If the test failed, detailed results of the test will automatically open in Notepad. Schedule Displays the Scheduled Interval and Scheduled Hours settings which control the frequency for the Monitor Item. Scheduled Interval tab Specify the interval at which the monitoring, polling or action is to occur. Depending on the Monitor Item type, Items can be scheduled in interval increments of Seconds, Minutes, Hours and Days. The Scheduled Interval is relative to the top of the hour or top of the minute. For example, if a Scheduled Interval is configured for 10 minutes, the Monitor Item will execute at hh:10:00, hh:20:00, hh:30:00, hh:40:00, hh:50:00, h1:00:00, etc. If a Scheduled Interval is configured for 15 seconds, the Monitor Item will execute at hh:00:15, hh:00:30, hh:00:45, hh:01:00, hh:01:15, etc. Scheduled Hours tab Select the days and/or hours this item is active. By default, the schedule is set to ON for all hours and all days. Mouse clicks toggle squares between ON and OFF. Clicking on an individual square will toggle the active schedule for that hour. Clicking on an hour at the top of the grid, or on a day of the week at the left of the grid will toggle the corresponding column or row. Keyboard equivalents are the arrow keys and the space bar. Properties Tab This read-only tab displays the properties of the selected object and the values for those properties.
91 User Guide Performance Alarm A Performance Alarm is triggered when a selected performance counter, or instance of a counter, is less than, greater than, or equal to a specific value. Performance Alarms specify what action is to be taken when a performance counter or instance meets the specified criteria. Counter Object - Use the dropdown to select the performance object to be monitored. Counter - Use the dropdown to select the performance counter to be monitored. Monitored Instances - Click the Add/Remove button to change the Instances of the counter to be monitored. Enter the instance(s) of the counter to be monitored. All instances listed in this field are monitored by this Alarm. Use an asterisk (*) or leave the instance field blank to monitor all detected instances of the counter. If no instances are entered, all instances are evaluated. Condition - Select the condition to be matched: < Less Than < = Less Than or Equal To = Equal To > = Greater Than or Equal To > Greater Than < > Does Not Equal Value - The threshold value with which the performance counter is compared. Enter only numbers and a decimal point in this field. Performance counters that use percentages (e.g., % Processor Time, % Free Disk Space, etc.), will be automatically translated. For example, in the Value field is translated to 50%. Occurs Consecutive Times - Enter the number of times Value must meet the specified Condition before triggering any enabled Actions. Note The Consecutive Times count is based on consecutive results after the initial Performance Alarm threshold has been met. For example, if the Scheduled Interval is 5 minutes and the Consecutive Times is 1, then it will be at least 10 minutes before the first Actions are triggered. After this, if results continue to be true, then Actions will be triggered every 5 minutes. Actions Warning The monitored Performance Counter condition is true.
92 92 ELM Help Categories Displays the Monitoring Categories to which the Monitor is assigned. Click to select or deselect Monitoring Categories. Right click to create or edit Monitoring Categories. Test Monitor Test any Monitor Item against any Agent capable of running the Item using the drop-down and Test button on this dialog box. Testing a Monitor Item prior to putting it into production validates that the monitor item is configured properly. To test a monitor item: 1. Select the Agent you wish to test against from the drop-down list. 2. Click the Start Test button. If the test was successful, you will receive a pop-up indicating this and the option to see detailed results of the test. If the test failed, detailed results of the test will automatically open in Notepad. Schedule Displays the Scheduled Interval and Scheduled Hours settings which control the frequency for the Monitor Item. Scheduled Interval tab Specify the interval at which the monitoring, polling or action is to occur. Depending on the Monitor Item type, Items can be scheduled in interval increments of Seconds, Minutes, Hours and Days. The Scheduled Interval is relative to the top of the hour or top of the minute. For example, if a Scheduled Interval is configured for 10 minutes, the Monitor Item will execute at hh:10:00, hh:20:00, hh:30:00, hh:40:00, hh:50:00, h1:00:00, etc. If a Scheduled Interval is configured for 15 seconds, the Monitor Item will execute at hh:00:15, hh:00:30, hh:00:45, hh:01:00, hh:01:15, etc. Scheduled Hours tab Select the days and/or hours this item is active. By default, the schedule is set to ON for all hours and all days. Mouse clicks toggle squares between ON and OFF. Clicking on an individual square will toggle the active schedule for that hour. Clicking on an hour at the top of the grid, or on a day of the week at the left of the grid will toggle the corresponding column or row. Keyboard equivalents are the arrow keys and the space bar. Properties Tab This read-only tab displays the properties of the selected object and the values for those properties Performance Collector Performance Collectors are sets of one or more performance objects, counters and/or instances
93 User Guide 93 that are grouped together for collection and aggregation. ELM Enterprise Manager is pre-populated with a variety of Performance Collectors. These can be edited or custom Performance Collectors can be created. Each Performance Collector has three parts: the counters to be collected; the frequency of the collection (e.g., every 30 minutes, every hour, etc.); and the days on which collection occurs. Performance Counters ELM is pre-populated with Performance Objects and Counters. If the required object, counter or instance is not listed, it can be added from a Windows computer that publishes the counter. Summary Performance data is summarized or aggregated by one of several statistical methods. Calculating an average is ELM's default method. Data aggregation is provided to help minimize database storage space requirements for collected performance data. Aggregated tables contain detailed data for the most recent collection period and summary data for previous collection periods. Data can be aggregated once a Week, once a Month, once a Quarter, or disabled (None). Use the When field to select the day of the week on which aggregation will take place. Use the At field to specify the time. Note Data aggregation maintains detail data for one aggregation period, calculated values for older data. This method provides detailed data for short-term reports, for example weekly reports. Summarized data is available for longer-term reports, for example quarterly reports. Aggregation is not required by ELM. It can be disabled, or detailed data can be moved to the ELM Archive database. Actions Performance Collectors gather data, deliver it to the ELM Server, and if aggregation is enabled, minimize storage requirements. These events indicate the success of performing these tasks. Error The ELM Server had trouble receiving the performance data. Error The ELM Server had trouble aggregating the performance data. Informational The ELM Server successfully aggregated the performance data. Categories Displays the Monitoring Categories to which the Monitor is assigned. Click to select or deselect Monitoring Categories. Right click to create or edit Monitoring Categories. Test Monitor Test any Monitor Item against any Agent capable of running the Item using the drop-down and Test button on this dialog box. Testing a Monitor Item prior to putting it into production validates that the monitor item is configured properly. To test a monitor item: 1. Select the Agent you wish to test against from the drop-down list.
94 94 ELM Help 2. Click the Start Test button. If the test was successful, you will receive a pop-up indicating this and the option to see detailed results of the test. If the test failed, detailed results of the test will automatically open in Notepad. Schedule Displays the Scheduled Interval and Scheduled Hours settings which control the frequency for the Monitor Item. Scheduled Interval tab Specify the interval at which the monitoring, polling or action is to occur. Depending on the Monitor Item type, Items can be scheduled in interval increments of Seconds, Minutes, Hours and Days. The Scheduled Interval is relative to the top of the hour or top of the minute. For example, if a Scheduled Interval is configured for 10 minutes, the Monitor Item will execute at hh:10:00, hh:20:00, hh:30:00, hh:40:00, hh:50:00, h1:00:00, etc. If a Scheduled Interval is configured for 15 seconds, the Monitor Item will execute at hh:00:15, hh:00:30, hh:00:45, hh:01:00, hh:01:15, etc. Scheduled Hours tab Select the days and/or hours this item is active. By default, the schedule is set to ON for all hours and all days. Mouse clicks toggle squares between ON and OFF. Clicking on an individual square will toggle the active schedule for that hour. Clicking on an hour at the top of the grid, or on a day of the week at the left of the grid will toggle the corresponding column or row. Keyboard equivalents are the arrow keys and the space bar. Properties Tab This read-only tab displays the properties of the selected object and the values for those properties Ping Monitor The Ping Monitor sends version 4 ICMP echo requests to the Agents being monitored. You may specify the size of the echo request packets and the number of packets that are sent. The Ping Monitor will execute the configured Actions, depending on the results of the Ping. When enabled, the Success Action will be executed if all echo requests succeed. When enabled, the Warning Action will be executed if at least one echo request fails and at least one succeeds. When enabled, the Failed Action will be executed if all echo requests fail. Even though the Ping Monitor is assigned to Agents, it is always executed by the ELM Server. Ping Monitor Settings Packet Size (bytes) - Enter the size of the ICMP echo request (e.g., the size of each ping
95 User Guide 95 packet), in bytes, to send at each ping interval. Repeat (packets) - Enter the number of packets to send at each interval. Timeout (seconds) - Enter the time, in seconds, to wait for a response. Place a checkmark in the Execute configured Action(s) for every failure checkbox to specify that the Action be executed each time the Ping Monitor returns a failure code (e.g., Ping failed). If the checkbox is left empty, the enabled Actions will be executed only on state changes (e.g. from Success to Failure or from Warning to Failure). Note By default, the Ping Monitor will execute the enabled Actions only for state changes, and not for subsequent intervals where the state has not changed. For example, the first time the Ping Monitor receives a success result, it will execute the enabled Success Action(s). If the ping is successful at the next interval, the Success Action(s) will not be executed because the state has not changed. If you want the Ping Monitor to execute its configured Action(s), you can do so by manually adding the HKLM\SOFTWARE\TNT Software\ELM Enterprise Manager\6.7\Settings \PingMonitorTakeActionAtEachInterval registry entry to the ELM Server computer, setting the REG_DWORD value to 1, and restart the ELM Enterprise Manager Server service. Actions Failed (Error) All ICMP echo requests did not receive a reply. Success (Informational) All ICMP echo requests received a reply. Quality of Service (Warning) Some ICMP echo requests received a reply and some did not. Categories Displays the Monitoring Categories to which the Monitor is assigned. Click to select or deselect Monitoring Categories. Right click to create or edit Monitoring Categories. Test Monitor Test any Monitor Item against any Agent capable of running the Item using the drop-down and Test button on this dialog box. Testing a Monitor Item prior to putting it into production validates that the monitor item is configured properly. To test a monitor item: 1. Select the Agent you wish to test against from the drop-down list. 2. Click the Start Test button. If the test was successful, you will receive a pop-up indicating this and the option to see detailed results of the test. If the test failed, detailed results of the test will automatically open in Notepad. Schedule
96 96 ELM Help Displays the Scheduled Interval and Scheduled Hours settings which control the frequency for the Monitor Item. Scheduled Interval tab Specify the interval at which the monitoring, polling or action is to occur. Depending on the Monitor Item type, Items can be scheduled in interval increments of Seconds, Minutes, Hours and Days. The Scheduled Interval is relative to the top of the hour or top of the minute. For example, if a Scheduled Interval is configured for 10 minutes, the Monitor Item will execute at hh:10:00, hh:20:00, hh:30:00, hh:40:00, hh:50:00, h1:00:00, etc. If a Scheduled Interval is configured for 15 seconds, the Monitor Item will execute at hh:00:15, hh:00:30, hh:00:45, hh:01:00, hh:01:15, etc. Scheduled Hours tab Select the days and/or hours this item is active. By default, the schedule is set to ON for all hours and all days. Mouse clicks toggle squares between ON and OFF. Clicking on an individual square will toggle the active schedule for that hour. Clicking on an hour at the top of the grid, or on a day of the week at the left of the grid will toggle the corresponding column or row. Keyboard equivalents are the arrow keys and the space bar. Properties Tab This read-only tab displays the properties of the selected object and the values for those properties Process Monitor The Process Monitor monitors Windows processes when assigned to an Agent. The Process Monitor is multi-functional; it can notify you when a process has exceeded the threshold of CPU usage you specify and it can track when processes are started or terminated. In addition, it can generate a Warning or Error when the number of instances of a process exceeds your specified value. Each Process Monitor item supports multiple match criteria. Use the Add button to add a match criterion. Use the Delete button to remove a listed match criterion. Double-click any listed item to edit it. Process Monitor Click the Add button to enter the name of the process or processes you want to monitor.
97 User Guide 97 Note The name of the process to monitor is derived from the Processes object in Windows. This name does not always match what you see in Task Manager. You should verify the name of the process you wish to monitor by using a utility such as Performance Monitor. You may use the asterisk (*) as a wildcard character, a pipe ( ) as an OR operator, the ampersand (&) as an AND operator, and the exclamation point (!) as a NOT operator. Process names can be entered on separate lines for exclusion. For example, to exclude the _Total and Idle processes, you can enter them like this:!_total!idle Click OK to save your changes. Select a line in the Processes to Monitor window and click the Delete button to remove the line from the list. Note The Default pre configured Process Monitor is setup to watch all processes with the exception of _Total and Idle. Thresholds Enter threshold triggers for the Process Monitor. CPU Usage Warning when % Processor Time is greater than - Executes the enabled CPU Warning Actions when the CPU utilization of a monitored process exceeds the value. Error when % Processor Time is greater than - Executes the enabled CPU Error Actions when the CPU utilization of a monitored process exceeds the value. Note The ELM Process Monitor recognizes multi-processor systems and calculates an overall system utilization. For example, given a quadprocessor system and the processor utilizations shown, system utilization would be about one-third: Processor Processor Processor Processor Total Possible System = 25% utilization = 50% utilization = 25% utilization = 50% utilization = 150% = 400% = 150/400 = 37.5% utilization Number of Processes With the Same Name
98 98 ELM Help Warning when the number is greater than - Executes the enabled Process Count Warning Actions when the number of processes with the same name exceeds the value. Error when the number is greater than - Executes the enabled Process Count Error Actions when the number of processes with the same name exceeds the value. Process Starts or Stops Process Monitors can notify you when a process is started or terminated. These settings can be found on the New Process and Process Ended tabs of the Process Monitor's Actions dialog. Actions CPU Error (Error) A monitored process is using more CPU than the Error when % Processor Time is Greater Than value specified under Thresholds (see above). CPU Warning (Warning) A monitored process is using more CPU than the Warning when % Processor Time is Greater Than value specified under Thresholds (see above). New Process (Informational) A new process was found in the list of monitored processes. Process Ended (Warning) A process disappeared from the list of monitored processes. Process Count Warning (Warning) The number of processes with the same name exceeds the Warning when Process Count is greater than value specified under Thresholds (see above). Process Count Error (Error) The number of processes with the same name exceeds the Error when Process Count is greater than value specified under Thresholds (see above). Categories Displays the Monitoring Categories to which the Monitor is assigned. Click to select or deselect Monitoring Categories. Right click to create or edit Monitoring Categories. Test Monitor Test any Monitor Item against any Agent capable of running the Item using the drop-down and Test button on this dialog box. Testing a Monitor Item prior to putting it into production validates that the monitor item is configured properly. To test a monitor item: 1. Select the Agent you wish to test against from the drop-down list. 2. Click the Start Test button. If the test was successful, you will receive a pop-up indicating this and the option to see detailed results of the test. If the test failed, detailed results of the test will automatically open in Notepad. Schedule Displays the Scheduled Interval and Scheduled Hours settings which control the frequency for the Monitor Item. Scheduled Interval tab Specify the interval at which the monitoring, polling or action is to occur. Depending on the Monitor Item type, Items can be scheduled in interval increments of Seconds, Minutes, Hours and Days. The Scheduled Interval is relative to the top of the hour or top of the minute. For example,
99 User Guide 99 if a Scheduled Interval is configured for 10 minutes, the Monitor Item will execute at hh:10:00, hh:20:00, hh:30:00, hh:40:00, hh:50:00, h1:00:00, etc. If a Scheduled Interval is configured for 15 seconds, the Monitor Item will execute at hh:00:15, hh:00:30, hh:00:45, hh:01:00, hh:01:15, etc. Scheduled Hours tab Select the days and/or hours this item is active. By default, the schedule is set to ON for all hours and all days. Mouse clicks toggle squares between ON and OFF. Clicking on an individual square will toggle the active schedule for that hour. Clicking on an hour at the top of the grid, or on a day of the week at the left of the grid will toggle the corresponding column or row. Keyboard equivalents are the arrow keys and the space bar. Properties Tab This read-only tab displays the properties of the selected object and the values for those properties Service Monitor Service Monitor items monitor services and devices on Windows computers. The Monitor will trigger Actions when a service or device state changes (e.g., started to stopped, stopped to started, etc.). Service Monitor items also allow you to take action and/or be notified of services or devices that are set to Automatic startup but aren't running. If a service or device is set to manual startup and its state changes from started to stopped, the Event Log Message that is generated is a Warning message. If a service or device is set to automatic startup and its state changes from started to stopped, the Event Log Message that is generated is an Error message. If you have a service or device that is set to Automatic startup but not running, the Service Monitor item will generate an event to notify you about this condition. If you want to be repeatedly notified about this condition, put a check in the box labeled Execute configured Action(s) at every scheduled interval for AutoStart services that are stopped. This will cause the designated actions to be executed at each scheduled interval Note A checkmark will not cause repeated action if a service or device is set to Manual startup and is not running. Repeated action is executed with this checkmark only when the service or device is set to Automatic startup and is not currently running. Add Service To add a service or device, enter the service or device name in the Service field. Wildcards are supported in this field. To monitor all services and devices enter an asterisk (*). You can use other Boolean operators, such as and (&) and Not (!). The Service Monitor looks for matches
100 100 ELM Help based on both the display name (long name) and the internal name (short name) of a service or device. For example, the long name of the Windows Web service is World Wide Web Publishing and its short name is W3SVC. If a service's long name or short name matches the filter, it is added to the internal list of services and devices to monitor. Since both names are monitored, to exclude a service requires matches for both names. For example, to exclude the Windows Web service, enter strings that matches both its names. Service names can be entered on separate lines for exclusion. For example:!*world*wide*web*publishing*!*w3svc* Actions Started (Informational) A service state has changed to a started status. Stopped (Error) A service state has changed to a stopped status. Stopping (Error) A service state has changed to a stopping (stop pending) status. Starting (Informational) A service state has changed to a starting (start pending) status. Paused (Warning) A service state has changed to a paused status. Run Command Each Action also has an associated Run Command that is able to execute a script after a state change has occurred. Here is an example cmd script to restart failed services on a Service or Virtual agent: :: Restart Failed Service on Service Agent or Virtual Agent :: If the computer being monitored is the local computer :: use NET START, otherwise use SM.EXE to restart :: the service on the remote computer if "%COMPUTER%"=="" goto failed if "%SERVICE%"=="" goto failed :: Check to see if the failed service is on the :: local computer or a remote computer if /I "%COMPUTER%"=="%COMPUTERNAME%" goto do_local if /I NOT "%COMPUTER%"=="%COMPUTERNAME%" goto do_remote :do_remote SM.EXE \\%COMPUTER% "%SERVICE%" /START goto finished :do_local NET START "%SERVICE%" goto finished :failed echo A required environment variable is not defined. >.\Error.log echo The service cannot be re-started. >>.\Error.log goto finished :finished :: End Categories Displays the Monitoring Categories to which the Monitor is assigned. Click to select or deselect Monitoring Categories. Right click to create or edit Monitoring Categories. Test Monitor
101 User Guide 101 Test any Monitor Item against any Agent capable of running the Item using the drop-down and Test button on this dialog box. Testing a Monitor Item prior to putting it into production validates that the monitor item is configured properly. To test a monitor item: 1. Select the Agent you wish to test against from the drop-down list. 2. Click the Start Test button. If the test was successful, you will receive a pop-up indicating this and the option to see detailed results of the test. If the test failed, detailed results of the test will automatically open in Notepad. Schedule Displays the Scheduled Interval and Scheduled Hours settings which control the frequency for the Monitor Item. Scheduled Interval tab Specify the interval at which the monitoring, polling or action is to occur. Depending on the Monitor Item type, Items can be scheduled in interval increments of Seconds, Minutes, Hours and Days. The Scheduled Interval is relative to the top of the hour or top of the minute. For example, if a Scheduled Interval is configured for 10 minutes, the Monitor Item will execute at hh:10:00, hh:20:00, hh:30:00, hh:40:00, hh:50:00, h1:00:00, etc. If a Scheduled Interval is configured for 15 seconds, the Monitor Item will execute at hh:00:15, hh:00:30, hh:00:45, hh:01:00, hh:01:15, etc. Scheduled Hours tab Select the days and/or hours this item is active. By default, the schedule is set to ON for all hours and all days. Mouse clicks toggle squares between ON and OFF. Clicking on an individual square will toggle the active schedule for that hour. Clicking on an hour at the top of the grid, or on a day of the week at the left of the grid will toggle the corresponding column or row. Keyboard equivalents are the arrow keys and the space bar. Properties Tab This read-only tab displays the properties of the selected object and the values for those properties SMTP Monitor SMTP Monitors watch SMTP hosts, gateways and services. If you are using a Service Agent, the Service Agent will periodically establish an SMTP connection to the server and port specified. If you are using a Virtual Agent or an IP Virtual Agent, the SMTP polling is done by the ELM Server. The SMTP Monitor connects to the SMTP Server and times the initiating conversation from "EHLO" to "250 OK." Enabled Actions are executed depending on successful, slow, or failed responses. Negative or slower-than-expected responses trigger a variety of notification options. Several settings are available for SMTP Monitors:
102 102 ELM Help SMTP Monitor Port - Enter the port to which the SMTP Monitor should connect on your SMTP server. By default, SMTP communication occurs over TCP port 25. You can specify any valid TCP port used by your SMTP server. Warn if QoS slower than seconds - You may monitor your SMTP server performance. By specifying a value for this field, a warning message will be generated whenever the response from the SMTP server exceeds the threshold you specify here. The maximum QoS allowed is controlled by the HKEY_LOCAL_MACHINE \ SOFTWARE\ TNT Software \ ELM Enterprise Manager \ 6.7 \ Settings\SMTPMaxTimeoutInSeconds registry key. Execute configured Action(s) for every failure - By default, ELM will notify you only the first time the SMTP server is unavailable. Check this box to have a message sent for each interval that the SMTP server is found to be unavailable. Actions Failed (Error) The connection to the SMTP server could not be made, or the Monitor waited more than 2 QoS intervals. Success (Informational) The connection to the SMTP server could be made. Quality of Service Warning (Warning) The connection to the SMTP server could be made, but took longer than the Quality of Service time period. Categories Displays the Monitoring Categories to which the Monitor is assigned. Click to select or deselect Monitoring Categories. Right click to create or edit Monitoring Categories. Test Monitor Test any Monitor Item against any Agent capable of running the Item using the drop-down and Test button on this dialog box. Testing a Monitor Item prior to putting it into production validates that the monitor item is configured properly. To test a monitor item: 1. Select the Agent you wish to test against from the drop-down list. 2. Click the Start Test button. If the test was successful, you will receive a pop-up indicating this and the option to see detailed results of the test. If the test failed, detailed results of the test will automatically open in Notepad. Schedule Displays the Scheduled Interval and Scheduled Hours settings which control the frequency for the Monitor Item. Scheduled Interval tab Specify the interval at which the monitoring, polling or action is to occur. Depending on the Monitor Item type, Items can be scheduled in interval increments of Seconds, Minutes, Hours and Days. The Scheduled Interval is relative to the top of the hour or top of the minute. For example, if a Scheduled Interval is configured for 10 minutes, the Monitor Item will execute at hh:10:00, hh:20:00, hh:30:00, hh:40:00, hh:50:00, h1:00:00, etc. If a Scheduled Interval is configured for 15 seconds, the Monitor Item will execute at hh:00:15, hh:00:30, hh:00:45, hh:01:00, hh:01:15,
103 User Guide 103 etc. Scheduled Hours tab Select the days and/or hours this item is active. By default, the schedule is set to ON for all hours and all days. Mouse clicks toggle squares between ON and OFF. Clicking on an individual square will toggle the active schedule for that hour. Clicking on an hour at the top of the grid, or on a day of the week at the left of the grid will toggle the corresponding column or row. Keyboard equivalents are the arrow keys and the space bar. Properties Tab This read-only tab displays the properties of the selected object and the values for those properties SNMP Alarm The Simple Network Management Protocol (SNMP) communicates management information between network management stations and agents, and is defined in RFC ELM integrates with and leverages the native Windows SNMP Service and SNMP Trap Service. You must first install the Windows SNMP Service on your ELM Server and on any computer running a Service Agent and SNMP Alarm in order to use SNMP-related features. ELM supports SNMP in a variety of ways: The ELM Server can listen for and receive SNMP traps from any SNMP-compliant system or device on your network. Traps are treated as events; they will appear in event views, they will be stored in the database, and you can create Rules to trigger notification when any SNMP trap is received. By default, the Windows SNMP Service listens on UDP port 162, the default SNMP Trap port. Important When running the ELM Server on Windows XP Professional, you must be running Windows XP Service Pack 1 or later. An ELM Agent can run an SNMP Alarm to query an SNMP Object ID (OID) and trigger an action if the value becomes greater than, less than or equal to a user configured value. The SNMP Alarm includes an object browser for you to query the namespace on an SNMP-capable device, and walk the SNMP tree to select the specific OID for monitoring. See the ELM SNMP Notification Method for details about using ELM to send an SNMP trap, or put an SNMP OID value. Every SNMP-capable device includes manageable objects that are defined in one or more Management Information Bases (MIBs). Manageable objects include network identification, statistics, protocol information, performance data, and hardware and software configuration details. Each object within an MIB is identified by its object-identifier (OID), which is unique.
104 104 ELM Help ELM Enterprise Manager includes an SNMP Alarm that will query an SNMP Object ID (OID) and then compare the result to a specified value. If the comparison yields a true, then the Warning Action is triggered. If the comparison yields a false, the Success Action is triggered. If the SNMP Alarm is unable to retrieve a value, the Failure Action is triggered. The SNMP Alarm includes an object browser and MIB browser for selecting the OID. SNMP There are several settings for SNMP Alarms. Host Computer - The network name or IP address of the SNMP agent to be walked when the Display Objects from computer/community button is clicked. Community - The SNMP Community recognized by the SNMP agent. The Windows SNMP service on the ELM Server computer must be configured to use this Community as well. Timeout (milliseconds) - The amount of time the ELM SNMP Alarm will have the Windows SNMP Service wait for a response from the SNMP agent between retries. Retries - The number of attempts the ELM SNMP Alarm will have the Windows SNMP Service make contacting the SNMP agent before giving up and triggering the Failure Action. Display Objects from computer/community - Queries the specified Host Computer and Community for SNMP OIDs and values. Depending on network conditions, the SNMP Agent and the size of the namespace, the query may take several minutes. When complete, the root of the SNMP namespace will appear in the large Object Tree Browser window. Note By adding the registry value HKEY_LOCAL_MACHINE\SOFTWARE\TNT Software\ELM Enterprise Manager\6.7\Settings\SnmpRootOID on the ELM Console computer, you can specify an OID root different from when Display Objects from a computer/community is clicked in an SNMP Alarm Item or SNMP OID Notification Method. The root OID must be in numeric form. Object Tree Browser - Once data is retrieved from the SNMP Agent, the tree can be expanded and collapsed by clicking on the plus (+) and minus (-) controls. When a branch or leaf node is selected, the Object Identifier is displayed. If a leaf node is selected, the value returned by the SNMP Agent is displayed. Object Identifier - When a branch or node is selected in the Object Tree Browser window, the corresponding Object Identifier (OID) is displayed here. If the OID is known, it can be entered into this field. It should be typed in dotted numeric format, typically starting with Condition - The criterion used by the SNMP Alarm to compare the OID value with the specified value.
105 User Guide 105 Value - This field has two uses: When a leaf node is selected in the Object Tree Browser window, the most recently retrieved value for that leaf node will be displayed here. To refresh the values, click the Object Tree Browser button again. This field is used to enter the value used by the SNMP Alarm to evaluate the Condition. Execute configured Action(s) for every warning and failure - Check this box to configure the SNMP Alarm to trigger repeated Warning and Failure Actions. MIB Files During install, Windows copies a compiled MIB library called MIB.bin into the system32 directory. This file provides OID-to-name translation for a portion of the OID namespace tree. It does not generally include the namespace used by third-party SNMP agents. ELM can read vendor-provided MIB files and add to the namespace provided by the Windows SNMP service. When ELM is installed, it creates a MibFiles sub-directory for third-party MIB files. Place the vendor-supplied MIB file in the MibFiles folder, and use the MIB Files browser to select them. The Add button in the MIB Files Browser can also be used to put a copy of vendor-supplied MIB files in the MibFiles folder. Actions Success The retrieved OID value comparison with the configured value yielded a false. Warning The retrieved OID value comparison with the configured value yielded a true. Failure The SNMP Alarm failed to retrieve the configured OID value. Categories Displays the Monitoring Categories to which the Monitor is assigned. Click to select or deselect Monitoring Categories. Right click to create or edit Monitoring Categories. Test Monitor Test any Monitor Item against any Agent capable of running the Item using the drop-down and Test button on this dialog box. Testing a Monitor Item prior to putting it into production validates that the monitor item is configured properly. To test a monitor item: 1. Select the Agent you wish to test against from the drop-down list. 2. Click the Start Test button. If the test was successful, you will receive a pop-up indicating this and the option to see detailed results of the test. If the test failed, detailed results of the test will automatically open in Notepad. Schedule Displays the Scheduled Interval and Scheduled Hours settings which control the frequency for the Monitor Item. Scheduled Interval tab
106 106 ELM Help Specify the interval at which the monitoring, polling or action is to occur. Depending on the Monitor Item type, Items can be scheduled in interval increments of Seconds, Minutes, Hours and Days. The Scheduled Interval is relative to the top of the hour or top of the minute. For example, if a Scheduled Interval is configured for 10 minutes, the Monitor Item will execute at hh:10:00, hh:20:00, hh:30:00, hh:40:00, hh:50:00, h1:00:00, etc. If a Scheduled Interval is configured for 15 seconds, the Monitor Item will execute at hh:00:15, hh:00:30, hh:00:45, hh:01:00, hh:01:15, etc. Scheduled Hours tab Select the days and/or hours this item is active. By default, the schedule is set to ON for all hours and all days. Mouse clicks toggle squares between ON and OFF. Clicking on an individual square will toggle the active schedule for that hour. Clicking on an hour at the top of the grid, or on a day of the week at the left of the grid will toggle the corresponding column or row. Keyboard equivalents are the arrow keys and the space bar. Properties Tab This read-only tab displays the properties of the selected object and the values for those properties SNMP Collector SNMP Collector Monitor Items can collect SNMP OID values from systems being monitored by an ELM Agent. Data can be collected based on one or more OIDs. The SNMP Collector requires the Windows SNMP and SNMP Trap services. The SNMP Collector Monitor Item operates by polling the device at a scheduled interval and then writes this data to the ELM database. Reference Information SNMP Collectors behave like Performance Collectors. Performance Collectors query monitored Windows servers for defined statistics and return that data to the ELM Primary Database. An SNMP Collector's job is to collect the data provided by an SNMP Agent using the Simple Network Management Protocol and deliver the records to the ELM Server. SNMP Collector Displays the OID, Translated Name, and the Community fields. An SNMP community string is a text string that acts as a password. It is used to authenticate messages that are sent between the management station (the SNMP manager) and the device (the SNMP agent). The community string is included in every packet that is transmitted between the SNMP manager and the SNMP agent. After receiving an SNMP request, the SNMP agent compares the community string in the request to the community strings that are configured for the agent. The Add OIDs button opens the SNMP OID Selector window. This window provides the opportunity to select specific OIDs to monitor. OIDs may be browsed from a server or from a
107 User Guide 107 MIB file. The Show OIDs button on the From Server tab queries the specified Host Computer and Community for SNMP OIDs and values. The Restore Defaults button resets the From Server tab to the original settings. The Add button on the From MIB tab provides the ability to browse to a MIB file located elsewhere and add it to the list of MIB files available. The Remove button on the From MIB tab removes selected MIB files from the available list. The Translate MIB button on the From MIB tab converts the MIB file into the hierarchical tree format for browsing and selection of specific OIDs. The Remove button will delete any selected OIDs from the Collector window. MIB Files During install, Windows copies a compiled MIB library called MIB.bin into the system32 directory. This file provides OID-to-name translation for a portion of the OID namespace tree. It does not generally include the namespace used by third-party SNMP agents. ELM can read vendor-provided MIB files and add to the namespace provided by the Windows SNMP service. When ELM is installed, it creates a MibFiles sub-directory for third-party MIB files. Place the vendor-supplied MIB file in the MibFiles folder, and use the MIB Files browser to select them. The Add button on the From MIB tab is used to browse to the vendor-supplied MIB file. Categories Displays the Monitoring Categories to which the Monitor is assigned. Click to select or deselect Monitoring Categories. Right click to create or edit Monitoring Categories. Test Monitor Test any Monitor Item against any Agent capable of running the Item using the drop-down and Test button on this dialog box. Testing a Monitor Item prior to putting it into production validates that the monitor item is configured properly. To test a monitor item: 1. Select the Agent you wish to test against from the drop-down list. 2. Click the Start Test button. If the test was successful, you will receive a pop-up indicating this and the option to see detailed results of the test. If the test failed, detailed results of the test will automatically open in Notepad. Schedule Displays the Scheduled Interval and Scheduled Hours settings which control the frequency for the Monitor Item. Scheduled Interval tab Specify the interval at which the monitoring, polling or action is to occur. Depending on the Monitor Item type, Items can be scheduled in interval increments of Seconds, Minutes, Hours and Days. The Scheduled Interval is relative to the top of the hour or top of the minute. For example, if a Scheduled Interval is configured for 10 minutes, the Monitor Item will execute at hh:10:00, hh:20:00, hh:30:00, hh:40:00, hh:50:00, h1:00:00, etc. If a Scheduled Interval is configured for 15 seconds, the Monitor Item will execute at hh:00:15, hh:00:30, hh:00:45, hh:01:00, hh:01:15,
108 108 ELM Help etc. Scheduled Hours tab Select the days and/or hours this item is active. By default, the schedule is set to ON for all hours and all days. Mouse clicks toggle squares between ON and OFF. Clicking on an individual square will toggle the active schedule for that hour. Clicking on an hour at the top of the grid, or on a day of the week at the left of the grid will toggle the corresponding column or row. Keyboard equivalents are the arrow keys and the space bar. Properties Tab This read-only tab displays the properties of the selected object and the values for those properties SNMP Receiver ELM can receive SNMP traps sent from any SNMP management system or from another ELM Server. In order to receive SNMP traps on the ELM Server: Install and start the Windows SNMP Service In the Windows SNMP Service, configure the Security to fit your businesses networking environment Install and start the Windows SNMP Trap Service. SNMP Monitor The default SNMP Receiver monitor item will translate OID values to names. To use this feature a MIB file for a device sending traps must be copied to the MibFiles sub-folder under the ELM install folder. When traps are received by ELM it will then translate the OID from numeric to text labels as defined in the MIB. Note Restart ELM Server Service - When configuring the ELM SNMP Receiver, the ELM Server service must be restarted if either of the following are true: The ELM Server is running on a Windows XP computer The ELM SNMP Receiver has already been started at least one since the last time the ELM Server service was started A new MIB file has been placed in the sub-directory MibFiles under the ELM install folder
109 User Guide 109 Auto Assign By default, the SNMP Receiver monitor item will be automatically assigned to any agent that sends SNMP Traps to the ELM server. If unchecked, you must manually assign the monitor item to agents. Event Filters By default, the SNMP Receiver defaults to collecting all SNMP Traps when there isn't an Include Filter assigned to it. See Event Filters for further information. Categories Displays the Monitoring Categories to which the Monitor is assigned. Click to select or deselect Monitoring Categories. Right click or click the New link to create or edit Monitoring Categories. Agents Displays the Agents to which the Monitor is assigned. Click to select or deselect Agents. Right click or click the New link to deploy a new agent. Properties Tab This read-only tab displays the properties of the selected object and the values for those properties SQL Server Monitor Using SQL Monitors, you may periodically execute SQL queries against a database and generate a variety of notification options. SQL Monitors support default and named instances, and Windows and SQL Server authentication, making it easy to fit into your existing SQL security environment. SQL Monitor Settings Query - Enter a SQL query to be executed by the monitor. An event will be triggered if the results are different from the last time the query was run. Enter the SQL instance name in the Instance Name field if necessary. Otherwise leave blank for the default instance. Logon - The SQL Monitor supports SQL Authentication and Mixed Mode Authentication. If you are using integrated (Windows) authentication, then check the Use Integrated Logon checkbox. If you are using SQL authentication, un-check the Use Integrated Logon checkbox, and enter the username and password ELM is to use when executing the Query. Actions Warning The SQL query results are different from the results the last time the query ran. Categories
110 110 ELM Help Displays the Monitoring Categories to which the Monitor is assigned. Click to select or deselect Monitoring Categories. Right click to create or edit Monitoring Categories. Test Monitor Test any Monitor Item against any Agent capable of running the Item using the drop-down and Test button on this dialog box. Testing a Monitor Item prior to putting it into production validates that the monitor item is configured properly. To test a monitor item: 1. Select the Agent you wish to test against from the drop-down list. 2. Click the Start Test button. If the test was successful, you will receive a pop-up indicating this and the option to see detailed results of the test. If the test failed, detailed results of the test will automatically open in Notepad. Schedule Displays the Scheduled Interval and Scheduled Hours settings which control the frequency for the Monitor Item. Scheduled Interval tab Specify the interval at which the monitoring, polling or action is to occur. Depending on the Monitor Item type, Items can be scheduled in interval increments of Seconds, Minutes, Hours and Days. The Scheduled Interval is relative to the top of the hour or top of the minute. For example, if a Scheduled Interval is configured for 10 minutes, the Monitor Item will execute at hh:10:00, hh:20:00, hh:30:00, hh:40:00, hh:50:00, h1:00:00, etc. If a Scheduled Interval is configured for 15 seconds, the Monitor Item will execute at hh:00:15, hh:00:30, hh:00:45, hh:01:00, hh:01:15, etc. Scheduled Hours tab Select the days and/or hours this item is active. By default, the schedule is set to ON for all hours and all days. Mouse clicks toggle squares between ON and OFF. Clicking on an individual square will toggle the active schedule for that hour. Clicking on an hour at the top of the grid, or on a day of the week at the left of the grid will toggle the corresponding column or row. Keyboard equivalents are the arrow keys and the space bar. Properties Tab This read-only tab displays the properties of the selected object and the values for those properties Syslog Receiver Syslog The Syslog Receiver is based on RFC 3164 and listens for Syslog messages. By default, the
111 User Guide 111 Receiver listens for Syslog on UDP port 514 or TCP port 601. Auto Assign By default, the Syslog Receiver monitor item will be automatically assigned to any agent that sends syslog messages to the ELM server using the specified protocol and port number. If unchecked, you must manually assign the monitor item to agents. Event Filters By default, the Syslog Receiver defaults to collecting all syslog messages when there isn't an Include Filter assigned to it. See Event Filters for further information. Categories Displays the Monitoring Categories to which the Monitor is assigned. Click to select or deselect Monitoring Categories. Right click to create or edit Monitoring Categories. Agents Displays the Agents to which the Monitor is assigned. Click to select or deselect Agents. Right click or click the New link to deploy a new agent. Properties Tab This read-only tab displays the properties of the selected object and the values for those properties. Syslog Device Configuration Before ELM receives any Syslog messages, the device sending Syslog has to be configured, and usually this is done in a syslog.conf file. A common format for this file designates facility, severity, and destination. Generic Examples: facility.severity[;facility.severity] destination Meaning Send all messages from the kernel facility to server PDC1. Send all messages with a severity of error to server REDMOND Send messages from the cron facility with a severity of warning and from the ntp facility with a severity of alert to the server CORP3.
112 112 ELM Help These are generic examples, please consult the documentation for your specific device for details about its Syslog functionality. Syslog to Event Log Record Layout When ELM receives Syslog messages, the Syslog record format is converted to a Windows event log record style format. Syslog messages have the following fields which ELM maps to the corresponding event record fields listed: Syslog Message Event Record Facility Category Severity Event Type Priority Event ID Header Message Message Message Syslog messages have 24 Facilities. These are converted to event categories by ELM according to the following mapping: Number Syslog Facility Event Category 0 Kernel kern 1 User user 2 Mail mail 3 Daemon daemon 4 Auth auth 5 Syslog syslog 6 Lpr lpr 7 News news 8 UUCP uucp
113 User Guide 9 Cron cron 10 Security authpriv 11 FTP Daemon ftp 12 NTP ntp 13 Log Audit audit 14 Log Alert alert 15 Clock Daemon clock 16 Local0 local0 17 Local1 local1 18 Local2 local2 19 Local3 local3 20 Local4 local4 21 Local5 local5 22 Local6 local6 23 Local7 local7 Syslog messages have 8 Severities or Levels. These are converted to event types by ELM according to the following mapping: Number Syslog Severity Event Type 0 Emergency Error 1 Alert Error 2 Critical Error 3 Error Error 113
114 114 ELM Help 4 Warning Warning 5 Notice Warning 6 Info Informational 7 Debug Informational Syslog messages have 192 Priorities. The lower the number, the higher the priority. These are calculated from the Facility and Level according to the following formula, and are used by ELM for the Event ID: Facility * 8 + Severity = Priority (Event ID) Examples: Priority (Event ID) Facility * Multiplier + Severity = Mail (2) * 8 + Error (3) = 19 Clock Daemon (15) * 8 + Warning (4) = 124 Kernel (0) * 8 + Emergency (0) = TCP Port Monitor You can monitor any valid TCP port using a TCP Port Monitor item. Because the ELM Server (and not an Agent) makes the actual connection to the port, you can monitor TCP port availability on any operating system (e.g., Unix, Linux, Novell, Solaris, Windows, etc.), provided that you have TCP/IP connectivity to that system from the ELM Server. Each TCP Port Monitor can poll a single port. TCP Port Monitor Settings TCP Port - The TCP port you want to monitor. Warn if QoS slower than seconds - You may monitor the port's response time. By specifying a value for this field, a warning message will be generated whenever the response from the port exceeds the threshold you specify here. Execute configured Action(s) for every failure - By default, ELM will notify you only the first time the port is unavailable. Check this box to have a message sent for each interval that the port is unavailable.
115 User Guide 115 Actions Failed (Error) The connection to the TCP port could not be made. Success (Informational) The connection to the TCP port could be made. Quality of Service Warning (Warning) The connection to the TCP port took longer than the Quality of Service time period. Categories Displays the Monitoring Categories to which the Monitor is assigned. Click to select or deselect Monitoring Categories. Right click to create or edit Monitoring Categories. Test Monitor Test any Monitor Item against any Agent capable of running the Item using the drop-down and Test button on this dialog box. Testing a Monitor Item prior to putting it into production validates that the monitor item is configured properly. To test a monitor item: 1. Select the Agent you wish to test against from the drop-down list. 2. Click the Start Test button. If the test was successful, you will receive a pop-up indicating this and the option to see detailed results of the test. If the test failed, detailed results of the test will automatically open in Notepad. Schedule Displays the Scheduled Interval and Scheduled Hours settings which control the frequency for the Monitor Item. Scheduled Interval tab Specify the interval at which the monitoring, polling or action is to occur. Depending on the Monitor Item type, Items can be scheduled in interval increments of Seconds, Minutes, Hours and Days. The Scheduled Interval is relative to the top of the hour or top of the minute. For example, if a Scheduled Interval is configured for 10 minutes, the Monitor Item will execute at hh:10:00, hh:20:00, hh:30:00, hh:40:00, hh:50:00, h1:00:00, etc. If a Scheduled Interval is configured for 15 seconds, the Monitor Item will execute at hh:00:15, hh:00:30, hh:00:45, hh:01:00, hh:01:15, etc. Scheduled Hours tab Select the days and/or hours this item is active. By default, the schedule is set to ON for all hours and all days. Mouse clicks toggle squares between ON and OFF. Clicking on an individual square will toggle the active schedule for that hour. Clicking on an hour at the top of the grid, or on a day of the week at the left of the grid will toggle the corresponding column or row. Keyboard equivalents are the arrow keys and the space bar. Properties Tab This read-only tab displays the properties of the selected object and the values for those properties.
116 116 ELM Help Web Page Monitor Web Page Monitors are used to monitor HTTP or HTTPS URLs. The ELM Enterprise Manager Server periodically establishes an HTTP connection to the server and port specified. If the response is negative, slower than expected, or if the content has been changed, a variety of notification options can be triggered. Note that multiple Web Page Monitors can be assigned to the ELM Server or to Service Agents. Therefore, you may create Web Page Monitors independent of the number of Agent licenses you have purchased. You must assign the Web Page Monitors to a licensed Agent, however, if you want an Agent to execute the Web Page Monitor. Web Page Monitor Settings URL - The URL you want to monitor. By default, HTTP communication occurs over TCP port 80. If you are using a different port, you can specify that port as part of the URL. For example, to monitor a web page on that is listening on port 8080, you would use the following URL: Warn if QoS slower than seconds - You can monitor your Web server's performance. By specifying a value for this field, a warning message will be generated whenever the response from the Web server exceeds the quality of service threshold you specify here. Username - If you must enter a username and password to access the URL listed in the URL field, enter that username in this field. Note If you are accessing the URL through a proxy server, this is NOT the username used for Proxy server or firewall authentication. This username is for the Web server that contains the URL being monitored only. Password - The password for the account specified in the Username field. Execute configured Action(s) for every failure - By default, ELM will notify you only the first time the Web server is unavailable. Check this box to have a message sent for each interval that the Web server is unavailable. Warn if content changes - Check this box to cause a warning to be generated if the content of the monitored URL is different from the last time the Web Page Monitor retrieved the URL. Run At Server - Check this box to have the Web Page Monitor always executed on the ELM Server by the ELM Server service account. If you leave the box unchecked, the Web Page Monitor will be executed on the assigned Agents by the Agent's service account. Proxy Server - If the ELM Server or Agent needs to access the monitored URL through a proxy server, enter the name, fully-qualified domain name or IP address of the proxy server in the Proxy Server field. Enter the appropriate port for the proxy server in the Proxy Port field. Actions Failed (Error) The web page could not be found or retrieved. Success (Informational) The web page was retrieved within the quality of service time period. Quality of Service Warning (Warning) The web page was not retrieved within the quality of service time period. Content has changed (Warning) The web page was retrieved, but the content has changed.
117 User Guide 117 Categories Displays the Monitoring Categories to which the Monitor is assigned. Click to select or deselect Monitoring Categories. Right click to create or edit Monitoring Categories. Test Monitor Test any Monitor Item against any Agent capable of running the Item using the drop-down and Test button on this dialog box. Testing a Monitor Item prior to putting it into production validates that the monitor item is configured properly. To test a monitor item: 1. Select the Agent you wish to test against from the drop-down list. 2. Click the Start Test button. If the test was successful, you will receive a pop-up indicating this and the option to see detailed results of the test. If the test failed, detailed results of the test will automatically open in Notepad. Schedule Displays the Scheduled Interval and Scheduled Hours settings which control the frequency for the Monitor Item. Scheduled Interval tab Specify the interval at which the monitoring, polling or action is to occur. Depending on the Monitor Item type, Items can be scheduled in interval increments of Seconds, Minutes, Hours and Days. The Scheduled Interval is relative to the top of the hour or top of the minute. For example, if a Scheduled Interval is configured for 10 minutes, the Monitor Item will execute at hh:10:00, hh:20:00, hh:30:00, hh:40:00, hh:50:00, h1:00:00, etc. If a Scheduled Interval is configured for 15 seconds, the Monitor Item will execute at hh:00:15, hh:00:30, hh:00:45, hh:01:00, hh:01:15, etc. Scheduled Hours tab Select the days and/or hours this item is active. By default, the schedule is set to ON for all hours and all days. Mouse clicks toggle squares between ON and OFF. Clicking on an individual square will toggle the active schedule for that hour. Clicking on an hour at the top of the grid, or on a day of the week at the left of the grid will toggle the corresponding column or row. Keyboard equivalents are the arrow keys and the space bar. Properties Tab This read-only tab displays the properties of the selected object and the values for those properties Window s Configuration Monitor The Windows Configuration Monitor collects System Information details from the monitored
118 118 ELM Help Windows system at its Scheduled Intervals. It is like being able to run msinfo32 on a schedule and store the results. It can notify you to additions, changes, or removals of details in the System Information. By default, the Monitor is fine tuned to ignore frequently changing details like Available Physical Memory, and can be further customized by the ELM administrator. Collected System Information details can be viewed under each Agent in the System Information container. You can also filter details, display subsets of the details, compare details between systems or times, print reports, etc. Collected data is stored in a directory named Configuration Monitor Data under the ELM Enterprise Manager install folder. For each Agent monitored, there will be a system information file containing the most recently collected full configuration. If the ELM Configuration Monitor has run more than once, then there will also be history files containing detail differences.

119 User Guide 119 Note Both the ELM Windows Configuration Monitor and msinfo32 will return an unreadable company name for msencode.dll on Windows Below is a screenshot from msinfo32. Note The following msinfo32 categories have been purposefully removed from the ELM Configuration Monitor: System Summary.Software Environment.Print Jobs, System Summary.Software Environment.Network Connections, System Summary.Software Environment.Running Tasks and System Summary.Software Environment.Loaded Modules Windows Configuration Monitor Settings History Retention - Set the number of days, weeks or months to keep history. Acceptable values are Exclude - Tells the Configuration Monitor to ignore attributes that change frequently. Actions Warning The Configuration Monitor Detected Item(s) Added. Warning The Configuration Monitor Detected Item(s) Changed. Warning The Configuration Monitor Detected Item(s) Removed. Categories Displays the Monitoring Categories to which the Monitor is assigned. Click to select or deselect Monitoring Categories. Right click to create or edit Monitoring Categories. Test Monitor Test any Monitor Item against any Agent capable of running the Item using the drop-down and Test button on this dialog box. Testing a Monitor Item prior to putting it into production validates that the monitor item is configured properly. To test a monitor item: 1. Select the Agent you wish to test against from the drop-down list. 2. Click the Start Test button.
120 120 ELM Help If the test was successful, you will receive a pop-up indicating this and the option to see detailed results of the test. If the test failed, detailed results of the test will automatically open in Notepad. Schedule Displays the Scheduled Interval and Scheduled Hours settings which control the frequency for the Monitor Item. Scheduled Interval tab Specify the interval at which the monitoring, polling or action is to occur. Depending on the Monitor Item type, Items can be scheduled in interval increments of Seconds, Minutes, Hours and Days. The Scheduled Interval is relative to the top of the hour or top of the minute. For example, if a Scheduled Interval is configured for 10 minutes, the Monitor Item will execute at hh:10:00, hh:20:00, hh:30:00, hh:40:00, hh:50:00, h1:00:00, etc. If a Scheduled Interval is configured for 15 seconds, the Monitor Item will execute at hh:00:15, hh:00:30, hh:00:45, hh:01:00, hh:01:15, etc. Scheduled Hours tab Select the days and/or hours this item is active. By default, the schedule is set to ON for all hours and all days. Mouse clicks toggle squares between ON and OFF. Clicking on an individual square will toggle the active schedule for that hour. Clicking on an hour at the top of the grid, or on a day of the week at the left of the grid will toggle the corresponding column or row. Keyboard equivalents are the arrow keys and the space bar. Properties Tab This read-only tab displays the properties of the selected object and the values for those properties WMI Monitor If you are using Windows Management Instrumentation (WMI) -- the Microsoft implementation of Web-Based Enterprise Management (WBEM) -- you can use WMI Monitors to query a WMI namespace and database. WMI monitor items periodically query the Windows Management Instrumentation database and generates events when the results of the query change. WMI is a key component of Microsoft Windows management services, and an integral part of Windows 2000, Windows XP, Windows 2003, Windows 2008, and Vista. WMI Monitor Settings Namespace - Enter the name of the WMI namespace to query. This is usually root/cimv2. Query - Enter the query to execute. This query is the base query which retrieves zero or more records from the WMI repository. Actions
121 User Guide 121 Warning The results of the WMI query are different from the results the last time the query ran. Categories Displays the Monitoring Categories to which the Monitor is assigned. Click to select or deselect Monitoring Categories. Right click to create or edit Monitoring Categories. Test Monitor Test any Monitor Item against any Agent capable of running the Item using the drop-down and Test button on this dialog box. Testing a Monitor Item prior to putting it into production validates that the monitor item is configured properly. To test a monitor item: 1. Select the Agent you wish to test against from the drop-down list. 2. Click the Start Test button. If the test was successful, you will receive a pop-up indicating this and the option to see detailed results of the test. If the test failed, detailed results of the test will automatically open in Notepad. Schedule Displays the Scheduled Interval and Scheduled Hours settings which control the frequency for the Monitor Item. Scheduled Interval tab Specify the interval at which the monitoring, polling or action is to occur. Depending on the Monitor Item type, Items can be scheduled in interval increments of Seconds, Minutes, Hours and Days. The Scheduled Interval is relative to the top of the hour or top of the minute. For example, if a Scheduled Interval is configured for 10 minutes, the Monitor Item will execute at hh:10:00, hh:20:00, hh:30:00, hh:40:00, hh:50:00, h1:00:00, etc. If a Scheduled Interval is configured for 15 seconds, the Monitor Item will execute at hh:00:15, hh:00:30, hh:00:45, hh:01:00, hh:01:15, etc. Scheduled Hours tab Select the days and/or hours this item is active. By default, the schedule is set to ON for all hours and all days. Mouse clicks toggle squares between ON and OFF. Clicking on an individual square will toggle the active schedule for that hour. Clicking on an hour at the top of the grid, or on a day of the week at the left of the grid will toggle the corresponding column or row. Keyboard equivalents are the arrow keys and the space bar. Properties Tab This read-only tab displays the properties of the selected object and the values for those properties.
122 122 ELM Help All Agents Monitoring categories group Agents for easy management and can be customized to your particular needs. ELM has many pre-configured Categories, and will import Categories found during an upgrade. Monitoring Categories are user configurable containers for organizing ELM Agents. Monitor Items are assigned to Categories which then assign them to any Agents in the Category. ELM has many pre-configured Categories, and will import Categories found during an upgrade. The default All Agents category has special significance to ELM and should not be altered. However the other pre-configured Categories, can be renamed, deleted, or otherwise altered. New Categories can be created as necessary. Agents can exist within multiple categories. For example, an Agent monitoring SQL Server 2008 could be in the following categories: Windows Servers Service Agents Database Servers Corporate Servers Monitor Items - Monitor Items determine the type of information or activity to monitor. Examples include Event Collector (which collects events), Service Monitor (which watches the state of Windows services), and Performance Collector (which gathers performance counter values) can be assigned to Monitoring Categories. Agents inherit the Monitors that are assigned to an Agent Category. Adding a Monitor to the Agent Category automatically assigns the monitor to each agent in the category. If the agent cannot run the Monitor, for example a Windows XP agent in a category with a Cluster Server monitor, nothing will happen. The agent will ignore the monitor and there is no adverse effect or additional Agent Folders When selecting an Agent in the ELM console you will presented with The Agent At-A-Glance In addition Agents in the ELM Console snap-in tree have sub-folders that contain information specific to the selected Agent. Events This folder contains Windows event log records collected by the Agent for the monitored system. Outages
123 User Guide 123 Select the Outages folder to view any application or server outages that have occurred or are occurring on the Agent computer. Inventory This folder lists software applications installed on the computer, similar to the listing in Windows Add/Remove Programs or Programs and Features, which is run by the Inventory Collector Monitor Item System Information Select the System Information folder to view information collected by the msinfo32.exe process, which is run by the Windows Configuration Monitor Monitor Item. Monitor Items The Monitor Items folder lists all the Items assigned to the selected Agent. Performance Data The Performance Data folder lists performance objects and counters assigned to the Agent, and any collected performance counter data. Right click the performance counter and select Create Editor Report in order to create a report based upon that counter. SNMP Data The SNMP Data folder lists OID, the Translated Name of the OID, and the OID Value. The information in this folder is collected by the SNMP Collector. Application tracking is a method of reporting and alerting when applications become unavailable. Outages for all monitored systems are displayed on the ELM Server At-a-Glance page made visible by selecting the ELM Server node on the left hand tree in the snap-in. Agents display Outage information on the Agent At-a-Glance page made visible by selecting the Agent. Outage history is displayed in the Outages sub-folder below the Agent. About Outage Tracking
124 124 ELM Help Application tracking becomes automatic when an Inventory Collector is assigned to an Agent and it has run at least once, and an Event Collector is assigned to the Agent that collects application events. The Inventory Collector ensures that the database contains a list of currently installed applications and generates events when applications are installed or removed. The Event Collector sends events from the Agent computer to the ELM Server. When the ELM Server receives an event that has been profiled in the ELM Server appsettings.xml file, it records the application information and generates an event indicating the outage status. The OutageIdentifiers.xml file is in the ELM Enterprise Manager install folder. By default, this is c:\program Files\ELM Enterprise Manager. If an Application Outage is current, it is displayed on the ELM Server's At-a-Glance page, the Agent's At-a-Glance page, and in the Agent's Outages folder. This page also displays application outage history for an Agent.

125 User Guide 125 The Inventory folder, found below each Agent, displays software inventory information that has been collected by an Inventory Collector. The Inventory Collector and Event Collector monitor items use the Inventory information to track application outages.
126 126 ELM Help The System Information folder generates and displays system information reports created with the Microsoft System Information (msinfo32) tool. The information for this report is collected periodically by assigning a Windows Configuration Monitor to the Agents. The Context Menu in the System Information results enables you to filter, report on, and compare configurations from two different points in time or two different Agents. The Windows Configuration Monitor will write an event when configuration changes are detected.

127 User Guide 127 The SNMP Data folder lists Date/Time, OID, the Translated Name of the OID, and the OID Value. The information in this folder is collected by the SNMP Collector.
128 128 ELM Help Agent Installation Installing Agents An ELM Server can monitor multiple Agents and a Service Agent can be monitored by multiple ELM Servers. Each Agent maintains separate configuration, collection set, and cache files for each ELM Server that monitors the Agent. You can install Agents remotely from the ELM Console, or you can install them manually on the target machine (see Installing Service Agents Using Setup Package below). To Install Agent(s): 1. Right-click on the Monitoring container in the ELM Console and select New Agent. The Agent Deployment Wizard will launch. When the Welcome dialog is displayed, click Next to continue. 2. From the System Names dialog box, there is the option of installing One System or Many Systems. The One System agent installation is in the Quick Start Configuration section, so this part of the guide will cover the Many Systems agent install. 3. In the Many Systems area, there are three options: Active Directory, IP Range, and
129 User Guide 129 Import from File. Active Directory: Specify the Active Directory domain to search. Selecting the... in the box marked Filter on OU: allows you to further specify particular Organizational Units within the domain to search. Scan IP Range: Specify a range of IP addresses to search for computers or devices. The ELM Server will query port 139 and look for responses. Import From File: Use the ellipsis button to browse to a CSV (comma-separated value) file containing a list of machines or devices on which to install Agents. After the import, the Agent Deployment Wizard will determine if it what type of agent to install. The CSV file has the following syntax: Agent1, Agent2, Agent3, 4. On the Next dialog, Systems Found, a Succeeded or Failed message will indicate if that system is online by using Ping. Click a system or multiple systems using ctrl or shift, right-click on the system(s) name to Add a System, Select All, or Selected Systems Remove. To change service agent defaults, select the Defaults button. Change the defaults to match the needs in your environment.
130 130 ELM Help Use the Install Credentials to specify the account used to connect and install the service agent. This account must have local administrator rights on the destination. For a DC, this would be a Domain Administrator account. Use the Share and path to specify the destination share and path for the service agent install. The directory must already exist. Using the Listening port to change the port that the agent will use. Use the Minimum disk free space in MB to limit how much disk space a cache file will take. Use the Maximum cache file size in MB to limit the size of the cache file. Note Once an Agent has been configured to listen on a specific port, you cannot change the port. If you want the Agent to listen on a different port, you must remove then re-add the Agent using the new port. 5. The System Scan Summary dialog displays the scan results and gives the status to common agent installation issues. If there are any errors, Advanced is automatically checked. If there are no errors, but a few systems need to be customized, check Advanced before selecting next.
131 User Guide The Agent Operating Mode dialog is used to change the agent to a different mode and/or modify specific agent(s) port. Select Show only Errors to filter the agents with errors. Select a system that is not available and Remove by selecting and right clicking Selected Systems Remove. 7. The Log On for Service Agents dialog is used to change the account used for the Service Agent(s). Select multiple agents by using ctrl and mouse click or shift and mouse click. 8. The Service Agent Install Location dialog is used to change the installation share and path. Select multiple agents by using ctrl and mouse click or shift and mouse click. Use the Min. free disk (MB) to limit how much disk space a cache file will take. Use the Max. cache file (MB) to limit the size of the cache file. 9. The Monitoring Categories dialog is used to assign agents to Monitoring Categories. Select multiple agents by using ctrl and mouse click or shift and mouse click. 10.The Monitoring Products dialog is used to assign agents to Monitoring Products. Select multiple agents by using ctrl and mouse click or shift and mouse click. The Avail column show the number of licenses available for that product. The Used column shows the number of licenses used for that product. 11.The Install Agents dialog displays the status of all of your selections before selecting Next to install. 12.The Install Summary dialog displays the status of the installation. Click Finish to exit the Agent Deployment Wizard. Installing Service Agents Using the Setup Package If the system you wish to monitor is on the other side of a firewall, in a DMZ environment, or located in an environment that restricts the use of NetBIOS and RPC endpoint ports, you can use the ELM Setup package to install a Service Agent on the remote system and then use the Agent UI or Registration Wizard to register the Agent with the ELM Server and select monitor items for the Agent. To install a Service Agent using Setup: 1. Double-click the ELM67_nnn.msi file you downloaded (where nnn is the build number). The Setup Wizard will launch. 2. Click Next to continue. The License Agreement screen will appear. 3. Review and then select I accept the license agreement and click Next to continue. 4. On the Select Features dialog: Click on the Server component icon and select Entire feature will be unavailable. Click on the Console component icon and select Entire feature will be unavailable. Click on the Advisor component icon and select Entire feature will be unavailable.
132 132 ELM Help Click on the Agent icon with the X and select Will be installed on local hard drive. Click on Browse to change the default install path. 5. Click Next for the Install Application dialog. If any changes must be made, use the Back button to return to any dialogs requiring changes. 6. Click Install to start the Service Agent install process. 7. When the installation has completed, the Register Server Wizard will launch. In the Name field, enter the host name, IP address or fully-qualified domain name for the ELM Server you wish to register, or click the Browse button to browse the network for the ELM Server you wish to register. In the Port field, enter the TCP port on which the ELM Server is listening. By default, ELM Servers listen on port The port is configured at the ELM Server from the ELM Server Control Panel applet. Click Next to continue. 8. A logon prompt will appear. Provide an account that has administrative rights on the ELM Server computer. If a domain account is specified, use the pattern domain\user in the Username field. Click OK when an account and password have been entered. 9. The Monitoring Products dialog box will appear. Put a check in the box to the left of the type of Monitoring Product you want this agent to have. Click Next to continue. 10.The Monitoring Categories dialog box will appear. Put a check in the box to the left of each Category you want this Agent to join. You may view the properties of any Category by rightclicking the item and selecting Properties. Click Finish to save the Agent settings and ELM Server registration. 11. Click Finish to close the install wizard. To uninstall a Service Agent that was installed using setup: 1. Open the Windows Control Panel and double-click 'Add/Remove Programs' or 'Programs and Features'. 2. Select the ELM Enterprise Manager product and click the Change button. 3. If the Service Agent is the only ELM component installed on this system, or if there are other ELM components (e.g., ELM Server or ELM Console) and you wish to uninstall everything, select Remove and proceed through the Wizard. If there are other ELM components installed on this system and you do not wish to remove them, select Modify and continue through the Wizard. When the component dialog is shown, change the Service Agent from Will be installed on local hard drive to Entire feature will be unavailable. Then complete the Wizard to remove it.
133 User Guide 133 IP Virtual Agents monitor Windows and non-windows systems remotely from the ELM Server. They can run Monitor Items to monitor TCP based services like FTP, TCP ports, etc. To view an IP Virtual Agent's Status, in the ELM Console, right-click the IP Virtual Agent whose status you want to view and select Properties. The following properties are displayed: Name Identifies the Agent computer. The Name can be a NetBIOS computer name, DNS computer name, or TCP/IP address. Enabled To disable monitoring of the computer clear this checkbox. Description Enter a brief description and notes about the agent. Monitor Items Displays the Monitor Items assigned to the Agent. Monitor Items can be assigned directly to an Agent by checking the checkbox of Monitor Items on this list, or by assigning them to one of the Monitoring Categories to which the agent belongs. Right click to create or edit a Monitor Item. Categories Displays the Monitoring Categories assigned to the Agent. Click to select or deselect Monitoring Categories. Right click to create or edit a Monitoring Categories. Licenses Displays license types and the selected license for the agent. Properties Tab This read-only tab displays the properties of the selected object and the values for those properties. Virtual Agents are Windows systems monitored remotely from the ELM Server, without installing software on the monitored system. If ELM is running on Windows Server 2003 or Windows XP, and it's deployed a Virtual Agent to a Windows Vista or above version of Windows, the Event Collector will not be able to be assigned to it. The ELM Console will disallow the assignment due to the lack of support in Windows Server 2003 and Windows XP for Vista and newer Event Logs.
134 134 ELM Help Note When monitoring Windows systems with a high level of security auditing enabled, then additional security events will be created as the ELM Server authenticates to the Window system and gathers data. To view a Virtual Agent's Status, in the ELM Console, right-click the Virtual Agent whose status you want to view and select Properties. The following properties are displayed: Name Identifies the Agent computer. The Name can be a NetBIOS computer name, DNS computer name, or TCP/IP address. Enabled To disable monitoring of the computer clear this checkbox. Description Enter a brief description and notes about the agent. Monitor Items Displays the Monitor Items assigned to the Agent. Monitor Items can be assigned directly to an Agent by checking the checkbox of Monitor Items on this list, or by assigning them to one of the Monitoring Categories to which the agent belongs. Right click to create or edit a Monitor Item. Categories Displays the Monitoring Categories assigned to the Agent. Click to select or deselect Monitoring Categories. Right click to create or edit a Monitoring Categories. Licenses Displays license types and the selected license for the agent. Properties Tab This read-only tab displays the properties of the selected object and the values for those properties. Service Agents monitor Windows systems with the TNTAgent service installed on the monitored system. To view a Service Agent's Status, in the ELM Console, right-click the Service Agent whose status you want to view and select Properties. The following properties are displayed: Name

135 User Guide 135 Identifies the Agent computer. The Name can be a NetBIOS computer name, DNS computer name, or TCP/IP address. Enabled To disable monitoring of the computer clear this checkbox. Description Enter a brief description and notes about the agent. Monitor Items Displays the Monitor Items assigned to the Agent. Monitor Items can be assigned directly to an Agent by checking the checkbox of Monitor Items on this list, or by assigning them to one of the Monitoring Categories to which the agent belongs. Right click to create or edit a Monitor Item. Categories Displays the Monitoring Categories assigned to the Agent. Click to select or deselect Monitoring Categories. Right click to create or edit a Monitoring Categories. Licenses Displays license types and the selected license for the agent. Properties Tab This read-only tab displays the properties of the selected object and the values for those properties. Agent Service Agent Service Settings Click the Test button to test the Agent's port. A successful test will produce the following message with the agent name in it: Click the Display Processes button for a live view of the current processes on this Agent. Click the Display Diagnostics button to generate a text file containing diagnostic and module information.

136 136 ELM Help Service Agent Logon Account Enter the credentials required to run privileged operations on your Service Agent. Certain operations such as scripts, SQL queries, or other processes may require different permissions than those required by LocalSystem. This account will take precedence over the account listed in the service. You may enhance security by running the Service Agent with an account that has minimum permissions to perform its operations.the account you specify on this dialog will appear in the properties of the TNT Agent service. Agent Status Agent status displays details about the currently active Agent process, TNTAgent.exe. The Active Configuration Settings section lists the Monitor Items active on the Agent, followed by time-stamped activities. This provides important details to verify that an Agent is operating as desired. Agent Status is one of the first places to look for suspected reporting or communication problems between a Service Agent and an ELM Server. Use your mouse to select data in this dialog box (drag-select or right-click and Select All), then copy and paste it into a file or message. Server Collection

137 User Guide 137 Displays a list of the ELM Servers that are monitoring this Service Agent. Double-click on a listed ELM Server to display details about the ELM Server. Right-click the ELM Server and deregister it from this Agent if you no longer want it to monitor this Agent. Properties Tab This read-only tab displays the properties of the selected object and the values for those properties Agent Maintenance Agent maintenance tasks modify or restore Agents in various ways. The operations of Update Agent Configuration, Reinstall Agent, and Reset Agent Aliases are accessible through context menus for individual Agents, Monitoring Categories, or multiple Agents as illustrated below. Not all operations are relevant for Virtual Agents.

138 138 ELM Help Reinstall Agent This operation will reinstall Agent binaries. It will attempt to use the Agent listening port to transfer files, but if unavailable, the operation will then try to use RPC to authenticate and connect to the default: ADMIN$ share like an initial Service Agent install. Reinstall Agent will create an update log, and will stop and start the Agent service. This operation applies only to Service Agents. Restart Agent This operation will restart the TNTAgent service. This operation applies only to Service Agents. Update Agent Configuration There are 2 copies of a Service Agent's configuration, one in the ELM Server and one in the Agent. If the two do not match, the copy in the ELM Server is considered the authority. During normal operation, the ELM Server will automatically send configuration updates to Service Agents within about 5 minutes, depending on system activity, network latency, number of Agents needing updates, etc. The Update Agent Configuration operation allows an ELM administrator to manually refresh the configuration without waiting the default 5 minutes. This operation applies only to Service Agents.
139 User Guide 139 Reset Agent Aliases This operation will refresh the SV_Aliases property for an Agent using the name resolution mechanism of the OS hosting the ELM Server. The SV_Aliases list is the primary source of Agent identity for the ELM Server and includes the IP address(es), and the fully qualified domain name (FQDN) for an Agent. A reset is occasionally needed when an ip address or FQDN is assigned to the wrong agent. This does not affect the NetBIOS name of the agent. Resolution for an agent is based on the following order: The ELM Server first checks to see what was last successful, this could be the agent name or the ip address. If resolution fails, it then checks the agent name. If that fails, it then checks the FQDN in the aliases list. If that fails, it then checks the IP address in the aliases list. This operation applies to Service Agents, Virtual Agents, and IP Virtual Agents.

140 140 ELM Help Agent Properties To view the properties of an Agent right click on the Agent name and select Properties. Description The description tab provides a note area for a system administrator to describe the system being monitored. Monitor Items The Monitor items tab displays all Monitors available to an Agent. The list of Monitor Items available is determined by the total population of Monitor Items created plus the licenses assigned to the Agent. Monitor items that are already assigned to agent are indicated by a check mark next to the Monitor item name. Categories The Categories tab displays all Agent Monitoring or Maintenance category groups currently assigned or available to the agent. A category may be assigned or unassigned by checking the box next to the category name. Agent Options The Agent Options tab displays the following information: Agent Service Settings
141 User Guide 141 Service Agent Logon Account This is the account used by the TNTAgent service for operations such as running scripts and batch files. The Default of "Local System Account" is used in most daily operations. Agent Status Displays a summary of monitor item actions being performed by the agent, such as event collection or agent heartbeat. Server Collection This is a list of ELM servers that the agent has been configured to send data. A server may be unregistered by right clicking on the server name and Licenses Shows the currently assigned licenses, and allows an administrator to change the licenses assigned to the Agent. Properties Name Identifies the Agent computer. The Name can be a NetBIOS computer name, DNS computer name, or TCP/IP address. Enabled To disable monitoring of the computer clear this checkbox. Description Enter a brief description and notes about the agent. Monitor Items Displays the Monitor Items assigned to the Agent. Monitor Items can be assigned directly to an Agent by checking the checkbox of Monitor Items on this list, or by assigning them to one of the Monitoring Categories to which the agent belongs. Right click to create or edit a Monitor Item. Categories Displays the Monitoring Categories assigned to the Agent. Click to select or deselect Monitoring Categories. Right click to create or edit a Monitoring Categories. Licenses Displays license types and the selected license for the agent.
142 ELM Help Monitoring Categories Monitoring categories group Agents for easy management and can be customized to your particular needs. ELM has many pre-configured Categories, and will import Categories found during an upgrade. Monitoring Categories are user configurable containers for organizing ELM Agents. Monitor Items are assigned to Categories which then assign them to any Agents in the Category. ELM has many pre-configured Categories, and will import Categories found during an upgrade. The default All Agents category has special significance to ELM and should not be altered. However the other pre-configured Categories, can be renamed, deleted, or otherwise altered. New Categories can be created as necessary. Agents can exist within multiple categories. For example, an Agent monitoring SQL Server 2008 could be in the following categories: Windows Servers Service Agents Database Servers Corporate Servers Monitor Items - Monitor Items determine the type of information or activity to monitor. Examples include Event Collector (which collects events), Service Monitor (which watches the state of Windows services), and Performance Collector (which gathers performance counter values) can be assigned to Monitoring Categories. Agents inherit the Monitors that are assigned to an Agent Category. Adding a Monitor to the Agent Category automatically assigns the monitor to each agent in the category. If the agent cannot run the Monitor, for example a Windows XP agent in a category with a Cluster Server monitor, nothing will happen. The agent will ignore the monitor and there is no adverse effect or additional Maintenance Categories Maintenance Categories group Agents for easy management during schedule maintenance periods such a Windows service pack installations. By utilizing the maintenance window you are able to schedule dates/times when notifications can be disabled automatically at regular intervals. To create a new Maintenance Category 1. Right click on the Maintenance Category container and select New Maintenance Category. The New Category Wizard will appear. Click Next to continue. 2. A list of Agents will appear. Select the Agent(s) you want in this category. Click Next to continue.

143 User Guide 143 Note You are not required to select any Agents. Maintenance Categories can be created and assigned to agents at any time. 3. The Maintenance Schedule will appear where you can specify the start date/time, duration and recurrence pattern. Once, Daily, Weekly or Monthly are available recurrence patterns. Click Next to continue. 4. The Item Name and Description dialog will appear. Enter the Name for the new Category, and an optional Description. Click Finish to create the maintenance category. You can also create a new category from the Monitoring Categories tab inside the properties of an Agent, or from the Categories tab inside the properties of a Monitor Item. To do this, rightclick anywhere in the tab dialog, select New Agent Category, and complete steps 2-5 above. Agents Tab In the properties of a Maintenance Category, the Agents tab will show all the configured Agents. Checkmarks appear next to Agents assigned to the Category. Maintenance Tab In the properties of a Maintenance Category, the Maintenance tab will show the current Maintenance schedule. Properties Tab This read-only tab displays the properties of the selected object and the values for those
144 144 ELM Help properties Viewing and Notifying The Viewing and Notifying container in ELM is where Filters, Views, and Notifications within ELM reside. Event Views, Security Views and Correlation Views organize the large amounts of event log information collected from systems into common groups based on matching criteria in the assigned filters. See More: Filters and Methods Library Filters and Methods Library The Filters and Methods Library within ELM contains Event Filters and Notification Methods which can be assigned to Event Views. Event Filters are common objects within ELM and can also be assigned to Event Collectors. See More: All Exclude Filters

145 User Guide 145 All Include Filters All Correlation Filters All Notification Methods All Exclude Filters Exclude Event Filters are common objects within ELM and can be assigned to Event Views, Security Views or Correlation Views to have specific events excluded from the View. In addition they can be assigned to Monitor items of type Event Collector to have events excluded from Agent collection. The Filter criteria entered by the user controls what events are excluded from collection and displaying. Name - Enter a unique name. Description - Enter a description (optional).
146 146 ELM Help Event Filter Criteria Event Filters provide a mechanism for isolating specific events, and multiple Event Filters can be combined to create a complex set of criteria. The same Filter can include or exclude events. They can also be created in the ELM Database Wizard to control database deleting or archiving, however these Filters will not be available in the Event Filter collections. The following fields are available for filtering purposes: Agent Category is Computer Name is Log Name is Username is Event Source is Event ID is Category is Message contains This dialog box has a dynamic menu behavior. The ellipsis buttons next to the Agent Category, Computer Name is, Log Name is, and Event Source is fields browse and display the agent category names, computer names, event log names and event sources. If the Computer Name is field is left empty, the list of event Logs and Sources is generated based on the event sources registered on the ELM Console computer (i.e., the local computer). If you enter a valid, resolvable name in the Computer Name is field and then click the ellipsis for the Log Name is or Event Source is fields, the list of event Logs and Sources from that system will be displayed. If the log or event source from which you want to collect data does not appear on the list, type it in the appropriate field. For example, if you are not running DNS on your ELM Server or Console, but want to collect events from the DNS log only, type DNS in the Log Name is field. If a field is blank, it will match every value in the field. For example, if the Computer Name is field is blank, the Filter will apply to all computers. If all Event Types are unchecked when the Event Filter is saved, all of the Event Types will be checked. This is by design. Leading and trailing wildcards ( * ) and character position wildcards (? ) are supported, as are the Boolean operators Or ( ), And ( & ), and Not (! ). However regular expressions are not supported. You may use these wildcards to specify the criteria to be applied. For example, to select messages from SQL Server you may specify *SQL* as the event source to select any Source name containing the letters SQL. To match SQL messages from servers ALPHA, BRAVO, or CHARLIE you would enter ALPHA BRAVO CHARLIE in the Computer Name is field.
147 User Guide 147 Important Leave no white space adjacent to the operators. Note If you enter the name of an untrusted system in the Computer Name is field and then use the ellipsis buttons for Log or Event Source, the menus will not be displayed. This is because authentication fails. To work around this problem, first make an IPC$ connection to the target system using alternate credentials. For example, if the untrusted system's name is dartagnan, you could use: NET USE \\SERVERA\IPC$ /user:dartagnan\administrator * You will be prompted for the password for the account you specify. The dynamic menu behavior will work after the IPC$ connection has been established. Views Shows the Views associated with this Exclude Event Filter. Select New to create or Properties to edit a highlighted View. Monitors Shows the Monitor Items of type Event Collector associated with this Event Filter using an Include relationship. Right click to create or edit an Event Collector. Properties Tab This read-only tab displays the properties of the selected object and the values for those properties.

148 148 ELM Help All Include Filters Include Event Filters are common objects within ELM and can be assigned to Event Views, Security Views or Correlation Views to display specific events. In addition they can be assigned to Event Collectors to collect specific events from Agents. The Filter criteria entered by the user controls what events are collected and displayed. Name - Enter a unique name. Description - Enter a description (optional). Event Filter Criteria Event Filters provide a mechanism for isolating specific events, and multiple Event Filters can be combined to create a complex set of criteria. The same Filter can include or exclude events. They can also be created in the ELM Database Wizard to control database deleting or archiving, however these Filters will not be available in the Event Filter collections. The following fields are available for filtering purposes:
149 User Guide 149 Agent Category is Computer Name is Log Name is Username is Event Source is Event ID is Category is Message contains This dialog box has a dynamic menu behavior. The ellipsis buttons next to the Agent Category, Computer Name is, Log Name is, and Event Source is fields browse and display the agent category names, computer names, event log names and event sources. If the Computer Name is field is left empty, the list of event Logs and Sources is generated based on the event sources registered on the ELM Console computer (i.e., the local computer). If you enter a valid, resolvable name in the Computer Name is field and then click the ellipsis for the Log Name is or Event Source is fields, the list of event Logs and Sources from that system will be displayed. If the log or event source from which you want to collect data does not appear on the list, type it in the appropriate field. For example, if you are not running DNS on your ELM Server or Console, but want to collect events from the DNS log only, type DNS in the Log Name is field. If a field is blank, it will match every value in the field. For example, if the Computer Name is field is blank, the Filter will apply to all computers. If all Event Types are unchecked when the Event Filter is saved, all of the Event Types will be checked. This is by design. Leading and trailing wildcards ( * ) and character position wildcards (? ) are supported, as are the Boolean operators Or ( ), And ( & ), and Not (! ). However regular expressions are not supported. You may use these wildcards to specify the criteria to be applied. For example, to select messages from SQL Server you may specify *SQL* as the event source to select any Source name containing the letters SQL. To match SQL messages from servers ALPHA, BRAVO, or CHARLIE you would enter ALPHA BRAVO CHARLIE in the Computer Name is field. Important Leave no white space adjacent to the operators. Note If you enter the name of an untrusted system in the Computer Name is field and then use the ellipsis buttons for Log or Event Source, the menus will not be displayed. This is because authentication fails. To work around this problem, first make an IPC$ connection to the target system using alternate credentials. For example, if the untrusted system's name is dartagnan, you could use: NET USE \\SERVERA\IPC$ /user:dartagnan\administrator * You will be prompted for the password for the account you specify. The dynamic menu behavior will work after the IPC$ connection has been established.
150 150 ELM Help Views Shows the Views associated with this Event Filter using an Include or Exclude relationship. Select New to create or Properties to edit a highlighted Event View. Monitors Shows the Monitor Items of type Event Collector associated with this Event Filter using an Include relationship. Right click to create or edit an Event Collector. Properties Tab This read-only tab displays the properties of the selected object and the values for those properties.

151 User Guide All Correlation Filters Correlation Filters ELM Correlation Filters are used only by ELM Correlation Views. These Filters are designed to watch for the ending event in a pair of correlated events. The Correlation Criteria can be hardcoded, or can use environment variables which resolve to values found in the Start events. In addition, the Message field can use regular expressions to allow sophisticated filtering patterns when watching for pairs of correlated events. Name Enter a unique name. Description Enter a description (optional). Correlation Filter Criteria Correlation Filters provide a mechanism for isolating specific events, and multiple Correlation Filters can be combined to create a complex set of criteria. The same Filter can include or exclude events.
152 152 ELM Help The following fields are available for filtering purposes: Agent Category is Computer Name is Log Name is Username is Event Source is Event ID is Category is Message contains This dialog box has a dynamic menu behavior. The ellipsis button next to the Agent Category, Computer Name, and Log Name fields browse and display the agent category names, computer names, and event log names. If the Computer Name field is left blank, the list of event Logs and Sources is generated based on the event sources registered on the ELM Console computer (i.e., the local computer). If you enter a valid, resolvable name in the Computer Name is field and then click the ellipsis button for the Log Name or Event Source fields, the list of event Logs and Sources from that system will be displayed. Environment Variables The percent button for most fields will put the matching environment variable in the field. This variable will use the value from the "start" event and look for a matching value in the "end" event.

153 User Guide 153 The Message field can use a variety of environment variables. Like the other fields, the environment variable takes the value from the "start" event and looks for that value in the "end" event. Additionally, it can use a custom regular expression match variable for advanced match criteria.

154 154 ELM Help The MATCH variable uses the ECMAScript grammar provided by TR1 Regular Expressions. Microsoft documentation can be found here: Inside the parentheses, the MATCH variable requires 3 parameters: 1. A regular expression to capture a string from the "start" event 2. Reuse of one or more strings to look for in the "end" event 3. True or false, require case sensitive matching For example: %MATCH("username: (.+)","\0","false")% This match pattern searches for a "start" event that contains "username" followed by a colon, a space, and oneor-more characters. The one-or-more characters pattern (period followed by a plus-sign) is inside parentheses, so these characters are captured. These captured characters are reused by the 2nd parameter via the \0 characters. So the "end" event must have the same username. The 3rd parameter (false) makes this match case in-sensitive.
155 User Guide 155 Another example: %MATCH("handle id:[:blank:]+([:w:]+)","handle id:[:blank:]+\0","false")% This match pattern searches for a "start" event that contains "handle id" followed by a colon, one-or-more blanks (spaces or tabs), and one-or-more alphanumerics. The one-or-more alphanumerics pattern (open square bracket, colon, w, colon, close square bracket) is inside parentheses, so these characters are captured. These captured characters are reused by the 2nd parameter via the \0 characters. So the "end" event must have "handle id" followed by a colon, one-or-more blanks, and the same handle id value as the "start" event. The 3rd parameter (false) makes this match case in-sensitive. A 3rd example: %MATCH("The (.*) service.* stopped","the \0 service.* running","false")% This match pattern searches for a "start" event that contains the letters "The" followed by a space. Then it captures everything upto a space followed by the letters "service" and followed by another space. Then anything, followed by a space, and followed by the letters "stopped". The end result is the name of the stopped service is captured. These captured characters are reused by the 2nd parameter via the \0 characters. Similar to the first parameter, the 2nd parameter looks for the service name followed by the word "running." The 3rd parameter (false) makes this match case in-sensitive. Note: Regular expressions are supported only in the custom MATCH variable in the Message Contains field. Leading and trailing wildcards ( * ) and character position wildcards (? ) are supported, as are the Boolean operators Or ( ), And ( & ), and Not (! ). You may use these wildcards to specify the criteria to be applied. For example, to select messages from SQL Server you may specify *SQL* as the event source to select any Source name containing the letters SQL. To match SQL messages from servers ALPHA, BRAVO, or CHARLIE you would enter ALPHA BRAVO CHARLIE in the Computer Name is field. Important Leave no white space adjacent to the operators. Note If you enter the name of an untrusted system in the Computer Name is field and then use the ellipsis buttons for Log or Event Source, the menus will not be displayed. This is because authentication fails. To work around this problem, first make an IPC$ connection to the target system using alternate credentials. For example, if the untrusted system's name is dartagnan, you could use: NET USE \\SERVERA\IPC$ /user:dartagnan\administrator * You will be prompted for the password for the account you specify. The dynamic menu behavior will work after the IPC$ connection has been established. Correlation Views
156 156 ELM Help See Correlation Views Properties Tab This read-only tab displays the properties of the selected object and the values for those properties All Notification Methods Notification methods are how administrators learn of events. To create a new Notification method, select the New Notification Method link when the All Notification Methods container in the ELM Console is selected under Results -> Event Views. Notification Methods are triggered by assigning them to an Event View, Security View or as a Match/Timeout notification in Correlation Views. You may run separate Notification Methods for different events using Event Filters. For example, one method might describe how to notify a database administrator about important database related events, while another method might notify a security administrator about important security related events. Notification Methods pass the full event information to the notification engine, which in turn forwards that information depending on the methods selected. If desired, the information sent via the Notification Method can be customized. This is useful when there are restrictions on message length, as in the case of a mobile pager. Customizable messages are a convenient way of making notifications more meaningful. To disable all of the Notification Methods at the same time, right click the All Notification Methods container and select Disable. This disables all of the notification methods at the container level and doesn't change the specific notification methods setting Desktop Notification Methods The list below describes the methods designed for use at the desktop computer. ELM Advisor Notification - Send event information to ELM Advisor clients. Mail Notification - Send event information to addresses. Server Notification Methods The list below describes the methods designed for use with a server or service. Command Script - Process event information using scripts and custom programs.
157 User Guide 157 Forward Event - Send event information to another ELM Server. Pager - Send event information to pagers. Post Web Form - Post event information to a web page. SNMP OID/Trap - Send event information to an SNMP management system or SNMP agent. Syslog Message - Send event information to a syslog server Command Script The Command Script Notification runs a script on the ELM Server. The script runs in the security context of the account under which the ELM Server is running. The script can be a batch command script, an executable or command line application, or a script. Event information is available to the command script through Environment Variables, allowing you to use information from the event, such as the computer name or the message details field in any batch files, scripts, or other programs. ELM supports the Windows Script Host (cscript.exe), command line (cmd.exe), or any executable, including custom-written programs. To use another type of script (e.g., a Perl script, or PowerShell), enter the name of the script engine in the Type field (e.g., perl.exe, or powershell.exe). Script Settings Script Name - Enter a name for the script. The name is used for information purposes only. Type - Select script engine processor executable filename. If the filename is in not the path of the account the ELM Server is running under, enter the full path to the executable file local to the ELM Server. If you are executing a VB Script, use cscript.exe. If you are executing a Perl script, enter perl.exe for Type. If you are using a custom program, enter the name of that executable file. Timeout - Enter a value for the script. If the script does not complete within the timeout period, it will be considered a failed notification. Script - Enter the text of the Script you want executed in this field. By default the field contains a sample script. The script text will be copied to a temporary file in the file system and then passed to the script engine as an argument on it's command line. Use the Test button to test the script. Caution When you click the Test button, the script will be executed. Threshold Thresholds determine how many times identical events can occur before the Notification Method will be executed, or stopped from executing. There are three threshold settings available:
158 158 ELM Help Disable this notification when it is triggered. If the Notification Method is triggered the configured number of times within the specified time period, the notifications will stop. The Notification Method is then re-enabled after a specified time period. Activate this notification method after it is triggered. When this threshold is selected, the notifications will not be processed unless the rule is triggered the specified number of times within the time period selected. Consolidate notifications by waiting until either: A specific number of similar events has occurred A specific amount of time has elapsed To disable this Notification Method for older data sent from a Service Agent, check the box that says Disable this notification method for all Cached (old) data. By default, 60 minutes is the window of time which differentiates old data from new data. If an event occurred within the last hour, even though it may be from a Service Agent cache file, ELM will not treat it as (old) cached data. This feature is designed to account for, and notify you of, events that occur during brief ELM Server outages (reboots, service restart, etc.). This window of time can be changed by setting the HKEY_LOCAL_MACHINE\SOFTWARE\TNT Software\ELM Enterprise Manager\6.7 \Settings\CacheDataTrigger value in the Registry on the ELM Server. Threshold Events Counter The threshold count increments only for identical events; that is, events that have the same four fields: Computer Name Source User Name Event ID For example, if you configure a Beep Notification Method with the Threshold set to Disable when triggered 2 times within 5 minutes, and re-enable after 30 minutes, and within a 5 minute period the following events are received triggering rules that use this Notification Method: Computer: SERVERA Source: Perflib Event ID: 1003 User Name: None Category: None Type: Warning Time Generated: 4/10/2011 1:34:58 PM Log: Application Message: Performance data cannot be collected. Computer: SERVERA Source: Perflib Event ID: 1003 User Name: None Category: None Type: Warning Time Generated: 4/10/2011 1:36:04 PM Log: Application Message: Performance data cannot be collected. Then because the four fields match, the events increment the count. Because two identical
159 User Guide 159 events occurred within the defined 5 minute period, the Notification Method will be disabled for additional matching events for 30 minutes, and automatically re-enabled thereafter. While the Notification Method is disabled for one group of events, it will send notifications for other (nonmatching) events unless they also reach the threshold. The threshold count would not be incremented if the second event looked like this: Computer: SERVERB Source: Perflib Event ID: 1003 User Name: None Category: None Type: Warning Time Generated: 4/10/2011 1:34:58 PM Log: Application Message: Performance data cannot be collected. Because the Computer name is different in the above event, it is not considered an identical event, and therefore does not increment the threshold count for the first event (and thus does not disable the Notification Method). Scheduled Hours The Schedule setting for this Notification. The Schedule allows you to control when the Notification is run. Select the times that this Notification is active. By default, the schedule is set to ON for all hours and all days. Mouse clicks toggle each time period ON and OFF. Clicking on an individual square will toggle the active schedule for that hour. Clicking on an hour at the top of the grid, or on a day of the week at the left of the grid will toggle the entire column or row. Keyboard equivalents are the arrow keys and the space bar. Properties Tab This read-only tab displays the properties of the selected object and the values for those properties Forw ard Event The Forward Event Notification sends event information from one ELM Server (the sending server) to another ELM Server (the receiving server). Use this notification to link one or more ELM Servers. Forwarding events to an upstream ELM Server allows you to create a tiered monitoring system, an industry standard for monitoring multiple locations. Forward Event also has a caching mechanism. If the sending ELM Server cannot deliver the notification, it will cache it and attempt to resend after a few minutes. Names - This is the list of receiving ELM Servers. TCP Port - The port on which the receiving ELM Server is listening. By default, ELM Servers listen on port Set this value before adding a receiving ELM Server name to the list. Add - Click the Add button to add a server. The Select Computer dialog box will appear. You may enter the server name in the Computer Name field or browse the network and select the server. Click OK to add the server. Repeat this step for each server you wish to add. Remove - Select an ELM Server in the Names list and click the Remove button to delete it from the list.
160 160 ELM Help Remove All - You may use the Remove All button to remove all ELM Servers from the Names list. Click the Test button to test the notification. A test message will appear in the Events view of the receiving ELM Server with the name of the sending ELM Server. Note The receiving ELM Server must have the IP address of the sending ELM Server before it will accept forwarded notifications. The IP address is entered in the ELM Control Panel applet, on the Forwarded Events tab, of the receiving ELM Server. Threshold Thresholds determine how many times identical events can occur before the Notification Method will be executed, or stopped from executing. There are three threshold settings available: Disable this notification when it is triggered. If the Notification Method is triggered the configured number of times within the specified time period, the notifications will stop. The Notification Method is then re-enabled after a specified time period. Activate this notification method after it is triggered. When this threshold is selected, the notifications will not be processed unless the rule is triggered the specified number of times within the time period selected. Consolidate notifications by waiting until either: A specific number of similar events has occurred A specific amount of time has elapsed To disable this Notification Method for older data sent from a Service Agent, check the box that says Disable this notification method for all Cached (old) data. By default, 60 minutes is the window of time which differentiates old data from new data. If an event occurred within the last hour, even though it may be from a Service Agent cache file, ELM will not treat it as (old) cached data. This feature is designed to account for, and notify you of, events that occur during brief ELM Server outages (reboots, service restart, etc.). This window of time can be changed by setting the HKEY_LOCAL_MACHINE\SOFTWARE\TNT Software\ELM Enterprise Manager\6.7 \Settings\CacheDataTrigger value in the Registry on the ELM Server. Threshold Events Counter The threshold count increments only for identical events; that is, events that have the same four fields: Computer Name Source User Name Event ID For example, if you configure a Beep Notification Method with the Threshold set to Disable when triggered 2 times within 5 minutes, and re-enable after 30 minutes, and within a 5 minute period the following events are received triggering rules that use this Notification Method: Computer: SERVERA Source: Perflib Event ID: 1003 User Name: None
161 User Guide 161 Category: None Type: Warning Time Generated: 4/10/2011 1:34:58 PM Log: Application Message: Performance data cannot be collected. Computer: SERVERA Source: Perflib Event ID: 1003 User Name: None Category: None Type: Warning Time Generated: 4/10/2011 1:36:04 PM Log: Application Message: Performance data cannot be collected. Then because the four fields match, the events increment the count. Because two identical events occurred within the defined 5 minute period, the Notification Method will be disabled for additional matching events for 30 minutes, and automatically re-enabled thereafter. While the Notification Method is disabled for one group of events, it will send notifications for other (nonmatching) events unless they also reach the threshold. The threshold count would not be incremented if the second event looked like this: Computer: SERVERB Source: Perflib Event ID: 1003 User Name: None Category: None Type: Warning Time Generated: 4/10/2011 1:34:58 PM Log: Application Message: Performance data cannot be collected. Because the Computer name is different in the above event, it is not considered an identical event, and therefore does not increment the threshold count for the first event (and thus does not disable the Notification Method). Scheduled Hours The Schedule setting for this Notification. The Schedule allows you to control when the Notification is run. Select the times that this Notification is active. By default, the schedule is set to ON for all hours and all days. Mouse clicks toggle each time period ON and OFF. Clicking on an individual square will toggle the active schedule for that hour. Clicking on an hour at the top of the grid, or on a day of the week at the left of the grid will toggle the entire column or row. Keyboard equivalents are the arrow keys and the space bar. Properties Tab This read-only tab displays the properties of the selected object and the values for those properties.
162 162 ELM Help Pager If a modem is attached to the ELM Server computer, ELM can send Pager Notifications using 2 main approaches: Pager (Numeric) Pager (Alpha-Numeric) The Numeric Pager Notification sends a numeric message to a pager. Message Numeric Message - Enter the numeric message or code to be sent to the pager. Click the Test button to verify that your pager receives the intended message. Account Numbers Use the list provided to add or remove recipients using the same pager service. Name - Enter the Name of the person to add to the list Pager Account Number - Enter the telephone number for this person's pager. Add account number to list - Click this button to add the person to the list Remove Account - Select a name from the list and click this button to remove the selected name. Connection Settings Number of Retries - Enter the number of times to retry if the pager service is busy. Pager Script - Select a script for your pager service. Use the Edit, Copy, and New buttons to create or edit Pager Script Settings. The Pager Notification includes many pre-defined Pager Scripts to be used as-is, or to be modified for your specific pager and pager service. To use a Pager Notification, a properly configured modem must be attached to the ELM Server computer and be available to the ELM Server application. Pager Script The Pager Notification includes many pre-defined Pager Scripts to be used as-is, or to be modified for your specific pager and pager service. To use a Pager Notification, a properly configured modem must be attached to the ELM Server computer and be available to the ELM Server application. Pager Notification uses a script to define the communication protocol. Scripts are provided for Numeric, Alpha-Numeric, and SMS messaging. If the telecom service provider requires a variation of one of these protocols, the script allows you to customize communication in order to adapt to the protocol of your service provider.
163 User Guide 163 Note For SMS messaging, the ELM Server will need a GSM/GPRS enabled modem connected to the computer hosting the ELM Server. To customize the pager script settings, open the Pager Notification properties, go to the Connection Settings dialog, select the Pager Script you wish to modify, then click the Edit button. Note It is best to make a backup copy of the current script before changing it. This will enable you to revert back to the original script if necessary. Threshold Thresholds determine how many times identical events can occur before the Notification Method will be executed, or stopped from executing. There are three threshold settings available: Disable this notification when it is triggered. If the Notification Method is triggered the configured number of times within the specified time period, the notifications will stop. The Notification Method is then re-enabled after a specified time period. Activate this notification method after it is triggered. When this threshold is selected, the notifications will not be processed unless the rule is triggered the specified number of times within the time period selected. Consolidate notifications by waiting until either: A specific number of similar events has occurred A specific amount of time has elapsed To disable this Notification Method for older data sent from a Service Agent, check the box that says Disable this notification method for all Cached (old) data. By default, 60 minutes is the window of time which differentiates old data from new data. If an event occurred within the last hour, even though it may be from a Service Agent cache file, ELM will not treat it as (old) cached data. This feature is designed to account for, and notify you of, events that occur during brief ELM Server outages (reboots, service restart, etc.). This window of time can be changed by setting the HKEY_LOCAL_MACHINE\SOFTWARE\TNT Software\ELM Enterprise Manager\6.7 \Settings\CacheDataTrigger value in the Registry on the ELM Server. Threshold Events Counter The threshold count increments only for identical events; that is, events that have the same four fields: Computer Name Source User Name Event ID For example, if you configure a Beep Notification Method with the Threshold set to Disable when triggered 2 times within 5 minutes, and re-enable after 30 minutes, and within a 5 minute period the following events are received triggering rules that use this Notification Method: Computer: SERVERA Source: Perflib
164 164 ELM Help Event ID: 1003 User Name: None Category: None Type: Warning Time Generated: 4/10/2011 1:34:58 PM Log: Application Message: Performance data cannot be collected. Computer: SERVERA Source: Perflib Event ID: 1003 User Name: None Category: None Type: Warning Time Generated: 4/10/2011 1:36:04 PM Log: Application Message: Performance data cannot be collected. Then because the four fields match, the events increment the count. Because two identical events occurred within the defined 5 minute period, the Notification Method will be disabled for additional matching events for 30 minutes, and automatically re-enabled thereafter. While the Notification Method is disabled for one group of events, it will send notifications for other (nonmatching) events unless they also reach the threshold. The threshold count would not be incremented if the second event looked like this: Computer: SERVERB Source: Perflib Event ID: 1003 User Name: None Category: None Type: Warning Time Generated: 4/10/2011 1:34:58 PM Log: Application Message: Performance data cannot be collected. Because the Computer name is different in the above event, it is not considered an identical event, and therefore does not increment the threshold count for the first event (and thus does not disable the Notification Method). Scheduled Hours The Schedule setting for this Notification. The Schedule allows you to control when the Notification is run. Select the times that this Notification is active. By default, the schedule is set to ON for all hours and all days. Mouse clicks toggle each time period ON and OFF. Clicking on an individual square will toggle the active schedule for that hour. Clicking on an hour at the top of the grid, or on a day of the week at the left of the grid will toggle the entire column or row. Keyboard equivalents are the arrow keys and the space bar. Properties Tab This read-only tab displays the properties of the selected object and the values for those
165 User Guide 165 properties. The Alphanumeric Pager Notification sends event information to an alpha numeric pager. Access Number Pager Server Access Number - Enter the telephone number for your pager service. Enter a comma to cause a 3 second delay. If you must dial a number for an outside line, or for a long distance number, add the appropriate leading characters to this string. For example, if you must dial 9 for an outside line and your pager service is a number, you should enter 9,1800nnnnnnn. Message - Enter the message to be transmitted to your pager. Use the Insert Variable button to insert Environment Variables into the message text. Use the Test button to test the notification method. Account Numbers Add or remove recipients using the same pager service. Name - Name of the person to be added to the list Pager Account Number - PIN (pager account number) for this person's pager. Add - Add the person to the list Remove - Select a name from the list and click the Remove Account button to remove it. Connection Settings Number of Retries - Enter the number of times to retry if the pager service is busy. Pager Script - Select a script for your pager service. Use the Edit, Copy, and New buttons to create or edit Pager Script Settings. Pager Script The Pager Notification includes many pre-defined Pager Scripts to be used as-is, or to be modified for your specific pager and pager service. To use a Pager Notification, a properly configured modem must be attached to the ELM Server computer and be available to the ELM Server application. Pager Notification uses a script to define the communication protocol. Scripts are provided for Numeric, Alpha-Numeric, and SMS messaging. If the telecom service provider requires a variation of one of these protocols, the script allows you to customize communication in order to adapt to the protocol of your service provider. Note For SMS messaging, the ELM Server will need a GSM/GPRS enabled modem connected to the computer hosting the ELM Server. To customize the pager script settings, open the Pager Notification properties, go to the Connection Settings dialog, select the Pager Script you wish to modify, then click the Edit button.
166 166 ELM Help Note It is best to make a backup copy of the current script before changing it. This will enable you to revert back to the original script if necessary Post Web Form The Post Web Form notification method posts messages to an Intranet or Internet web site. Web Form Settings Web Form URL- Enter the fully qualified URL for the form to be used for posting. Press <SHIFT>-<Tab> to retrieve this URL before filling out the form. Complete the form from the web page as you wish it to appear. Click the Copy Variable to Clipboard button to display a list of Environment Variables. Select a variable from the list, position the cursor to the form where the variable is to be used, and paste it into a field within the form. When the Web form is completed, click the Test button to test it and see the results at the web server. Web Options If the Web server to which you are posting requires authentication, you may enter credentials using the Web Options dialog. Use Logon Credentials - Enable (check) this option if the URL requires authentication. Username - Enter the username for authentication. Password - Enter the password for the username entered. Keywords - Enter a list of keywords or phrases, separated by semi-colon (;). Because web servers may not return an error code if the post does not succeed, ELM inspects the returned HTML for keywords and phrases to determine the success of the web post. Success - Select this option if the keywords specify a success. All keywords and phrases must be found on the page to determine it was a success. Failure - Select this option if the keywords specify a failure. Any of the keywords and phrases will cause the page to be identified as a failure. Note When using the Web Post Notification, the results depend primarily on the resulting Web page that is sent back after the posting page has been submitted. To guard against false positives or false negatives, enter Success and/or Failure Keywords that appear on the Success or Failure results page. The resulting Web page will then be searched for the keywords to determine whether or not the Web Post Notification Method was successful. Threshold Thresholds determine how many times identical events can occur before the Notification Method
167 User Guide 167 will be executed, or stopped from executing. There are three threshold settings available: Disable this notification when it is triggered. If the Notification Method is triggered the configured number of times within the specified time period, the notifications will stop. The Notification Method is then re-enabled after a specified time period. Activate this notification method after it is triggered. When this threshold is selected, the notifications will not be processed unless the rule is triggered the specified number of times within the time period selected. Consolidate notifications by waiting until either: A specific number of similar events has occurred A specific amount of time has elapsed To disable this Notification Method for older data sent from a Service Agent, check the box that says Disable this notification method for all Cached (old) data. By default, 60 minutes is the window of time which differentiates old data from new data. If an event occurred within the last hour, even though it may be from a Service Agent cache file, ELM will not treat it as (old) cached data. This feature is designed to account for, and notify you of, events that occur during brief ELM Server outages (reboots, service restart, etc.). This window of time can be changed by setting the HKEY_LOCAL_MACHINE\SOFTWARE\TNT Software\ELM Enterprise Manager\6.7 \Settings\CacheDataTrigger value in the Registry on the ELM Server. Threshold Events Counter The threshold count increments only for identical events; that is, events that have the same four fields: Computer Name Source User Name Event ID For example, if you configure a Beep Notification Method with the Threshold set to Disable when triggered 2 times within 5 minutes, and re-enable after 30 minutes, and within a 5 minute period the following events are received triggering rules that use this Notification Method: Computer: SERVERA Source: Perflib Event ID: 1003 User Name: None Category: None Type: Warning Time Generated: 4/10/2011 1:34:58 PM Log: Application Message: Performance data cannot be collected. Computer: SERVERA Source: Perflib Event ID: 1003 User Name: None Category: None Type: Warning Time Generated: 4/10/2011 1:36:04 PM Log: Application Message: Performance data cannot be collected.
168 168 ELM Help Then because the four fields match, the events increment the count. Because two identical events occurred within the defined 5 minute period, the Notification Method will be disabled for additional matching events for 30 minutes, and automatically re-enabled thereafter. While the Notification Method is disabled for one group of events, it will send notifications for other (nonmatching) events unless they also reach the threshold. The threshold count would not be incremented if the second event looked like this: Computer: SERVERB Source: Perflib Event ID: 1003 User Name: None Category: None Type: Warning Time Generated: 4/10/2011 1:34:58 PM Log: Application Message: Performance data cannot be collected. Because the Computer name is different in the above event, it is not considered an identical event, and therefore does not increment the threshold count for the first event (and thus does not disable the Notification Method). Scheduled Hours The Schedule setting for this Notification. The Schedule allows you to control when the Notification is run. Select the times that this Notification is active. By default, the schedule is set to ON for all hours and all days. Mouse clicks toggle each time period ON and OFF. Clicking on an individual square will toggle the active schedule for that hour. Clicking on an hour at the top of the grid, or on a day of the week at the left of the grid will toggle the entire column or row. Keyboard equivalents are the arrow keys and the space bar. Properties Tab This read-only tab displays the properties of the selected object and the values for those properties SNMP OID/Trap SNMP is the delivery method for the SNMP Notification. SNMP Notification provides two methods. 1. SNMP OID Notification PUTs a value to an SNMP management object in the SNMP management information base of the local computer or a remote computer 2. The SNMP Trap Notification generates an SNMP Trap using the existing SNMP management system. SNMP OID The SNMP OID Notification will set a value in a target SNMP Object Identifier (OID). Object Identifier - Enter the numeric OID that will be set. To browse OIDs, click the Select OID button. Type - Select the data type to set. Value - Define the value to set.
169 User Guide 169 Host - Enter the computer or device where the OID value should be set. Community - Enter the SNMP community name used by the device to be updated. Retries - The number of attempts to make at setting the OID value. Time Out - The amount of time the attempt should try to set the value. Click the Test button to test the settings. SNMP Trap The SNMP Trap Notification sends event information as an SNMP Trap to an SNMP management system. An ELM MIB is provided in the MibFiles folder under the ELM Server installation folder. It is used by the SNMP management system to translate the SNMP Trap. In order to use the SNMP Trap Notification Method, you must have the Windows SNMP and SNMP Trap services installed on your ELM Server. The SNMP service is also used to configure trap destinations. See properties of the SNMP service in Service Control Manager. Use Event ID as Trap ID - Check this box for the event ID to be used as the trap ID. Trap ID - If the event ID is not used as the trap ID, enter the ID number you want for the trap in this field. Enterprise ID - Enter an enterprise ID for the trap message. Important When running the ELM Server on Windows XP Professional, you must be running Windows XP Service Pack 1 or later. Click the Test button to test the trap generation and settings. Threshold Thresholds determine how many times identical events can occur before the Notification Method will be executed, or stopped from executing. There are three threshold settings available: Disable this notification when it is triggered. If the Notification Method is triggered the configured number of times within the specified time period, the notifications will stop. The Notification Method is then re-enabled after a specified time period. Activate this notification method after it is triggered. When this threshold is selected, the notifications will not be processed unless the rule is triggered the specified number of times within the time period selected. Consolidate notifications by waiting until either: A specific number of similar events has occurred A specific amount of time has elapsed To disable this Notification Method for older data sent from a Service Agent, check the box that says Disable this notification method for all Cached (old) data. By default, 60 minutes is the window of time which differentiates old data from new data. If an event occurred within the last hour, even though it may be from a Service Agent cache file, ELM will not treat it as (old) cached data. This feature is designed to account for, and notify you of, events that occur during brief ELM Server outages (reboots, service restart, etc.). This window of time can be changed by setting the HKEY_LOCAL_MACHINE\SOFTWARE\TNT Software\ELM Enterprise Manager\6.7 \Settings\CacheDataTrigger value in the Registry on the ELM Server. Threshold Events Counter
170 170 ELM Help The threshold count increments only for identical events; that is, events that have the same four fields: Computer Name Source User Name Event ID For example, if you configure a Beep Notification Method with the Threshold set to Disable when triggered 2 times within 5 minutes, and re-enable after 30 minutes, and within a 5 minute period the following events are received triggering rules that use this Notification Method: Computer: SERVERA Source: Perflib Event ID: 1003 User Name: None Category: None Type: Warning Time Generated: 4/10/2011 1:34:58 PM Log: Application Message: Performance data cannot be collected. Computer: SERVERA Source: Perflib Event ID: 1003 User Name: None Category: None Type: Warning Time Generated: 4/10/2011 1:36:04 PM Log: Application Message: Performance data cannot be collected. Then because the four fields match, the events increment the count. Because two identical events occurred within the defined 5 minute period, the Notification Method will be disabled for additional matching events for 30 minutes, and automatically re-enabled thereafter. While the Notification Method is disabled for one group of events, it will send notifications for other (nonmatching) events unless they also reach the threshold. The threshold count would not be incremented if the second event looked like this: Computer: SERVERB Source: Perflib Event ID: 1003 User Name: None Category: None Type: Warning Time Generated: 4/10/2011 1:34:58 PM Log: Application Message: Performance data cannot be collected. Because the Computer name is different in the above event, it is not considered an identical event, and therefore does not increment the threshold count for the first event (and thus does not disable the Notification Method). Scheduled Hours
171 User Guide 171 The Schedule setting for this Notification. The Schedule allows you to control when the Notification is run. Select the times that this Notification is active. By default, the schedule is set to ON for all hours and all days. Mouse clicks toggle each time period ON and OFF. Clicking on an individual square will toggle the active schedule for that hour. Clicking on an hour at the top of the grid, or on a day of the week at the left of the grid will toggle the entire column or row. Keyboard equivalents are the arrow keys and the space bar. Properties Tab This read-only tab displays the properties of the selected object and the values for those properties Syslog Message The Syslog notification sends event information to a syslog server. Syslog Server Settings Syslog Server Host Name - Enter the host name, IP address or fully-qualified domain name of the syslog server. Port - Select the port on which the syslog server is listening. By default this is UDP port 514 or TCP port 601 Sockets Type - Select the protocol the syslog server is using (TCP or UDP). Syslog Message Message - Enter the text you want displayed in the message portion of the Syslog event. Event information is available to the command script through the Environment Variables, enabling you to use information from the event, such as the computer name or the message details field in any batch files, scripts, or other programs. Click the Test button to test the notification. Threshold Thresholds determine how many times identical events can occur before the Notification Method will be executed, or stopped from executing. There are three threshold settings available: Disable this notification when it is triggered. If the Notification Method is triggered the configured number of times within the specified time period, the notifications will stop. The Notification Method is then re-enabled after a specified time period. Activate this notification method after it is triggered. When this threshold is selected, the notifications will not be processed unless the rule is triggered the specified number of times within the time period selected. Consolidate notifications by waiting until either: A specific number of similar events has occurred A specific amount of time has elapsed To disable this Notification Method for older data sent from a Service Agent, check the box that says Disable this notification method for all Cached (old) data. By default, 60 minutes is the window of time which differentiates old data from new data. If an event occurred within the last
172 172 ELM Help hour, even though it may be from a Service Agent cache file, ELM will not treat it as (old) cached data. This feature is designed to account for, and notify you of, events that occur during brief ELM Server outages (reboots, service restart, etc.). This window of time can be changed by setting the HKEY_LOCAL_MACHINE\SOFTWARE\TNT Software\ELM Enterprise Manager\6.7 \Settings\CacheDataTrigger value in the Registry on the ELM Server. Threshold Events Counter The threshold count increments only for identical events; that is, events that have the same four fields: Computer Name Source User Name Event ID For example, if you configure a Beep Notification Method with the Threshold set to Disable when triggered 2 times within 5 minutes, and re-enable after 30 minutes, and within a 5 minute period the following events are received triggering rules that use this Notification Method: Computer: SERVERA Source: Perflib Event ID: 1003 User Name: None Category: None Type: Warning Time Generated: 4/10/2011 1:34:58 PM Log: Application Message: Performance data cannot be collected. Computer: SERVERA Source: Perflib Event ID: 1003 User Name: None Category: None Type: Warning Time Generated: 4/10/2011 1:36:04 PM Log: Application Message: Performance data cannot be collected. Then because the four fields match, the events increment the count. Because two identical events occurred within the defined 5 minute period, the Notification Method will be disabled for additional matching events for 30 minutes, and automatically re-enabled thereafter. While the Notification Method is disabled for one group of events, it will send notifications for other (nonmatching) events unless they also reach the threshold. The threshold count would not be incremented if the second event looked like this: Computer: SERVERB Source: Perflib Event ID: 1003 User Name: None Category: None Type: Warning Time Generated: 4/10/2011 1:34:58 PM
173 User Guide 173 Log: Application Message: Performance data cannot be collected. Because the Computer name is different in the above event, it is not considered an identical event, and therefore does not increment the threshold count for the first event (and thus does not disable the Notification Method). Scheduled Hours The Schedule setting for this Notification. The Schedule allows you to control when the Notification is run. Select the times that this Notification is active. By default, the schedule is set to ON for all hours and all days. Mouse clicks toggle each time period ON and OFF. Clicking on an individual square will toggle the active schedule for that hour. Clicking on an hour at the top of the grid, or on a day of the week at the left of the grid will toggle the entire column or row. Keyboard equivalents are the arrow keys and the space bar. Properties Tab This read-only tab displays the properties of the selected object and the values for those properties.
174 174 ELM Help Mail Notification (SMTP) The Mail Notification sends event information in a mail message using the SMTP protocol. Name - Enter a unique name. Description - Enter a description (optional). Enabled - The item can be enabled (checked) or disabled (unchecked). When disabled it is not active. SMTP Host Tab SMTP Server - Enter the name or IP address of your SMTP Server. From - When using SMTP servers that have been configured to disallow relaying, you must use the From field. Using ELM@yourdomain.com, where yourdomain.com is a domain that is served by the SMTP server should be sufficient. Mail Message To - Enter the address for the recipient(s). Multiple addresses must be separated by semi-colons (;). Subject - Enter the subject of the message. You may use the Insert Variable button to insert Environment Variables to be substituted when the notification is sent. Message - Enter the message to send. You can use the Insert Variable button to insert Environment Variables to be substituted when the notification is sent. Click the Test button to test the settings and notification. Event Views Tab Lists the Event Views that the SMTP Notification Method is assigned to. Select the New link to add an Event View. Highlight an Event View and select Properties to modify the Event View. Mail Message Options Tab Max Message - Specify a maximum message size. By default, the message size is limited to 1,024 characters. Setting a lower value may be necessary for those clients/devices (e.g., cell phone, etc.) that have limited viewing size. The message is truncated at the maximum size limit. Compress White Space - When this box is checked, all white space (CR/LF) is removed from the message before transmission. This removes line breaks in the message and reduces message size. Threshold Thresholds determine how many times identical events can occur before the Notification Method will be executed, or stopped from executing. There are three threshold settings available: Disable this notification when it is triggered. If the Notification Method is triggered the configured number of times within the specified time period, the notifications will stop. The Notification Method is then re-enabled after a specified time period. Activate this notification method after it is triggered. When this threshold is selected, the notifications will not be processed unless the rule is triggered the specified number of times within the time period selected. Consolidate notifications by waiting until either: A specific number of similar events has occurred
175 User Guide 175 A specific amount of time has elapsed To disable this Notification Method for older data sent from a Service Agent, check the box that says Disable this notification method for all Cached (old) data. By default, 60 minutes is the window of time which differentiates old data from new data. If an event occurred within the last hour, even though it may be from a Service Agent cache file, ELM will not treat it as (old) cached data. This feature is designed to account for, and notify you of, events that occur during brief ELM Server outages (reboots, service restart, etc.). This window of time can be changed by setting the HKEY_LOCAL_MACHINE\SOFTWARE\TNT Software\ELM Enterprise Manager\6.7 \Settings\CacheDataTrigger value in the Registry on the ELM Server. Threshold Events Counter The threshold count increments only for identical events; that is, events that have the same four fields: Computer Name Source User Name Event ID For example, if you configure a Beep Notification Method with the Threshold set to Disable when triggered 2 times within 5 minutes, and re-enable after 30 minutes, and within a 5 minute period the following events are received triggering rules that use this Notification Method: Computer: SERVERA Source: Perflib Event ID: 1003 User Name: None Category: None Type: Warning Time Generated: 4/10/2011 1:34:58 PM Log: Application Message: Performance data cannot be collected. Computer: SERVERA Source: Perflib Event ID: 1003 User Name: None Category: None Type: Warning Time Generated: 4/10/2011 1:36:04 PM Log: Application Message: Performance data cannot be collected. Then because the four fields match, the events increment the count. Because two identical events occurred within the defined 5 minute period, the Notification Method will be disabled for additional matching events for 30 minutes, and automatically re-enabled thereafter. While the Notification Method is disabled for one group of events, it will send notifications for other (nonmatching) events unless they also reach the threshold. The threshold count would not be incremented if the second event looked like this: Computer: SERVERB Source: Perflib Event ID: 1003
176 176 ELM Help User Name: None Category: None Type: Warning Time Generated: 4/10/2011 1:34:58 PM Log: Application Message: Performance data cannot be collected. Because the Computer name is different in the above event, it is not considered an identical event, and therefore does not increment the threshold count for the first event (and thus does not disable the Notification Method). Scheduled Hours The Schedule setting for this Notification. The Schedule allows you to control when the Notification is run. Select the times that this Notification is active. By default, the schedule is set to ON for all hours and all days. Mouse clicks toggle each time period ON and OFF. Clicking on an individual square will toggle the active schedule for that hour. Clicking on an hour at the top of the grid, or on a day of the week at the left of the grid will toggle the entire column or row. Keyboard equivalents are the arrow keys and the space bar. Properties Tab This read-only tab displays the properties of the selected object and the values for those properties ELM Advisor Notification The ELM Advisor Notification sends event information to desktop computers that are running the ELM Advisor client. ELM Advisor provides the user with an instant notification that does not disrupt work flow. The ELM Advisor desktop tool is a feature that is selected during setup or can be installed separately. ELM Advisor All connected ELM Advisor users - Enable (check) this option to send the event information to all ELM Advisor users who are currently connected. Users must have read access to the ELM Server to connect. Users - Enter a list of the Usernames who will be using the ELM Advisor desktop utility. This option is disabled if All connected ELM Advisor users is enabled. Browse - Click the Browse button to select users from a list of domain accounts. Add - Click the Add button to add the user to the list. Remove - Click the Remove button to remove selected users from the list. Message - Enter a message to be sent to currently connected users. You may use the Insert Variable button to insert Environment Variables that will be populated when the notification is created.
177 User Guide 177 Note ELM Advisor is closely associated with a single desktop session (i.e. logged on user). So if a user is not logged on, then ELM Advisor Notifications will not be received by the ELM Advisor Taskbar Tool. Also, if the same username has multiple simultaneous desktops, for example multiple remote desktop sessions, then deleting Notification Messages, or marking them as read, will not be reflected in the ELM Advisor UI in other desktop sessions. Threshold Thresholds determine how many times identical events can occur before the Notification Method will be executed, or stopped from executing. There are three threshold settings available: Disable this notification when it is triggered. If the Notification Method is triggered the configured number of times within the specified time period, the notifications will stop. The Notification Method is then re-enabled after a specified time period. Activate this notification method after it is triggered. When this threshold is selected, the notifications will not be processed unless the rule is triggered the specified number of times within the time period selected. Consolidate notifications by waiting until either: A specific number of similar events has occurred A specific amount of time has elapsed To disable this Notification Method for older data sent from a Service Agent, check the box that says Disable this notification method for all Cached (old) data. By default, 60 minutes is the window of time which differentiates old data from new data. If an event occurred within the last hour, even though it may be from a Service Agent cache file, ELM will not treat it as (old) cached data. This feature is designed to account for, and notify you of, events that occur during brief ELM Server outages (reboots, service restart, etc.). This window of time can be changed by setting the HKEY_LOCAL_MACHINE\SOFTWARE\TNT Software\ELM Enterprise Manager\6.7 \Settings\CacheDataTrigger value in the Registry on the ELM Server. Threshold Events Counter The threshold count increments only for identical events; that is, events that have the same four fields: Computer Name Source User Name Event ID For example, if you configure a Beep Notification Method with the Threshold set to Disable when triggered 2 times within 5 minutes, and re-enable after 30 minutes, and within a 5 minute period the following events are received triggering rules that use this Notification Method: Computer: SERVERA Source: Perflib Event ID: 1003 User Name: None Category: None Type: Warning Time
178 178 ELM Help Generated: 4/10/2011 1:34:58 PM Log: Application Message: Performance data cannot be collected. Computer: SERVERA Source: Perflib Event ID: 1003 User Name: None Category: None Type: Warning Time Generated: 4/10/2011 1:36:04 PM Log: Application Message: Performance data cannot be collected. Then because the four fields match, the events increment the count. Because two identical events occurred within the defined 5 minute period, the Notification Method will be disabled for additional matching events for 30 minutes, and automatically re-enabled thereafter. While the Notification Method is disabled for one group of events, it will send notifications for other (nonmatching) events unless they also reach the threshold. The threshold count would not be incremented if the second event looked like this: Computer: SERVERB Source: Perflib Event ID: 1003 User Name: None Category: None Type: Warning Time Generated: 4/10/2011 1:34:58 PM Log: Application Message: Performance data cannot be collected. Because the Computer name is different in the above event, it is not considered an identical event, and therefore does not increment the threshold count for the first event (and thus does not disable the Notification Method). Scheduled Hours The Schedule setting for this Notification. The Schedule allows you to control when the Notification is run. Select the times that this Notification is active. By default, the schedule is set to ON for all hours and all days. Mouse clicks toggle each time period ON and OFF. Clicking on an individual square will toggle the active schedule for that hour. Clicking on an hour at the top of the grid, or on a day of the week at the left of the grid will toggle the entire column or row. Keyboard equivalents are the arrow keys and the space bar. Properties Tab This read-only tab displays the properties of the selected object and the values for those properties.
179 User Guide Event Views Administrators can quickly diagnose problems by using Event Views to organize large amounts of event log information. Event Views allow you to group events that match Include and/or Exclude Filters with the options to notify or report based on that Event View. Open an Event View to see new events as they occur plus events that may be present from past database queries (view refreshes). The first time an Event View is opened, a database query will be run if the Event View is empty. Otherwise, database queries are run only when a view is manually refreshed or when the properties of the view are modified. When an Event View is refreshed or an Event View's properties are modified, a database query is run and events from the database, as well as those streaming in, will be displayed. Records in Event Views are generically referred to as "Events." Events originate from several sources: Event log entries collected from Windows-based systems. Syslog messages received from Syslog clients. SNMP Traps received from SNMP-capable systems and devices. ELM Server generated Events. An Event View has two display modes: Detail Event View mode (default) which shows each event on a single line in the Event View. Summary Event View mode displays a summary roll-up (i.e., count of events). This Event View display mode is very useful to determine the busiest events across multiple systems by sorting on the Count column heading. ELM comes pre configured with a variety of Event Views and are sorted into logical groupings. Event Views beginning with All represent general events grouped by type or protocol. Names can be modified for the requirements of a specific environment. Notifications When the Notification Method is applied to the Event View, the events that are displayed are what you will get notified on.

180 180 ELM Help Pausing Event Views On busy servers, thousands of events can stream into the Event View making it difficult to read a specific event. Pause the Event View to get more detail on the event or to exclude the event from the Event View. Excluding Events Select the event that you want to exclude.

181 User Guide 181 Create View Select an event in the Event View, select Create View to automatically create an Event Filter and navigate through the Create Event View Wizard. Create Filter Select an event in the Event View, select Create Filter to automatically create an Event Filter and navigate through the Create Event Filter Wizard. Event View Properties Event View Settings Exclude Filters Include Filters Notification Methods Reports from an Event View Right click on the Event View and select Create Editor Report to get an ELM Editor Report based upon the query that makes up the Event View. The ELM Editor Report will retain the Event View display mode and Event View Settings that have been configured. Working With Event Views When working with Event Views, please be aware of the following:
182 182 ELM Help The MMC can maintain only one customized set of columns for all standard Event Views and one customized set of columns for all Event Views that use the Security View style. This means that changes made in one Event View will be reflected in the other Event Views that use the same style. Opening an Event View with a different security style setting will reset the customized display to show all available columns in both types of Event Views. If this happens, you can restore a previously customized Event View by closing and re-opening the ELM Console. Make sure to select No when prompted to Save the current console settings. If you select Yes, the previous customizations will be lost. To conserve MMC resources, dynamic updating can be disabled via the ELM Server applet in Windows Control Panel. If Event Filters are not assigned to the Event View, then all events will be displayed in the Event View. Use the ELM Database Settings Retention Policy to configure deleting and archiving of Event records Event View Properties View Settings Maximum number of Events specifies the maximum number of rows displayed in the Event View. You may select any value from 1 through The larger the number, the more memory the mmc.exe process will consume and the longer the query will take to return results. Date Range The From Date and To Date fields specify a date range. By default the To Date range is Now. New events that meet the filter criteria can be added dynamically to this view as they are received. You may select one of the pre-selected choices from the drop-down, or enter your own date range.
183 User Guide 183 Filters The Event Filters determine what events are going to be filtered in or out of the Event View. Include Event Filters Select the Event Filters that identify events to be displayed in this Event View. New - Opens the Event Filter Wizard to create a new Event Filter. Properties - Select the filter and click Properties to edit or view the properties of an Event Filter. Exclude Event Filters Exclude Filters are evaluated before the Include Filters. An Event that matches any of the Exclude Filters will not be displayed. This is a way to use multiple filters to display a focuses subset of the events you want to isolate. New - Opens the Event Filter Wizard to create a new Event Filter. Properties - Select the Event Filter and click Properties to edit or view the properties of an Event Filter. Notification Methods The Notification Method determines where the events in the Event View are going to be delivered to. This is a way to use multiple Notification Methods. New - Opens the Notification Method Wizard to select a Notification Method. Properties - Select the Notification Method and click Properties to edit or view the properties of a Notification Method. Properties Tab
184 184 ELM Help This read-only tab displays the properties of the selected object and the values for those properties.
185 User Guide Event Properties Provides details about an event. To view Event Properties, expand the Results container, click on the Event Views container, and click on an Event View. On the right-hand side, double-click on an Event or select Event and choose Properties from the Action menu. Use the Database Retention Policy to configure deleting and/or archiving of Event records. The Event Properties dialog includes navigation controls to browse events in a collection of Events. Copy - Click the Copy button to place the Event detail information on the Windows clipboard. Event Detail In the properties of an Event, the tab is named Event Details, and displays the following fields: Log - Displays the Windows log where the event originated. Generated - Displays the time the event was created in the event log. Received - Displays the time the event was received by the ELM Server. User - If available, displays the user from the event record. Computer - Identifies the computer where the event was collected. Event ID - Determined by the application or process that created the event. Source - Depends on the process that generated the event. Type - Can be Error, Warning, Informational, Failure Audit, Success Audit, Critical, or Verbose.
186 186 ELM Help Category - Determined by the application or process that created the event. Message - Determined by the application or process that created the event. Views Displays a list of Event Views that will display this event. Event Filters determine which Event Views will display the event. Editing Event Filters after the event has been received and processed by the ELM server may change the results displayed in this list. Filters Displays a list of Event Filters that display this event. Monitors Displays a list of Monitor items where this event is collected. To view properties of an Event View, right click on the Event View and select Properties from the menu.
187 User Guide Event Filters The Filters and Methods Library within ELM contains Event Filters and Notification Methods which can be assigned to Event Views. Event Filters are common objects within ELM and can also be assigned to Event Collectors. See More: All Exclude Filters All Include Filters All Correlation Filters All Notification Methods Security Views Administrators can track security issues by using Security Views. Security Views allow you to group events that match Exclude and/or Include Filters with the options to notify or report based on that Security View. Security Views differ from Event Views slightly by design in that only security-related events (audit success and audit failure events) are displayed in the view. The Security View also uses a security-centric layout to display critical security information from the events. This view displays values from the Event Description field (e.g., Logon Type, Logon ID, etc.) as individual columns for easy sorting. This allows you to customize Views with specific information that is normally buried within the security event log record. Records in Security Views are generically referred to as Events. Events generate from several sources: Event log entries collected from Windows-based systems. Syslog messages received from Syslog clients SNMP Traps received from SNMP-capable systems and devices
188 188 ELM Help ELM Server generated Events A Security View has two display modes: Detail View mode (default) which shows each event on a single line in the Security View. Summary Event mode displays a summary roll-up (i.e., count of events). The Summary View display mode is very useful to determine the busiest events across multiple systems by sorting on the Count column heading. Pausing Event Views On busy servers, thousands of events can stream into the Security View making it difficult to read a specific event. Pause the Security View to get more detail on the event or to exclude the event from the Security View Event View Properties View Settings Maximum number of Events specifies the maximum number of rows displayed in the Event View. You may select any value from 1 through The larger the number, the more memory the mmc.exe process will consume and the longer the query will take to return results. Date Range The From Date and To Date fields specify a date range. By default the To Date range is Now. New events that meet the filter criteria can be added dynamically to this view as they are received. You may select one of the pre-selected choices from the drop-down, or enter your own date range. Filters The Event Filters determine what events are going to be filtered in or out of the Event View.
189 User Guide 189 Include Event Filters Select the Event Filters that identify events to be displayed in this Event View. New - Opens the Event Filter Wizard to create a new Event Filter. Properties - Select the filter and click Properties to edit or view the properties of an Event Filter. Exclude Event Filters Exclude Filters are evaluated before the Include Filters. An Event that matches any of the Exclude Filters will not be displayed. This is a way to use multiple filters to display a focuses subset of the events you want to isolate. New - Opens the Event Filter Wizard to create a new Event Filter. Properties - Select the Event Filter and click Properties to edit or view the properties of an Event Filter. Notification Methods The Notification Method determines where the events in the Event View are going to be delivered to. This is a way to use multiple Notification Methods. New - Opens the Notification Method Wizard to select a Notification Method. Properties - Select the Notification Method and click Properties to edit or view the properties of a Notification Method. Properties Tab This read-only tab displays the properties of the selected object and the values for those properties.

190 190 ELM Help Event Properties Provides details about an event. To view Event Properties, expand the Results container, click on the Event Views container, and click on an Event View. On the right-hand side, double-click on an Event or select Event and choose Properties from the Action menu. Use the Database Retention Policy to configure deleting and/or archiving of Event records. The Event Properties dialog includes navigation controls to browse events in a collection of Events. Copy - Click the Copy button to place the Event detail information on the Windows clipboard. Event Detail In the properties of an Event, the tab is named Event Details, and displays the following fields: Log - Displays the Windows log where the event originated. Generated - Displays the time the event was created in the event log. Received - Displays the time the event was received by the ELM Server. User - If available, displays the user from the event record. Computer - Identifies the computer where the event was collected. Event ID - Determined by the application or process that created the event. Source - Depends on the process that generated the event. Type - Can be Error, Warning, Informational, Failure Audit, Success Audit, Critical, or Verbose.
191 User Guide 191 Category - Determined by the application or process that created the event. Message - Determined by the application or process that created the event. Views Displays a list of Event Views that will display this event. Event Filters determine which Event Views will display the event. Editing Event Filters after the event has been received and processed by the ELM server may change the results displayed in this list. Filters Displays a list of Event Filters that display this event. Monitors Displays a list of Monitor items where this event is collected. To view properties of an Event View, right click on the Event View and select Properties from the menu.
192 192 ELM Help Event Filters The Filters and Methods Library within ELM contains Event Filters and Notification Methods which can be assigned to Event Views. Event Filters are common objects within ELM and can also be assigned to Event Collectors. See More: All Exclude Filters All Include Filters All Correlation Filters All Notification Methods Correlation Views ELM Correlation Views watch for specific pairs of event. The most basic configuration requires an Include Filter, a Correlation Filter, and a timer setting. When an event matches the Include Filter, it is designated as the "start event" and the timer begins counting down. If an event matching the Correlation Filter is found before the timer expires, then it is designated as the "end event" and a correlation pair has been found.

193 User Guide 193 The basic Correlation View described above can have a Notification Method assigned, so ELM users can be alerted to the occurrence of a correlation pair. If the timer counts down to zero, then a separate Notification Method can be triggered alerting ELM users that a correlation pair was not found.

194 194 ELM Help Note Correlation View Icons will change depending on the assignment of Notification Methods. - No Notification Methods assigned to the View - One or more Notification Methods assigned to only the Matching result. - One or more Notification Methods assigned to only the Timeout result. - One or more Notification Methods assigned to both the Matching and Timeout results Correlation View Properties View Settings Maximum number of Events Specifies the maximum number of rows displayed in the Event View. You may select any value from 1 through The larger the number, the more memory the mmc.exe process will consume and the longer the query will take to return results. Date Range The From Date and To Date fields specify a date range. By default the To Date range is Now. New events that meet the filter criteria can be added dynamically to this view as they are received. You may select one of the pre-selected choices from the drop-down, or enter your own date range. Filters

195 User Guide 195 Events matching the combination of Include and Exclude Filters will start the Correlation View timer. If subsequent events matching the combination of Filters are processed, then the Correlation View timer will be re-started. Start - Include Filters Select the Include Event Filter that identify events to be displayed in this Event View. New - Opens the Include Filter Wizard to create a new Include Event Filter. Properties - Select the filter and click Properties to edit or view the properties of an Event Filter. Start - Exclude Filters Exclude Filters are evaluated before the Include Filters. An Exclude Event that matches any of the Exclude Filters will not be displayed. This is a way to use multiple filters to display a focused subset of the events you want to isolate. New - Opens the Exclude Filter Wizard to create a new Event Filter. Properties - Select the Exclude Filter and click Properties to edit or view the properties of an Exclude Filter. End - Correlation Filters Events matching any of the End Correlation Filters within the time period will trigger all assigned Matching Notification Methods. Watch for correlating event within this time period - This sets the duration for how long a Correlation View will watch for a Matching End event once a Start event has initiated the timer. New - Opens the Correlation Filter Wizard to create a new End Event Filter. Properties - Select the Correlation Filter and click Properties to edit or view the properties of an Correlation Filter. If an Event matches any of the Correlation Filters within the time period, assigned Matching

196 196 ELM Help Notification Methods will be triggered, and the View itself will generate event If no Event is found within the time period, the assigned Timeout Notification Methods will be triggered, and the View itself will generate event Notification Methods Notifications can be triggered if correlating End events are found, or if they are not found, within the configured time period. The time period begins when an event matches the combination of Include and Exclude Filters assigned to the View. Matching The assigned Notification Methods are triggered if a correlating End event is found within the time period configured on the Filters End tab. New - Opens the Notification Method Wizard to select a Notification Method. Properties - Select the Notification Method and click Properties to edit or view the properties of a Notification Method. Timeout The assigned Notification Methods are triggered if a correlating End event is not found within the time period configured on the Filters End tab. New - Opens the Notification Method Wizard to select a Notification Method. Properties - Select the Notification Method and click Properties to edit or view the properties of a Notification Method. Properties Tab This read-only tab displays the properties of the selected object and the values for those properties.

197 User Guide Reporting The ELM Editor reporting engine is located below the Reporting container in the ELM Console. ELM Editor reports is a customizable reporting engine that has the ability to reports, store them to a directory, or save them to the database. There are Sample Custom Reports already created for common tasks as well as a Tools folder for built-in reporting. New reports are easily created from Event Views and Performance Data. In order for the report to return data, the data must be collected by a Monitor Item first Performance Tables The Performance Data container displays performance counter definitions and the most recent performance data collected by Performance Collectors. Each Performance Object has a Counters folder that holds all the performance counter definitions for that Performance Object. Right click the Performance Object New New Editor Report to create an ELM Editor report based off of the results. See Also Performance Collector Performance Alarm Adding Performance Counters Performance Objects The Performance Object properties dialog displays detailed information for the selected performance object
198 198 ELM Help To open the Performance Object properties, expand the Performance Data container beneath the Results container, expand a Performance Object, right-click on the Counters folder, and select Properties. Object Name - The name of the Performance Object to which the selected counter belongs. Specific Instances - Click the >> button to enter or remove instances for collection. In the context of performance counter objects, an instance is a unique occurrence of a counter. For example, if you are monitoring a dual CPU machine, there are two instances available for collection (one for each CPU) under processor-related counters. If you are monitoring a multi-homed machine (e.g., a machine with two separate network interfaces), there are multiple instances under network-related performance counters (one for each installed interface). You may use the wildcard characters * and % to mask selections, and the Boolean character! to exclude instances (e.g.,!iexplore). If no instances are listed, all instances are evaluated. Database Table - Displays the name of the database table in the ELM Server database that contains the data collected for the Object Name. Performance Counters - This displays the list of performance counters which have been saved in the ELM configuration. For each performance counter, a value for the following fields are displayed: Database Column - Displays the name of the column name (in the table listed in the Database field above) that contains the data collected for this counter. Summarize - Summary method applied to the selected counter when data is aggregated by a Performance Collector. Avg - Average of the collected data Sum - Sum of the collected data Min - Smallest collected value Max - Largest collected value StDev - Standard deviation of collected data Var - Variance of collected data Counter Type - The type of counter (i.e., COUNT for counters that count an item such as Page Faults, or TIME for counters that use time values such as Page Faults/sec). Explanation - Displays an explanation for the selected performance counter Adding Performance Counters Before performance data can be collected you have to define the performance counters in the ELM Server. Performance Counters can be collected periodically and stored in the database from all the Windows systems you are monitoring using the Performance Collector monitor item or monitored for a threshold value using the Performance Alarm monitor item. To define the counters

199 User Guide Right click on the Performance Data container in the left pane of the MMC Console. 2. Choose Add Performance Counter Definitions from the context menu. The following dialog will be displayed: You can point this dialog box to any Windows 2000/2003/2008, Windows XP, Windows Vista, or Windows 7 computer, and load the published performance counters. Enter the name of the computer from which to read the published counters, and hit the Tab key to load the counters from that computer. You can also click the Browse button to browse the network for that computer. It may take a few moments to read in all of the available counters. If the ELM Console is on a 64-bit operating system, the Use 64 bit performance sub-system check box is enabled. This check box enables you to use performance counters that are only available through the 64bit performance sub-system. 3. Select a Computer with the performance counters published that you will want to collect. 4. Select the performance object and instances you want to collect. 5. Click Add Selections to add the selected performance counters ELM Editor ELM Editor is a customizable reporting engine that has the ability to reports or save them to a directory. There are Sample Custom Reports available to use as is or customize to your needs for common tasks. A Tools folder provides additional reporting features such as high level summaries and a search option. New reports can easily be created from Event Views and Performance Data.
200 200 ELM Help It is important to note that in order for a report to return data, the data must be collected by a Monitor Item first. Editor Reports can be viewed from the ELM Console by expanding the Reports > ELM Editor container. Note Most reports are resource intensive and should be scheduled off peak hours. Creating Reports The best method for creating Editor Reports from events is to base them on Event Views. To generate an Editor Report based on an existing Event View: Expand Results > Event Views container and choose an Event View on which to base a Editor Report. Right-click the Event View and choose Create Editor Report. These Editor Reports will retain the properties of the Event View to include the Maximum number of Events, View Style, Date Range, and Summary/Detail View. These Editor Reports may be edited or modified like any other Editor Report. See: Modify ELM Editor Report Changing the report date range The default time span for each report is ThisWeek. The date range for any report can be quickly changed by right-clicking on the report name > Date Range, and select the range you wish to view. User Pre-defined range refers to the date range found in the SQL query of the report. Selecting any of the pre-defined date ranges in the list above temporarily overwrites this value. When you select Userpredefined range, the report date range returns to that specified in the SQL query.

201 User Guide 201 Note If an ELM Editor report has multiple sections and the date range differs between sections, or the report has query has been customized, the shortcut to change date ranges will not display in the submenu when you right-click on a report. Assign Report to Monitoring Categories To assign a report to specific Monitoring categories, right-click on the report name Monitoring Categories, and select the category you wish to view data for. Only categories that contain systems will be displayed on the sub menu.

202 202 ELM Help Managing Scheduled Reports Scheduling reports allows you to run the report at regular intervals. To Open the Editor Report scheduler: 1. Right-click on the Editor Report you wish to schedule. 2. Choose Schedule Report, and the Editor Report Schedule Wizard dialog will appear. 3. Select the frequency you desire the report to run (Schedule Type). 4. Select the time of day you wish the report to run (Run at). 5. Select the starting day for the schedule (On). 6. Select the days you want the report to run (Days). Click Next. 7. Select the delivery Method for the report (Type). Options are and File. Further options depend on the Type selected. If is selected, enter the recipient's address and the Mail Server name or IP address. Multiple recipients must be comma delimited. If File is selected, enter the path to the file storage location. This can be a local or unc path. 9. Select the Output Format. Options are PDF and CSV. 10.Select the preferred Page Orientation or leave Auto Orient. 11.Click Finish.
203 User Guide 203 Note Variables can be used in the Directory and Name fields. Using variables, you may replace or create new files as needed. To replace files, ensure the name will be identical each time the report is run. To create new files, ensure it is different by using the appropriate variables. Possible variables: %ELMInstallPath%,%ReportName%,%Time%,%Month%,%Year%,%Day%. A network directory can be used as well. To Change a Report Schedule 1. Under Report Schedules, right-click on the Editor Report and select Properties. 2. Enter values for the Scheduler Wizard dialogs as in the above steps 4-9. To Delete a Report Schedule 1. Select the Report Schedules node. 2. Right-click on the undesired schedule. 3. Select Delete from the context menu. Viewing Completed Reports Schedule status and completed reports can be viewed in the Report Schedules node. To view a report through the Report Schedules node: 1. Expand Reporting-->ELM Editor and select Report Schedules in the navigation tree. 2. On the right-hand side, click on View Results for any completed reports.

204 204 ELM Help Modify ELM Editor Report Report Sections Additional report sections may be added by right-clicking on the report and selecting Edit > Add Section from the context menu. Existing report sections may be modified by right-clicking on the section and selecting Edit >Properties from the context menu. Report section Style displays the results in a RowGrid, SummaryGrid, Html, Chart, or Glossary format.

205 User Guide 205 To change the time span, it is necessary to open the sql editor for each report and replace each occurrence of ThisWeek with the desired times pan: Modify the existing report section SQL > SQL Text query to display desired results for the Top clause or time frame.

206 206 ELM Help
207 User Guide Glossary Actions Actions are a form of response executed by a Monitor Item and occur as a result of changing conditions observed by the Monitor Item. There are two Actions that can be executed: Generate application event log message or execute a script. Monitoring Categories Categories are user configurable containers for organizing ELM Agents. Monitor Items are assigned to Categories which then assign them to any Agents in the Category. Agent Deployment Wizard Agent Deployment Wizard allows installation of single or multiple Agents using lists generated from Active Directory, an IP address range, a text file of computer names or simply typed in. Agents Agents are the fundamental component for identifying the devices to be monitored. ELM pricing is based on the License and Class of the Agent. There are 4 licenses: System, Log, Performance, and Event. There are 2 classes: Class I = Windows Server and Windows Cluster Server Systems and Class II = Windows Workstation and non-windows Systems. At-a-Glance Server-At-a-Glance views are a summarization of overall status information for the ELM Server, Agents, Application Outages, Inventory, and Database Information. Agent At-a-Glance views are a summarization of overall status information per Agent. Circular File A circular file overwrites itself by returning to the beginning of the file when it reaches a pre-determined size. File Monitors track their progress, and look for new data, by setting size-based bookmarks. Because circular files grow to a limited size and then stop, the bookmarks become ineffective. Containers Container is a general term and is found on the left-hand side of the ELM Console. They are typically, but not always, shown as a folder icon with an overlaid design. Agent Categories are a special class of container. DDL Data Definition Language (DDL) is used to define and manage objects in SQL. See SQL Books On Line (BOL) for more details. DML Data Manipulation Language (DML) is used to retrieve and manipulate data. See SQL Books On Line (BOL) for more details. ELM Advisor ELM Advisor is a Windows Notification Area icon which provides a nonintrusive way for Administrators to be notified of changing conditions in their environment. For more information see ELM Advisor.
208 208 ELM Help ELM Console ELM Editor ELM Server ELM Server Database ELM Web Viewer Event Filter Event Monitor Event View Events IP Virtual Agents MIB Browser ELM Console refers to the snap-in that resides in a Microsoft Management Console and is the primary user interface for the product. Each snap-in can connect to multiple ELM Servers, and the ELM Console stand alone snap-in can be co-mingled with other MMC snapins to provide single-seat administration. ELM Editor refers to a report creation tool that can build Editor reports. Reports can be generated both on an ad hoc basis and at periodic intervals, and then output as a web archive file (.mht), ed, or stored in the ELM database. ELM Server is comprised of several engines that handle tasks such as creating and maintaining a database for data storage, archiving and reporting, managing Agents and Agent licensing, processing Event Filters, and executing Notification Methods. ELM Server Database contains data collected from Agents, System Configuration, Inventory, Outage information, and when configured, ELM Server diagnostic events. The Web Viewer is an HTTP/XML-based interface to ELM Server Objects. The server side of the Web Viewer is installed using the setup package for ELM. The client side of the Web Viewer is designed to work in Internet Explorerr. Because the client side is simply a Web browser, most organizations will not have to deploy any additional software to client machines in order to utilize the Web Viewer. Filters look for matches in messages received by the ELM Server. Messages include Windows event log records, ELM Monitor Items, Syslog messages, or SNMP traps. Event Monitor is a general term which refers to Event Collector, Event Alarm, and Syslog Monitor Items. Event Views use one or more Event Filters to display some or all events. You can associate one or more Event Filters to filter what events are displayed. An event is a single record from a Windows event log, an SNMP trap,or a Syslog message. IP Virtual Agents are non-windows workstations and servers (e.g., Unix, Linux, appliances, etc.) and TCP/IP-based devices (routers, switches, hubs) that send messages to the ELM Server, and/or can be pinged by the ELM Server. MIB Browser, or SNMP OID Selector, provides a user-friendly method for importing and browsing MIB files in ELM. It is found in the properties of SNMP Alarm and SNMP Collector Monitor Items.
209 User Guide Monitor Items Notification Methods Performance Data Quality of Service (QoS) Receiver Report Section Service Agents SMTP Monitors SNMP Agent Software License Agreement TNT Agent TNTKEY 209 Monitor Items determine the type of information or activity to monitor. Examples include Event Collector (which collects events), Service Monitor (which watches the state of Windows services), and Performance Collector (which gathers performance counter values). Notification Methods control the message and how it is is delivered to you. They're triggered by events and have thresholds which can protect you from being flooded by notifications. Performance Data refers to the Performance Objects and Performance Object Counters that are displayed in the Performance Data container within the ELM Console. Published Performance Counters can be monitored for thresholds and collected for capacity planning purposes. Quality of Service deals with response time thresholds. Many Monitor Items include quality of service monitoring that enables you to generate warning events or take corrective action when an Agent, TCP port or TCP/IP-based application does not respond within the quality of service threshold. An SNMP trap receiver and a Syslog message receiver can be added as monitor items. The SNMP receiver can collect, filter and archive SNMP traps with and without SNMP Object IDs. The Syslog receiver can receive both TCP and UDP Syslog messages. Report section refers to different areas of an ELM Editor report. Each area displays the results of a single SQL query. Results can be displayed in graphical or textural style. Service Agents execute Monitor Items, collect data, transmit collected data to the ELM Server, and execute the configured Actions for assigned Monitor Items. Service Agents are required in order to monitor event logs, health and performance and other subsystems in real-time. ELM Monitor used to monitor SMTP gateway services. See Monitoring for information about the SMTP Monitor. An SNMP Agent is not one of the ELM Agent types. It is part of the SNMP protocol and exposes management data on the managed system. You should receive a Software License Agreement (SLA) with your purchase. The SLA provides details on your license agreement, and includes your registration information. If you did not receive an SLA with your purchase, or if you cannot locate your SLA, please contact Sales@TNTSoftware.com Agents are the fundamental component for identifying the devices to be monitored. TNTKEY is a small text file that can be used to activate the ELM Server. Requires a valid ELM Serial Number.
210 210 ELM Help Virtual Agents Web Viewer Wizard WMI Virtual Agents are used for agentless monitoring. Nothing is installed on the system being monitored when it is configured as a Virtual Agent. Virtual Agents are one of two types: Windows (workstations and servers), or TCP/IP-based (computers and network devices). TCP/IPbased agents are known as IP Virtual Agents. The actual monitoring functions for a Virtual Agent execute within the ELM Server Process so Virtual Agents cannot monitor in real-time. The Web Viewer is an HTTP/XML-based interface to ELM Server Objects, Internet Explorer 6.0 and above is the only suppored web browser. The server side of the Web Viewer is installed using the setup package for ELM. The client side of the Web Viewer is any Javascript/XML-capable Web browser. Because the client side is simply a Web browser, most organizations will not have to deploy any additional software to client machines in order to utilize the Web Viewer. Wizards take the administrator or end-user step-by-step through the creation of a new object in ELM. Wizards are launched whenever new object creation is invoked from within the ELM Console. WMI is based on the Common Information Model adopted by the Distributed Management Task Force. WMI is a key component of Microsoft Windows management services, and an integral part of Windows Operating System.
211 Administrator Guide Part 4
212 212 4 ELM Help Administrator Guide The ELM Administrator Guide provides information for the system administrators responsible for managing the ELM Server. Planning Guide Installation Guide Security Guide Windows Cluster Guide Troubleshooting Guide Technical Resources Tools 4.1 Planning Guide The ELM Planning Guide provides ELM administrators details on the following topics: Introduction Best Practices Sizing Guidelines Database Guidelines Network Guidelines Backup and Restore the ELM Configuration Data Introduction The ELM infrastructure must be planned prior to deploying ELM in your environment. Consider the following questions: What are my Windows Audit Policy settings? Your Windows Audit Policy is going to determine which events are being written to your event logs. Some of these audit policies generate a lot of events, such as Audit process tracking -
213 Administrator Guide 213 Success. Determine what your business needs are and only turn on auditing for the events that you will need to collect. Which events do you want to collect? You decide which events are important to you. For example, in order to collect user logon events, you may decide to collect Audit Success and Audit Failure events on your domain controllers, but only Audit Failure events on your member server. You can determine which events are collected based on a number of event filter criteria. Filtering takes place at the Agent level, reducing the workload on the Agent, the ELM Server, and the network. How many Syslog messages and/or SNMP Traps will you be receiving? Network devices can be configured to transmit a wide variety of Syslog messages and SNMP traps. This translates into network traffic, ELM Server receiving and processing, and database overhead. How frequently do you want to collect data? Data can be collected in real-time (every second), or at periodic intervals. The frequency of data collection is directly related to resource consumption (overhead) and database size. The more frequently you collect data, the higher your resource utilization and the larger your database becomes (unless you use the built-in aggregation/pruning features). How long do you want to keep data? If you are planning to keep all event data for years, months, or weeks, the database will become very large and must eventually be archived. Developing a plan to prune unnecessary records and archive preferred data periodically will save time and resources. Keep all current events in the database (from the last two weeks, for example), keep only error and audit events for a longer period of time. If you anticipate your database growing beyond 10.0 GB, we recommend using Microsoft SQL Server 2008 R2 rather than Microsoft SQL Server 2008 R2 Express Edition since it has a maximum database size of 10 GB. Which notification methods work best for you? You might choose to send non-critical events by , and critical events by network message or pager. You might use custom batch files as a notification method, allowing you to take action when a critical event occurs (such as restarting a failed service). What Type and Class of Agents do you want to use? Agent is the general term describing a monitored system. There are two classes of Agents that distinguish among operating systems. For example a Windows Server vs. a Windows Workstation vs. a Linux Server. These two classes are: Class I = Windows Server and Windows Cluster Server Systems. Class II = Windows Workstation and non-windows Systems.
214 214 ELM Help There are two types for Agents monitoring Windows operating systems. So Cluster, Server and Workstation Agents can be installed as one of the following: Service Agents a program that runs as a service on the monitored system Virtual Agents provide agent-less monitoring, where the ELM Server performs monitoring/ collection. Note Non-Windows devices are always monitored by an IP Virtual Agent. Agent Types Service Agents run in the security context of the LocalSystem, or in a user security context (e.g., using a service account). Service Agents usually consume approximately 30-75MB of physical memory, and less than 3% of the overall CPU time on the monitored system. The resources actually consumed depend on the number of Monitor Items applied to the Agent, the frequency at which those Monitor Items are executed, and the amount of data generated by or being collected from the monitored system. Service Agents are used for monitoring only Windows 2000/2003/2008, Windows XP Pro, Vista Ultimate, and Windows 7 systems; if you do not wish to install software on the monitored system, use a Virtual Agent; to monitor a computer with a different OS or a device that uses TCP/IP, use an IP Virtual Agent. Note When setting the user security context (e.g., using a service account), the settings in the ELM console override the user security context settings in the TNT Agent service in Windows services. Virtual Agents provide agent-less monitoring of Windows computers without installing a service on the monitored system. The ELM Server monitors and collects data from the Windows system remotely. Because Agent code is not used on the monitored system, Virtual Agents will add overhead to your network and to the ELM Server. In most situations, Service Agents are recommended, however Virtual Agents are useful when you do not want to install software on the monitored system. Virtual Agents require that the ELM Server service account has administrative privileges on the system to be monitored. Virtual Agents require RPC and NetBIOS connectivity between the ELM Server and the monitored system. Because Virtual Agents remotely monitor Windows systems, they cannot monitor in real-time. IP Virtual Agents always provide agent-less monitoring. You can monitor, collect data from, or receive data from Unix, Linux, NetWare, Cisco and Apple systems, hubs, switches, routers, gateways, etc. with IP Virtual Agents. The ELM Server can receive SNMP Traps, and TCP-based and UDP-based Syslog messages from IP Virtual Agents, as well as monitor internet services. Windows systems can be monitored by IP Virtual Agents but Inventory Collectors, Event Collectors, Event Alarms or File Monitors cannot be used for these systems Best Practices SQL Best Practices Separate the Operating System from the database files and the log files.
215 Administrator Guide 215 Separate the database files from the log files. For database files, performance increases with more spindles included in your RAID configuration. Use SATA with TCQ support or SCSI Drives, the faster the RPM the better. For better recoverability, use a SCSI interface instead of SATA and IDE. For large bandwidth demands on the I/O bus, use a different bus for the transaction log files. If there is a DBA on staff, defer to the DBA. If using SQL Express, increase the number of "Keep nn databases" in ELM Database Settings, on the Archive tab. If data volume nears SQL Express database size limits, ELM will automatically rollover primary or failover databases. These will be counted, along with archive databases, toward the "Keep databases" limit. Database Best Practices Database Settings - Event data can quickly fill a database. Plan to keep only the data you need, for as long as you need it. Microsoft SQL Server 2008 R2 Express has a 10GB limit. Recommendation (based on monitoring 10 or more servers): Keep informational, audit success, and warning events for 7 days. Add a prune specification to the Database Settings in order to remove event data older than 7 days. Keep error events for two weeks, then prune them. Keep audit failure events for one month, then prune them. If physical disks is available, separating the Windows swapfile, SQL.ldf file, and.mdf file onto separate physical disks can help overall performance. Recommendation (for compliance purposes): SQL Server Standard R2 or Enterprise R2 editions are preferred over SQL 2008 R2 Express Edition. Keep events in the ELM primary database for two weeks, and then archive events. Using a shorter time period will improve performance if the number of events is extremely high. Automate archiving the Archive Database. You should expect to have several multi-gigabyte archive database files. These files may be moved to removable media as prescribed by your compliance plan. Configure Performance Data Collectors to aggregate data weekly, and delete annually. This will provide one week detail history, and 52 weeks of summary. Monitor Item Best Practices Only Service Agents can execute Monitor Items in real-time. For Virtual Agents, we recommend a Scheduled Interval of 10 seconds or greater. Some Monitor Items include the ability to execute Actions. Leverage this capability for additional management power! When using Virtual Agents, the Monitor Items are executed remotely by the ELM Server. You can use the ELM Server performance object to obtain metrics about the Monitor Item job queue. Notification Method Best Practices Set Threshold settings in order to reduce the impact of event storms. Select the best notification method. Use the ELM Advisor desktop notification for critical events such as Errors and Audit Failures.
216 216 ELM Help When using Notification Methods for events you review as part of a daily routine, but do not necessarily need to know about immediately, use an Exchange Public folder as the destination Sizing Guidelines "How should I size my ELM Server?" Because of the dynamic nature inherent in monitoring computers, it is difficult to provide specific recommendations for hardware specifications. Such recommendations depend on the number of Agents, the number and frequency of Monitor Items, the amount of data collected or received, how frequently it is collected, etc. Given those caveats, we offer the following guidelines, observations, and general recommendations for sizing an ELM Server. Note This guide covers only the sizing requirements for the ELM Server component. It does not include sizing for the ELM Server database or any other component, including the operating system. Generally, running the ELM Server on a multi-purpose computer is acceptable. The factors that would indicate a dedicated server is required would be: Is Monitoring Mission Critical? If the systems to be monitored are mission critical and the fastest possible notification of failures is required, you should consider a dedicated server. How many events per day are being collected? The number of Events Per Day can be estimated using the Elm Sizing Tool utility located in the ELM start menu. Small Deployment of ELM < Events Per Day SQL Server on the ELM Server. Only ELM DB s are being used on the SQL server. ELM_Primary /ELM Failover DB/ ELM Archive DB s are local to the ELM server. Medium Deployment of ELM Events Per Day SQL Server on a separate server. Multiple DB s to include ELM_Primary and ELM Archive DB s on the same SQL server. ELM Failover DB is local to the ELM server. (SQL 2008 R2 Express if needed) Large Deployment of ELM > Events Per Day
217 Administrator Guide 217 SQL Server on a separate server than ELM. ELM Archive DB s and ELM Failover DB is on a different SQL server than the Primary DB. Ideal configuration: SQL Server on Physical Hardware on different physical I/O controllers and disk subsystems. All 15K RPM disks, All Hardware RAID: 5 Separate Partitions: Operating System Raid 1 (mirror) SQL Server exe Raid 1 (mirror) Database Data Raid 10 (mirror, stripe) Database Transaction Logs Raid 1 (mirror) Temp database Raid 10 (mirror, stripe) If you have any questions or comments about this guide, or if you would like assistance sizing your ELM Server or architecting your ELM-based solution, please contact TNT Software's Product Support Group Database Guidelines When installing the ELM Server, you must choose an existing SQL Server on which to store the collected data. The data structure, tables, and indices will be created automatically. Choose one of the following approaches to estimate how large your primary database will be after you start monitoring Agents and collecting event data: Approach #1 Create a test environment with one ELM Server and one or more Agents that are typical of your enterprise. Configure the ELM Server to collect the event data and/or performance data and reports per your requirements. Use the ELGEN.exe utility distributed with ELM to generate the typical number of events each day. Examine the database size every day in order to determine its size and calculate the growth over the previous day. This will give you a reasonable idea of how much data the database will be required to store per server and aid you in making decisions about how large the database server must be. Approach #2 Use the ELMSize.exe utility to collect event data from production servers. In the tool, take a sample of your environment such as a Domain Controller, file server, application server, or web server, and then modify the results in the tool to fit your environment. Take the results from the tool and multiply it by the number of systems that you plan on monitoring.
218 218 ELM Help Be aware, this doesn't include any syslog data or performance data. It is difficult to determine the amount of space consumed by these items. Sizing the ELM Server Database Hardware Now that you know how large your database will be, the next step is to verify you have sufficient resources to run the database engine. Many hardware manufacturers include tools that can configure the appropriate hardware specifications for a server based on your answers to a few questions Network Guidelines Understanding how your network resources perform is essential to healthy network management. During the planning stage, some thought should be given to how ELM will fit into your network. Your network will have to meet certain minimum requirements: Name Resolution Healthy name resolution is essential to a trouble-free network. A thorough understanding of the name resolution methods used by Windows operating systems is essential to optimizing network resources. An unreliable name resolution system can create the appearance of slow, unreliable, or failed network applications. ELM uses TCP/IP to communicate and depends on the operating system and configured name resolution (e.g., WINS and/or DNS). If you have not implemented name resolution in your environment, you may use IP addresses for your ELM Server and Agents, and ELM will function normally. Network Bandwidth ELM makes very efficient use of network bandwidth. A description of the network communication based upon agent type - between the various components of the ELM system follows: ELM Server <--> Service Agent When an event occurs on a Windows system running a Service Agent, the Service Agent reads the new event and forwards it to each ELM Server that is monitoring it. When multiple events occur in rapid succession, the Agent will group the events together and send them within the same session to the monitoring Server. This behavior optimizes network communication. ELM Server <--> Virtual Agent The amount of network traffic between an ELM Server and a Virtual Agent depends on what Monitor Items are used, the individual Monitor Item schedules (which determine the frequency of communication), and the amount of data to be collected. ELM Server <--> ELM Console The ELM Console communicates with the Session Manager component of the ELM Server process. This communication is DCOM-based, encrypted and authenticated. DCOM and RPC connections are made between the ELM Server and the ELM Console to facilitate the transfer of the encrypted data. The amount of data transmitted depends on a variety of factors, including how much data is sent to the ELM Server by Service Agents, what containers are open in the ELM Console. etc.
219 Administrator Guide Backup Guidelines Backing up the ELM Server can be done in whole or in part. The following topics discuss this in more detail. Backup and Restore the ELM Configuration Data Backup and Restore ELM Objects Backup and Restore the ELM Configuration Data Depending on your backup and recovery needs, some or all of the components described below should be backed up. Except where noted, all data described is found on the computer running the ELM Server service. In general, restoring the ELM configuration for a system recovery involves reinstalling ELM components, stopping ELM and replacing default components with backed up components. More detailed instructions are below. ELM Server.dat and.bak Files The ELM Server stores the majority of its configuration data in the ELM installation directory. The default installation directory is: c:\program Files\ELM Enterprise Manager The important configuration files are: EEMSVR.dat EEMSVR.bak appsettings.xml databasesettings.xml These files can all be found in the ELM install directory specified during setup. The ELM Server is notified internally when its configuration changes. If no more changes occur for a fifteen second period, then the ELM Server writes the changes to its current configuration in the.dat file. The configuration can also be manually written by right clicking on the ELM Server and selecting All Tasks Save Configuration. When the ELM Server is started, it loads the configuration in the server.dat file. If this loads successfully, the ELM Server then makes a.bak copy of the configuration. Stopping the ELM Server service and backing up both the.dat and.bak files provides a copy of the current configuration and the prior configuration. We recommend backing up at least the.bak file to backup media. If many changes have been made since the last time the ELM Server service was started, then we recommend making a backup of the.dat without restarting the ELM Server service. The ELM Console snap-in security settings are also stored in the.dat file. Before changing ELM Console security, we recommend making a backup and securing a copy of the.dat file to allow
220 220 ELM Help restoring the prior security configuration. Restoring ELM Server Configuration To restore the ELM Server configuration file from a.bak file: 1. Stop the ELM Server service. 2. Rename the existing.dat file to.old (e.g., EEMSVR.OLD). 3. Copy the.bak file to.dat (e.g., copy EEMSVR.BAK to EEMSVR.DAT). 4. Start the ELM Server service. appsettings.xml The appsettings.xml file stores settings for ELM reports and the ELM Server database connection. ELM administrator updates to this file are made primarily by the ELM database wizard. Otherwise, updates are relatively infrequent and do not use the internal notification mechanism like with the.dat file. Therefore the ELM Server service does not need to be stopped to backup this file, but all ELM Wizards should be closed. Restoring appsettings.xml To restore appsettings from a backup: 1. Close all ELM Wizards. 2. Rename the existing appsettings.xml to appsettings.old. 3. Copy the backup of appsettings.xml to the ELM install folder. TNT Software Registry Keys Important Before modifying the Windows registry, be certain you understand how to backup and restore it if a problem occurs. See KB for further information on the registry. ELM Server ELM stores a small amount of data in the Windows registry. This includes both software-specific settings and COM component registration information. The main registry key with ELM Server configuration data is HKEY_LOCAL_MACHINE \ SOFTWARE \ TNT Software. Other ELM registry entries under HKEY_CLASSES_ROOT and under SERVICES can be recreated by reinstalling ELM. ELM Console On computers running the ELM Console, the main registry keys are HKEY_CURRENT_USER \ Software \ TNT Software and HKEY_USERS \.Default \ Software \ TNT Software. TNT Agent On computers running a Service Agent (TNTAgent.exe), the main registry key is at the same location as the ELM Server: i.e. HKEY_LOCAL_MACHINE \ SOFTWARE \ TNT Software. If you have made use of custom ELM registry settings, you may wish to make regular backups of
221 Administrator Guide 221 your registry. In all supported versions of Windows, the registry and COM registration database are backed up as part of the System State Data. Restoring TNT Registry Keys If the registry back up was created with the ntbackup Backup Wizard, it can be restored using the companion Restore Wizard. If regedit was used to export registry configuration, it can also be used to import configuration. Please see the appropriate Microsoft Knowledge Base article for detailed steps. ELM Databases The ELM databases can reside on the ELM Server or on a remote server. One place the configured ELM databases can be viewed, is through the properties of the ELM Server service, on the Database tab. We also recommend regular backups of your ELM Server database, as it contains all of the data collected from Agents. Regular backups also help keep the SQL transaction log from growing unchecked. During install, ELM creates a SQL Maintenance Job that can be scheduled and will backup the primary ELM database and rebuild table indexes. Restoring ELM Databases Restoring an ELM Database can be done through SQL Management Studio. Please see Backing Up and Restoring Databases in SQL Books Online for more details. Reports Folder and Sub-folders Below the ELM install folder is a WebSite \ Reports folder. This folder and one or more of its subfolders may need to be backed up depending on your system recovery requirements. The default location for generated reports is below the Reports folder. If historical reports should be recoverable, then these generated reports should be backed up. Below the Reports folder is a ReportDefinitions sub-folder. This folder contains.xml files for each report which include the Categories of Agents collecting data for the report. If configured reports should be recoverable, then these.xml files should be backed up. Restoring ELM Reports Generated reports and report definitions can be restored by replacing files in the Reports folder and sub-folders with the backup copy of the same file. Please stop the ELM Server Service and the ELM Reports Scheduler Service before replacing report files. ELM Advisor.dat File The ELM Advisor "username".dat file is created for each user where the ELM Console is installed. This file is located the user's Windows profile, in the TNT Software, Inc. \ ELM Advisor subfolder, and is updated when the ELM Advisor exits. The "username".dat file contains the following configuration details: Servers -The list of ELM Servers registered to the local ELM Advisor for this user. Servers can
222 222 ELM Help be added through the ELM Advisor UI. Responses -The configured actions taken by the ELM Advisor for the 5 different types of events. Responses can be configured through the ELM Advisor UI. Notifications -These records are the event details plus any additional ELM Advisor Notification messages that have been sent to the ELM Advisor. These notification records are independent of events stored in the ELM databases. Deleting them will not delete records from the ELM database. Notifications are configured through the ELM Advisor Notification Methods in the ELM Console. To save the current ELM Advisor configuration, right-click on the ELM Advisor icon in the Windows notification area and select Exit from the context menu. Then backup the.dat file to backup media. Restoring ELM Advisor To restore the ELM Advisor configuration, right-click on the ELM Advisor icon in the Windows notification area and select Exit from the context menu. Then replace the existing.dat file the backup copy of the same file. Restart the ELM Advisor Backup and Restore ELM Objects ELM objects can be individually exported and imported. This provides flexibility to selectively backup precise sections of your ELM configuration. Exporting and importing is accessible from the context menus in the ELM Console.
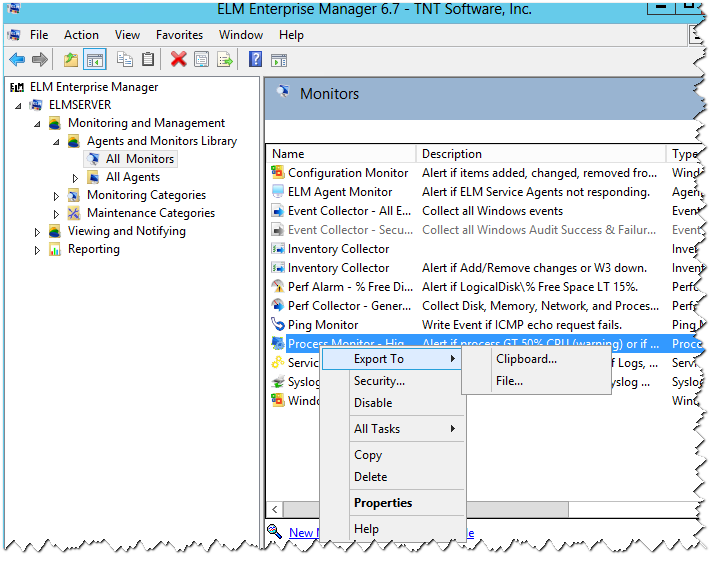
223 Administrator Guide 223

224 224 ELM Help Note In evaluation mode, you can export objects, but the import function is disabled. Export and Import have the possible destination and formats listed in the table below. For example an ELM object can be exported to the clipboard in plain text format, or imported from a file in xml format. If you plan on importing ELM objects, then always export them in.xml format. Export Import Destination Clipboard File Clipboard File Format Plain text XML XML
225 Administrator Guide 225 Note When exporting individual objects, any objects considered lower in the console tree will also be exported with the item. Export Examples: Individual Agent: All Monitor items with configurations (No Categories) Category: All agents assigned to the Category along with any Monitor Items assigned to those agents. Event View: All Filters and Notification methods assigned to the Event View Event Filter: Only the filter criteria is exported 4.2 Installation Guide The ELM Installation Guide provides ELM administrators details on the following topics: System Requirements Installing the ELM Server Installing the ELM Console Installing a Second ELM Console Installing Service Agents Silent Install System Requirements Copyright TNT Software, Inc. All rights reserved Updated 01/01/2012 8:54 AM Introduction This product-based ReadMe is a simplified presentation of ELM system requirements and should provide enough details for most ELM installations. Please check the web-based version of this document for recent updates and additional details:
226 226 ELM Help Contents System Requirements Security Notes Windows 64-bit Restrictions on Evaluation Version Getting ELM Support Contact Us System Requirements ELM Enterprise Manager 6.7 Components All ELM Enterprise Manager 6.7 product lines include the following software components: ELM Server - Centralized data collection, notification, and reporting. ELM Web Viewer - Web console with basic functions installed on the ELM Server. ELM Console - Main UI for configuring ELM and viewing collected data. ELM Advisor - Client application that receives events and runs in Windows Notification area. ELM Service Agent - Collects and sends data to the ELM Server. Minimum Hardware Requirements 2 GB of RAM, Dual Core CPU, 300MB free disk space ELM Server Service Agent Virtual Agent 100MB free disk 50MB free disk 10MB memory for each, on ELM Server computer Note: These disk requirements do not include space for databases, collected.evt(x) files, or ELM Service Agent cache files. Operating System Any of the ELM Enterprise Manager 6.7 components can be installed on any of the operating systems below. Windows Windows Windows Windows Windows Windows Windows Windows Server 2012 Standard * 8 Pro / Enterprise * Server 2008 R2 Standard / Enterprise 7 Enterprise / Ultimate Server 2008 Standard / Enterprise Vista Business / Enterprise / Ultimate Server 2003 Standard / Enterprise XP Professional Links to OS hardware requirements are maintained on the TNT Software Supplemental Download page: Database The ELM Server requires two databases, primary and failover, and can authenticate using Windows Integrated (recommended) or SQL Authentication. The databases can be on the ELM Server or available via the local network, and can be a combination of any of the following:
227 Administrator Guide 227 Microsoft SQL Server 2008 Enterprise, Standard, and Express Microsoft SQL Server 2008 R2 Enterprise, Standard, and Express Microsoft SQL Server 2012 Enterprise, Standard, and Express Required Software A typical ELM installation includes one ELM Server, one or two ELM Consoles, and one ELM Agent for each monitored system. We recommend monitoring Windows systems with ELM Service Agents, and non-windows systems with ELM IP Virtual Agents. ELM Server and ELM Console - A common scenario is to install the ELM Server and ELM Console on a Windows Server in a datacenter or server room, and then use the ELM Console via remote desktop. A variation on this is to install the ELM Console on an administrator's workstation and connect it to the ELM Server in the datacenter. Whichever you prefer, computers hosting the ELM Server and/or the ELM Console should have the following: MSXML 3.0 SP5 on Windows XP SP2, else KB NET Framework 4.0 Full (or Client for ELM Console) Profile Internet Explorer 6.0 or later MMC 3.0 or later (for ELM Console) SQL Server Native Client (for ELM Server if SQL Server is not installed) Links to these downloads are maintained on the TNT Software Supplemental Download page: ELM Web Viewer - ELM Web Viewer - The ELM Enterprise Manager Server computer can host an optional ELM web site that's accessible by any browser that supports JavaScript and active server pages. This optional feature requires Internet Information Server and ASP.NET 4.0 Client or Full Profile on the ELM Server computer.. Service Agent - Service Agents run as a service on the monitored Windows computer and connect to the ELM Server when they need to transfer data. They can be installed by "pushing" them from the ELM Console, or by running the ELM setup package on the monitored computer. If an ELM Service Agent is installed using setup, the monitored computer will need the Microsoft cabinet.dll v or later. Some Monitor Items require the Remote Registry Service be started. Virtual Agent and IP Virtual Agent - These two types of Agents run as part of the ELM Server service, so they have the same software requirements as the ELM Server. Allow 10MB of memory for every Virtual Agent. Virtual Agents require the Remote Registry Service be started on monitored systems. Conditionally Required Software The ELM Enterprise Manager products have a wide variety of features and capabilities. Depending on your needs, certain software components are required for an ELM feature to function. Please see the TNT Software web site for more details. Security For proper functioning, the ELM installation requires solid name resolution and specific rights to gather data, notify administrators, and present results. Below are security requirements for different ELM components.
228 228 ELM Help ELM Server - The ELM Server service account requires Administrative rights on the ELM Server and on all systems monitored by a Virtual Agent. Disabling User Account Control (UAC) is not required on Windows Vista, Windows Server 2008, or newer versions of Windows. For more details, see TNT Software Knowledge Base article MS1: ELM Console and ELM Advisor - During install, the Authenticated Users group will be given DCOM Allow Access permissions in My Computer on the computer running the ELM Console. COM+ server applications will also be created under the DCOM Config branch of Component Services. Service Agent - If a service account is used by a Service Agent, then it requires local Administrative rights on the monitored system. ELM Web Viewer - Although the Web Viewer is primarily a read-only tool, be aware that users with sufficient permissions can enable or disable ELM objects (such as Agents or Monitor Items), and can delete data from the ELM database. Any security configuration changes made via the ELM Console are also respected by the ELM Web Viewer. Notes Miscellaneous notes for ELM components. ELM Server - ELM Server 6.7 will recognize the /3GB switch if used with a Windows 32-bit operating system. ELM Console & ELM Advisor - The ELM Console and ELM Advisor can be installed separately during setup. There is a separate component selection during setup to install the ELM Advisor. Service Agent - If NetBIOS over TCP is disabled, a Service Agent installed by the.msi package can be registered to the ELM Server from the Agent by using the fully-qualified domain name or the TCP/IP address of the ELM Server computer in the Agent Register Server Wizard. Virtual Agent - Virtual Agents run in the ELM Server process and use RPC to gather data from Windows systems. They are not visible as separate processes. IP Virtual Agent - An IP Virtual Agent can be assigned to any system or device on your network that has an IP address. IP Virtual Agents run in the ELM Server process, and do not appear as separate processes. Database Design ELM Manager 6.7 uses the same database design as ELM Manager 6.5. In general, the ELM 6.7 database uses a star schema, smaller datatypes, and event message parametrization to reduce the amount of storage required. It also uses SQL partitioned views and partition elimination to improve performance of large databases. More details are available in the ELM on-line help. Windows 64-bit ELM Manager 6.7 has been tested on the 64-bit editions of Windows Server 2008, Windows 7, Windows Server 2008 R2, Windows 8, and Windows Server 2012 and is supported.
229 Administrator Guide 229 Restrictions on Evaluation Version The evaluation version is fully-functional in all aspects except for the following: Importing configuration data - ELM includes an export/import feature that enables you to export any object from ELM to an XML file that can be imported into any activated ELM Server. In evaluation mode, you can export these objects, but the import function is disabled. Auto-adding Agents - The Auto-add Agents feature is also disabled. In a licensed installation of ELM, devices can send Syslog messages or SNMP traps to the ELM Server computer, and ELM will automatically create an IP Virtual Agent for the device if no Agent is already present. This feature is disabled in evaluation mode; in order for ELM to receive Syslog or SNMP traffic, you must manually create an Agent for each source of traffic. If you need to evaluate the functionality of either of these features, please contact the TNT Software Sales Department (Sales@TNTSoftware.com) to obtain a temporary NFR license key. Getting ELM Support The TNT Software Product Support Group support hours are: Monday - Friday, 8:00am to 4:00pm (Pacific Time) Contact Us TNT Software, Inc Main Street Vancouver, WA General: Sales : Support: Telephone: FAX: Info@TNTSoftware.com Sales@TNTSoftware.com Support@TNTSoftware.com Appendix I Elevated Privileges The ELM application performs administrative tasks, and therefore requires elevated privileges for all services. These are: ELM Enterprise Manager Server service or ELM Event Log Monitor Server service ELM Report Scheduler servicetnt Agent service Most ELM UI components do not require elevated privileges. These are: ELM Console (MMC Snap-in) ELM Advisor (notification area tool) ELM Web Viewer (browser based UI) Elevated privileges are required for some UI components. These are: ELM Control Panel applet ELM Server service property tabs
230 ELM Help Installing the ELM Server Installing the ELM Server is an easy and straightforward process. When you've determined that your system meets the minimum system requirements, begin the installation of the application. Installing the ELM Server To Install the ELM Server: 1. Double-click the ELM67_nnn.msi file you downloaded to execute it (where nnn is the build number). The Setup Wizard will launch. 2. Click Next to continue. The License Agreement screen will appear. 3. Select I accept the license agreement and click Next to continue. 4. Select the ELM features you wish to install, modify the install path if desired, and click Next to continue. Choose to look at firewall instructions, then the Software Product License Registration screen will appear. 5. Enter the Serial Number as it appears on your SLA. If this is an evaluation version, leave the Serial Number field set to EVALUATION. If this is an evaluation version, the license will expire in 30 days. If this is a non-eval version, a confirmation dialog will appear when you click Next. Click Next to continue, and click OK to clear the dialog message that appears. The ELM Service Account Logon screen will appear. 6. In the Username field, enter the account to use for the service account. This account must have administrative rights on the ELM Server, rights to the SQL server if using Windows authentication, and on all Windows systems monitored by ELM Virtual Agents. For a domain account, use the pattern Domain\User. Enter the password for this account in the Password field. Click Next to continue. If the account specified in the preceding step does not already have Log on as a Service rights on the ELM Server, the Setup process will grant this right to the account. The Database Settings dialog will appear. 7. Read the information contained here and click Next to continue. The Primary Database Connection screen will appear. 8. Complete the Primary Database settings dialog to configure the ELM Server primary database. If the database does not exist you will have the option to create it. For a named instance, use the pattern server\instance. Select Install maintenance Microsoft SQL job if you want ELM to automatically create a SQL maintenance job that will perform integrity checks on the database, backup the transaction log, rebuild indexes to optimize the database, and backup the database. Click Next to continue. The Failover Database Connection screen will appear. 9. Complete the Failover Database settings dialog to configure the ELM Server failover database. The failover database is used when the Primary database is offline. If the database does not exist you will have the option to create it after selecting Next. For a named instance, use the pattern server\instance. Click Next to continue.
231 Administrator Guide Review the Configuration Settings that will be used by ELM during install. If any settings should be changed, use the Back button to return to the appropriate dialog and edit it. If the Configuration Settings are correct, then click Install to start the installation. The progress screen will appear. 11.Setup will copy the files to the destination folder, register its components and install the ELM Server service. 12.Click Install to complete Setup. 13.If the Service Agent component was selected, then the Register Server Computer progress screen will appear. Follow the instructions to setup the service agent, using the Domain\User to authenticate to the ELM server. Note During install several configuration changes are made. These changes are listed below. When installing the ELM Server: On Windows Vista and later operating systems, the local computer policy 'Do not forcefully unload the users registry at user logoff' is enabled. This setting can be found in Windows 2008 Group Policy under Computer Configuration Policies Administrative Templates: Policy definitions System User Profiles. When installing the ELM Console: DCOM permissions are set to allow users and the ELM Server service to communicate with the ELM Console snap-in and ELM Server process. The ELM Server computer is added to the Local intranet zone in IE Installing the ELM Console The ELM Console is an optional install and provides a pre-configured MMC snap-in accessible through the Windows program menu. A new ELM Console can be created, or the ELM Console can be added to an administrative toolbox of snap-ins using the steps below. Adding the ELM Console snap-in to Microsoft Management Console 1. To start the Microsoft Management Console, click Start Run, enter mmc, and click OK. An empty MMC will appear. 2. Depending on your version of Windows, open either the Console menu or the File menu and select Add/Remove Snap-in. The Add/Remove dialog will appear. 3. On the Standalone tab click the Add button. A list of standalone snap-ins will appear.
232 232 ELM Help 4. Select ELM Enterprise Manager from the list of snap-ins and click Add. Add other snapins, as necessary and click Close to close the list available of snap-ins. The Add/Remove dialog will appear. 5. Click Close to close the Add/Remove dialog. The MMC will re-appear. 6. Depending on your version of Windows, open either the Console menu or the File menu and select Save to save the configured MMC. Note During install several configuration changes are made. These changes are listed below. When installing the ELM Server: On Windows Vista and later operating systems, the local computer policy 'Do not forcefully unload the users registry at user logoff' is enabled. This setting can be found in Windows 2008 Group Policy under Computer Configuration Policies Administrative Templates: Policy definitions System User Profiles. When installing the ELM Console: DCOM permissions are set to allow users and the ELM Server service to communicate with the ELM Console snap-in and ELM Server process. The ELM Server computer is added to the Local intranet zone in IE Installing a Second ELM Console Installing a second ELM Console is an easy and straightforward process. The ELM setup package can be used to install only the ELM Console component. The desktop user can then connect to the remote ELM Server using the ELM Console to configure and use the ELM Server. To Install the ELM Console: 1. Locate or download the ELM67_nnn.msi setup package (where nnn is the build number). 2. Copy and run the ELM67_nnn.msi setup package on the destination computer. 3. Click Next to continue. The License Agreement screen will appear. 4. Select I accept the license agreement and click Next to continue. 5. Select Server and on the menu select X Entire feature will be unavailable. Now only the Console should be selected. 6. Click Next to continue. Choose to look at firewall instructions and then Install. To Use the ELM Console: 1. Start the ELM Console from the All Programs ELM Enterprise Manager folder 2. Connect to the ELM Server using the menu option Action Connect Installing Service Agents Installing Agents An ELM Server can monitor multiple Agents and a Service Agent can be monitored by multiple ELM
. To Install Agent(s): 1.")
233 Administrator Guide 233 Servers. Each Agent maintains separate configuration, collection set, and cache files for each ELM Server that monitors the Agent. You can install Agents remotely from the ELM Console, or you can install them manually on the target machine (see Installing Service Agents Using Setup Package below). To Install Agent(s): 1. Right-click on the Monitoring container in the ELM Console and select New Agent. The Agent Deployment Wizard will launch. When the Welcome dialog is displayed, click Next to continue. 2. From the System Names dialog box, there is the option of installing One System or Many Systems. The One System agent installation is in the Quick Start Configuration section, so this part of the guide will cover the Many Systems agent install. 3. In the Many Systems area, there are three options: Import from File. Active Directory, IP Range, and Active Directory: Specify the Active Directory domain to search. Selecting the... in the box marked Filter on OU: allows you to further specify particular Organizational Units within the
234 234 ELM Help domain to search. Scan IP Range: Specify a range of IP addresses to search for computers or devices. The ELM Server will query port 139 and look for responses. Import From File: Use the ellipsis button to browse to a CSV (comma-separated value) file containing a list of machines or devices on which to install Agents. After the import, the Agent Deployment Wizard will determine if it what type of agent to install. The CSV file has the following syntax: Agent1, Agent2, Agent3, 4. On the Next dialog, Systems Found, a Succeeded or Failed message will indicate if that system is online by using Ping. Click a system or multiple systems using ctrl or shift, right-click on the system(s) name to Add a System, Select All, or Selected Systems Remove. To change service agent defaults, select the Defaults button. Change the defaults to match the needs in your environment.

235 Administrator Guide 235 Use the Install Credentials to specify the account used to connect and install the service agent. This account must have local administrator rights on the destination. For a DC, this would be a Domain Administrator account. Use the Share and path to specify the destination share and path for the service agent install. The directory must already exist. Using the Listening port to change the port that the agent will use. Use the Minimum disk free space in MB to limit how much disk space a cache file will take. Use the Maximum cache file size in MB to limit the size of the cache file. Note Once an Agent has been configured to listen on a specific port, you cannot change the port. If you want the Agent to listen on a different port, you must remove then re-add the Agent using the new port. 5. The System Scan Summary dialog displays the scan results and gives the status to common agent installation issues. If there are any errors, Advanced is automatically checked. If there are no errors, but a few systems need to be customized, check Advanced before selecting next.
236 236 ELM Help 6. The Agent Operating Mode dialog is used to change the agent to a different mode and/or modify specific agent(s) port. Select Show only Errors to filter the agents with errors. Select a system that is not available and Remove by selecting and right clicking Selected Systems Remove. 7. The Log On for Service Agents dialog is used to change the account used for the Service Agent(s). Select multiple agents by using ctrl and mouse click or shift and mouse click. 8. The Service Agent Install Location dialog is used to change the installation share and path. Select multiple agents by using ctrl and mouse click or shift and mouse click. Use the Min. free disk (MB) to limit how much disk space a cache file will take. Use the Max. cache file (MB) to limit the size of the cache file. 9. The Monitoring Categories dialog is used to assign agents to Monitoring Categories. Select multiple agents by using ctrl and mouse click or shift and mouse click. 10.The Monitoring Products dialog is used to assign agents to Monitoring Products. Select multiple agents by using ctrl and mouse click or shift and mouse click. The Avail column show the number of licenses available for that product. The Used column shows the number of licenses used for that product. 11.The Install Agents dialog displays the status of all of your selections before selecting Next to install. 12.The Install Summary dialog displays the status of the installation. Click Finish to exit the Agent Deployment Wizard. Installing Service Agents Using the Setup Package If the system you wish to monitor is on the other side of a firewall, in a DMZ environment, or located in an environment that restricts the use of NetBIOS and RPC endpoint ports, you can use the ELM Setup package to install a Service Agent on the remote system and then use the Agent UI or Registration Wizard to register the Agent with the ELM Server and select monitor items for the Agent. To install a Service Agent using Setup: 1. Double-click the ELM67_nnn.msi file you downloaded (where nnn is the build number). The Setup Wizard will launch. 2. Click Next to continue. The License Agreement screen will appear. 3. Review and then select I accept the license agreement and click Next to continue. 4. On the Select Features dialog: Click on the Server component icon and select Entire feature will be unavailable. Click on the Console component icon and select Entire feature will be unavailable. Click on the Advisor component icon and select Entire feature will be unavailable.
237 Administrator Guide 237 Click on the Agent icon with the X and select Will be installed on local hard drive. Click on Browse to change the default install path. 5. Click Next for the Install Application dialog. If any changes must be made, use the Back button to return to any dialogs requiring changes. 6. Click Install to start the Service Agent install process. 7. When the installation has completed, the Register Server Wizard will launch. In the Name field, enter the host name, IP address or fully-qualified domain name for the ELM Server you wish to register, or click the Browse button to browse the network for the ELM Server you wish to register. In the Port field, enter the TCP port on which the ELM Server is listening. By default, ELM Servers listen on port The port is configured at the ELM Server from the ELM Server Control Panel applet. Click Next to continue. 8. A logon prompt will appear. Provide an account that has administrative rights on the ELM Server computer. If a domain account is specified, use the pattern domain\user in the Username field. Click OK when an account and password have been entered. 9. The Monitoring Products dialog box will appear. Put a check in the box to the left of the type of Monitoring Product you want this agent to have. Click Next to continue. 10.The Monitoring Categories dialog box will appear. Put a check in the box to the left of each Category you want this Agent to join. You may view the properties of any Category by rightclicking the item and selecting Properties. Click Finish to save the Agent settings and ELM Server registration. 11. Click Finish to close the install wizard. To uninstall a Service Agent that was installed using setup: 1. Open the Windows Control Panel and double-click 'Add/Remove Programs' or 'Programs and Features'. 2. Select the ELM Enterprise Manager product and click the Change button. 3. If the Service Agent is the only ELM component installed on this system, or if there are other ELM components (e.g., ELM Server or ELM Console) and you wish to uninstall everything, select Remove and proceed through the Wizard. If there are other ELM components installed on this system and you do not wish to remove them, select Modify and continue through the Wizard. When the component dialog is shown, change the Service Agent from Will be installed on local hard drive to Entire feature will be unavailable. Then complete the Wizard to remove it.
238 ELM Help Silent Install All the ELM 6.7 features can be installed silently by providing appropriate command line switches to the ELM.msi setup install package. All switches must be provided as a single line, and will typically wrap in a command prompt window. Syntax Conventions Silent Install Examples Syntax Conventions Syntax conventions are based on the style used in SQL Server Books Online. Convention Used for UPPERCASE Installer switch. italic User supplied values. Monospaced Values that must be typed exactly as shown. Bold font Default value used by the installer if the switch is omitted. (vertical bar) Separates syntax items enclosed in brackets or braces. Use only one item in the list. [ ] (brackets) Optional syntax items. Do not type the brackets. { } (braces) Required syntax items. Do not type the braces. [,...n] The preceding values can be repeated n number of times. MSI values are comma separated. Do not allow spaces around any commas. [;...n] The preceding values can be repeated n number of times. TNT values are semicolon separated. Do not allow spaces around any semicolons. Switches Syntax for all switches requires the switch name, an equals sign, and values enclosed in quotation marks. For example: ADDLOCAL="ELMServerFeature"
239 Administrator Guide Switch Values Description Default Switch Values Description Default Switch Values Description Default Switch Values Description Default Switch Values Description Default 239 ADDLOCAL "{[ELMServerFeature] [ELMWebViewerReportsFeature] [ELMConsoleFeature] [ELMAdvisorFeature] [ELMAgentFeature]} [,...n]" Indicate one or more features to install using a comma separated list. All features, unless upgrading 6.0, 6.5 or updating 6.7. When upgrading, the matching feature is selected. INSTALL_DIR "drive letter:path" The drive and path to use for installing the ELM Server. C:\Program Files\ELM Enterprise Manager on 32-bit systems. C:\Program Files\ELM Enterprise Manager (x86) on 64-bit systems. REMOVE "{[ELMServerFeature] [ELMWebViewerReportsFeature] [ELMConsoleFeature] [ELMAdvisorFeature] [ELMAgentFeature]} [,...n]" Specify one or more features to uninstall using a comma separated list. None. TNT_AGENT_INSTALLED "{0 1}" Indicates if a Service Agent is already installed. 1 = if Agent already installed. 0 = if Agent not installed. None. Switch required for all installs. TNT_AGENT_SILENT_PRODUCT_CODES "{ }[;...n]" Product licenses that will be assigned to a Service Agent = System Class I = System Class II = Log Class I = Log Class II = Performance Class I = Performance Class II = Event Class I = Event Class II = Core Class I = Core Class II = Network Class II None. Switch required only if an Agent is installed.
240 240 ELM Help Switch Values Description Default Switch Values Description Default Switch Values Description Default Switch Values Description Default Switch Values Description Default Switch Values Description Default Switch Values Description Default TNT_AGENT_SILENT_SERVER "elm_server_name" This is the ELM Server to which the Service Agent will report. None. Switch required if installing ELMAgentFeature. TNT_AGENT_SILENT_SERVER_PORT "port_number" Port number of the ELM Server the Service Agent will use. None. Switch required if installing ELMAgentFeature. ex: 1251 TNT_AGENT_SILENT_PORT "port_number" Listening port for the Service Agent. None. Switch required if installing ELMAgentFeature. ex: 1253 TNT_AGENT_SILENT_CATEGORIES "category_name[;...n]" The Categories to which the Agent should be added. These must match existing ELM Server categories. None. New Agents are always added to the All Agents Category. TNT_DB_CREATE_FAILOVER "{0 1}" Create a failover database. 1 = create database. 0 = do not create database (it already exists). 0 TNT_DB_CREATE_PRIMARY "{0 1}" Create a primary database. 1 = create database. 0 = do not create database (it already exists). 0 TNT_DB_FAILOVER_SERVER "server[\named_instance]" The instance name of the ELM failover database. None. Switch required if installing ELMServerFeature.
241 Administrator Guide Switch Values Description Default Switch Values Description Default Switch Values Description Default Switch Values Description Default Switch Values Description Default Switch Values Description Default Switch Values Description Default 241 TNT_DB_FAILOVER_NAME "database_name" The name of the ELM failover database. Using only alpha, numeric, and underscore characters is recommended. None. Switch required if installing ELMServerFeature. TNT_DB_FAILOVER_USERNAME "sql_username" SQL username when SQL Authentication is used. None. Required if using ELMServerFeature and TNT_DB_FAILOVER_AUTHENTICATION = 0. TNT_DB_FAILOVER_PASSWORD "sql_password" Password for SQL Authentication. None. Required if using ELMServerFeature and TNT_DB_FAILOVER_AUTHENTICATION = 0. TNT_DB_FAILOVER_AUTHENTICATION "{0 1}" Use SQL or Windows authentication. 1 = Windows authentication. 0 = SQL authentication. None. Required if using ELMServerFeature. TNT_DB_PRIMARY_SERVER "server[\named_instance]" The instance name of the ELM primary database. None. Switch required if installing ELMServerFeature. TNT_DB_PRIMARY_NAME "database_name" The name of the ELM primary database. Using only alpha, numeric, and underscore characters is recommended. None. Switch required if installing ELMServerFeature. TNT_DB_PRIMARY_USERNAME "sql_username" SQL username when SQL Authentication is used. None. Required if using ELMServerFeature and
242 242 ELM Help TNT_DB_FAILOVER_AUTHENTICATION = 0. Switch Values Description Default Switch Values Description Default Switch Values Description Default Switch Values Description Default Switch Values Description Default Switch Values Description Default Switch Values TNT_DB_PRIMARY_PASSWORD "sql_password" Password for SQL Authentication. None. Required if using ELMServerFeature and TNT_DB_FAILOVER_AUTHENTICATION = 0. TNT_DB_PRIMARY_AUTHENTICATION "{0 1}" Use SQL or Windows authentication. 0 = Windows authentication. 1 = SQL authentication. 0 TNT_DELETE_ALL_DATABASES "{0 1}" Delete all databases during uninstall. 0 TNT_EXISTING_VERSION "{ }" Used only for upgrading or updating. None. TNT_INSTALL_ADVISOR "{0 1}" Install or do not install the ELM Advisor. 1 = Installing ELMAdvisorFeature. 0 = Not installing ELMAdvisorFeature. Should be 1 if ADDLOCAL includes ELMAdvisorFeature. Otherwise, omitted. 0. Required only when ADDLOCAL includes ELMAdvisorFeature. TNT_INSTALL_AGENT "{0 1}" Install or do not install a Service Agent. 1 = Installing ELMAgentFeature. 0 = Not installing ELMAgentFeature. Should be 1 if ADDLOCAL includes ELMAgentFeature. Otherwise, Required for all installs. TNT_INSTALL_CONSOLE "{0 1}"
243 Administrator Guide Description Default Switch Values Description Default Switch Values Description Default Switch Values Description Default Switch Values Description Default Switch Values Description Default Switch Values 243 Install or do not install the ELM Console. 1 = Installing ELMConsoleFeature. 0 = Not installing ELMConsoleFeature. Should be 1 if ADDLOCAL includes ELMConsoleFeature. Otherwise, omitted. 0. Required only when ADDLOCAL includes ELMConsoleFeature. TNT_INSTALL_MODE "{Install Change Remove}" The overall action to be performed by the ELM setup package. None. Required for all installs. TNT_INSTALL_SERVER "{0 1}" Install or do not install an ELM Server. 0 = Install ELMServerFeature. 1 = Do not install ELMServerFeature. Should be 1 if ADDLOCAL includes ELMServerFeature. Otherwise, 0. None. Required for all installs. TNT_INSTALL_WEB_VIEWER "{0 1}" Install or do not install the ELM Web Viewer. 0 = Install ELMWebViewerReportsFeature. 1 = Do not install ELMWebViewerReportsFeature. Should be 1 if ADDLOCAL includes ELMWebViewerReportsFeature. Otherwise, 0. None. Required for all installs. TNT_SERIAL_NUMBER "serial_number" Serial number for the ELM Server. Can be the word "EVALUATION" or a GUID supplied by TNT Software, Inc. None. Required only if using ADDLOCAL = "ELMServerFeature" or TNT_INSTALL_SERVER = 1. TNT_SET_ROLLOVER_ARCHIVE_DATE "{0 1}" When upgrading from ELM 5.0 or 5.5, keep the Archive database rollover date. 1 = If upgrading or updating ELMServerFeature and previous ELM Server has an archive db. 0 = otherwise. 0. Required if upgrading and archiving. TNT_SERVER_INSTALLED "{0 1}"
244 244 ELM Help Description Default Switch Values Description Default Switch Values Description Default Switch Values Description Default Switch Values Description Default Switch Values Description Default Switch Values Description Default Switch Values Is an ELM Server installed? 0 = Server is not installed. 1 = Server is installed. None. Required for all installations. TNT_SERVICE_USER_NAME "domain\username" The service account used by the ELM Server and ELM Report Scheduler services. None. Required only if using ADDLOCAL = "ELMServerFeature" or TNT_INSTALL_SERVER = 1. TNT_SERVICE_PASSWORD "strong_password" The password for the TNT_SERVICE_USER_NAME service account. None. Required only if using ADDLOCAL = "ELMServerFeature" or TNT_INSTALL_SERVER = 1. TNT_TRUSTED_MODE "{0 1}" Allows an upgrade/update if you have a "Trusted" license that has not been activated. None. Required when upgrading/updating non-activated ELM license. TNT_UNINSTALL_ADVISOR "{0 1}" Uninstall the ELM Advisor. 1 = uninstall 0= install. None. Required for all installations. TNT_UNINSTALL_AGENT "{0 1}" Uninstall the TNT Agent. 1 = uninstall 0= install. None. Required for all installations. TNT_UNINSTALL_CONSOLE "{0 1}" Uninstall the ELM Console. 1 = uninstall 0= install. None. Required for all installations. TNT_UNINSTALL_SERVER "{0 1}"
245 Administrator Guide Description Default Switch Values Description Default Switch Values Description Default Switch Values Description Default 245 Uninstall the ELM Server. 1 = uninstall 0= install. None. Required for all installations. TNT_VIRTUAL_DIRECTORY_NAME "virtual_directory_name" Name of the IIS virtual directory. None. Required only if using ELMWebViewerReportsFeature. TNT_WEB_VIEWER_INSTALLED "{0 1}" Is the ELM Web Viewer installed? 0 = do not install. 1 = install. None. Required for all installations. TNT_WEB_SITE_LIST "web_site_name" What IIS web site should host the ELM virtual directory? None. Required only if using ELMWebViewerReportsFeature. Examples Several pages follow with examples with explanations. All switches must be provided on a single line, and will typically wrap in a command prompt window. Examples have been formatted without carriage returns so they can be used to jump-start an install. Just copy/paste into a command prompt, and then edit. Values in red will typically need to be modified for your environment. Install ELM Advisor Install TNT Agent Install All Features plus Database Install All Features no Database Install Console Install Server plus Database Install All But Agent Remove Features
246 ELM Help Install ELM Advisor All switches must be provided on a single line, and will typically wrap in a command prompt window. Examples have been formatted without carriage returns so they can be used to jump-start an install. Just copy/paste into a command prompt, and then edit. Values in red will typically need to be modified for your environment. Install ELM Advisor EEM67_43.msi /qn TNT_INSTALL_MODE="Install" ADDLOCAL="ELMAdvisorFeature" INSTALL_DIR="C:\Program Files\ELM Enterprise Manager" TNT_AGENT_INSTALLED="0" TNT_SERVER_INSTALLED="0" TNT_WEB_VIEWER_INSTALLED="0" TNT_INSTALL_ADVISOR="1" TNT_INSTALL_AGENT="0" TNT_INSTALL_SERVER="0" TNT_INSTALL_WEB_VIEWER="0" TNT_UNINSTALL_ADVISOR="0" TNT_UNINSTALL_AGENT="0" TNT_UNINSTALL_CONSOLE="0" TNT_UNINSTALL_SERVER="0" Details about the Agent Install Switches: Switch Explana tion EEM67_43.msi The ELM install package for build 123. Switch Explana tion /qn MSI operation with no user interface Switch Explana tion TNT_INSTALL_MODE="Install" Perform an installation of features. Switch Explana tion ADDLOCAL="ELMAdvisorFeature" Install the ELM Advisor. This feature must match-up with a TNT_INSTALL_ADVISOR="1" switch. Switch Explana tion INSTALL_DIR="C:\Program Files\ELM Enterprise Manager" Install the Agent to a folder under Program Files. If the folder doesn't exist, it will be created. Switch Explana tion Switche s Explana TNT_AGENT_INSTALLED="0" TNT_SERVER_INSTALLED="0" TNT_WEB_VIEWER_INSTALLED="0" Think of these as a set. There is no Agent, Server or Web Viewer currently installed. TNT_INSTALL_ADVISOR="1" TNT_INSTALL_AGENT="0" TNT_INSTALL_SERVER="0" TNT_INSTALL_WEB_VIEWER="0" Think of these as a set. Install the ELM Advisor, but do not install an Agent,
247 Administrator Guide tion Switche s Explana tion Server nor a Web Viewer. Since the ELM Advisor is the only feature listed, the TNT_INSTALL_ADVISOR switch must be specified. TNT_UNINSTALL_ADVISOR="0" TNT_UNINSTALL_AGENT="0" TNT_UNINSTALL_CONSOLE="0" TNT_UNINSTALL_SERVER="0" Think of these as a set. Do not uninstall the Advisor, Agent, Console, nor Server. Install TNT Agent All switches must be provided on a single line, and will typically wrap in a command prompt window. Examples have been formatted without carriage returns so they can be used to jump-start an install. Just copy/paste into a command prompt, and then edit. Values in red will typically need to be modified for your environment. Install TNT Agent EEM67_xxx.msi /qn TNT_INSTALL_MODE="Install" ADDLOCAL="ELMAgentFeature" INSTALL_DIR="C:\Program Files\ELM Enterprise Manager" TNT_WEB_VIEWER_INSTALLED="0" TNT_SERVER_INSTALLED="0" TNT_AGENT_INSTALLED="0" TNT_INSTALL_AGENT="1" TNT_INSTALL_SERVER="0" TNT_INSTALL_WEB_VIEWER="0" TNT_AGENT_SILENT_SERVER="tokyo" TNT_AGENT_SILENT_SERVER_PORT="1251" TNT_AGENT_SILENT_PORT="1253" TNT_AGENT_SILENT_PRODUCT_CODES="6710" TNT_UNINSTALL_ADVISOR="0" TNT_UNINSTALL_AGENT="0" TNT_UNINSTALL_CONSOLE="0" TNT_UNINSTALL_SERVER="0" Details about the Agent Install Switches: Switch Explana tion EEM67_43.msi The ELM install package for build 123. Switch Explana tion /qn MSI operation with no user interface Switch Explana tion TNT_INSTALL_MODE="Install" Perform an installation of features. Switch Explana tion ADDLOCAL="ELMAgentFeature" Install a Service Agent. This feature must match-up with a TNT_INSTALL_AGENT="1" switch. Switch INSTALL_DIR="C:\Program Files\ELM Enterprise Manager"
248 248 ELM Help Explana tion Switch Explana tion Switche s Explana tion TNT_AGENT_INSTALLED="0" TNT_SERVER_INSTALLED="0" TNT_WEB_VIEWER_INSTALLED="0" Think of these as a set. There is no Agent, Server or Web Viewer currently installed. TNT_INSTALL_AGENT="1" TNT_INSTALL_SERVER="0" TNT_INSTALL_WEB_VIEWER="0" Think of these as a set. Install a Service Agent, but do not install a Server nor a Web Viewer. These must match-up with the list of features in the ADDLOCAL switch. Switch Explana tion TNT_AGENT_SILENT_SERVER="tokyo" ELM Server is installed on the computer named TOKYO. Switche s TNT_AGENT_SILENT_SERVER_PORT="1251" TNT_AGENT_SILENT_PORT="1253" Think of these as a set. The ELM Server is listening on port 1251 and the Service Agent will listen on port Explana tion Switch Explana tion TNT_AGENT_SILENT_PRODUCT_CODES="6710" Assign product code 6710 to the Agent. This needs to be an appropriate License for the Agent, and there needs to be an available license in the ELM Server. Switche s TNT_UNINSTALL_ADVISOR="0" TNT_UNINSTALL_AGENT="0" TNT_UNINSTALL_CONSOLE="0" TNT_UNINSTALL_SERVER="0" Think of these as a set. Do not uninstall the Advisor, Agent, Console, nor Server. Explana tion Install the Agent to a folder under Program Files. If the folder doesn't exist, it will be created. Install All and Create Databases All switches must be provided on a single line, and will typically wrap in a command prompt window. Examples have been formatted without carriage returns so they can be used to jump-start an install. Just copy/paste into a command prompt, and then edit. Values in red will typically need to be modified for your environment. Install All ELM Features & Create Databases
249 Administrator Guide 249 EEM67_xxx.msi /qn TNT_INSTALL_MODE="Install" ADDLOCAL="ELMServerFeature,ELMWebViewerReportsFeature,ELMConsoleFeature,ELMAdvisorFe ature,elmagentfeature" INSTALL_DIR="C:\Program Files\ELM Enterprise Manager" TNT_AGENT_INSTALLED="0" TNT_SERVER_INSTALLED="0" TNT_WEB_VIEWER_INSTALLED="0" TNT_INSTALL_AGENT="1" TNT_INSTALL_SERVER="1" TNT_INSTALL_WEB_VIEWER="1" TNT_AGENT_SILENT_SERVER="vancouver" TNT_AGENT_SILENT_SERVER_PORT="1251" TNT_AGENT_SILENT_PORT="1253" TNT_AGENT_SILENT_PRODUCT_CODES="6710" TNT_DB_CREATE_PRIMARY="1" TNT_DB_CREATE_FAILOVER="1" TNT_DB_PRIMARY_SERVER="MEGASQL" TNT_DB_FAILOVER_SERVER="vancouver\sqlexpress" TNT_DB_PRIMARY_NAME="ELM_PRIMARY" TNT_DB_FAILOVER_NAME="ELM_FAILOVER" TNT_DB_PRIMARY_AUTHENTICATION="1" TNT_DB_FAILOVER_AUTHENTICATION="1" TNT_DB_MAINTENANCE="1" TNT_SERIAL_NUMBER="Evaluation" TNT_SERVICE_USER_NAME="nyc\steve" TNT_SERVICE_PASSWORD="SecurePa$$word" TNT_VIRTUAL_DIRECTORY_NAME="ELM" TNT_WEB_SITE_LIST="Default Web Site"TNT_UNINSTALL_ADVISOR="0" TNT_UNINSTALL_AGENT="0" TNT_UNINSTALL_CONSOLE="0" TNT_UNINSTALL_SERVER="0" Details about installing all the ELM features: Switch Explanation EEM67_xxx.msi The ELM install package for current ELM build (xxx=build Number). Switch Explanation /qn MSI operation with no user interface. Switch Explanation TNT_INSTALL_MODE="Install" Perform an installation of features. Switch Explanation Switch Explanation Switches Explanation Switches ADDLOCAL="ELMServerFeature, ELMWebViewerReportsFeature, ELMConsoleFeature, ELMAdvisorFeature, ELMAgentFeature" Install the ELM Server, ELM Web Viewer, ELM Console, ELM Advisor, and a Service Agent. Since these features are listed, there must also be TNT_INSTALL_AGENT="1" TNT_INSTALL_SERVER="1" and TNT_INSTALL_WEB_VIEWER="1" switches. Additional switches are not required for ELM Console and ELM Advisor features. Do not allow spaces around any commas. INSTALL_DIR="C:\Program Files\ELM Enterprise Manager" Install features to a folder under Program Files. If the folder doesn't exist, it will be created. TNT_AGENT_INSTALLED="0" TNT_SERVER_INSTALLED="0" TNT_WEB_VIEWER_INSTALLED="0" Think of these as a set. A Service Agent, ELM Server and ELM Web Viewer are not currently installed. TNT_INSTALL_AGENT="1" TNT_INSTALL_SERVER="1" TNT_INSTALL_WEB_VIEWER="1"
250 250 ELM Help Explanation Think of these as a set. Install a Service Agent, Server, and Web Viewer. These must match-up with the list of features in the ADDLOCAL switch. Switch Explanation TNT_AGENT_SILENT_SERVER="vancouver" ELM Server is installed on the computer named VANCOUVER. Switches Explanation Switch Explanation Switches Explanation Switch Explanation Switches Explanation Switches Explanation TNT_AGENT_SILENT_SERVER_PORT="1251" TNT_AGENT_SILENT_PORT="1253" Think of these as a set. The ELM Server will listen on port 1251 and the Service Agent will listen on port TNT_AGENT_SILENT_PRODUCT_CODES="6710" Assign product code 6710 to the Agent. This needs to be an appropriate License for the Agent, and there needs to be an available license in the ELM Server. TNT_DB_CREATE_PRIMARY="1" TNT_DB_CREATE_FAILOVER="1" Think of these as a set. Create a Failover and Primary database. TNT_DB_PRIMARY_SERVER="MEGASQL" TNT_DB_FAILOVER_SERVER="vancouver\sqlexpress" The Primary database is on a server named MEGASQL. The Failover database is a named instance of SQL Express on VANCOUVER. TNT_DB_PRIMARY_NAME="ELM_PRIMARY" TNT_DB_FAILOVER_NAME="ELM_FAILOVER" Think of these as a set. The name of the Failover database is ELM_FAILOVER, and the name of the Primary database is ELM_PRIMARY. TNT_DB_PRIMARY_AUTHENTICATION="1" TNT_DB_FAILOVER_AUTHENTICATION="1" Think of these as a set. Use Windows authentication for the Failover and Primary databases. Switch Explanation TNT_DB_MAINTENANCE="1" Create the optional database maintenance job in the ELM Primary database. Switch Explanation TNT_SERIAL_NUMBER="Evaluation" Install an evaluation copy of the ELM Server. Switches Explanation TNT_SERVICE_USER_NAME="nyc\steve" TNT_SERVICE_PASSWORD="SecurePa$$word" Think of these as a set. Configure the ELM Server and ELM Report Scheduling Services to authenticate with the username steve from the domain nyc. The username steve has the password SecurePa$$word.
251 Administrator Guide Switches Explanation Switches Explanation TNT_VIRTUAL_DIRECTORY_NAME="ELM" TNT_WEB_SITE_LIST="Default Web Site" Think of these as a set. Use virtual directory name ELM. The existing web site where the ELM virtual directory will be created is called Default Web Site. TNT_UNINSTALL_ADVISOR="0" TNT_UNINSTALL_AGENT="0" TNT_UNINSTALL_CONSOLE="0" TNT_UNINSTALL_SERVER="0" Think of these as a set. Do not uninstall the Advisor, Agent, Console, nor Server. Install All and Connect to Databases All switches must be provided on a single line, and will typically wrap in a command prompt window. Examples have been formatted without carriage returns so they can be used to jump-start an install. Just copy/paste into a command prompt, and then edit. Values in red will typically need to be modified for your environment. Install All Features and Connect to Existing Databases EEM67_xxx.msi /qn TNT_INSTALL_MODE="Install" ADDLOCAL="ELMServerFeature,ELMWebViewerReportsFeature,ELMConsoleFeature,ELMAdvisorFe ature,elmagentfeature" INSTALL_DIR="C:\Program Files\ELM Enterprise Manager" TNT_AGENT_INSTALLED="0" TNT_SERVER_INSTALLED="0" TNT_WEB_VIEWER_INSTALLED="0" TNT_INSTALL_AGENT="1" TNT_INSTALL_SERVER="1" TNT_INSTALL_WEB_VIEWER="1" TNT_AGENT_SILENT_SERVER="portland" TNT_AGENT_SILENT_SERVER_PORT="1251" TNT_AGENT_SILENT_PORT="1253" TNT_AGENT_SILENT_PRODUCT_CODES="6710" TNT_DB_CREATE_FAILOVER="0" TNT_DB_CREATE_PRIMARY="0" TNT_DB_PRIMARY_SERVER="MEGASQL" TNT_DB_FAILOVER_SERVER="portland\sqlexpress" TNT_DB_PRIMARY_NAME="ELM_PRIMARY" TNT_DB_FAILOVER_NAME="ELM_FAILOVER" TNT_DB_PRIMARY_AUTHENTICATION="1" TNT_DB_FAILOVER_AUTHENTICATION="1" TNT_DB_MAINTENANCE="1" TNT_SERIAL_NUMBER="Evaluation" TNT_SERVICE_USER_NAME="nyc\steve" TNT_SERVICE_PASSWORD="SecurePa$$word" TNT_VIRTUAL_DIRECTORY_NAME="ELM" TNT_WEB_SITE_LIST="Default Web Site" TNT_UNINSTALL_ADVISOR="0" TNT_UNINSTALL_AGENT="0" TNT_UNINSTALL_CONSOLE="0" TNT_UNINSTALL_SERVER="0" Details about installing all the ELM features: Switch Explanation EEM67_43.msi The ELM install package for build 123. Switch Explanation /qn MSI operation with no user interface. Switch Explanation TNT_INSTALL_MODE="Install" Perform an installation of features.
252 252 ELM Help Switch Explanation Switch Explanation Switch Explanation Switch Explanation Switch Explanation Switch Explanation Switch Explanation Switch Explanation Switch Explanation ADDLOCAL="ELMServerFeature, ELMWebViewerReportsFeature, ELMConsoleFeature, ELMAdvisorFeature, ELMAgentFeature" Install the ELM Server, ELM Web Viewer, ELM Console, ELM Advisor, and a Service Agent. Since these features are listed, there must also be TNT_INSTALL_AGENT="1" TNT_INSTALL_SERVER="1" and TNT_INSTALL_WEB_VIEWER="1" switches. Additional switches are not required for ELM Console and ELM Advisor features. Do not allow spaces around any commas. INSTALL_DIR="C:\Program Files\ELM Enterprise Manager" Install features to a folder under Program Files. If the folder doesn't exist, it will be created. TNT_AGENT_INSTALLED="0" TNT_SERVER_INSTALLED="0" TNT_WEB_VIEWER_INSTALLED="0" Think of these as a set. A Service Agent, ELM Server and ELM Web Viewer are not currently installed. TNT_INSTALL_AGENT="1" TNT_INSTALL_SERVER="1" TNT_INSTALL_WEB_VIEWER="1" Think of these as a set. Install a Service Agent, Server, and Web Viewer. These must match-up with the list of features in the ADDLOCAL switch. TNT_AGENT_SILENT_SERVER="portland" ELM Server is installed on the computer named PORTLAND. TNT_AGENT_SILENT_SERVER_PORT="1251" TNT_AGENT_SILENT_PORT="1253" Think of these as a set. The ELM Server will listen on port 1251 and the Service Agent will listen on port TNT_AGENT_SILENT_PRODUCT_CODES="6710" Assign product code 6710 to the Agent. This needs to be an appropriate License for the Agent, and there needs to be an available license in the ELM Server. TNT_DB_CREATE_PRIMARY="0" TNT_DB_CREATE_FAILOVER="0" Think of these as a set. Do not create a Failover nor Primary database. TNT_DB_PRIMARY_SERVER="MEGASQL" TNT_DB_FAILOVER_SERVER="portland\sqlexpress" The Primary database is on a server named MEGASQL. The Failover database is a named instance of SQL Express on PORTLAND.
253 Administrator Guide Switch Explanation Switch Explanation TNT_DB_PRIMARY_AUTHENTICATION="1" TNT_DB_FAILOVER_AUTHENTICATION="1" Think of these as a set. Use Windows authentication for the Failover and Primary databases. TNT_DB_MAINTENANCE="1" Create the optional database maintenance job in the ELM Primary database. Switch Explanation TNT_SERIAL_NUMBER="Evaluation" Install an evaluation copy of the ELM Server. Explanation Switch Explanation Switch Explanation TNT_DB_PRIMARY_NAME="ELM_PRIMARY" TNT_DB_FAILOVER_NAME="ELM_FAILOVER" Think of these as a set. The name of the Failover database is ELM_FAILOVER, and the name of the Primary database is ELM_PRIMARY. Switch Explanation Switch 253 TNT_SERVICE_USER_NAME="nyc\steve" TNT_SERVICE_PASSWORD="SecurePa$$word" Think of these as a set. Configure the ELM Server and ELM Report Scheduling Services to authenticate with the username steve from the domain nyc. The username steve has the password SecurePa$$word. TNT_VIRTUAL_DIRECTORY_NAME="ELM" TNT_WEB_SITE_LIST="Default Web Site" Think of these as a set. Use virtual directory name ELM. The existing web site where the ELM virtual directory will be created is called Default Web Site. TNT_UNINSTALL_ADVISOR="0" TNT_UNINSTALL_AGENT="0" TNT_UNINSTALL_CONSOLE="0" TNT_UNINSTALL_SERVER="0" Think of these as a set. Do not uninstall the Advisor, Agent, Console, nor Server. Install Console All switches must be provided on a single line, and will typically wrap in a command prompt window. Examples have been formatted without carriage returns so they can be used to jump-start an install. Just copy/paste into a command prompt, and then edit. Values in red will typically need to be modified for your environment. Install ELM Console Only EEM67_xxx.msi /qn TNT_INSTALL_MODE="Install" ADDLOCAL="ELMConsoleFeature" INSTALL_DIR="C:\Program Files\ELM Enterprise Manager" TNT_AGENT_INSTALLED="0" TNT_SERVER_INSTALLED="0" TNT_WEB_VIEWER_INSTALLED="0"TNT_INSTALL_AGENT="0"
254 254 ELM Help TNT_INSTALL_CONSOLE="1" TNT_INSTALL_SERVER="0" TNT_INSTALL_WEB_VIEWER="0" TNT_UNINSTALL_ADVISOR="0" TNT_UNINSTALL_AGENT="0" TNT_UNINSTALL_CONSOLE="0" TNT_UNINSTALL_SERVER="0" Details about installing all the ELM features: Switch Explan ation EEM67_43.msi The ELM install package for build 123. Switch Explan ation /qn MSI operation with no user interface. Switch Explan ation TNT_INSTALL_MODE="Install" Perform an installation of features. Switch Explan ation ADDLOCAL="ELMConsoleFeature" Install the ELM Console. This feature must match-up with a TNT_INSTALL_CONSOLE="1" switch. Switch Explan ation INSTALL_DIR="C:\Program Files\ELM Enterprise Manager" Install features to a folder under Program Files. If the folder doesn't exist, it will be created. Switch TNT_AGENT_INSTALLED="0" TNT_SERVER_INSTALLED="0" TNT_WEB_VIEWER_INSTALLED="0" Think of these as a set. A Service Agent, ELM Server and ELM Web Viewer are not currently installed. Explan ation Switch Explan ation Switch Explan ation TNT_INSTALL_AGENT="0" TNT_INSTALL_CONSOLE="1" TNT_INSTALL_SERVER="0" TNT_INSTALL_WEB_VIEWER="0" Think of these as a set. Install the ELM Console, but no other feature. Since the ELM Console is the only feature listed, the TNT_INSTALL_CONSOLE switch must be specified. TNT_UNINSTALL_ADVISOR="0" TNT_UNINSTALL_AGENT="0" TNT_UNINSTALL_CONSOLE="0" TNT_UNINSTALL_SERVER="0" Think of these as a set. Do not uninstall the Advisor, Agent, Console, nor Server.
255 Administrator Guide Install Server and Create Databases All switches must be provided on a single line, and will typically wrap in a command prompt window. Examples have been formatted without carriage returns so they can be used to jump-start an install. Just copy/paste into a command prompt, and then edit. Values in red will typically need to be modified for your environment. Install ELM Server and Create Databases EEM67_xxx.msi /qn TNT_INSTALL_MODE="Install" ADDLOCAL="ELMServerFeature,ELMWebViewerReportsFeature" INSTALL_DIR="C:\Program Files \ELM Enterprise Manager" TNT_AGENT_INSTALLED="0" TNT_SERVER_INSTALLED="0" TNT_WEB_VIEWER_INSTALLED="0" TNT_INSTALL_AGENT="0" TNT_INSTALL_SERVER="1" TNT_INSTALL_WEB_VIEWER="1" TNT_DB_CREATE_PRIMARY="1" TNT_DB_CREATE_FAILOVER="1" TNT_DB_PRIMARY_SERVER="ENCABULATOR" TNT_DB_FAILOVER_SERVER="seattle\sqlexpress" TNT_DB_PRIMARY_NAME="ELM_PRIMARY" TNT_DB_FAILOVER_NAME="ELM_FAILOVER" TNT_DB_PRIMARY_AUTHENTICATION="1" TNT_DB_FAILOVER_AUTHENTICATION="1" TNT_DB_MAINTENANCE="1" TNT_SERIAL_NUMBER="Evaluation" TNT_SERVICE_USER_NAME="nyc \steve" TNT_SERVICE_PASSWORD="SecurePa$$word" TNT_VIRTUAL_DIRECTORY_NAME="ELM" TNT_WEB_SITE_LIST="Default Web Site" TNT_UNINSTALL_ADVISOR="0" TNT_UNINSTALL_AGENT="0" TNT_UNINSTALL_CONSOLE="0" TNT_UNINSTALL_SERVER="0" TNT_TRUSTED_MODE="1" Details about installing all the ELM features: Switch Explanation EEM67_43.msi The ELM install package for build 123. Switch Explanation /qn MSI operation with no user interface. Switch Explanation TNT_INSTALL_MODE="Install" Perform an installation of features. Switch Explanation ADDLOCAL="ELMServerFeature, ELMWebViewerReportsFeature" Install the ELM Server and ELM Web Viewer. Since these features are listed, there must also be TNT_INSTALL_SERVER="1" and TNT_INSTALL_WEB_VIEWER="1" switches. Do not allow spaces around any commas. Switch Explanation INSTALL_DIR="C:\Program Files\ELM Enterprise Manager" Install features to a folder under Program Files. If the folder doesn't exist, it will be created. Switch Explanation TNT_AGENT_INSTALLED="0" TNT_SERVER_INSTALLED="0" TNT_WEB_VIEWER_INSTALLED="0" Think of these as a set. A Service Agent, ELM Server and ELM Web Viewer are not currently installed.
256 256 ELM Help Switch Explanation TNT_INSTALL_AGENT="0" TNT_INSTALL_SERVER="1" TNT_INSTALL_WEB_VIEWER="1" Think of these as a set. Install the ELM Server and Web Viewer. These must match-up with the list of features in the ADDLOCAL switch. TNT_DB_CREATE_PRIMARY="1" TNT_DB_CREATE_FAILOVER="1" Think of these as a set. Create a Failover and Primary database. TNT_DB_PRIMARY_SERVER="ENCABULATOR" TNT_DB_FAILOVER_SERVER="seattle\sqlexpress" The Primary database is on a server named MEGASQL. The Failover database is a named instance of SQL Express on VANCOUVER. TNT_DB_PRIMARY_NAME="ELM_PRIMARY" TNT_DB_FAILOVER_NAME="ELM_FAILOVER" Think of these as a set. The name of the Failover database is ELM_FAILOVER, and the name of the Primary database is ELM_PRIMARY. TNT_DB_PRIMARY_AUTHENTICATION="1" TNT_DB_FAILOVER_AUTHENTICATION="1" Think of these as a set. Use Windows authentication for the Failover and Primary databases. TNT_DB_MAINTENANCE="1" Create the optional database maintenance job in the ELM Primary database. TNT_SERIAL_NUMBER="Evaluation" Install an evaluation copy of the ELM Server. TNT_SERVICE_USER_NAME="nyc\steve" TNT_SERVICE_PASSWORD="SecurePa$$word" Think of these as a set. Configure the ELM Server and ELM Report Scheduling Services to authenticate with the username steve from the domain nyc. The username steve has the password SecurePa$$word. TNT_VIRTUAL_DIRECTORY_NAME="ELM" TNT_WEB_SITE_LIST="Default Web Site" Think of these as a set. Use virtual directory name ELM. The existing web site where the ELM virtual directory will be created is called Default Web Site. Switch TNT_UNINSTALL_ADVISOR="0" TNT_UNINSTALL_AGENT="0" TNT_UNINSTALL_CONSOLE="0"
257 Administrator Guide Explanation TNT_UNINSTALL_SERVER="0" Think of these as a set. Do not uninstall the Advisor, Agent, Console, nor Server. Install Server, Web Viewer, Console and Create Databases All switches must be provided on a single line, and will typically wrap in a command prompt window. Examples have been formatted without carriage returns so they can be used to jump-start an install. Just copy/paste into a command prompt, and then edit. Values in red will typically need to be modified for your environment. Install ELM Server, Web Viewer, ELM Console, and Create Databases EEM67_43.msi /qn TNT_INSTALL_MODE="Install" ADDLOCAL="ELMServerFeature,ELMWebViewerReportsFeature,ELMConsoleFeature" INSTALL_DIR="C:\Program Files\ELM Enterprise Manager" TNT_AGENT_INSTALLED="0" TNT_SERVER_INSTALLED="0" TNT_WEB_VIEWER_INSTALLED="0" TNT_INSTALL_AGENT="0" TNT_INSTALL_SERVER="1" TNT_INSTALL_WEB_VIEWER="1" TNT_DB_CREATE_PRIMARY="1" TNT_DB_CREATE_FAILOVER="1" TNT_DB_PRIMARY_SERVER="RETRO" TNT_DB_FAILOVER_SERVER="arnada\sqlexpress" TNT_DB_PRIMARY_NAME="ELM_PRIMARY" TNT_DB_FAILOVER_NAME="ELM_FAILOVER" TNT_DB_PRIMARY_AUTHENTICATION="1" TNT_DB_FAILOVER_AUTHENTICATION="1" TNT_DB_MAINTENANCE="1" TNT_SERIAL_NUMBER="Evaluation" TNT_SERVICE_USER_NAME="nyc\steve" TNT_SERVICE_PASSWORD="SecurePa$$word" TNT_VIRTUAL_DIRECTORY_NAME="ELM" TNT_WEB_SITE_LIST="Default Web Site" TNT_UNINSTALL_ADVISOR="0" TNT_UNINSTALL_AGENT="0" TNT_UNINSTALL_CONSOLE="0" TNT_UNINSTALL_SERVER="0" Details about installing all the ELM features: Switch Explanation EEM67_43.msi The ELM install package for build 123. Switch Explanation /qn MSI operation with no user interface. Switch Explanation TNT_INSTALL_MODE="Install" Perform an installation of features. Switch Explanation ADDLOCAL="ELMServerFeature, ELMWebViewerReportsFeature, ELMConsoleFeature" Install the ELM Server, ELM Web Viewer, and ELM Console. Since these features are listed, there must also be TNT_INSTALL_SERVER="1", TNT_INSTALL_WEB_VIEWER="1", TNT_INSTALL_CONSOLE="1" switches. Do not allow spaces around any commas. Switch Explanation INSTALL_DIR="C:\Program Files\ELM Enterprise Manager" Install features to a folder under Program Files. If the folder doesn't exist,
258 258 ELM Help it will be created. Switch Explanation Switch Explanation Switch Explanation Switch Explanation Switch Explanation Switch Explanation TNT_AGENT_INSTALLED="0" TNT_SERVER_INSTALLED="0" TNT_WEB_VIEWER_INSTALLED="0" Think of these as a set. A Service Agent, ELM Server and ELM Web Viewer are not currently installed. TNT_INSTALL_AGENT="0" TNT_INSTALL_SERVER="1" TNT_INSTALL_WEB_VIEWER="1" Think of these as a set. Install the ELM Server and Web Viewer. These must match-up with the list of features in the ADDLOCAL switch. TNT_DB_CREATE_PRIMARY="1" TNT_DB_CREATE_FAILOVER="1" Think of these as a set. Create a Failover and Primary database. TNT_DB_PRIMARY_SERVER="RETRO" TNT_DB_FAILOVER_SERVER="arnada\sqlexpress" The Primary database is on a server named MEGASQL. The Failover database is a named instance of SQL Express on VANCOUVER. TNT_DB_PRIMARY_NAME="ELM_PRIMARY" TNT_DB_FAILOVER_NAME="ELM_FAILOVER" Think of these as a set. The name of the Failover database is ELM_FAILOVER, and the name of the Primary database is ELM_PRIMARY. TNT_DB_PRIMARY_AUTHENTICATION="1" TNT_DB_FAILOVER_AUTHENTICATION="1" Think of these as a set. Use Windows authentication for the Failover and Primary databases. Switch Explanation TNT_DB_MAINTENANCE="1" Create the optional database maintenance job in the ELM Primary database. Switch Explanation TNT_SERIAL_NUMBER="Evaluation" Install an evaluation copy of the ELM Server. Switch Explanation TNT_SERVICE_USER_NAME="nyc\steve" TNT_SERVICE_PASSWORD="SecurePa$$word" Think of these as a set. Configure the ELM Server and ELM Report Scheduling Services to authenticate with the username steve from the domain nyc. The username steve has the password SecurePa$$word.
259 Administrator Guide Switch Explanation Switch Explanation TNT_VIRTUAL_DIRECTORY_NAME="ELM" TNT_WEB_SITE_LIST="Default Web Site" Think of these as a set. Use virtual directory name ELM. The existing web site where the ELM virtual directory will be created is called Default Web Site. TNT_UNINSTALL_ADVISOR="0" TNT_UNINSTALL_AGENT="0" TNT_UNINSTALL_CONSOLE="0" TNT_UNINSTALL_SERVER="0" Think of these as a set. Do not uninstall the Advisor, Agent, Console, nor Server. Uninstall Features All switches must be provided on a single line, and will typically wrap in a command prompt window. Examples have been formatted without carriage returns so they can be used to jump-start an install. Just copy/paste into a command prompt, and then edit. Values in red will typically need to be modified for your environment. Uninstall ELM Advisor ELM67_xxx.msi /qnx REMOVE="ELMAdvisorFeature" Details about installing all the ELM features: Switch Explanation EEM67_43.msi The ELM install package for build 123. Switch Explanation /qnx MSI operation with no user interface, and uninstall the product. Switch Explanation REMOVE="ELMAdvisorFeature" Uninstall the ELM Advisor. Uninstall TNT Agent EEM67_xxx.msi /qnx REMOVE="ELMAgentFeature" Details about installing all the ELM features: Switch Explanation Switch EEM67_43.msi The ELM install package for build 123. /qnx
260 260 ELM Help Explanation MSI operation with no user interface, and uninstall the product. Switch Explanation REMOVE="ELMAgentFeature" Uninstall the ELM Advisor. Uninstall All Features and Delete Databases EEM67_xxx.msi /qnx REMOVE="ELMServerFeature,ELMWebViewerReportsFeature,ELMConsoleFeature,ELMAdvisorFeat ure,elmagentfeature" TNT_DELETE_ALL_DATABASES="1" Details about installing all the ELM features: Switch Explanation EEM67_43.msi The ELM install package for build 123. Switch Explanation /qnx MSI operation with no user interface, and uninstall the product. Switch Explanation REMOVE="ELMServerFeature, ELMWebViewerReportsFeature, ELMConsoleFeature, ELMAdvisorFeature, ELMAgentFeature" Uninstall all features. Do not allow spaces around any commas. Switch Explanation TNT_DELETE_ALL_DATABASES="1" Delete the ELM databases. Uninstall ELM Server and Delete Databases EEM67_xxx.msi /qnx REMOVE="ELMConsoleFeature" Details about installing all the ELM features: Switch Explanation EEM67_43.msi The ELM install package for build 123. Switch Explanation /qnx MSI operation with no user interface, and uninstall the product. Switch Explanation REMOVE="ELMConsoleFeature" Uninstall the ELM Console. Uninstall ELM Server and Delete Databases EEM67_xxx.msi /qnx REMOVE="ELMServerFeature,ELMWebViewerReportsFeature" TNT_DELETE_ALL_DATABASES="1"
261 Administrator Guide 261 Details about installing all the ELM features: 4.3 Switch Explanation EEM67_43.msi The ELM install package for build 123. Switch Explanation /qnx MSI operation with no user interface, and uninstall the product. Switch Explanation REMOVE="ELMServerFeature, ELMWebViewerReportsFeature" Uninstall the ELM Server and Web Viewer features. Do not allow spaces around any commas. Switch Explanation TNT_DELETE_ALL_DATABASES="1" Delete the ELM databases. Security Guide The ELM Security Guide provides ELM administrators details on the following topics: Introduction Security Guidelines Configuring ELM Server Security Security Introduction ELM is a client/server application that automates a variety of the administrative functions required for monitoring and managing Windows-based servers and TCP/IP systems and devices. Since ELM is intended for system and network administrators, the default out-of-box security configuration is designed to allow only accounts with administrative rights to add, remove or change ELM settings. ELM has the following main components: ELM Server ELM Server Database Agents ELM Console ELM Advisor Each of the components can be secured at a granular level, enabling administrators to delegate permissions to individual users, groups, or class of user. ELM Server Security
262 262 ELM Help There are multiple layers of security that surround an ELM Server: Setup / Installation - To install an ELM Server, you must be logged into an account with administrative rights on the computer. Without these rights, setup will not be able to create the ELM Server service, write the appropriate registry entries, register DCOM classes, or grant log on as a service rights to the ELM Server service account. Server Agents - To install a Service Agent on a computer, you must be logged on an account with administrative rights on the Agent computer. Without those rights, you will not be allowed to copy the Agent binaries to the target system, create the TNT Agent service, or grant log on as a service rights to the Agent service account. When you install a Service Agent through the ELM Console, all files are copied from the ELM Console computer to the Agent computer. If your currently logged on account does not have administrative rights on the Agent computer, a Connect As dialog will appear, allowing you to specify alternate credentials (e.g., a local administrator username and password). Management Console Communication between the ELM Server and the ELM Console or ELM Advisor is done with Distributed COM (DCOM). The ELM Server service requires DCOM Allow Access permissions to the ELM Console and ELM Advisor. In turn, users running the ELM Console or ELM Advisor require DCOM Allow Launch permissions to the ELM Server. ELM uses integrated Windows Security (NTLM or Kerberos depending on the Server and Agent OS) for authenticating users. Some of the functions won't succeed (such as killing a task or managing services) unless you have administrative rights on the computer being monitored. ELM supports object and item-level security through the ELM Console. This means that you can apply Windows Access Control Lists (ACLs) to objects in your ELM hierarchy. Data Encryption - ELM incorporates proprietary data encryption. All data sent between the following components is encrypted using this mechanism: Communication between a Service Agent and an ELM Server. Communication between two ELM Servers (via the Forward Event Notification Method) Data sent between the Server and its database, the Server and the Management Console, the Server and Virtual Agents, and between the Server and IP Agents is not natively encrypted. Note If desired, you may configure additional encryption. Data between the Server and the Console can be encrypted by setting packet-level authentication via the Windows DCOM Configuration Utility (DCOMCNFG), also known as the Component Services snap-in. Refer to this utility's help file for instructions on configuring DCOM encryption. Because this additional encryption adds substantial overhead to the system, we recommend against using DCOM packet encryption. Integrated Security - ELM integrates with Windows security to secure objects and containers in the ELM configuration. Windows Security access control lists are checked when users use the
263 Administrator Guide 263 MMC Management Console, Web Viewer, or the ELM COM interfaces. You may assign or explicitly deny the following types of access to users and groups: Read Only Read, Write, Delete Full Control The default security settings for all objects and items are: Administrators - Full Control Everyone - Read Only Integrated Auditing - ELM supports auditing of access and modification to ELM Server objects. This enables administrators to audit configuration changes to ELM Server objects Security Guidelines ELM uses integrated Windows Security (NTLM or Kerberos depending on the Server and Agent OS) to authenticate users. Some of the functions won't work (such as killing a task or managing services) unless you have administrative rights on the monitored computer. ELM supports object and item-level security through the snap-in UI. You may apply Windows Access Control Lists (ACLs) to objects in your ELM Console. DCOM Permissions Communication between the ELM Server and the ELM Console or ELM Advisor is done with Distributed COM (DCOM). The ELM Server service requires DCOM Allow Access permissions to the ELM Console and ELM Advisor. In turn, users running the ELM Console or ELM Advisor require DCOM Allow Launch permissions to the ELM Server. DCOM Allow Access permissions are granted to the Authenticated Users group by the ELM setup program when the ELM Console is installed. This automatic configuration is denoted by the green arrow in the diagram below. DCOM Allow Launch permissions need to be granted on the ELM Server computer by an Administrator. This manual configuration requirement is denoted by the orange arrow in the diagram below. These permissions may be viewed and edited via the DCOM Configuration Utility (DCOMCNFG.exe). To manage these permissions, use the steps below.
264 264 ELM Help Allow Access These steps should be done automatically by ELM setup. In Windows XP, Vista, Windows 7, Windows 2003, or Windows 2008: 1. Launch DCOMCNFG. 2. Expand Component Services, then Computers, then My Computer, and finally DCOM Config. 3. Scroll down to ELM.Advisor.exe. 4. Right-click and select Properties. 5. Select the Security tab. 6. In the Access Permission area, click the Edit button. 7. Verify that Authenticated Users has Allow for Local Access and Remote Access. 8. Repeat steps 3-7 for MMC Application Class. Note In some cases, the ELM Setup package does not have permissions to the MMC Application Class DCOM application. When this happens you will typically see the Use Default radio button selected, and Authenticated Users will be granted Access at the My Computer level. 9. Close DCOMCNFG. You may have to reboot each system in order for the DCOM security changes to take effect. Allow Launch These steps need to be manually verified and completed, as necessary. In Windows XP, Vista, Windows 7, Windows 2003, or Windows 2008: 1. Launch DCOMCNFG. 2. Expand Component Services, then Computers, then My Computer, and finally DCOM Config. 3. Scroll down to TNT Software ELM Enterprise Manager. 4. Right-click and select Properties. 5. Select the Security tab. 6. In the Launch and Activation Permissions area, select the Custom radio button, and click the Edit button. 7. Verify that ELM Console users, or an equivalent group, have Allow for Local and Remote, Launch and Activation. 8. Close DCOMCNFG. You may have to reboot each system in order for the DCOM security changes to take effect.
265 Administrator Guide 265 Note Because communication between an ELM Server and an ELM Console is COM-based, TCP port 135 (RPC endpoint mapper) must be open between the communicating end-points. DCOM also uses RPC dynamic port allocation. By default, RPC dynamic port allocation randomly selects port numbers above You can control which ports RPC dynamically allocates for incoming communication and then configure your firewall to confine incoming external communication to only those ports (and TCP/ UDP port 135). NetBIOS/RPC When using a Virtual Agent to monitor a Windows system (e.g., to collect events, monitor services, etc.), monitoring is performed by the ELM Server. The ELM Server makes RPC Win32 API calls to execute Monitor Items and collect data. There must be NetBIOS and RPC connectivity between the ELM Server and the Virtual Agent. Firewalls and Port Blocking If you intend to use Virtual Agents in a firewall environment (IE putting a firewall between the ELM Server and ELM Virtual Agent), or put a firewall between the ELM Server and ELM Console, network communication is RPC based. TCP port 135 (RPC endpoint mapper) must be open between the communicating end-points. DCOM also uses RPC dynamic port allocation. By default, RPC dynamic port allocation randomly selects port numbers above You can control which ports RPC dynamically allocates for incoming communication and then configure your firewall to confine incoming external communication to only those ports (and TCP/UDP port 135). For more information on DCOM and firewalls, see Microsoft's White Paper about Using DCOM with Firewalls Configuring ELM Server Security ELM integrates with Windows security to provide item-level security on objects and items within the ELM Console. This enables you to selectively set security on the individual objects and containers, including: ELM Server Agents Monitoring Categories Monitor Items Event Filters Notification Methods Event Views Performance Data container Performance Counters Configuring Integrated Security To view or configure security on an item: 1. Right-click on the item you wish to secure and select Security. If Security is not an option on the context menu, you are not able to secure this item. 2. The permissions for the item and the list of Access Control Entries (ACEs) will be displayed.
266 266 ELM Help Click the Add button to add a user or group to the list of ACEs. Click the Remove button to remove the selected user or group from the list of ACEs. Click the Advanced button to view and modify advanced security settings such as Special Access and Inheritance. ELM supports auditing of access and modification to ELM Server Objects. When ELM is installed, the ELM Server service account user is added to the "Generate security audits" Security Policy. This is so if auditing is turned on for ELM objects, and "Audit object access" is turned on in the Audit Policy settings, ELM will write out an audit trail for ELM object changes. In order to audit activity on ELM Server Objects, you must enable File and Object Access auditing on the ELM Server. On a Windows system, this is typically done using a security-policy snap-in (e.g., the Local Security Policy snap-in). Note As a failsafe mechanism, an ELM Server ignores all security settings when the ELM Console is run in the security context of the ELM Server service account. This is done intentionally to prevent administrators from inadvertently locking themselves out of objects. If you log on to the ELM Server using the ELM Server service account, you will be able to configure all objects, settings and features. Security will not be enforced for the session. Configuring Auditing To view or configure auditing on an item: 1. Right-click on the item you wish to secure and select Security. If Security is not an option on the context menu, then you are not able to secure or audit access to this item. 2. Click the Advanced button. 3. Select the Auditing tab. 4. Click the Add button to add a user, group, or multiple users/groups to the list of Audit entries, then click OK. Click the Edit button to edit an existing entry, or the Remove button to remove an existing entry. 5. The Auditing Entry dialog will appear. Select the items for Success and/or Failure that you wish to audit by clicking the desired checkboxes so that they are checked. 6. Select whether the audit level should apply to this object, or to this object and all child objects, from the Apply onto dropdown list. 7. Click OK to save the changes, then click Apply to apply them. 8. Click OK twice to exit the Security dialogs. 4.4 Windows Cluster Guide The ELM Cluster Guide provides ELM administrators details on the following topics: Introduction Installing ELM Server into a Cluster
267 Administrator Guide 267 Uninstalling ELM Server from a Cluster Introduction Windows Server 2003 The ELM Server Cluster Installation Guide provides information for installation of an ELM Server in a Windows 2003 Cluster Server. Clustering the ELM Server provides essential redundancy and guaranteed availability. The ELM Server includes a cluster-aware resource DLL (EEMCLR.dll), enabling you to cluster an ELM Server on Windows Server The ELM Server can be clustered in an Active/Passive configuration only, where the ELM Server runs only on one node at a given time. If you are installing the ELM Server on a node in a cluster then you must cluster the ELM Server. The only way to instantiate (start) an ELM Server that has been installed on a node in a Windows cluster is to add the ELM Server as a clustered resource. Therefore, install the ELM Server component only in a Windows 2003 cluster, and only when you intend to use the instructions below to cluster the ELM Server. There are specific configurations that must be used when installing the ELM Server in a cluster: The ELM Server requires the following dependency items in its cluster resource group: Disk Resource, IP Address Resource, and Network Name Resource. The ELM Server binaries and other files must be installed onto the Disk Resource (disk in shared storage). The ELM Server resource must be configured to use the Network Name Resource as the server name. If the ELM Server's database is also a resource in the ELM Server's resource group, you should make the ELM Server resource dependent on the database resource. When an ELM Console is connected to an ELM Server in a cluster, and that ELM Server fails over to another node, the ELM Console will disconnect from the ELM Server, but by design will not automatically reconnect once the ELM Server is instantiated on the other node. You will need to manually reconnect to the ELM Server from within the ELM Console. Windows Server 2008 and Windows Server 2008 R2 Configuring your clustered environment to support the ELM Server is much easier on Windows Server 2008 and Windows Server 2008 R2 through the use of automatic configurations in the Generic Service option. Before actually creating the clustered service, the environment is required to be setup correctly. Please ensure that Shared Storage accessible by the nodes that the ELM Server will be installed on has been configured Installing ELM Server into a Cluster Windows Server 2003 This section provides instructions for installing the ELM Server into a Cluster. The basic steps

268 268 ELM Help involved in clustering the ELM Server are: 1. Either create a new cluster resource group, or plan to use an existing cluster resource group. This is the ELM Server resource group. 2. Install the ELM Server on one node, with the binaries on the drive representing the Disk Resource in the ELM Server resource group. 3. Move the ELM Server resource group to the other node. 4. Install the ELM Server on the second node using the same install path as the first node. 5. Add the ELM Server service as a generic resource to the ELM Server resource group. 6. Bring the ELM Server resource online. 7. During Setup, the following services (and any services dependent on the following services) will be stopped and restarted: ELM Server service (if upgrading only) ELM Report Scheduling Service (if upgrading only) TNT Agent service (if upgrading only) Using Cluster Administrator or the CLUSTER.EXE command line utility, create the ELM Server resource group and add a Disk Resource, an IP Address Resource and a Network Name Resource. Size the Disk Resource accordingly, depending on whether or not you are using an ELM Server database that will also reside on this Disk Resource. For details on how to do this, please refer to the Windows Help File/Help & Support Center, Microsoft TechNet and MSDN. If you plan to add the ELM Server resource to an existing resource group, you are not required to create a new group. Figure 1 illustrates an example of an ELM Server Resource Group before an ELM Server is added as a resource. Figure 1 - ELM Server Resource Group Ready for ELM Server Installation Install the ELM Server 1. Double-click the ELM67_nnn.msi file you downloaded to execute it (where nnn is the build number). The Setup Wizard will launch. 2. Click Next to continue. The License Agreement screen will appear. 3. Select I accept the license agreement and click Next to continue. The ReadMe Information screen will appear. 4. Read the contents of the ReadMe file and click Next to continue. The Select Features screen will appear. 5. Select the ELM Server product you wish to install and click Next to continue. 6. Select the destination folder. Using Figure 1 as an example, an ELM Enterprise Manager
269 Administrator Guide 269 Server will be installed into the E:\Program Files\ELM Enterprise folder. 7. Enter the Company Name and Serial Number as it appears on your SLA. If this is an evaluation version, enter the Company Name and leave the Serial Number field set to EVALUATION. If this is an evaluation version, the expiration date will be displayed when you click Next. If this is a non-eval version, a confirmation dialog will appear when you click Next. Click Next to continue, and click OK to clear the dialog message that appears. The Service Account Logon screen will be displayed. 8. In the Username field, enter the account to use for the service account. This account must have administrative rights on the ELM Server and on all Windows-based Virtual Agents. Enter the password for this account in the Password field. Click Next to continue. Note If the account specified in the preceding step does not already have Log on as a Service rights on the ELM Server, the Setup process will grant this right to the account. 9. The Database settings readme dialog is displayed. Read the information contained here and click Next to continue. 10.Complete the Primary Database settings dialog to configure the ELM Server primary database. If the database does not exist you will have the option to create it. Click Next to continue. 11.Complete the Failover Database settings dialog to configure the ELM Server failover database. The failover database is used when the Primary database is offline. If the database does not exist you will have the option to create it. Click Next to continue. 12.Complete the Virtual Directory settings dialog to configure the IIS virtual directory and click Next to continue. 13.The Ready to Install the Application screen will appear. 14.Click Install to start the installation. Setup will copy the files to the destination folder, register its components, install the ELM Server service and configure the IIS virtual directory. 15.Click Finish to complete Setup. 16.Stop the ELM Server service and set it to Manual startup. 17.Using Cluster Administrator or CLUSTER.EXE, move the ELM Resource Group to the other node. 18.On this node, execute the Setup MSI file. The Setup Wizard will launch. Complete an Installation identical to the setup on NODE1. 19.Stop the ELM Server service and set it to Manual startup. Add the ELM Server to the ELM Server resource group 1. Right-click on the ELM Server resource group and select Configure Application. The Cluster Application Wizard will launch. 2. Click Next to continue. The Select or Create a Virtual Server screen will appear. Choose Use an existing virtual server and select the ELM Resource Group from the dropdown list. 3. Click Next to continue. The Create Application Cluster Resource screen will appear. Select Yes, create a cluster resource for my application now. 4. Click Next to continue. On the Application Resource Type screen, select Generic Service from the dropdown. 5. Click Next to continue. The Application Resource Name and Description screen will appear. In the Name field, enter ELM Enterprise Manager Server. Enter an optional description. 6. Click the Advanced Properties button. Select the Dependencies tab, then click the
270 270 ELM Help Modify button. Add the Disk, IP and Network Name resources as dependencies. If the ELM Server's database is a SQL Server virtual server that also exists in the ELM Server resource group, then you should also make the ELM Server resource dependent on the database virtual server. 7. Click Next to continue. The Generic Service parameters screen will appear. In the Service Name field, enter EEMSVR. Check the box that says Use Network Name for computer name. 8. Click Next to continue. The Registry replication screen will appear. Click the Add button. In the Root Registry Key field, enter the HKLM Software hive: SOFTWARE\TNT Software \ELM Enterprise Manager. 9. Click Next to continue, then click Finish to complete creation of the ELM Server resource. 10.Bring the ELM Server resource online in Cluster Administrator. This completes the installation of the ELM Server in a cluster. We recommend testing failover prior to attaching to the ELM Server with an ELM Console. You can use the Move Group function in Cluster Administrator to manually failover the group. If you have any questions about this procedure, of if you would like assistance performing this procedure, please contact the TNT Software Product Support Group. Windows Server 2008 and Windows Server 2008 R2 1. Install the ELM Server on two nodes. Use the same databases both Primary and Failover for each installation. 2. In the Failover Cluster Manager, select Services and Applications under the cluster you re installing to. Select Configure a Service or Application from the list of Actions in the right pane. 3. In the High Availability Wizard, on the Select Service or Application panel, select Generic Service and select Next. 4. On the Select Service panel, select the ELM Enterprise Manager 6.7 Server and select Next. 5. On the Client Access Point panel, enter the name that the ELM Console will use to connect to the Server and select Next. 6. On the Select Storage panel, select an available storage location and select Next. 7. On the Replicate Registry Settings panel, use one of the following paths under HKEY_LOCAL_MACHINE: a. X86: SOFTWARE\TNT Software b. X64: SOFTWARE\Wow6432Node\TNT Software 8. On the Confirmation panel, select Next. At this point, the ELM Server service will be configured for high availability. To access the Server using the ELM Console, use the hostname specified on the Client Access Point panel. Note that the ELM Server service should now be set to start manually, as it s controlled directly by the Cluster services. If Windows Cluster Service detects that the ELM Server Service has failed, it ll automatically start the Server on the secondary node. Reconnecting to the Server with the ELM Console will be required Uninstalling ELM Server from a Cluster Windows Server 2003
271 Administrator Guide 271 This section provides instructions for uninstalling the ELM Server from a Cluster. 1. Uninstall any Agents that monitored by this ELM Server by deleting them from the All Agents container in the ELM Console. 2. Close any open ELM Consoles that are connected to this Server. 3. Take the ELM Server resource offline, and then delete it (just the resource and not the resource group). Make sure that its Disk Resource remains online or it will not be able to remove the ELM program files or un-register the cluster resource DLL. Note Deleting the ELM Server resource is necessary to ensure that the ELM Server's cluster resource DLL gets unregistered and uninstalled properly. 1. Go into Control Panel and double-click Add/Remove Programs. 2. Select the ELM product that is installed and click the Change button. The Installation Wizard will launch. 3. Select Remove, and click Next to continue. 4. Click Next to begin the uninstall process. 5. Click Finish to complete the uninstall process for this node. 6. Move the ELM Server resource group to the other node, and make sure that the Disk Resource remains online. 7. On the remaining node, go into Control Panel and double-click Add/Remove Programs. 8. Select the ELM product that is installed and click the Change button. The Installation Wizard will launch. 9. Select Remove, and click Next to continue. 10.Click Next to begin the uninstall process. 11.Click Finish to complete the uninstall process for this node. If you have any questions about this procedure, of if you would like assistance performing this procedure, please contact the TNT Software Product Support Group. Windows Server 2008 and Windows Server 2008 R2 To uninstall the ELM Server service from the clustered environment, take the following steps: 1. In the Failover Cluster Manager, expand the Services and Applications node, right click the ELM Server service, and select Delete. Confirm the action. 2. After the service no longer is displayed in the Failover Cluster Manager (this may take some time), remove the ELM Server using the Windows Programs and Features in the Control Panel on any node that it s installed on. 4.5 Troubleshooting Guide The ELM Troubleshooting Guide provides ELM administrators details on the following topics: Introduction Troubleshooting Installation Troubleshooting Service Agents
272 272 ELM Help Troubleshooting Agent Communications Troubleshooting ELM Console Communications Introduction This section provides troubleshooting details on several ELM components. In addition to this information, please see the TNT Software Knowledge Base for additional troubleshooting topics. If you are still unable to resolve your issues, please contact TNT Software Support: TNT Software Product Support Group Hours: Monday - Friday, 8:00am to 5:00pm (Pacific Time) Telephone: Support: Support@TNTSoftware.com Troubleshooting Installation ELM is distributed electronically from TNT Software's Web site ( It is a self-extracting executable that will launch the setup process: During Setup, the following services (and any services dependent on the following services) will be stopped and restarted: ELM Server service (only if upgrading) ELM Report Scheduler (only if upgrading) TNT Agent service (only if upgrading) Installing an ELM Server, ELM Console and ELM Advisor using the setup package is a straightforward process that takes less than 5 minutes to complete. If you encounter any problems during setup, or if you are unable to complete installation, first ensure that the system you are using meets the minimum requirements for installation of the component. To diagnose problems with setup, you must use the Windows Installer package (.MSI file). This file supports a command-line option that can generate a trace file of setup activity. To run setup with tracing enabled, launch the MSI file from a command prompt using command line switches for MSI and ELM similar to the following (where nnn is the build number): ELM67_nnn.msi /L*v C:\temp\MSITrace.txt TRACEFILE=C:\Temp\ELMTrace.txt When setup halts or encounters a problem, cancel or clear out of any dialog or other error messages. Open the trace files and attempt to determine the failure point and the cause of failure. The trace files may not be easily decipherable, so we encourage you to contact TNT Software's Product Support Group for assistance. Known Installation Issues
273 Administrator Guide 273 See the ELM Release Notes on the TNT Software web site for the most recent information on Known Issues Troubleshooting Service Agents If you are having problems installing an Agent, check the following: Does the ADMIN$ share exist on the Agent machine? When installing an Agent from the ELM Server, the ELM Server will attempt to connect to the ADMIN$ share on the Agent machine so that the Agent executable can be copied to the % SYSTEMROOT% folder on the Agent. If the ADMIN$ does not exist, re-create it. If this is not an option, follow the procedure for manually installing an Agent detailed below. Do you have good name resolution between the ELM Server and Agent? Can you ping the Agent by name from the ELM Server? Can you ping the ELM Server by name from the Agent? Are you able to do a NET VIEW on each system from the other system? ELM can use NetBIOS or host name resolution. Are there any firewalls between the ELM Server and this Agent? Are you able to Telnet from the Agent computer to the appropriate port on the ELM Server? By default, ELM Servers listen on TCP port Does a Netstat -ban -p tcp on the Agent computer show it listening on the appropriate port? If you run this command on the Agent computer when the TNT Agent service is stopped, does it show something else listening on port 1253 (or the configured Agent port)? If the Agent is in a DMZ or a firewall environment, you may use the ELM setup package to install the Agent remotely. Does a Netstat -ban -p tcp on the ELM Server computer show it listening on the appropriate port? If you run this command on the ELM Server computer when the ELM Server service is stopped, does it show something else listening on port 1251 (or the configured ELM Server port)? Do you have administrative rights on the Agent machine? Only Administrators can connect to the ADMIN$ share and install a new service. When you attempt to install an Agent, ELM will try to use your existing credentials to authenticate to the Agent machine. If authentication fails, you will be presented with a Connect As dialog box, which can be used to specify alternate credentials (e.g., local administrator username and password.)
274 274 ELM Help Note The Connect As dialog box does not support blank passwords. If you do not enter a password, the connection will fail. To workaround this limitation, go to a command prompt on the ELM Server machine and make a connection to the IPC$ share on the Agent machine using the following syntax: net use \\SERVERNAME\IPC$ /user:abcde\12345 where: SERVERNAME is the name of the Agent machine ABCDE is the name of the domain or machine containing the account you're using is the name of the account with administrative rights on SERVER To remove the connection, use the command: net use \\SERVERNAME\IPC$ /d where: SERVERNAME is the name of the Agent machine Are there any services in a Stop Pending or Start Pending state on the Agent? This may prevent ELM from installing an Agent service. You can check service status details in the Windows Service Control Manager tool. If you see any Start Pending or Stop Pending services, you must see them at a stable state (Running or Stopped) before you can install the Agent service. Have any special security modifications been made to the Agent system? These include things like restrictive registry or NTFS permissions, revoking of user rights assignments, and the removal of the ADMIN$ share. If none of these solutions resolve your issue, please contact TNT Software's Product Support Group for assistance. Manual Agent Installation If the Agent you want to monitor is on the other side of a firewall, in a DMZ environment, or located in an environment that restricts the use of NetBIOS and RPC endpoint ports, you can use the Setup package to install an Agent on the remote system and then use the Agent UI to register the Agent with the ELM Server and select monitor items for the Agent. You'll want to pay particular attention to steps 9 and 11 below, as the TCP ports chosen will need to be open on your firewall in the appropriate direction. To install a Service Agent using Setup: 1. Copy the ELM Setup package to the target computer and execute the file to begin the install. 2. The Installation Welcome screen will appear. Click Next to continue.
275 Administrator Guide The License Agreement screen will appear. Read the license agreement and indicate your acceptance of its terms by selecting I accept the license agreement. Click Next to continue. 4. The Select Features screen will appear: Click Click Click Click Server and choose Entire feature will be unavailable. Console and choose Entire feature will be unavailable. Agent and choose Will be installed on local hard drive. Advisor and choose Entire feature will be unavailable. 7. Click Next to continue, and then Install to initiate installation. The Agent executable and support files will be installed. When the installation has completed, the Register Server Computer Wizard will launch. 8. In the Name field, enter the host name, IP address or fully-qualified domain name for the ELM Server you want to register. If desired, click the Browse button to browse the network for the ELM Server you want to register. 9. In the Port field for the ELM Server, enter the TCP port on which the ELM Server is listening. By default, ELM Servers listen on TCP port In the Port field for the Service Agent, enter the TCP port on which the Service Agent should listen. By default, ELM Service Agents listen on TCP port Click Next to continue. You will be prompted to authenticate to the ELM Server computer next. Enter the Username using the pattern domainname\username. 11.In the Licenses dialog, select the type of monitoring that you want to have ELM licensed for, such as System Class I. Click Next to continue. 12.The Agent Categories dialog box will appear. Put a check in the box to the left of each Category you want to assign to this Agent. You can view the properties of any Category by right-clicking the Category and selecting Properties. 13.Click Finish to save the Agent settings and ELM Server registration. 14.When installation completes, a success dialog is displayed. Click Finished to close the dialog. To Uninstall a Service Agent That Was Installed Using Setup: 1. Open the Control Panel and double-click Add/Remove Programs. 2. Select the ELM Enterprise Manager program, and click the Change button. 3. Select Remove and proceed through the Wizard. 4. If there are other ELM components installed on this system and you do not want to remove them, select Modify and continue through the Wizard. When the component dialog is shown, change the Service Agent from Will be installed on local hard drive to Entire feature will be
276 276 ELM Help unavailable. Then, complete the Wizard to remove it. 5. When uninstall completes, a success dialog is displayed. Click Finished to close the dialog Troubleshooting Agent Communications If a Service Agent does not send, or does not appear to be sending data to your ELM Server, there a few things to check to verify the product is installed and configured properly: Is the TNT Agent service running, or is the Agent disabled? The Agent will monitor, collect and transmit data only when the TNT Agent service is running and the Agent is enabled. Has the Agent been configured to collect data? From the ELM Console, right click on the Agent that is not sending data, select properties and look at the Monitor Items tab. For example, if performance data is not being received, verify that the appropriate Performance Collector monitor item(s) are selected and enabled. Do you still have IP connectivity and good name resolution between the ELM Server and Agent? IP connectivity and healthy name resolution are essential for ELM to operate properly. Have the ELM TCP/IP ports been blocked through a firewall, packet filtering or some other mechanism? By default, the TNT Agent listens on TCP port 1253, and the ELM Server listens on TCP port Try telnetting to the appropriate ports in each direction: From the ELM Server, try to Telnet to port 1253 on the Agent From the Agent, try to Telnet to port 1251 on the ELM Server When you establish a Telnet session in either direction, press <ENTER> two times. You should receive version information and the connection will be closed. If you do not receive this message, or if you are unable to connect to the port, check the following: On the end that fails, run netstat -a -p tcp at a command prompt. This will show all TCP listening ports and connections. You should see the Agent listening on TCP port 1253 and the ELM Server listening on TCP port If you do not see this entry, restart the application at the failed end (either Agent or ELM Server). Does the Agent Status show a registered ELM Server? In the ELM Console, open the Properties of the Agent and navigate to the Agent Status tab. This will display the Agent's status, which may indicate a problem, such as a failure to execute a monitor item or a failure to communicate with the ELM Server. Is the Agent in cache mode? If the Agent is unable to transmit data to the ELM Server, the Agent will go into cache mode. Each time the Agent has something new to send (e.g., a new event, or collected performance
277 Administrator Guide 277 data), it checks to see if it can connect to the ELM Server. If it can, it will send its cache. The Agent Status tab can display whether or not an Agent is in cache mode. If none of these suggestions resolve your issue, please contact TNT Software's Product Support Group for assistance Troubleshooting ELM Console The ELM Console communicates with the Session Manager component of the ELM Server process. This communication is completely COM-based. DCOM and RPC connections are made between the ELM Server and the ELM Console to facilitate the transfer of data. If you are not able to connect to an ELM Server from an ELM Console, or if you are able to connect but cannot receive any information, check the following: Do you still have IP connectivity and good name resolution between the ELM Server and the ELM Console? IP connectivity and healthy name resolution are essential for ELM to operate properly. Are DCOM ports been blocked through a firewall, packet filtering or some other mechanism? Because all communication between an ELM Server and an ELM Console are DCOM calls that occur via RPC, TCP, and UDP, port 135 (RPC Endpoint Mapper port) must be open between the Server and the Console. DCOM also uses RPC dynamic port allocation. By default, RPC dynamic port allocation randomly selects port numbers above You can control which ports RPC dynamically allocates for incoming communication and then configure your firewall to confine incoming external communication to only those ports (and TCP/UDP port 135). For more information on DCOM and firewalls, refer to Microsoft's White Paper about Using DCOM with Firewalls. On each end, run netstat -a at a command prompt and verify that each side is listening on TCP/ UDP port 135. You should see them listed like the following: TCP UDP server:epmap server:epmap server:0 *:* LISTENING where server is the name of your ELM Server or ELM Console, depending on which computer you run netstat. Do the proper accounts have DCOM Allow Access and Allow Launch permissions? Communication between the ELM Server and the ELM Console or ELM Advisor is done with Distributed COM (DCOM). The ELM Server service requires DCOM Allow Access permissions to the ELM Console and ELM Advisor. In turn, users running the ELM Console or ELM Advisor require DCOM Allow Launch permissions to the ELM Server. DCOM Allow Access permissions are granted to the Authenticated Users group by the ELM setup program when the ELM Console is installed. This automatic configuration is denoted by the green arrow in the diagram below. DCOM Allow Launch permissions need to be granted on the ELM Server computer by an Administrator. This manual configuration requirement is denoted by the

278 278 ELM Help orange arrow in the diagram below. These permissions may be viewed and edited via the DCOM Configuration Utility (DCOMCNFG.exe). To manage these permissions, use the steps below. Allow Access These steps should be done automatically by ELM setup. In Windows XP, Vista, Windows 7, Windows 2003, or Windows 2008: 1. Launch DCOMCNFG. 2. Expand Component Services, then Computers, then My Computer, and finally DCOM Config. 3. Scroll down to ELM.Advisor.exe. 4. Right-click and select Properties. 5. Select the Security tab. 6. In the Access Permission area, click the Edit button. 7. Verify that Authenticated Users has Allow for Local Access and Remote Access. 8. Repeat steps 3-7 for MMC Application Class. Note In some cases, the ELM Setup package does not have permissions to the MMC Application Class DCOM application. When this happens you will typically see the Use Default radio button selected, and Authenticated Users will be granted Access at the My Computer level. 9. Close DCOMCNFG. You may have to reboot each system in order for the DCOM security changes to take effect. Allow Launch These steps need to be manually verified and completed, as necessary. In Windows XP, Vista, Windows 7, Windows 2003, or Windows 2008: 1. Launch DCOMCNFG. 2. Expand Component Services, then Computers, then My Computer, and finally DCOM Config.
279 Administrator Guide Scroll down to TNT Software ELM Enterprise Manager. 4. Right-click and select Properties. 5. Select the Security tab. 6. In the Launch and Activation Permissions area, select the Custom radio button, and click the Edit button. 7. Verify that ELM Console users, or an equivalent group, have Allow for Local and Remote, Launch and Activation. 8. Close DCOMCNFG. You may have to reboot each system in order for the DCOM security changes to take effect. Note Because communication between an ELM Server and an ELM Console is COM-based, TCP port 135 (RPC endpoint mapper) must be open between the communicating end-points. DCOM also uses RPC dynamic port allocation. By default, RPC dynamic port allocation randomly selects port numbers above You can control which ports RPC dynamically allocates for incoming communication and then configure your firewall to confine incoming external communication to only those ports (and TCP/ UDP port 135). Do the proper accounts have administrative access? By default, ELM is secured for use by administrators only. If the ELM Console user does not have administrative rights on the ELM Server computer, or ACL permissions to the ELM Server object and all other objects in the hierarchy, access will be denied. Do the proper accounts have the 'Access this computer from the network' rights? If the ELM Server service account does not have this right on the ELM Console computer and/or the ELM Console user account does not have this right on the ELM Server, access will be denied. If none of these suggestions resolve your issue, please contact TNT Software's Product Support Group for assistance. Security Prompts Repeatedly for Authentication Depending on security settings in Internet Explorer, you may be prompted to authenticate when selecting an At-a-Glance view, using the ELM Reports or using the ELM Web Viewer. These prompts can be avoided in a default Windows install by adding the name of the ELM Server computer to the Local intranet zone in Internet Explorer security settings. For detailed steps, please see TNT Software Knowledge Base Article AK1. Internet Explorer Enhanced Security Internet Explorer Enhanced Security may block about:security_mmc.exe and prompt you to add it. Clicking the Add button will allow you to add this to the Trusted sites zone. Animated GIFs are Static Animated gif files, including the animated clock gif, may appear as a static gif. This may be due to a setting in Internet Explorer 7 (IE7) and above. To allow the animation to operate, check these settings:
280 280 ELM Help 1. Launch IE. 2. Select Tools->Internet Options. 3. Select the Advanced Tab. 4. Scroll to the Multimedia section. 5. Select the checkbox for Play animations in webpages*. 6. Select OK. 7. Close IE. 8. Re-launch the ELM Console (animated gifs should work now). 4.6 Technical Resources Database Settings Reference Database Settings Entries Event Reference ELM Server and TNT Agent Events Registry Settings ELM Server Registry Entries ELM Console Registry Entries ELM Service Agent Registry Entries Command Line Reference ELM Server Command Line Options Online References TNT Software Support ( Support Knowledge Base ( Software Prerequisites and Downloads ( Online Tutorials (
 \ ELM Enterprise Manager.")
281 Administrator Guide Database Settings Entries Database settings are stored in the databasesettings.xml file located in the default install folder for a 32 bit system: c: \ Program Files \ ELM Enterprise Manager and for a 64 bit system: c: \ Program Files (x86) \ ELM Enterprise Manager. Contained within the file is the documentation on how to manual edit settings. Changing Archive Rollover Settings 1. In the Database Settings dialog, create an Archive DB and set it to rollover. 2. Stop the ELM Server service. 3. Edit the databasesettings.xml file. a. If you're setting it to rollover with time-based criteria, add the following attributes to the
282 282 ELM Help "archive" node: Name: archiverolloverinterval Values: integer from Description: Sets what number of time units, as defined in the archiverolloverunit attribute, pass before a new Archive DB is created. So, if set to 3, and the archiverolloverunit is set to 86400, every 3 days a new Archive DB will be created. Name: archiverolloverunit Values: 86400, , or Description: Sets the time unit that archiverolloverinterval will use. If set to 86400, the time unit is set to days, is week s, and is months. b. If you're setting it to rollover with size-based criteria, add the following attributes to the "archive" node: Name: archiverollovermaxgb Values: integer from Description: Set the size an individual Archive DB is allowed to grow before a new one is created during the next archive event. If set to 10, then after the active Archive DB reaches a size of 10 GB or greater, the next time the archive event happens, a new database is created. c. By default, the next time a rollover is executed is 1 month in the future, and changing the above settings will not affect this. To set it to rollover immediately (after which using the changed settings), in the archive node, set datenextrollover to a non-zero low number, such as Start the ELM Server and verify that your changes are reflected correctly in the Database Settings dialog. When customizing rollover size criteria you must specify both archiverollovermaxgb and archiverolloversizecriterion in the databasesettings.xml file. Example 1: archiverolloversizecriterion=1 archiverollovermaxgb=50 Results in the database rolling over once it reaches the 50GB threshold. Example 2: archiverolloversizecriterion=0 archiverollovermaxgb=50 Results in the database rolling over based on the time attribute ignoring the 50GB threshold.
283 Administrator Guide Server and Agent Events The tables in this section lists the events that the ELM Enterprise Manager server and TNT Agent processes can log. All events created from Monitor Item Actions are written to the ELM database. All events logged by the TNT Agent process will set the Event Source field to TNTAGENT. All events logged by the ELM Enterprise Manager server process will set the Event Source field to EEMSVR. Only events that are written to the Application log respect logging level in the ELM Control Panel. ELM Server logging cannot be completely turned off, but the level of logging can be adjusted. ELM event numbers are grouped into ranges with the following descriptions: General purpose messages ( ) Service or Process Related Messages ( ) Session Related Messages ( ) Agent Related Messages ( ) Notification Related Messages ( ) Monitor Related Messages ( ) Performance Data Collector Related Messages ( ) Event Engine Related Messages ( ) Report Related Messages ( ) Common Messages ( ) Event IDs Below are general purpose events from the ELM Enterprise Manager server or TNT Agent process. Event Type: I = Informational W = Warning Event ID Event Type Message 5050 I4 %1 (reserved) 5051 I %1 (reserved) 5052 I %1 (reserved) 5053 I %1 (reserved) 5054 I %1 (reserved) 5055 E %1 (reserved) 5056 W %1 (reserved) E = Error
284 284 ELM Help 5057 E %1 (reserved) 5058 E The item has not been locked for write access E Access denied because another caller has the item open and locked E Access denied because the caller has insufficient permission, or another caller has the file open and locked E An item with this name already exists E The action could not be carried out because the software evaluation period has expired I The software license for this product indicates that it has not been registered I An attempt was made to WriteLock %1 which cannot be modified. Its properties will be shown in a Read Only state E An attempt was made to connect to the server from %1. Connection denied E %1 service is restarting itself for the following reason: VIRTUAL MEMORY MAX EXCEEDED THREAD COUNT MAX EXCEEDED HANDLE COUNT MAX EXCEEDED MONITOR JOB QUEUE TERMINATED MONITOR JOB QUEUE UNABLE TO ENUMERATE SERVERS MONITOR JOB QUEUE UNABLE TO GET MASTER MONITOR COLLECTION 5067 E %1 is missing one or more binary files. Please use the Repair option in Add/Remove Programs E Error. Install complete, but Agent offline. Intervention required E Error. Install Skipped, Agent is not enabled E Error. A Conflicting product is already installed E An SEH Exception was caught. Details: % E The proxy server requires authentication and authenticated proxy connections are not supported.
285 Administrator Guide 285 Notes The ELM Control panel applet has three Logging Levels, and these levels control how much detail is logged by the ELM Server. In general, event type determines which events are written at each level as detailed below: Low - Log errors only. Medium - Log errors and warnings. High - Log errors, warnings and informational events. Exceptions to this general scheme are indicated by the following superscripts: 1 This event is written at Low, Medium and High logging levels. 2 This event is written at Medium and High logging levels. 3 This event is written only at the High logging level. 4 Unclassified events are logged using this event ID. It is likely there will be error events and therefore written at Low, Medium, and High logging levels. Please note that Actions defined in Monitor items are not affected by these logging levels and will always write events if defined Event IDs Below are service or processor related events from the ELM Enterprise Manager server or TNT Agent process. Event Type: I = Informational W = Warning E = Error Event ID Event Type Message 5100 I1 %1 service started 5101 I2 User requested %1 service shutdown 5102 I1 %1 service stopping 5103 E An Error occurred accessing the %1 of %2. This Error indicates incompatible Microsoft Data Access Components (MDAC) could be installed. Please refer to the software compatibility checklist for further information E An Error occurred queuing the %1 job named %2. The maximum job queue entries for an individual item cannot exceed %3. For more information please contact technical support at support@tntsoftware.com.
286 286 ELM Help 5105 I The ELM Server has been shutdown. Notes The ELM Control panel applet has three Logging Levels, and these levels control how much detail is logged by the ELM Server. In general, event type determines which events are written at each level as detailed below: Low - Log errors only. Medium - Log errors and warnings. High - Log errors, warnings and informational events. Exceptions to this general scheme are indicated by the following superscripts: 1 This event is written at Low, Medium and High logging levels. 2 This event is written at Medium and High logging levels. 3 This event is written only at the High logging level. 4 Unclassified events are logged using this event ID. It is likely there will be error events and therefore written at Low, Medium, and High logging levels. Please note that Actions defined in Monitor items are not affected by these logging levels and will always write events if defined Event IDs Below are session related events from the ELM Enterprise Manager server or TNT Agent process. Event Type: I = Informational W = Warning E = Error Event ID Event Type Message 5200 E3 Error opening configuration file: % E Fatal Error in %1 for stream % E Error connecting to database: % E Database access Error % E Critical failure: failed loading configuration data from % E The %1 service failed to initialize
287 Administrator Guide E The service failed to initialize a session for %1. % E The service failed to initialize a session because the software license quota has been exceeded E Critical failure: failed storing configuration data to % E Critical failure: failed writing to registry. Check the registry permissions on the service account E The XML import feature is not available in evaluation mode E Error creating linked table '%1' in %2 % E Error deleting linked table '%1' in %2 % E Failure merging data in %1 % W1 A critical database failure occurred and the temporary database %1 has been enabled. Data in this temporary file will be merged with the configured database when it becomes available E A critical failure occurred while enabling fail-over to temporary database %1. This failure will result in loss of data I1 The configured database has returned on-line. Temporary data written to %1 is now being merged with the database I1 %1, recovery attempt completed for the database. %3 % I %1 purge event records completed E %1, errors occurred attempting to purge event records. % E The Primary and Failover databases configured for ELM are not available. At least one of the configured databases needs to be available for the ELM Server service to start I1 The Primary database configured for ELM has returned on-line E Failed to drop the database %1. Error %2. Please make sure the SQL server is connectable E Error running database SQL script %1 %2
288 288 ELM Help Notes The ELM Control panel applet has three Logging Levels, and these levels control how much detail is logged by the ELM Server. In general, event type determines which events are written at each level as detailed below: Low - Log errors only. Medium - Log errors and warnings. High - Log errors, warnings and informational events. Exceptions to this general scheme are indicated by the following superscripts: 1 This event is written at Low, Medium and High logging levels. 2 This event is written at Medium and High logging levels. 3 This event is written only at the High logging level. 4 Unclassified events are logged using this event ID. It is likely there will be error events and therefore written at Low, Medium, and High logging levels. Please note that Actions defined in Monitor items are not affected by these logging levels and will always write events if defined Event IDs Below are Agent related events from the ELM Enterprise Manager server or TNT Agent process. Event Type: I = Informational W = Warning Event ID Event Type Message 5300 E % I1 %1 started 5302 I1 %1 stopped 5303 I2 %1 started monitoring 5304 I2 %1 stopped monitoring 5305 I2 %1 configuration updated 5306 I %1 events found 5307 W %1 events not found E = Error
289 Administrator Guide E The Agent is unable to contact the server I %1 TNTAgent service binaries updated E Deleting corrupted Agent cache file: % E Deleting Agent Service because % E Failed to listen on any of the configured tcp ports 5313 E Agent version is out of date 5314 E Cache directory %1 does not have at least %2 MB free. Data may be irretrievably lost until either ELM Server communication is reestablished or disk free space is increased E Cache directory %1 is not available. Data may be irretrievably lost until either ELM Server communication is reestablished or the directory becomes available E The ELM Agents install directory does not have %1 MB free space. No Evt Files will be collected until this much space is available I Switching Agent to Home Server % I Switching Agent to Standby Server % E Staging unlicensed ELM Agents found in dat file E At least one of the licenses (%1) being assigned to the agent %2 is not valid for the agent. Notes The ELM Control panel applet has three Logging Levels, and these levels control how much detail is logged by the ELM Server. In general, event type determines which events are written at each level as detailed below: Low - Log errors only. Medium - Log errors and warnings. High - Log errors, warnings and informational events. Exceptions to this general scheme are indicated by the following superscripts: 1 This event is written at Low, Medium and High logging levels. 2 This event is written at Medium and High logging levels. 3 This event is written only at the High logging level. 4 Unclassified events are logged using this event ID. It is likely there will be error events and
290 290 ELM Help therefore written at Low, Medium, and High logging levels. Please note that Actions defined in Monitor items are not affected by these logging levels and will always write events if defined Event IDs Below are Notification related events from the ELM Enterprise Manager server or TNT Agent process. Event Type: I = Informational W = Warning E = Error Event ID Event Type Message 5400 E %1 is up but the service is not responding 5401 E Error connecting, %1 is not currently on the network or the network is down or there is no connectivity to TCP port % I Notification Sent: %1 The notification method completed successfully 5403 E Notification Error: %1 % W Notification script timeout: %1 The following file could not be removed: % E An error occurred generating the SNMP trap. This can occur if the SNMP Service on the ELM Server is not started, or if the file TNTSNMP.DLL is not registered 5496 I The service Agent %1 successfully restarted the ELM Server service 5497 E The service Agent %1 could not restart the ELM Server service 5498 I The ELM Server successfully restarted the TNTAgent service on % E The ELM Server could not restart the TNTAgent service on %1 Notes The ELM Control panel applet has three Logging Levels, and these levels control how much detail is logged by the ELM Server. In general, event type determines which events are written at each
291 Administrator Guide 291 level as detailed below: Low - Log errors only. Medium - Log errors and warnings. High - Log errors, warnings and informational events. Exceptions to this general scheme are indicated by the following superscripts: 1 This event is written at Low, Medium and High logging levels. 2 This event is written at Medium and High logging levels. 3 This event is written only at the High logging level. 4 Unclassified events are logged using this event ID. It is likely there will be error events and therefore written at Low, Medium, and High logging levels. Please note that Actions defined in Monitor items are not affected by these logging levels and will always write events if defined Event IDs Below are Monitor related events from the ELM Enterprise Manager server or TNT Agent process. Event Type: I = Informational W = Warning E = Error Event ID Event Type Message 5500 E Monitor item '%1' failed on %2 % I Monitor item '%1' on %2 is operating E Event monitor failed to connect to agent %1 % E %1 FTP monitor failed to connect to % I %1 FTP monitor connected to % W %1 FTP quality of service is degraded on % E %1 PING monitor %2 failed I %1 PING monitor %2 succeeded W %1 PING %2 quality of service may be degraded E %1 SMTP monitor failed to connect to %2.
292 292 ELM Help 5510 I %1 SMTP monitor connected to % W %1 SMTP quality of service is degraded on % W %1 The SMTP monitor connected to % E %1 POP3 monitor failed to connect to % I %1 POP3 monitor connected to % W %1 The POP3 monitor connected to % W %1 POP3 quality of service is degraded on % E %1 Web Page Monitor failed I %1 Web Page Monitor succeeded W %1 Web Page Monitor quality of service is degraded W %1 Web Page Monitor detected a change to the web page on % E %1 TCP PORT monitor failed to connect to % I %1 TCP PORT monitor connected to % W %1 TCP PORT monitor quality of service is degraded on % E %1 Agent monitor failed to connect to % I %1 Agent monitor connected to % W %1 Agent monitor quality of service is degraded on % W %1 Performance Alarm monitor triggered on % E %1 Service state has changed on %2, the service is stopped E %1 Service state has changed on %2, the service is stopping I %1 Service state has changed on %2, the service is started I %1 Service state has changed on %2, the service is starting W %1 File Monitor detected a match on %2.
293 Administrator Guide W %1 Process Monitor detected a process on %2 using excessive CPU time E %1 Process Monitor detected a process on %2 using an excessive amount of CPU time I %1 Process Monitor detected a new process started on % W %1 Process Monitor detected a process has ended on % W %1 WMI Monitor detected a change in the WMI Query on % W %1 SQL Monitor detected a change in the SQL Query on % I %1 Cluster Monitor event on % W %1 Cluster Monitor Warning on % E %1 Cluster Monitor Error on % E %1 Exchange Monitor Error W %1 Exchange Monitor Warning I %1 Exchange Monitor Success E Exchange Monitor could not logon to the administrator mailbox %1 on % E Exchange Monitor could not access the message store on % I Exchange Monitor successfully logged on to the administrator mailbox %1 on % E Exchange Monitor services are unavailable because MAPI is not installed I2 Exchange Monitor services restored E Exchange Monitor services are unavailable because there is no MAPI admin profile I The following SNMP object has a value outside the indicated range: % 1.
294 294 ELM Help 5552 W The following SNMP object has a value in the indicated range: % W Process Monitor detected a number of instances of a monitored process on %2 which exceeds the warning threshold. % E %1 Process Monitor detected a number of instances of a monitored process on %2 which exceeds the error threshold W %1 Link Monitor average response time is above QoS threshold W %1 Link Monitor detected a broken link W IIS Monitor detected a change in the status of the following services % E IIS Monitor detected a broken path referenced in the IIS Metabase % W IIS Monitor detected a failed URL request in the log files % W IIS Monitor Blocked Address Connection Attempt % I %1 Link Monitor succeeded I Event Monitor successfully connected to % E %1 ELM Server Monitor failed to connect to % I %1 ELM Server Monitor connected to % W %1 ELM Server Monitor quality of service is degraded on % E The Bookmark for the %1 event log on %2 rolled over. To prevent the loss of more events, please increase the size of your event log. See the Best Practices section of the ELM Help file for more information I The application %1 version %2 has been installed on %3. The inventory record for this Agent has been updated to reflect this change I The application %1 version %2 has been uninstalled on %3. The inventory record for this Agent has been updated to reflect this change W The application %1 on %2 is
295 Administrator Guide 295 unavailable. An event log entry indicates there is a problem and the application may not be working correctly I The application %1 on %2 experienced a problem at %3. The outage lasted about %4. The application appears to be working properly now W %1 Items have been added to the Inventory on computer % W %1 Items have been removed from the Inventory on computer % I %1 Service state has changed on %2, the service is paused E Failure trying to retrieve MIB value: % I %1 EVT File Collector successfully copied file E %1 EVT File Collector failed to copy the file I %1 EVT File Collector successfully stored the file E %1 EVT File Collector failed to store the file W %1 EVT File Collector lost events I EVT File Collector File Stored. LogName: %1 Destination FileName:% I Evt File Collector Log Settings Changed. LogName: %1 MaxSize: %2 Retention: % I %1 Configuration Changes Detected I % E % E % I % E % E %1
296 296 ELM Help 5589 I % E % E % E Environmental collector %1 had an error %2 aggregating environmental data I Environmental collector %1 successfully aggregated environmental data W Unable to md5 hash the Evt Files Error Message: %1 Computer: %2 Log: %3 Evt Full File Path: % E Unable to store the Evt File. The minimum free space of %1 MB is less than the minimum acceptable free space level of %2 MB. Agent: %3 Log: %4 Storage Directory: % W %1 Configuration Monitor Detected Item(s) Added W %1 Configuration Monitor Detected Item(s) Changed W %1 Configuration Monitor Detected Item(s) Removed. Notes The ELM Control panel applet has three Logging Levels, and these levels control how much detail is logged by the ELM Server. In general, event type determines which events are written at each level as detailed below: Low - Log errors only. Medium - Log errors and warnings. High - Log errors, warnings and informational events. Exceptions to this general scheme are indicated by the following superscripts: 1 This event is written at Low, Medium and High logging levels. 2 This event is written at Medium and High logging levels. 3 This event is written only at the High logging level. 4 Unclassified events are logged using this event ID. It is likely there will be error events and therefore written at Low, Medium, and High logging levels.
297 Administrator Guide 297 Please note that Actions defined in Monitor items are not affected by these logging levels and will always write events if defined Event IDs Below are Performance Data Collector related events from the ELM Enterprise Manager server or TNT Agent process. Event Type: I = Informational W = Warning E = Error Event ID Event Type Message 5600 E Error: Receiving performance collection data from %1 a %2 % E Performance collector %1 had an error %2 aggregating performance collection data 5602 I Performance collector %1 successfully aggregated performance collection data Notes The ELM Control panel applet has three Logging Levels, and these levels control how much detail is logged by the ELM Server. In general, event type determines which events are written at each level as detailed below: Low - Log errors only. Medium - Log errors and warnings. High - Log errors, warnings and informational events. Exceptions to this general scheme are indicated by the following superscripts: 1 This event is written at Low, Medium and High logging levels. 2 This event is written at Medium and High logging levels. 3 This event is written only at the High logging level. 4 Unclassified events are logged using this event ID. It is likely there will be error events and therefore written at Low, Medium, and High logging levels. Please note that Actions defined in Monitor items are not affected by these logging levels and will always write events if defined.
298 ELM Help Event IDs Below are Event Engine related events from the ELM Enterprise Manager server or TNT Agent process. Event Type: I = Informational W = Warning E = Error Event ID Event Type Message 5700 E Error: Receiving event data from %1 a % E Error: Creating event in function % E Error: Streaming event in function % E Error: Handling new event from Agent 5704 I % I % E %1 Error. % W Correlation Timeout: A Start event was found, but no End event was found within the allowed time period I Correlation Match: A matching pair of Start and End events were found within the allowed time period. Notes The ELM Control panel applet has three Logging Levels, and these levels control how much detail is logged by the ELM Server. In general, event type determines which events are written at each level as detailed below: Low - Log errors only. Medium - Log errors and warnings. High - Log errors, warnings and informational events. Exceptions to this general scheme are indicated by the following superscripts: 1 This event is written at Low, Medium and High logging levels. 2 This event is written at Medium and High logging levels. 3 This event is written only at the High logging level.
299 Administrator Guide Unclassified events are logged using this event ID. It is likely there will be error events and therefore written at Low, Medium, and High logging levels. Please note that Actions defined in Monitor items are not affected by these logging levels and will always write events if defined Event IDs Below are Report related events from the ELM Enterprise Manager server or TNT Agent process. Event Type: I = Informational W = Warning Event ID Event Type Message 5800 E Report failed to run % I Report ran successfully %1 E = Error Notes The ELM Control panel applet has three Logging Levels, and these levels control how much detail is logged by the ELM Server. In general, event type determines which events are written at each level as detailed below: Low - Log errors only. Medium - Log errors and warnings. High - Log errors, warnings and informational events. Exceptions to this general scheme are indicated by the following superscripts: 1 This event is written at Low, Medium and High logging levels. 2 This event is written at Medium and High logging levels. 3 This event is written only at the High logging level. 4 Unclassified events are logged using this event ID. It is likely there will be error events and therefore written at Low, Medium, and High logging levels. Please note that Actions defined in Monitor items are not affected by these logging levels and will always write events if defined Event IDs Below are Common related events from the ELM Enterprise Manager server or TNT Agent process. Event Type:
300 300 ELM Help I = Informational W = Warning E = Error Event ID Event Type Message 5900 E Warning: Cannot add NULL dispatch to TNT Properties collection 5901 E Error initializing %1 % E %1 API failed % E %1 failed to create socket % E %1 failed to bind socket % E Unable to query the server service performance data. The error code returned by the service is % E When searching events, at least one event type is required. Please use the back button on your browser to select an item type E The installation was staged 5908 E The agent was not installed 5909 E Unable to start the deployment another deployment is already in progress E The specified file does not appear to be of csv or xml file format E An error occurred stopping the agent service E An error occurred copying files E An error occurred opening the remote registry E An error occurred writing to the remote registry E An error occurred opening the service control manager on the computer E An error occurred starting the agent service E Windows NT 4.0 not supported.
301 Administrator Guide 301 Notes The ELM Control panel applet has three Logging Levels, and these levels control how much detail is logged by the ELM Server. In general, event type determines which events are written at each level as detailed below: Low - Log errors only. Medium - Log errors and warnings. High - Log errors, warnings and informational events. Exceptions to this general scheme are indicated by the following superscripts: 1 This event is written at Low, Medium and High logging levels. 2 This event is written at Medium and High logging levels. 3 This event is written only at the High logging level. 4 Unclassified events are logged using this event ID. It is likely there will be error events and therefore written at Low, Medium, and High logging levels. Please note that Actions defined in Monitor items are not affected by these logging levels and will always write events if defined Registry Entries The tables in this section list registry settings for the ELM Enterprise Manager Server, ELM Wizard, Service Agent, and Console. ELM Wizard Registry Entries ELM Service Agent Registry Entries ELM Console Registry Entries ELM Server Registry Entries ELM Wizard Registry Entries The table below lists registry entries from the Windows Registry recognized by ELM. Not all registry entries are created by default; some must be manually created. If a Name entry is not in the registry, ELM will use the default value listed. Not all values should be edited through the registry; when this is true, the appropriate interface is given in the Description. This table does not include the COM classes and libraries that are registered and written to the Registry (under HKEY_CLASSES_ROOT) during Setup. This table does not include the ELM Server service registry entries (under HKEY_LOCAL_MACHINE\System\CurrentControlSet\Services). ELM Wizard Registry Keys
302 302 ELM Help HKEY_CURRENT_USER \ SOFTWARE\ TNT Software \ ELM Enterprise Manager 6.7 \ Wizards\Settings Name Type Default Value Restart Required Description PreferTCPOverRPCReinstall REG_DWORD 1 Console Restart If set to 1, Agent Deployment Wizard will make TCP socket connection to service agent during agent re-installation. Name Type Default Value Restart Required Description ShowFilterMatchDlg REG_DWORD 0 Console Restart If set to 1, the Event View Event Filters Filter Settings dialog will be displayed. Name Type Default Value Restart Required Description ShowFilterTestDlg REG_DWORD 0 No If set to 1, the Event View Event Filters Test Event Filters and the Event Filter Test Event Filter Criteria dialog will be displayed. Name Type Default Value Restart Required Description SMTPShowAuthentication REG_DWORD 0 Console Restart If set to 1, the Reporting ELM Editor Report Schedules Type will display the Use SMTP Authentication option and the Notification Method Mail SMTP SMTP Authentication dialog will display. ELM Console Registry Entries The table below lists registry entries from the Windows Registry recognized by ELM. Not all registry entries are created by default; some must be manually created. If a Name entry is not in the registry, ELM will use the default value listed. Not all values should be edited through the registry; when this is true, the appropriate interface is given in the Description. This table does not include the COM classes and libraries that are registered and written to the Registry (under HKEY_CLASSES_ROOT) during Setup. This table does not include the ELM Server service registry entries (under HKEY_LOCAL_MACHINE\System\CurrentControlSet\Services). ELM Console Registry Keys
303 Administrator Guide 303 HKEY_CURRENT_USER \ SOFTWARE\ TNT Software \ ELM Enterprise Manager \ 6.7 \ Snapin \ Settings Name Type Default Value Restart Required Description DefaultEventViewIsDetail REG_DWORD 0 No If set to 0, then Views will summarize events, and if set to 1, then Views will display one event per line. Views listed in the DetailEventViews and SummaryEventViews registry entries will override this registry entry. This is a global setting that affects all Event Views. Name Type Default Value Restart Required Description MaxNumAdvises REG_SZ 5000 No When the number of advises held in memory reaches this maximum value, they are deleted from memory. No message is generated. If advises are dropped from memory, the events can be displayed by refreshing the view. Increasing this value increases the memory required by the ELM Console (mmc.exe) process. The ELM Console must be closed and re-opened to activate changes. See also SnapinAdviseTimerInMilliseconds. Name Type Default Value Restart Required Description SnapinAdviseTimerInMilliseconds REG_DWORD 50 ELM Console restart required This entry controls how frequently the ELM Console looks in its own queue for new advises (messages) from the ELM Server. Checking the queue and processing waiting advises delays processing of user input like mouse clicks or keystrokes. So setting this value to a high number will make the ELM Console more responsive, but display updates from advises will be slower. Advise updates are independent of user initiated refreshes. The ELM Console must be closed and reopened to activate changes. See also MaxNumAdvises. Name Type Default Value Restart Required Description SplashScreen REG_DWORD 1 ELM Console restart required Display (1) or do not display (0) TNT Software splash screen when opening the ELM Console. ELM Server Registry Entries The table below lists registry entries from the Windows Registry recognized by ELM.
304 304 ELM Help Not all registry entries are created by default; some must be manually created. If a Name entry is not in the registry, ELM will use the default value listed. Not all values should be edited through the registry; when this is true, the appropriate interface is given in the Description. This table does not include the COM classes and libraries that are registered and written to the Registry (under HKEY_CLASSES_ROOT) during Setup. This table does not include the ELM Server service registry entries (under HKEY_LOCAL_MACHINE\System\CurrentControlSet\Services). ELM Server Registry Keys HKEY_LOCAL_MACHINE \ SOFTWARE\ TNT Software \ ELM Enterprise Manager \ 6.7 \ Settings Name Type Default Value Restart Required Description AgentHeartbeatInSeconds REG_DWORD 60 (seconds) ELM Server restart required This sets the interval used by TNT Agent for checking in with the ELM Server. The ELM Server uses this heartbeat check to provide Ata-Glance Agent status information. Name Type Default Value Restart Required Description BatchMoveTableChunkSize REG_DWORD 5000 ELM Server restart required This setting controls how many rows of data are copied from the primary to the archive database in each batch. It also controls how many rows of Performance and SNMP data are deleted before the next copy operation. This also applies to coming out of the failover database. Valid values are positive integers greater than Setting it to a number less than 5000 will be ignored by ELM. Name Type Default Value Restart Required Description CacheDataTrigger REG_DWORD 60 (minutes) ELM Server restart required Interval for cached data window in minutes. Applies to EEM, ELM, and EVM only. Name Type Default Value Restart Required Description ContinuePruneOnArchiveError REG_DWORD 0 ELM Server restart required This setting controls continued processing if an error occurs when moving events from the primary to the archive database. Setting it to 0 will stop the archiving process, and is intended to prevent any data loss. Setting it to 1 will continue the archiving process, but may result in data loss. With either setting, if an error occurs, ELM will write error event 5219 to the Windows application log on the ELM Server computer.
305 Administrator Guide 305 Name Type Default Value Restart Required Description CustomReportsImported REG_DWORD 0 No When set to 1, the ELM Server will not import ELM Editor sample reports. If the key is missing or set to 0, and there are no reports or folders in the ELM Editor container, then selecting or refreshing the ELM Editor container will import the sample reports in EEMReports.xml. Name Type Default Value Restart Required Description FTPMonitorTakeActionAtEachInterval REG_DWORD 0 ELM Server restart required This modifies the default behavior of the FTP Monitor. By creating this key and setting the value to 1, you can force the FTP Monitor to execute its configured Action(s) at each interval, regardless of state changes. With Virtual Agents, this entry must be entered in the ELM Server computer registry. With Service Agents this entry must be entered in the Agent computer registry. Name Type Default Value Restart Required Description LicenseEventInXml REG_DWORD <Binary Value> No If set to 1, changes the event output for license changed (Event ID 5226), Agent added (Event ID 5229), and Agent deleted (Event ID 5230) to XML format for debugging purposes. Name Type Default Value Restart Required Description MaxNotificationQueueEntriesPerItem REG_DWORD ELM Server restart required Number of pending notifications that can be in the Notification queue for an individual Notification Method. If a Method creates more than the default or registry configured number of Notifications, then the ELM Server will generate error 5104 and discard all pending notifications for the one Notification Method. Pending notifications queued for other Notification Methods, even if they are the same type, will not be deleted. Increasing this value will increase memory requirements of the ELM Server process. Maximum value is (MAX_INT).
306 306 ELM Help Name Type Default Value Restart Required Description MaxNumRecordsReadBeforeForceSend REG_DWORD 1000 No This value is used for Event Alarms and Event Collectors. This is the maximum number of event log records that will be read in a single monitor item interval. With Virtual Agents, this entry must be entered in the ELM Server computer registry. With Service Agents this entry must be entered in the Agent computer registry. Name Type Default Value Restart Required Description MaxPagerMsgLength REG_DWORD 240 No The maximum message size for TAP (Telocator Alphanumeric Protocol) is 250 bytes, and for SMS (Short Message Service) it's 160 bytes. Service providers are free to implement their own interpretation of these protocols, and 240 bytes has proven to be successful in practice. Name Type Default Value Restart Required Description MaxSyslogMessageQueueSize REG_DWORD No This key controls the number of TCP or UDP syslog messages the ELM Syslog Receiver will hold in memory. Limiting this queue will limit how much virtual memory (perfmon: process/private bytes) ELM will use. When the queue limit is reached, the queue is purged and informational event 5050 from EEMSVR is generated: SyslogMessageQueue reached max size, syslog message not accepted. Name Type Default Value Restart Required Description MergeBatchSize REG_DWORD 100 (rows) ELM Server restart required This controls the amount of only Event row batch size that is used for either coming out of Failover condition or archiving. Name Type Default Value Restart Required Description MonitorNumLoggingChars REG_DWORD 512 ELM Server restart required This key controls the number of bytes that TNTDiag will capture for Monitor Item activity. Use the Server registry key when the Monitor Items are assigned to Virtual Agents.
307 Administrator Guide 307 Name Type Default Value Restart Required Description NormalShutdown REG_DWORD 1 No Users should not change this registry entry. This value is set internally by the ELM Server. A value of 1 indicates a normal shutdown. When the ELM Server service is restarted, this flag is removed from the registry. Before a Service Agent or the ELM Advisor will attempt to restart a stopped ELM Server, it will read the registry to see if this flag is present. If the flag exists, the Service Agent or ELM Advisor will not attempt to restart the ELM Server. If the flag does not exist, the Service Agent or ELM Advisor will attempt to restart the ELM Server (if configured to do so). Name Type Default Value Restart Required Description NumSyslogEventsDroppedBeforeLoggingEvent REG_DWORD 10 ELM Server restart required This key controls the number of syslog messages that will be dropped before the ELM Server writes event log message It can be used to minimize the number of events the ELM Server writes if many syslog messages are dropped from the syslog message queue. Restarting the ELM Server or changing this registry entry will reset the internal counter. The first time a syslog message is dropped, an event 5050 is generated. After that, the counter starts. Name Type Default Value Restart Required Description PingMonitorTakeActionAtEachInterval REG_DWORD 0 ELM Server restart required This modifies the default behavior of the Ping Monitor. By creating this key and setting the value to 1, you can force the Ping Monitor to execute its configured Action(s) at each interval, regardless of state changes. Name Type Default Value Restart Required Description PortMonitorTakeActionAtEachInterval REG_DWORD 0 ELM Server restart required This modifies the default behavior of the TCP Port Monitor. By creating this key and setting the value to 1, you can force the Port Monitor to execute its configured Action(s) at each interval, regardless of state changes. With Virtual Agents, this entry must be entered in the ELM Server computer registry. With Service Agents this entry must be entered in the Agent computer registry. Name RealTimeEventViewUpdates
308 308 ELM Help Type Default Value Restart Required Description REG_DWORD 1 ELM Server restart required This value is set through the Options tab of the ELM Control Panel applet. Specifies whether real-time streaming of new events is enabled (1) or disabled (0). Name Type Default Value Restart Required Description SaveInterval REG_DWORD 15 ELM Server restart required Users should not change this registry entry. Interval number of seconds ELM Server waits before checking for configuration changes. If changes are found, then they will be written to the ELM Server.dat file. Name Type Default Value Restart Required Description ServerName REG_SZ < NetBIOS Name of the ELM Server computer > ELM Server restart required When the ELM Server service starts, this name is loaded into memory. Once loaded, this name will be passed to Service Agents as the name they should use for the ELM Server. The name is passed when an Agent configuration is updated, or when a new Agent is installed. Name Type Default Value Restart Required Description ShowAlerts REG_DWORD 0 ELM Server restart required If set to 1, the Alerts node is displayed in the Console. Name Type Default Value Restart Required Description ShowExch REG_DWORD 0 ELM Server restart required If set to 1, the Exchange monitor item is displayed in the Console. Name Type Default Value Restart Required Description ShowFavorites REG_DWORD 0 ELM Server restart required If set to 1, the Favorites container is displayed in the Console. Name Type Default Value Restart Required ShowPOP3 REG_DWORD 0 ELM Server restart required
309 Administrator Guide Description 309 If set to 1, the POP3 monitor item is displayed in the Console. Name Type Default Value Restart Required Description ShowPublisher REG_DWORD 0 ELM Server restart required If set to 1, the ELM Publisher Reports are displayed in the Console. Name Type Default Value Restart Required Description ShowMAPINotification REG_DWORD 0 ELM Server restart required If set to 1, when creating a new Mail Notification Method, ELM will check for the existence of MAPI mail controls. If found, the Console will give the option of either MAPI or SMTP Mail Notification creation. If set to 0, MAPI Mail Notifications will not be offered as a creation path. Name Type Default Value Restart Required Description ShowServerMonitor REG_DWORD 0 ELM Server restart required If set to 1, the ELM Server monitor item is displayed in the Console. Name Type Default Value Restart Required Description SMTP NotificationTimeOut REG_DWORD 60 ELM Server restart required Specifies the number of seconds the ELM Server will wait for a SMTP Server to respond when using the SMTP Notification Method. The minimum timeout is set to 5 seconds. The maximum timeout value is specified by the SMTPMaxTimeoutInSeconds registry key. Name Type Default Value Restart Required Description SMTPMaxTimeoutInSeconds REG_DWORD 300 ELM Server restart required Specifies the maximum number of seconds ELM will wait for an SMTP Server to respond. This entry sets an upper bound which limits both the ELM SMTP Monitor and the ELM SMTP Notification Method. The minimum timeout is set to 5 seconds. The maximum timeout value is 4,294,967,295 seconds. Name Type Default Value Restart Required Description SMTPWaitForPreEHLOGreetingInSeconds REG_DWORD 0 ELM Server restart required When the ELM Server connects to an SMTP server, this entry adds a delay, in seconds, after connecting and before sending EHLO. This
310 310 ELM Help setting affects all SMTP Notification Methods, and all SMTP Monitor Items. Name Type Default Value Restart Required Description SNMPPipeTimeOut REG_DWORD 5 ELM Server restart required Specifies the number of seconds the SNMP Notification Method will wait while trying to connect to an SNMP Agent via named pipes. Name Type Default Value Restart Required Description SQLExpressMaxSize REG_DWORD 3996 ELM Server restart required Specified in MB, any SQL Express 2008 database of this size or larger will be rolled over to a new database. This number can be reduced to roll over the database earlier to avoid conflicts with SQL Express reaching its maximum size limit. Name Type Default Value Restart Required Description SQLExpressMaxSizeR2 REG_DWORD ELM Server restart required Specified in MB, any SQL Express 2008 R2 or SQL Express 2012 database of this size or larger will be rolled over to a new database. This number can be reduced to roll over the database earlier to avoid conflicts with SQL Express reaching its maximum size limit. Name Type Default Value Restart Required Description TrustedServers REG_SZ <IP Address> No This value is set through the Forwarded Events tab of the ELM Control Panel applet. The Event Forward Notification Method Wizard will attempt to create this value on the receiving ELM Server. If this fails, use the ELM Control Panel applet. IP addresses of sending ELM Servers that are not in this list will be ignored by the receiving ELM Server. Name Type Default Value Restart Required Description UseShellExecuteForScripts REG_DWORD 0 No This value will alter the method used by the Run Action in Monitor Items assigned to Virtual Agents and the Command Script Notification Method. Setting it to 1 will enable script execution on a remote system, but will disable environment variable expansion.
311 Administrator Guide 311 Name Type Default Value Restart Required Description ValidateTablesOnCreation REG_DWORD 1 ELM Server restart required If set to 1, the SQL validation scripts will only be run at database creation, except for INTERNAL.PR_MaintainAllPartitions.sql. Name Type Default Value Restart Required Description WarnIfLessThanNumLicenses REG_DWORD 0 No Set the value that an event should be written if X is exceeded. So, if you have 20 licenses, and you set it to 5, after the 6th is taken it'll write an event out. Name Type Default Value Restart Required Description WebPageMonitorCaseInsensitive REG_DWORD 0 No Specifies whether the fetched web pages are treated as casesensitive (0) or not (1). With Virtual Agents, this entry must be entered in the ELM Server computer registry. With Service Agents this entry must be entered in the Agent computer registry Name Type Default Value Restart Required Description WriteEventOnAgentAdd REG_DWORD 0 No If set to 1, if an Agent is added to the Server, an event will be written out. Name Type Default Value Restart Required Description WriteEventOnAgentDelete REG_DWORD 0 No If set to 1, if an Agent that is reporting to the Server is deleted, an event will be written out. ELM Service Agent Registry Entries The table below lists registry entries from the Windows Registry recognized by ELM. Not all registry entries are created by default; some must be manually created. If a Name entry is not in the registry, ELM will use the default value listed. Not all values should be edited through the registry; when this is true, the appropriate
312 312 ELM Help interface is given in the Description. This table does not include the COM classes and libraries that are registered and written to the Registry (under HKEY_CLASSES_ROOT) during Setup. This table does not include the ELM Server service registry entries (under HKEY_LOCAL_MACHINE\System\CurrentControlSet\Services). Service Agent Registry Keys HKEY_LOCAL_MACHINE \ SOFTWARE \ TNT Software \ ELM Manager Agent \ 6.7 \ Settings Name Type Default Value Restart Required Description CacheDataMaxSize REG_DWORD 104,857,600 (100MB) Service Agent restart required This value is set through the Agent properties. Controls the maximum size of the TNT Agent cache file size. Name Type Default Value Restart Required Description CachePath REG_SZ %systemroot%\tntagent Service Agent restart required This value is set through the Agent properties. Controls the destination of the TNT Agent cache file on the local computer. Also see MinDiskFreeSpaceInMBToContinueCaching. Name Type Default Value Restart Required Description FTPMonitorTakeActionAtEachInterval REG_DWORD 0 Service Agent restart required This modifies the default behavior of the FTP Monitor. By creating this key and setting the value to 1, you can force the FTP Monitor to execute its configured Action(s) at each interval, regardless of state changes. With Virtual Agents, this entry must be entered in the ELM Server computer registry. With Service Agents this entry must be entered in the Agent computer registry. Applies to EEM only. Name Type Default Value Restart Required Description InternetConnectTimeout REG_DWORD 5000 (5 seconds) Service Agent restart required This is the time-out value, in milliseconds, for Internet connection requests in the Link Monitor Item. If a connection request takes longer than this time-out value, the request is canceled. Applies to EEM only.
313 Administrator Guide Name Type Default Value Restart Required Description 313 InternetReceiveTimeout REG_DWORD (30 seconds) Service Agent restart required This is the time-out value, in milliseconds, to receive a response to a request in the Link Monitor Item. If the response takes longer than this time-out value, the request is canceled. Applies to EEM only. Name Type Default Value Restart Required Description MaxNumRecordsReadBeforeForceSend REG_DWORD 1000 No This value is used for Event Alarms and Event Collectors. This is the maximum number of event log records that will be read in a single monitor item interval. To use this with Service Agents this entry must be manually entered in the registry of the Agent computer. To use this with Virtual Agents this entry must be manually entered in the registry of the ELM Server computer. Applies to EEM, ELM, and EVM only. Name Type Default Value Restart Required Description MinDiskFreeSpaceInMBToContinueCaching REG_DWORD 20 MB Service Agent restart required Controls the minimum free space in MB before a TNT Agent will write to a cache file. If disk free space drops below this value, then the Agent will stop saving data to the cache file. Logical drive checked is determined by CachePath. Name Type Default Value Restart Required Description MonitorNumLoggingChars REG_DWORD 512 Service Agent restart required This key controls the number of bytes that TNTDiag will capture for Monitor Item activity. Use the Agent registry key when the Monitor Items are assigned to Service Agents. Name Type Default Value Restart Required Description PortMonitorTakeActionAtEachInterval REG_DWORD 0 No This modifies the default behavior of the TCP Port Monitor. By creating this key and setting the value to 1, you can force the
314 314 ELM Help Port Monitor to execute its configured Action(s) at each interval, regardless of state changes. With Virtual Agents, this entry must be entered in the ELM Server computer registry. With Service Agents this entry must be entered in the Agent computer registry. Applies to EEM only. Name Type Default Value Restart Required Description ProcessCollectedEvtFiles REG_DWORD 1 Service Agent restart required This key stores the latest copy of evt(x) file in cache path for agent. Name Type Default Value Restart Required Description RemoteAgentInstall REG_DWORD 1 No Users should not change this registry entry. This value is set internally by ELM. This value indicates if the Service Agent was installed through the ELM Console (1) or using Windows Installer (0). Name Type Default Value Restart Required Description RestartHandleCountMax REG_DWORD 4000 Service Agent restart required When the handle count of the TNTAgent.exe process exceeds this value the service will restart itself. The minimum value you can set is When this is triggered, the Service Agent will log event 5066 in the application event log and restart the Service Agent. Name Type Default Value Restart Required Description RestartThreadCountMax REG_DWORD 400 Service Agent restart required When the thread count of the TNTAgent.exe process exceeds this value the service will restart itself. The minimum value you can set is 200. When this is triggered, the Service Agent will log event 5066 in the application event log and restart the Service Agent. Name Type Default Value Restart Required Description RestartVirtualMemoryMaxMb REG_DWORD 400 Service Agent restart required When the virtual memory allocation for the TNTAgent.exe process
315 Administrator Guide 315 exceeds this value the service will restart itself. The minimum value (in MB) you can set is 200. When this is triggered, the Service Agent will log event 5066 in the application event log and restart the Service Agent. Name Type Default Value Restart Required Description SMTPMaxTimeoutInSeconds REG_DWORD 300 Service Agent restart required Specifies the maximum number of seconds ELM will wait for an SMTP Server to respond. This entry sets an upper bound which limits both the ELM SMTP Monitor and the ELM SMTP Notification Method. The lower bound is hard-coded to 5 seconds. Valid values for this key are 5-4,294,967,295. An ELM SMTP Notification Method wait-time will use the SMTP NotificationTimeOut registry key (or default value) if it is within the upper and lower bounds. Otherwise the nearest boundary value is used. This would be made in the ELM Server. An ELM SMTP Monitor wait-time will use two times the Quality of Service (QoS) value if it is within the upper and lower bounds. Otherwise the nearest boundary value is used. With Virtual Agents, this entry must be entered in the ELM Server computer registry. With Service Agents this entry must be entered in the Agent computer registry. Name Type Default Value Restart Required Description TCPAgentPort REG_DWORD 1253 Service Agent restart required This ADDS a listening port, which can be verified by using netstat. Changing TCPAgentPort to 1353 will result in both 1253 and 1353 to being listened to. Name Type Default Value Restart Required Description TrustedServers REG_SZ <IP Address> No This value is set through the Agent Install Wizard or the Server Registration Wizard. A list of IP addresses of accepted ELM Servers. ELM Server IP addresses not in this list will be ignored by TNT Agent. Name Type Default Value Restart Required Description UseShellExecuteForScripts REG_DWORD 0 No This value will alter the method used by the Run Action in Monitor Items assigned to Service Agents. Setting it to 1 will enable
316 316 ELM Help script execution on a remote system, but will disable environment variable expansion. Name Type Default Value Restart Required Description WebPageMonitorCaseInsensitive REG_DWORD 0 Service Agent restart required Specifies whether the fetched web pages are treated as casesensitive (0) or not (1). To use this with Virtual Agents this entry must be manually entered in the registry of the ELM Server computer. Applies to EEM only. Name Type Default Value Restart Required Description WriteActionEventsToLog REG_DWORD 0 Service Agent restart required If set to 1, Monitor action events are written to the Event Application Log instead of directly to the ELM Server database. Command Line Switches The tables in this section list command line options for the ELM Enterprise Manager Server and TNT Service Agent. ELM Server Command Line Options TNT Agent Command Line Options ELM Server Command Line Options The table below lists command line switches that are recognized by the ELM Server. Some switches have equivalents, but only 1 switch needs to be used. ELM Server Command Line Switches Switch Usage Examples Description /? eemsvr.exe /help Show the ELM Server command line help.
317 Administrator Guide 317 /help /ImportEVT=file [/ LogName=lognam e] eemsvr.exe / importevt=dns_events.ev t /logname="dns server" Imports events from an EVT file into the ELM Server database. The ELM Server must have the following for the computer providing the EVT file: eemsvr.exe / importevt="c:\temp\file replication service.evt" ELM Agent(s) for the computername (s) in the EVT file RPC Connectivity to the computer Read permissions to the registry on the computer Read permissions to the file system on the computer Remote Registry Service running on the computer Either file or logname must match the event log name as displayed in Windows Event Viewer. If file or logname is not specified correctly, then some of the events messages may be incomplete. At least 1 Event View must have a Date Range that encompasses all the desired historical events. Date Range is in the properties of an Event View. Recent events can trigger Notification Methods. See Disable...for Cached (old) data and CacheDataTrigger for more details. Also note the default database pruning will delete older events. /LoadXML[=file] eemsvr.exe /loadxml Import an XML file from an ELM 3.1 or later export. If file is not specified, the ELM server will use a filename based on the Server executable. /RegServer eemsvr.exe /regserver Register the ELM Server as a COM server and as a Windows service. /regservice /service
318 318 ELM Help /Restart eemsvr.exe /restart Restart the ELM Server service. /SaveXML[=file] eemsvr.exe /savexml Saves all ELM Server configuration data to an XML file. If file is not specified, the ELM server will use a filename based on the Server executable. /Start eemsvr.exe /start Start the ELM Server service. /Stop eemsvr.exe /stop Stop the ELM Server service. /UnRegServer eemsvr.exe /unregserver Remove the ELM Server service and unregister the ELM Server as a COM server. /UnRegService TNT Agent Command Line Options The table below lists command line switches that are recognized by TNT Agents. Some switches have equivalents, but only 1 switch needs to be used. ELM Server Command Line Switches Switch Usage Examples Description /? tntagent.exe /help Show the TNT Agent command line help. /Install tntagent.exe /install Creates the TNT Agent service. /Register tntagent.exe /register Displays the wizard dialog to connect the agent to an ELM Server. /Remove tntagent.exe /remove Deletes the TNT Agent service. /help Note: You should deregister servers before using this option. Double-click TNTAgent.exe to open the UI, and then Deregister is under the File menu. /Restart tntagent.exe /restart Stops and restarts the TNT Agent service
319 Administrator Guide /Start tntagent.exe /start Starts the TNT Agent service /Stop tntagent.exe /stop Stops the TNT Agent service. / Trust="nnn.nnn.n nn.nnn"] tntagent.exe / trust=" " Adds the specified TCP/IP address to the list of trusted servers. After the server is trusted, it can register with the Agent. / Untrust="nnn.nnn.nnn.nnn"] tntagent.exe / trust=" " Removes the specified TCP/IP address from the list of trusted servers. Tools The tables in this section list Tools for ELM Enterprise Manager 6.7. ELM Size - Use this tool to count event data from production servers to get an example of the size requirements. ELM Event Generator - Use this tool to write events to Event Logs. ELM Tracing Tool - Used as a troubleshooting tool to trace the activity of an ELM Server, an ELM Console, and/or a Service Agent.

320 ELM Help ELM Size Use this tool to count event data from production servers to get an example of the size requirements to expect for your database. In the tool, take a sample of your environment such as a Domain Controller, file server, application server, or web server, and then modify the results in the tool to fit your environment. Take the results from the tool and multiply it by the number of systems that you plan on monitoring. To Return Event Data: To Hide Event Data:

321 Administrator Guide Use the Save button to save the results to a text file for a report. Note The Avg. Event Size has been set by TNT Software according to the average event size in our database schema. 321

322 ELM Help ELM Event Generator This tool writes Windows events to all available Event Logs for a system except for the Security Event Log, Vista and above events, and application specific events. This tool is normally used for testing purposes to ensure that events are being collected or excluded from an agent. It's located in the Windows Start Menu -> ELM Enterprise Manager -> ELM Event Generator. It can also be found by right clicking on an agent -> Tools -> ELM Event Generator. When opened from an agent, the ELM Event Generator is automatically opened in the context of that agent and will display the Event Log sources from that system. To write an event to a different system, in the ELM Event Generator -> File -> Connect to another computer. Seven Steps to Generating Events.

323 Administrator Guide ELM Tracing Tool The ELM Tracing Tool (TNTDiag) is a troubleshooting tool used to trace some or all activity of an ELM Server, an ELM Console, and/or a Service Agent. The diagnostic output produced by this tool is intended for TNT Software's Product Support Group. This tool adds overhead to the system and should be used only under the direction of TNT Software support personnel. It's located in the Windows Start Menu -> ELM Enterprise Manager -> ELM Tracing Tool. It can also be found by right clicking on an agent -> Tools -> ELM Tracing Tool. TNTDiag installs itself as a service when performing its operations, and uninstalls the service when exited. Therefore it requires administrator rights for starting. In order to save trace files in.xml format, TNTDiag requires version 3 of Microsoft's XML parser (MSXML3.DLL). If needed, this file can be downloaded from Microsoft. TNTDiag can also be started from a command prompt. This enabled starting a diagnostic trace from a Windows scheduled task. Command prompt syntax is: /Quiet /Save /Stop line /? or H[elp] - Starts a TNTDiag trace using the options in TNDiagConfig.xml - Saves a currently running TNTDiag trace started using the Quiet command line - Stops and saves a currently running TNTDiag trace started using the Quiet command - Display this text and exit To start or stop TNTDiag as a scheduled task, put the commands in.cmd files and run them using Windows task scheduler. Basic steps are:
324 324 ELM Help 1. Start TNTDiag interactively. Example: Start > All Programs > ELM Enterprise Manager > TNT Tracing Tool 2. Configure TNTDiag options under File > Options. 3. Exit TNTDiag. This will create a TNTDIAGConfig.xml file. 4. Create two text files, one for starting TNTDiag and one for stopping TNTDiag. For example: tntdiag_start.cmd contains one line: "c:\program files (x86)\elm enterprise manager\tntdiag.exe" /Quiet tntdiag_stop.cmd contains one line: "c:\program files (x86)\elm enterprise manager\tntdiag.exe" /Stop 5. Schedule the cmd files to start and stop TNTDiag at the desired times. Be sure to provide adequate security rights for the cmd files.
325 Index Index -DData Collector and Real-Time Monitors Database Archiving 53 Database Connections 49 Database Retention 50 Database Servers 122, 142 Database Settings 46 Display Diagnostics 134 Display Processes 134 -AActivate 20 Adding Performance Counters 198 Agent Categories 122, 142 Agent Monitor 61 Agent Types 57 Agentless Monitoring 133 Agents 128, 232 Alarms 58 All Agents 122, 142 Anonymous Connections 83 Application and Server Outages 122 Application and Server Status Monitoring Application monitoring 58 Application tracking 123 ASCII files 79 At A Glance 39 Authenticated Connections 83 -BBeep 24 Broken Path 85 -E58 Editor Report 199 ELM Advisor 24, 176 Event Alarms 65, 67, 74 Event Collector 123 Event Collectors 67, 71, 74 Event File Collector 77 Event Monitors 67, 74 Event View Settings 182, 188, 194 Event Views 67, 74, 179 Events 122 Evt files 77 Evtx files 77 Exclude 74 Exclude Filters 65, 67, 71, 74 -C- -F- Categories 122, 142 Check for Broken Links 88 Class I 57 Class II 57 Cluster Events 63 Cluster Monitor 63 CMD 157 Collectors 58 Command Script 157 Compressed 77 Context-sensitive help 10 Copyright Notice 7 Corporate Servers 122, 142 Counter 91, 92 CPU Usage 96 Cross Platform Monitoring 58 Failed Requests 85 File Activation 20 File Monitor 79 Filters 74 Forward Events 159 Found Events 65 FTP Monitor 83 FTP site 83 -GGroup Events
326 326 ELM Help Notification Methods Number of Processes -H- -O- HTTP 116 HTTPS 116 -IICMP Echo Requests 94 IIS 32 IIS Logs 79 IIS Monitor 85 IIS Virtual Servers 85 Include 74 Include Filters 65, 67, 71, 74 Install 128, 232 Installed Applications 87 Internet Service Monitoring 58 Inventory 122, 125 Inventory Collector 87, 123, 125 IP Virtual Agents 128, 133, 232 -LLegal Notice Link Monitor 10, 156, MMail 174 MD5 Hash 77 MIB Browser 103 Missing Events 65 Monitor Items 57, 58, 122, 142 Monitor Remotely 133 Monitoring 18 Monitoring Categories 122, 142 Monitoring Products 57 Msinfo NNetwork Events 63 New Features 11 New Process 96 Node Events 63 Object 91, 92 OID Values 103, 106, 168 Operating Systems 87 Optional Install 24 Outage Tracking 123 Outages 122 -PPacket Size 94 Pager 162 Perfmon 197 Performance 197 Performance Alarm 91 Performance Collectors 92 Performance Counter 91, 92 Performance Data 122 Ping Monitor 94 Popup Window 24 Primary Database 46 Process Ended 96 Process Monitor 96 Publisher Report 29 -QQuality of Service 61, 88, 94, 101, 114, 116 Queries Database 109 Quick Start 18 Quorum Events 63 -RRegistration 20 Registry Events 63 Reports 197 Resiliency Monitoring 58 Resource Events 63 RFC
327 Index -S- -W- Scheduled hours 57 Scheduled Interval 57 Serial Number 20 Server Activation 36 Service Agents 57, 61, 122, 128, 134, 142, 232 Service Monitor 99 Service Paused 99 Service Started 99 Service Stopped 99 Simple Network Management Protocol 103 SMTP 174 SMTP Gateways 101 SMTP Hosts 101 SMTP Monitors 101 SMTP Services 101 SNMP 103 SNMP Collector 106 SNMP Trap 168 SNMP Traps 108 Sound File 24 SQL Logs 79 SQL Monitors 109 String Matching 79 Syslog 110, 171 System Information 117, 122, 126 WBEM 120 Web Activation 20 Web Page Monitor 116 Web Viewer 32 Web-Based Enterprise Management 120 Windows Configuration Monitor 117, 126 Windows Management Instrumentation 120 Windows Processes 96 WMI 120 Workstation 128, 232 -TTCP Port 133 TCP Port Monitor Text Files 79 Thresholds UUncompressed 77 -VView Reports Virtual Agents 32 57, 128, 133,
328 328 ELM Help
 546-0878 Toll Free: (877) 546-0878 Fax: (360) 546-5017 sales@tntsoftware.")
329 TNT Software, Inc Main Street Vancouver, Washington U.S.A. Voice: (360) Toll Free: (877) Fax: (360)
Troubleshooting File and Printer Sharing in Microsoft Windows XP
 Operating System Troubleshooting File and Printer Sharing in Microsoft Windows XP Microsoft Corporation Published: November 2003 Updated: August 2004 Abstract File and printer sharing for Microsoft Windows
Dell SupportAssist Version 2.0 for Dell OpenManage Essentials Quick Start Guide
 Dell SupportAssist Version 2.0 for Dell OpenManage Essentials Quick Start Guide Notes, Cautions, and Warnings NOTE: A NOTE indicates important information that helps you make better use of your computer.
User Manual. Onsight Management Suite Version 5.1. Another Innovation by Librestream
 User Manual Onsight Management Suite Version 5.1 Another Innovation by Librestream Doc #: 400075-06 May 2012 Information in this document is subject to change without notice. Reproduction in any manner
Advanced Event Viewer Manual
 Advanced Event Viewer Manual Document version: 2.2944.01 Download Advanced Event Viewer at: http://www.advancedeventviewer.com Page 1 Introduction Advanced Event Viewer is an award winning application
Deploying System Center 2012 R2 Configuration Manager
 Deploying System Center 2012 R2 Configuration Manager This document is for informational purposes only. MICROSOFT MAKES NO WARRANTIES, EXPRESS, IMPLIED, OR STATUTORY, AS TO THE INFORMATION IN THIS DOCUMENT.
CA ARCserve Replication and High Availability for Windows
 CA ARCserve Replication and High Availability for Windows Microsoft SQL Server Operation Guide r15 This documentation and any related computer software help programs (hereinafter referred to as the "Documentation")
VMware/Hyper-V Backup Plug-in User Guide
 VMware/Hyper-V Backup Plug-in User Guide COPYRIGHT No part of this publication may be reproduced, stored in a retrieval system, or transmitted in any form or by any means, electronic, mechanical, photocopying,
Veritas Cluster Server Database Agent for Microsoft SQL Configuration Guide
 Veritas Cluster Server Database Agent for Microsoft SQL Configuration Guide Windows 2000, Windows Server 2003 5.0 11293743 Veritas Cluster Server Database Agent for Microsoft SQL Configuration Guide Copyright
Legal Notes. Regarding Trademarks. 2012 KYOCERA Document Solutions Inc.
 Legal Notes Unauthorized reproduction of all or part of this guide is prohibited. The information in this guide is subject to change without notice. We cannot be held liable for any problems arising from
NETWORK PRINT MONITOR User Guide
 NETWORK PRINT MONITOR User Guide Legal Notes Unauthorized reproduction of all or part of this guide is prohibited. The information in this guide is subject to change without notice. We cannot be held liable
WhatsUp Gold v16.3 Installation and Configuration Guide
 WhatsUp Gold v16.3 Installation and Configuration Guide Contents Installing and Configuring WhatsUp Gold using WhatsUp Setup Installation Overview... 1 Overview... 1 Security considerations... 2 Standard
HDA Integration Guide. Help Desk Authority 9.0
 HDA Integration Guide Help Desk Authority 9.0 2011ScriptLogic Corporation ALL RIGHTS RESERVED. ScriptLogic, the ScriptLogic logo and Point,Click,Done! are trademarks and registered trademarks of ScriptLogic
SOLARWINDS ORION. Patch Manager Evaluation Guide for ConfigMgr 2012
 SOLARWINDS ORION Patch Manager Evaluation Guide for ConfigMgr 2012 About SolarWinds SolarWinds, Inc. develops and markets an array of network management, monitoring, and discovery tools to meet the diverse
NETWRIX FILE SERVER CHANGE REPORTER
 NETWRIX FILE SERVER CHANGE REPORTER ADMINISTRATOR S GUIDE Product Version: 3.3 April/2012. Legal Notice The information in this publication is furnished for information use only, and does not constitute
TSM Studio Server User Guide 2.9.0.0
 TSM Studio Server User Guide 2.9.0.0 1 Table of Contents Disclaimer... 4 What is TSM Studio Server?... 5 System Requirements... 6 Database Requirements... 6 Installing TSM Studio Server... 7 TSM Studio
Silect Software s MP Author
 Silect MP Author for Microsoft System Center Operations Manager Silect Software s MP Author User Guide September 2, 2015 Disclaimer The information in this document is furnished for informational use only,
NETWRIX ACCOUNT LOCKOUT EXAMINER
 NETWRIX ACCOUNT LOCKOUT EXAMINER ADMINISTRATOR S GUIDE Product Version: 4.1 July 2014. Legal Notice The information in this publication is furnished for information use only, and does not constitute a
Server Manager Performance Monitor. Server Manager Diagnostics Page. . Information. . Audit Success. . Audit Failure
 Server Manager Diagnostics Page 653. Information. Audit Success. Audit Failure The view shows the total number of events in the last hour, 24 hours, 7 days, and the total. Each of these nodes can be expanded
WhatsUp Gold v16.2 Installation and Configuration Guide
 WhatsUp Gold v16.2 Installation and Configuration Guide Contents Installing and Configuring Ipswitch WhatsUp Gold v16.2 using WhatsUp Setup Installing WhatsUp Gold using WhatsUp Setup... 1 Security guidelines
Enterprise Vault Installing and Configuring
 Enterprise Vault Installing and Configuring Enterprise Vault 6.0 Legal Notice Copyright 2005 Symantec Corporation. All rights reserved. Symantec, the Symantec Logo, VERITAS, the VERITAS Logo, and Enterprise
Server Installation Guide ZENworks Patch Management 6.4 SP2
 Server Installation Guide ZENworks Patch Management 6.4 SP2 02_016N 6.4SP2 Server Installation Guide - 2 - Notices Version Information ZENworks Patch Management Server Installation Guide - ZENworks Patch
VERITAS Backup Exec TM 10.0 for Windows Servers
 VERITAS Backup Exec TM 10.0 for Windows Servers Quick Installation Guide N134418 July 2004 Disclaimer The information contained in this publication is subject to change without notice. VERITAS Software
Novell ZENworks Asset Management 7.5
 Novell ZENworks Asset Management 7.5 w w w. n o v e l l. c o m October 2006 USING THE WEB CONSOLE Table Of Contents Getting Started with ZENworks Asset Management Web Console... 1 How to Get Started...
EventSentry Overview. Part I About This Guide 1. Part II Overview 2. Part III Installation & Deployment 4. Part IV Monitoring Architecture 13
 Contents I Part I About This Guide 1 Part II Overview 2 Part III Installation & Deployment 4 1 Installation... with Setup 5 2 Management... Console 6 3 Configuration... 7 4 Remote... Update 10 Part IV
Installing Windows Rights Management Services with Service Pack 2 Step-by- Step Guide
 Installing Windows Rights Management Services with Service Pack 2 Step-by- Step Guide Microsoft Corporation Published: October 2006 Author: Brian Lich Editor: Carolyn Eller Abstract This step-by-step guide
TANDBERG MANAGEMENT SUITE 10.0
 TANDBERG MANAGEMENT SUITE 10.0 Installation Manual Getting Started D12786 Rev.16 This document is not to be reproduced in whole or in part without permission in writing from: Contents INTRODUCTION 3 REQUIREMENTS
Dell Spotlight on Active Directory 6.8.4. Deployment Guide
 Dell Spotlight on Active Directory 6.8.4 2014 Dell Inc. ALL RIGHTS RESERVED. This guide contains proprietary information protected by copyright. The software described in this guide is furnished under
BillQuick Agent 2010 Getting Started Guide
 Time Billing and Project Management Software Built With Your Industry Knowledge BillQuick Agent 2010 Getting Started Guide BQE Software, Inc. 2601 Airport Drive Suite 380 Torrance CA 90505 Support: (310)
Archive Attender Version 3.5
 Archive Attender Version 3.5 Getting Started Guide Sherpa Software (800) 255-5155 www.sherpasoftware.com Page 1 Under the copyright laws, neither the documentation nor the software can be copied, photocopied,
Step-by-Step Guide for Microsoft Advanced Group Policy Management 4.0
 Step-by-Step Guide for Microsoft Advanced Group Policy Management 4.0 Microsoft Corporation Published: September 2009 Abstract This step-by-step guide describes a sample scenario for installing Microsoft
How To Use Senior Systems Cloud Services
 Senior Systems Cloud Services In this guide... Senior Systems Cloud Services 1 Cloud Services User Guide 2 Working In Your Cloud Environment 3 Cloud Profile Management Tool 6 How To Save Files 8 How To
Oracle Enterprise Manager. Description. Versions Supported
 Oracle Enterprise Manager System Monitoring Plug-in Installation Guide for Microsoft SQL Server Release 12 (4.1.3.2.0) E18740-01 November 2010 This document provides a brief description about the Oracle
Veeam Backup Enterprise Manager. Version 7.0
 Veeam Backup Enterprise Manager Version 7.0 User Guide August, 2013 2013 Veeam Software. All rights reserved. All trademarks are the property of their respective owners. No part of this publication may
CA ARCserve Replication and High Availability for Windows
 CA ARCserve Replication and High Availability for Windows Microsoft Exchange Server Operation Guide r15 This documentation and any related computer software help programs (hereinafter referred to as the
Veritas Cluster Server Database Agent for Microsoft SQL Configuration Guide
 Veritas Cluster Server Database Agent for Microsoft SQL Configuration Guide Windows Server 2003, Windows Server 2008 5.1 Veritas Cluster Server Database Agent for Microsoft SQL Configuration Guide Copyright
CA XOsoft Replication for Windows
 CA XOsoft Replication for Windows Microsoft SQL Server Operation Guide r12.5 This documentation and any related computer software help programs (hereinafter referred to as the Documentation ) is for the
2X ApplicationServer & LoadBalancer Manual
 2X ApplicationServer & LoadBalancer Manual 2X ApplicationServer & LoadBalancer Contents 1 URL: www.2x.com E-mail: info@2x.com Information in this document is subject to change without notice. Companies,
Oracle Enterprise Manager. Description. Versions Supported
 Oracle Enterprise Manager System Monitoring Plug-in Installation Guide for Microsoft SQL Server Release 10 (4.0.3.1.0) E14811-03 June 2009 This document provides a brief description about the Oracle System
Audit Management Reference
 www.novell.com/documentation Audit Management Reference ZENworks 11 Support Pack 3 February 2014 Legal Notices Novell, Inc., makes no representations or warranties with respect to the contents or use of
Introduction to Hyper-V High- Availability with Failover Clustering
 Introduction to Hyper-V High- Availability with Failover Clustering Lab Guide This lab is for anyone who wants to learn about Windows Server 2012 R2 Failover Clustering, focusing on configuration for Hyper-V
SC-T35/SC-T45/SC-T46/SC-T47 ViewSonic Device Manager User Guide
 SC-T35/SC-T45/SC-T46/SC-T47 ViewSonic Device Manager User Guide Copyright and Trademark Statements 2014 ViewSonic Computer Corp. All rights reserved. This document contains proprietary information that
NETWRIX EVENT LOG MANAGER
 NETWRIX EVENT LOG MANAGER ADMINISTRATOR S GUIDE Product Version: 4.0 July/2012. Legal Notice The information in this publication is furnished for information use only, and does not constitute a commitment
Security Explorer 9.5. User Guide
 2014 Dell Inc. ALL RIGHTS RESERVED. This guide contains proprietary information protected by copyright. The software described in this guide is furnished under a software license or nondisclosure agreement.
Table of Contents. Introduction...9. Installation...17. Program Tour...31. The Program Components...10 Main Program Features...11
 2011 AdRem Software, Inc. This document is written by AdRem Software and represents the views and opinions of AdRem Software regarding its content, as of the date the document was issued. The information
Managing Linux Servers with System Center 2012 R2
 Managing Linux Servers with System Center 2012 R2 System Center 2012 R2 Hands-on lab In this lab, you will use System Center 2012 R2 Operations Manager and System Center 2012 R2 Configuration Manager to
OrgPublisher EChart Server Setup Guide
 Table of Contents Table of Contents Introduction... 3 Role Requirements for Installation... 3 Prerequisites for Installation... 3 About OrgPublisher ECharts... 3 About EChart Rich Client Publishing...
FileMaker Server 11. FileMaker Server Help
 FileMaker Server 11 FileMaker Server Help 2010 FileMaker, Inc. All Rights Reserved. FileMaker, Inc. 5201 Patrick Henry Drive Santa Clara, California 95054 FileMaker is a trademark of FileMaker, Inc. registered
ALTIRIS Software Delivery Solution for Windows 6.1 SP3 Product Guide
 ALTIRIS Software Delivery Solution for Windows 6.1 SP3 Product Guide Notice Altiris Software Delivery Solution for Windows 6.1 SP3 Product Guide 2007 Altiris, Inc. All rights reserved. Document Date: February
WebSpy Vantage Ultimate 2.2 Web Module Administrators Guide
 WebSpy Vantage Ultimate 2.2 Web Module Administrators Guide This document is intended to help you get started using WebSpy Vantage Ultimate and the Web Module. For more detailed information, please see
NETWRIX USER ACTIVITY VIDEO REPORTER
 NETWRIX USER ACTIVITY VIDEO REPORTER ADMINISTRATOR S GUIDE Product Version: 1.0 January 2013. Legal Notice The information in this publication is furnished for information use only, and does not constitute
User Guidance. CimTrak Integrity & Compliance Suite 2.0.6.19
 CimTrak Integrity & Compliance Suite 2.0.6.19 Master Repository Management Console File System Agent Network Device Agent Command Line Utility Ping Utility Proxy Utility FTP Repository Interface User Guidance
Online Help StruxureWare Data Center Expert
 Online Help StruxureWare Data Center Expert Version 7.2.1 What's New in StruxureWare Data Center Expert 7.2.x Learn more about the new features available in the StruxureWare Data Center Expert 7.2.x release.
Richmond SupportDesk Web Reports Module For Richmond SupportDesk v6.72. User Guide
 Richmond SupportDesk Web Reports Module For Richmond SupportDesk v6.72 User Guide Contents 1 Introduction... 4 2 Requirements... 5 3 Important Note for Customers Upgrading... 5 4 Installing the Web Reports
Digipass Plug-In for IAS. IAS Plug-In IAS. Microsoft's Internet Authentication Service. Installation Guide
 Digipass Plug-In for IAS IAS Plug-In IAS Microsoft's Internet Authentication Service Installation Guide Disclaimer of Warranties and Limitations of Liabilities Disclaimer of Warranties and Limitations
Version 3.8. Installation Guide
 Version 3.8 Installation Guide Copyright 2007 Jetro Platforms, Ltd. All rights reserved. This document is being furnished by Jetro Platforms for information purposes only to licensed users of the Jetro
Novell ZENworks Asset Management
 Novell ZENworks Asset Management Administrative Best Practices and Troubleshooting www.novell.com APRIL 19, 2005 2 GETTING THE MOST OUT OF NOVELL ZENWORKS ASSET MANAGEMENT The award-winning asset tracking
Dell Recovery Manager for Active Directory 8.6. Quick Start Guide
 Dell Recovery Manager for Active Directory 8.6 2014 Dell Inc. ALL RIGHTS RESERVED. This guide contains proprietary information protected by copyright. The software described in this guide is furnished
Avaya Network Configuration Manager User Guide
 Avaya Network Configuration Manager User Guide May 2004 Avaya Network Configuration Manager User Guide Copyright Avaya Inc. 2004 ALL RIGHTS RESERVED The products, specifications, and other technical information
For Active Directory Installation Guide
 For Active Directory Installation Guide Version 2.5.2 April 2010 Copyright 2010 Legal Notices makes no representations or warranties with respect to the contents or use of this documentation, and specifically
User Document. Adobe Acrobat 7.0 for Microsoft Windows Group Policy Objects and Active Directory
 Adobe Acrobat 7.0 for Microsoft Windows Group Policy Objects and Active Directory Copyright 2005 Adobe Systems Incorporated. All rights reserved. NOTICE: All information contained herein is the property
Lenovo Online Data Backup User Guide Version 1.8.14
 Lenovo Online Data Backup User Guide Version 1.8.14 Contents Chapter 1: Installing Lenovo Online Data Backup...5 Downloading the Lenovo Online Data Backup Client...5 Installing the Lenovo Online Data
StarWind Virtual SAN Installation and Configuration of Hyper-Converged 2 Nodes with Hyper-V Cluster
 #1 HyperConverged Appliance for SMB and ROBO StarWind Virtual SAN Installation and Configuration of Hyper-Converged 2 Nodes with MARCH 2015 TECHNICAL PAPER Trademarks StarWind, StarWind Software and the
User Guide Release 3.5
 September 19, 2013 User Guide Release 3.5 User Guide Revision/Update Information: September 19, 2013 Software Version: PowerBroker Auditor for File System 3.5 Revision Number: 0 COPYRIGHT NOTICE Copyright
Management Center. Installation and Upgrade Guide. Version 8 FR4
 Management Center Installation and Upgrade Guide Version 8 FR4 APPSENSE MANAGEMENT CENTER INSTALLATION AND UPGRADE GUIDE ii AppSense Limited, 2012 All rights reserved. part of this document may be produced
NetWrix Account Lockout Examiner Version 4.0 Administrator Guide
 NetWrix Account Lockout Examiner Version 4.0 Administrator Guide Table of Contents Concepts... 1 Product Architecture... 1 Product Settings... 2 List of Managed Domains and Domain Controllers... 2 Email
Velocity Web Services Client 1.0 Installation Guide and Release Notes
 Velocity Web Services Client 1.0 Installation Guide and Release Notes Copyright 2014-2015, Identiv. Last updated June 24, 2015. Overview This document provides the only information about version 1.0 of
Administration GUIDE. Exchange Database idataagent. Published On: 11/19/2013 V10 Service Pack 4A Page 1 of 233
 Administration GUIDE Exchange Database idataagent Published On: 11/19/2013 V10 Service Pack 4A Page 1 of 233 User Guide - Exchange Database idataagent Table of Contents Overview Introduction Key Features
How To Test Your Web Site On Wapt On A Pc Or Mac Or Mac (Or Mac) On A Mac Or Ipad Or Ipa (Or Ipa) On Pc Or Ipam (Or Pc Or Pc) On An Ip
 On A Mac Or Ipad Or Ipa (Or Ipa) On Pc Or Ipam (Or Pc Or Pc) On An Ip") Load testing with WAPT: Quick Start Guide This document describes step by step how to create a simple typical test for a web application, execute it and interpret the results. A brief insight is provided
Load testing with WAPT: Quick Start Guide This document describes step by step how to create a simple typical test for a web application, execute it and interpret the results. A brief insight is provided
Moxa Device Manager 2.3 User s Manual
 User s Manual Third Edition, March 2011 www.moxa.com/product 2011 Moxa Inc. All rights reserved. User s Manual The software described in this manual is furnished under a license agreement and may be used
CA Spectrum and CA Service Desk
 CA Spectrum and CA Service Desk Integration Guide CA Spectrum 9.4 / CA Service Desk r12 and later This Documentation, which includes embedded help systems and electronically distributed materials, (hereinafter
High Availability Setup Guide
 High Availability Setup Guide Version: 9.0 Released: March 2015 Companion Guides: The UniPrint Infinity Administrator s Guide, Cluster Guide and Mobile Setup Guide can be found online for your convenience
NETWRIX EVENT LOG MANAGER
 NETWRIX EVENT LOG MANAGER QUICK-START GUIDE FOR THE ENTERPRISE EDITION Product Version: 4.0 July/2012. Legal Notice The information in this publication is furnished for information use only, and does not
DriveLock Quick Start Guide
 Be secure in less than 4 hours CenterTools Software GmbH 2012 Copyright Information in this document, including URL and other Internet Web site references, is subject to change without notice. Unless otherwise
Installation Guide for Pulse on Windows Server 2008R2
 MadCap Software Installation Guide for Pulse on Windows Server 2008R2 Pulse Copyright 2014 MadCap Software. All rights reserved. Information in this document is subject to change without notice. The software
How To Install Caarcserve Backup Patch Manager 27.3.2.2 (Carcserver) On A Pc Or Mac Or Mac (Or Mac)
 On A Pc Or Mac Or Mac (Or Mac)") CA ARCserve Backup Patch Manager for Windows User Guide r16 This Documentation, which includes embedded help systems and electronically distributed materials, (hereinafter referred to as the Documentation
CA ARCserve Backup Patch Manager for Windows User Guide r16 This Documentation, which includes embedded help systems and electronically distributed materials, (hereinafter referred to as the Documentation
SonicWALL CDP 5.0 Microsoft Exchange InfoStore Backup and Restore
 SonicWALL CDP 5.0 Microsoft Exchange InfoStore Backup and Restore Document Scope This solutions document describes how to configure and use the Microsoft Exchange InfoStore Backup and Restore feature in
XenClient Enterprise Synchronizer Installation Guide
 XenClient Enterprise Synchronizer Installation Guide Version 5.1.0 March 26, 2014 Table of Contents About this Guide...3 Hardware, Software and Browser Requirements...3 BIOS Settings...4 Adding Hyper-V
7.5 7.5. Spotlight on Messaging. Evaluator s Guide
 7.5 Spotlight on Messaging 7.5 Evaluator s Guide 2010 Quest Software, Inc. ALL RIGHTS RESERVED. This guide contains proprietary information protected by copyright. The software described in this guide
email-lead Grabber Business 2010 User Guide
 email-lead Grabber Business 2010 User Guide Copyright and Trademark Information in this documentation is subject to change without notice. The software described in this manual is furnished under a license
Sophos for Microsoft SharePoint startup guide
 Sophos for Microsoft SharePoint startup guide Product version: 2.0 Document date: March 2011 Contents 1 About this guide...3 2 About Sophos for Microsoft SharePoint...3 3 System requirements...3 4 Planning
Metalogix SharePoint Backup. Advanced Installation Guide. Publication Date: August 24, 2015
 Metalogix SharePoint Backup Publication Date: August 24, 2015 All Rights Reserved. This software is protected by copyright law and international treaties. Unauthorized reproduction or distribution of this
Team Foundation Server 2012 Installation Guide
 Team Foundation Server 2012 Installation Guide Page 1 of 143 Team Foundation Server 2012 Installation Guide Benjamin Day benday@benday.com v1.0.0 November 15, 2012 Team Foundation Server 2012 Installation
Studio 5.0 User s Guide
 Studio 5.0 User s Guide wls-ug-administrator-20060728-05 Revised 8/8/06 ii Copyright 2006 by Wavelink Corporation All rights reserved. Wavelink Corporation 6985 South Union Park Avenue, Suite 335 Midvale,
Option Network Management Software for UPS UNMS II
 Option Network Management Software for UPS UNMS II AEG Power Supply Systems GmbH Department: PSS E1 Name: Brandt/Rogge Revision: 00 Date: 20.05.2006 Operating Instructions...6000004951 BAL, en Legal Information
FileMaker Server 10 Help
 FileMaker Server 10 Help 2007-2009 FileMaker, Inc. All Rights Reserved. FileMaker, Inc. 5201 Patrick Henry Drive Santa Clara, California 95054 FileMaker, the file folder logo, Bento and the Bento logo
POLICY PATROL MFT. Manual
 POLICY PATROL MFT Manual MANUAL Policy Patrol MFT This manual, and the software described in this manual, are copyrighted. No part of this manual or the described software may be copied, reproduced, translated
Server Manual. For Administrators of Cameleon Version 4
 Server Manual For Administrators of Cameleon Version 4 Cameleon Version 4 Server Manual For Administrators of Cameleon Version 4 R4-07OCT04 Copyright 2004 360 Surveillance Inc. Camera Cameleon is a trademark
DiskBoss. File & Disk Manager. Version 2.0. Dec 2011. Flexense Ltd. www.flexense.com info@flexense.com. File Integrity Monitor
 DiskBoss File & Disk Manager File Integrity Monitor Version 2.0 Dec 2011 www.flexense.com info@flexense.com 1 Product Overview DiskBoss is an automated, rule-based file and disk manager allowing one to
MGC WebCommander Web Server Manager
 MGC WebCommander Web Server Manager Installation and Configuration Guide Version 8.0 Copyright 2006 Polycom, Inc. All Rights Reserved Catalog No. DOC2138B Version 8.0 Proprietary and Confidential The information
Backup Assistant. User Guide. NEC NEC Unified Solutions, Inc. March 2008 NDA-30282, Revision 6
 Backup Assistant User Guide NEC NEC Unified Solutions, Inc. March 2008 NDA-30282, Revision 6 Liability Disclaimer NEC Unified Solutions, Inc. reserves the right to change the specifications, functions,
CentreWare Internet Services Setup and User Guide. Version 2.0
 CentreWare Internet Services Setup and User Guide Version 2.0 Xerox Corporation Copyright 1999 by Xerox Corporation. All rights reserved. XEROX, The Document Company, the digital X logo, CentreWare, and
Sage 200 Web Time & Expenses Guide
 Sage 200 Web Time & Expenses Guide Sage (UK) Limited Copyright Statement Sage (UK) Limited, 2006. All rights reserved If this documentation includes advice or information relating to any matter other than
SolarWinds Migrating SolarWinds NPM Technical Reference
 SolarWinds Migrating SolarWinds NPM Technical Reference Copyright 1995-2015 SolarWinds Worldwide, LLC. All rights reserved worldwide. No part of this document may be reproduced by any means nor modified,
File and Printer Sharing with Microsoft Windows
 Operating System File and Printer Sharing with Microsoft Windows Microsoft Corporation Published: November 2003 Abstract File and printer sharing in Microsoft Windows allows you to share the contents of
TIBCO Spotfire Automation Services 6.5. Installation and Deployment Manual
 TIBCO Spotfire Automation Services 6.5 Installation and Deployment Manual Revision date: 17 April 2014 Important Information SOME TIBCO SOFTWARE EMBEDS OR BUNDLES OTHER TIBCO SOFTWARE. USE OF SUCH EMBEDDED
GP REPORTS VIEWER USER GUIDE
 GP Reports Viewer Dynamics GP Reporting Made Easy GP REPORTS VIEWER USER GUIDE For Dynamics GP Version 2015 (Build 5) Dynamics GP Version 2013 (Build 14) Dynamics GP Version 2010 (Build 65) Last updated
Sophos Enterprise Console Help. Product version: 5.1 Document date: June 2012
 Sophos Enterprise Console Help Product version: 5.1 Document date: June 2012 Contents 1 About Enterprise Console...3 2 Guide to the Enterprise Console interface...4 3 Getting started with Sophos Enterprise
NetIQ Aegis Adapter for VMware vcenter Server
 Contents NetIQ Aegis Adapter for VMware vcenter Server Configuration Guide May 2011 Overview... 1 Product Requirements... 1 Supported Configurations... 2 Implementation Overview... 2 Ensuring Minimum Rights
Synchronizer Installation
 Synchronizer Installation Synchronizer Installation Synchronizer Installation This document provides instructions for installing Synchronizer. Synchronizer performs all the administrative tasks for XenClient
DiskPulse DISK CHANGE MONITOR
 DiskPulse DISK CHANGE MONITOR User Manual Version 7.9 Oct 2015 www.diskpulse.com info@flexense.com 1 1 DiskPulse Overview...3 2 DiskPulse Product Versions...5 3 Using Desktop Product Version...6 3.1 Product