RECONCILING CHINA'S TRADE STATISTICS
|
|
|
- Jesse Bridges
- 8 years ago
- Views:
Transcription
1 IPC STAFF PAPER NO. 76 RECONCILING CHINA'S TRADE STATISTICS by Loraine A. West Bureau of the Census Population Division International Programs Center Eurasia Branch June 1995

2

3 EXECUTIVE SUMMARY I I I e a Since the mid-1 980s trade between the United States and China has grown rapidly. However, the divergence in U.S. and Chinese statistics measuring this trade has grown even more rapidly. In 1992, China reported exports to the United States of US$ 8.6 billion and imports of US$ 8.9 billion, almost balanced trade. Yet, U.S. statistics showed imports from China of US$ 27.5 billion and exports of USS7.4 billion, a US$ 20 billion trade deficit. This pattern of discrepancy also is common between Chinese and other partner country trade statistics. These differences in trade statistics generate friction in partner countries as they perceive themselves to be generating significant deficits in their economic relations with China. Further, the discrepancies in data make it very difficult for countries, such as the United States, to determine competitiveness and markets. This study identifies potential sources of discrepancies in trade statistics, attempts to evaluate and measure them, and establishes a methodology for reconciling Chinese and partner country data. Discrepancies in trade statistics can be separated into two major types: 1) those that originate in the definitions, concepts and methods used to compile statistics, and 2) those that originate in external circumstances. In this report, our initial focus is on U.S.-Chinese trade; however, the lessons learned in examining and reconciling U.S. and Chinese statistics then are applied to other countries to determine an adjusted set of global trade figures for China. By far the most important factor in differences between Chinese and U.S. trade statistics in 1992 is the accounting of goods transported via Hong Kong. For a number of trade transactions passing through Hong Kong, U.S. and Chinese trade accounts record different partner countries. This difference in partner country attribution probably accounts for more than half of the discrepancy in statistics on trade flows from China and nearly half of the discrepancy on trade flows from the United States. The second largest factor in reconciling bilateral trade statistics is the reexport margin, also referred to as transit trade markup. This factor also is related to the large volume of Chinese trade that is funneled through Hong Kong. In this case, the difference is not a statistical artifact but the cost added to goods by businesses or other intermediaries in Hong Kong after they have left China. This factor accounts for another 16 percent of the discrepancy in trade flows from China and 24 percent of the discrepancy in flows from the United States. e One other definitional factor is a major contributor to the discrepancy: differing valuation procedures used in reporting trade, CIF vs. FOB. The valuation difference is the second most important factor in reconciling U.S. reported exports with Chinese reported imports and the third most important factor in reconciling U.S. reported imports with Chinese reported exports. The final significant factor -- an external one -- affecting trade statistics is timing. The time lag between the registration of an export and its registration as an import in the receiving iii

4 country depends on the distance and mode of transport, but it is about one month in the case of the U.S. and China. In addition to the four major sources noted above, there are numerous other definitional and external factors that can be identified as contributing to the discrepancy between U.S. and Chinese trade statistics. These include other definitional and methodological factors such as: type of trade system (special vs. general) use of low-value threshold, and geographical boundaries; and external factors such as: change in destination after export, and smuggling. While we cannot estimate the value of these factors in all cases, we feel they result in negligible differences as compared to the major factors. Starting with U.S. reported trade statistics and taking into account the fow major factors, we are able to determine a range of reconciled figures for China's trade with the United States. The range reflects our uncertainty concerning the largest element, partner country attribution on trade through Hong Kong. Adjusting U.S. reported imports from China lowers the figure to US8 8.1 to US$ billion. The Chinese reported figure of US$ 8.6 billion in exports to the U.S. falls in the lower end of this range. Similarly we adjust U.S. reported exports of US$ 7.5 billion to China and estimate a range of US8 9.0 to US billion. The lower end of this range still exceeds slightly China's reported imports from the U.S. of US$ 8.9 billion. We then use what was learned from analyzing bilateral U.S. and China trade statistics and assessing the role of Hong Kong,in C9ina's indirect trade to derive a range of adjusted global import and export trade fiiures for China. The figures are based on statistics from China's 12 major trading partners. An algorithm is used that adjusts for the known discrepancies: 1 ) FOB-CIF valuation difference; 2) the reexport margin added by Hong Kong; 3)differences in partner country attribution; and 4) the time lag effect. We estimate three scenarios with different sets of assumptions regarding the impact of the known sources of discrepancy to arrive at a range of estimates for trade flows in both directions. China's adjusted global imports range from US$ 68.5 to US billion. China's reported global imports of US880.6 billion exceed estimates for all three scenarios. Estimates of China's adjusted global exports range from US$ 80.9 to US$ billion, straddling China's reported exports of approximately US$ 92 billion. Because ranges are estimated for both adjusted global imports and adjusted global exports, the range for China's trade balance is large: US$ 3.3'to US$ 36.8 billion. According to China's reported trade statistics, China achieved a US$ 11.4 billion trade surplus in One might expect that the partner country attribution problem would disappear when dealing with China's global trade figures. On a bilateral basis two countries may differ in the recording of the trading partner but globally the trade should balance out. However, because Hong Kong serves as a major trade transit center, Hong Kong records separately domestic iv
 use of low-value threshold, and geographical boundaries; and external factors such as: change in destination after export, and smuggling.")
5 e exports and those goods it is reexporting. To avoid double counting, Hong Kong domestic imports and exports are used in the adding up of partner trade data. Therefore, the possibility of partner country attribution differences remains for China's global trade. These differences arise for a variety of reasons including: 1) the final destination is unknown at the time of export; 2) countries apply different rules in determining country of origin; and 3) political sensitivity in identifying a particular trading partner. For China's reported global imports to be consistent with partner country statistics, China's trading partners must attribute half of the value of exports that are shipped through third countries as exports to the third country rather than to China. There is evidence that some U.S. products are recorded as exports to Hong Kong even though they ultimately are being reexported by Hong Kong to China. It is perfectly understapdable that this will happen occasionally given the geographic proximity of Hong Kong to China and the major involvement of Hong Kong businesses in China trade. How frequently it occurs is impossible to say without more detailed information. In 1992 Taiwan is perhaps the most extreme example of 0 the difference in partner country attribution. Taiwan attributed only US$ 1 million in exports to China yet Hong Kong reported reexports of Taiwan goods to China exceeding USS6 billion and China recorded nearly US$ 6 billion in imports from Taiwan. When adjusting China's global exports, one scenario assumes there are no partner 0 country attribution differences. In this scenario, Chinq's adjusted global exports are only about US$ 81 billion, 15 percent less than China's reported global exports. Higher Chinese official statistics for global exports could be consistent with legitimate Chinese exports that pass through Hong Kong and are not recorded by any partner country as a domestic import. Starting in 1993, the discrepancies caused by Hong Kong reexports declined substantially with an improvement in the verification of the declared destination for exports by China oustoms. Nevertheless, a portion of Chinese exports shipped through Hong Kong continue to be classified by China as exports to Hong Kong because the final destination is not known at the time of shipping. Therefore, the overlap between Hong Kong reexports and China's reported exports to the United States and other countries has increased. While the gap between China's official trade statistics and those compiled by its trading partners narrowed significantly in 1993; a gap will persist because of the major role of Hong Kong in China's indirect trade. In addition to the country attribution problem, Hong Kong businesses continue to add a margin to the goods reexported to and from China.

6

7 CONTENTS mw EXECUTIVESUMMARY... iii C I. INTRODUCTION... 1 II. SOURCES OF DISCREPANCIES IN TRADE STATISTICS... 4 Differences in Definitions. Concepts. and Methodology... 4 Valuation... 4 Partner Country Attribution... 6 System of Trade Low-value Threshold Valuation of Processed Goods Classification System Geographic Definition of Partner Country Coverage External Causes of Trade Discrepancies Change in Value in Transit Change in Destination After Export Smuggling TimeLag Ill. SUMMARY OF EFFECT ON U.S..CHINA TRADE STATISTICS IV. ADJUSTED TOTAL TRADE FOR CHINA The Role of Hong Kong in Indirect Trade China's Adjusted Imports China's Adjusted Exports Implications V. THE PATTERN OF DISCREPANCIES VI. RECENT AND FUTURE CHANGES IN SOURCES OF DISCREPANCIES APPENDIX A. TABLES... : APPENDIX B. U.S..CHINA TRADE ROUTES AND TRADE DISCREPANCIES BIBLIOGRAPHY

8 Table CONTENTS (continued) TABLES!?mi 1. Differences in United States and Partner Country Trade Statistics Comparison of U.S. and China Trade Statistical Procedures and Definitions China's Trade with Puerto Rico U.S.-China Trade Through Puerto Rico and U.S. Virgin Islands Customs Districts, 1992 and Comparison of U.S. and China Coverage in Trade Statistics Devaluation of Chinese Yuan Vis a Vis Trading Partner Currencies in Sources of Discrepancies and Their Effect on U.S. Trade Statistics Relative to China's Trade Statistics, Adjustment to U.S. Reported Imports from China and Exports to China, Hong Kong lmports from China and Reexports of Chinese Goods, Share of Hong Kong Reexports by Country of Destination and Origin, The Role of Hong Kong Reexports, Adjustment of China's Global Imports Under Three Scenarios, Adjustment of China's Global Exports Under Three Scenarios, a. Percentage Difference Between China's Reported lmports and Trading Partner's Reported Exports, SlTC 1 -digit, b. Difference Between China's Reported Imports and Trading Partner's ReportedExports, a. Percentage Difference Between China's Reported Exports and Trading Partner's Reported Imports, SlTC 1 -digit, b. Difference Between China's Reported Exports and Trading Partner's Reported Imports, SlTC 1 -digit, Difference Between China's Reported lmports and Trading Partner's Reported Exports, SlTC 2-digit,

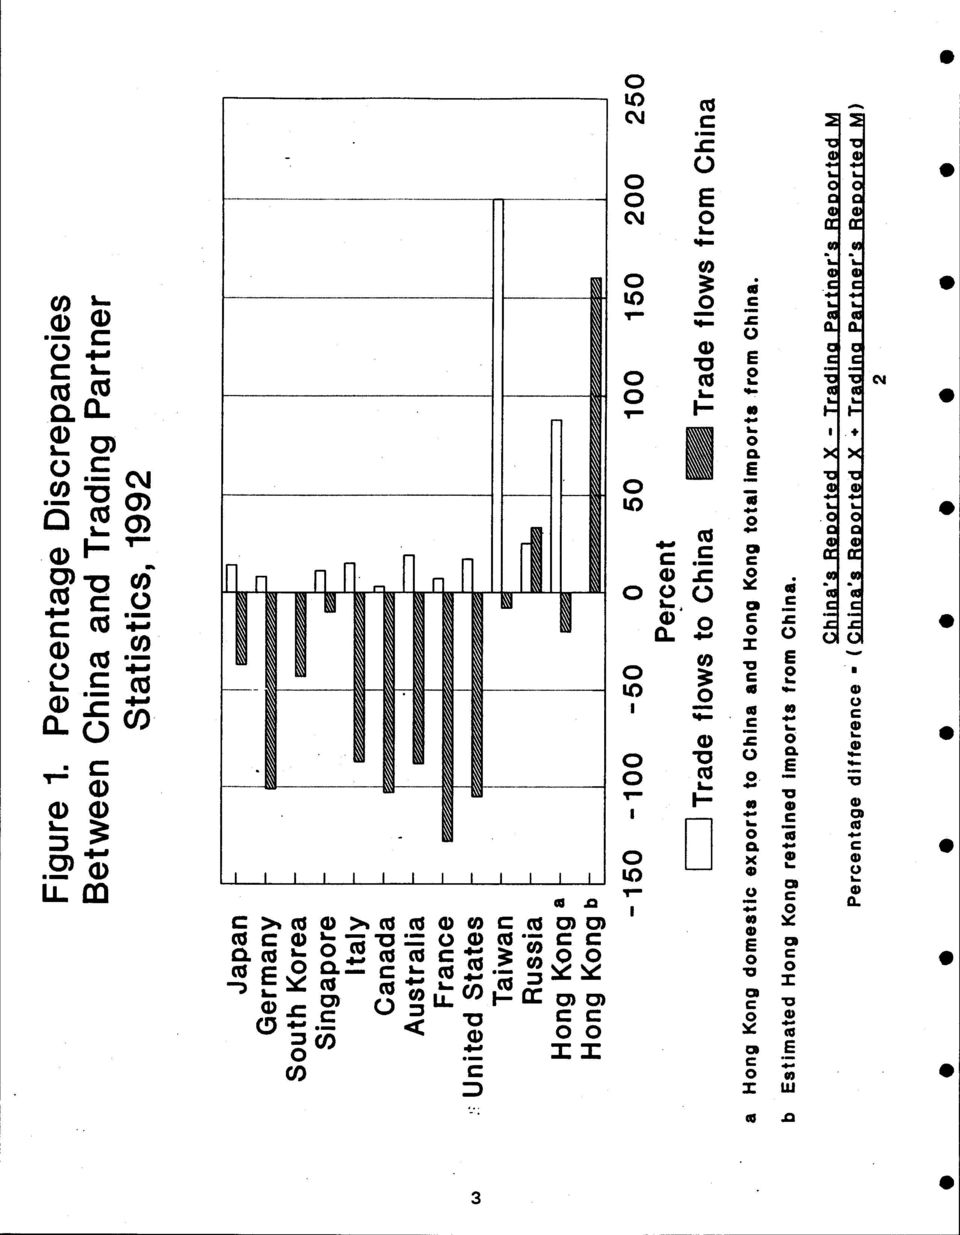
9 CONTENTS (continued) 17. Difference Between China's Reported Exports and Trading Partner's Reported Imports, SlTC 2-digit, Distribution of China's Imports and Exports by Category, Change in China's Reported Exports to Selected Countries..., I I* Figure FIGURES 1. Percentage Discrepancies Between China and Trading Partner Statistics, U.S. Exports and Hong Kong Re-exports of U.S. Fresh Fruit to China, Tobacco and Tobacco Products: U.S. Exports and Hong Kong Reexports to China and China Total Imports, I* 4. An Illustration of Trade Flows from China to the United States I 5. An lllustration of Trade Flows from the United States to China Absolute Discrepancies Between China and Trading Partner Statistics, I@ Table APPENDIX TABLES A Trade Flow from U.S. to China A Trade Flow from China to U.S I A Trade Flow from Japan to China I a A Trade Flow from China to Japan A Trade Flow from Taiwan to China A 'Trade Flow from China to Taiwan '* A Trade Flow from Germany to China viii

10 Table CONTENTS (continued) APPENDIX TABLES h!u A ~rade Flow from China to Germany A Trade Flow from South Korea to China A Trade Flow from China to South Korea A Trade Flow from Singapore to China A Trade Flow from China to Singapore A Trade Flow from Italy to China A Trade Flow from China to Italy A Trade Flow from Canada to China A Trade Flow from China to Canada A Trade Flow from Australia to China A Trade Flow from China to Australia A ~rade low from ~rance to china A Trade Flow from Hong Kong to China A Trade Flow from China to Hong Kong A Trade Flow from China to France 99. * Figure APPENDIX FIGURES

11

12 I. INTRODUCTION China's total merchandise trade grew by an average annual rate of 12 percent from 1980 to 1992, experiencing more than a fourfold increase from US$ 38 billion to US$ 166 billion. At the same time, the divergence widened between U.S. and China statistics on their bilateral trade. The gap increased annually by 27 percent from 1986 to 1992 (from less than US$4 billion to over USS20 billion), a far greater increase in the divergence than would have been expected given overall growth in trade. In 1993 China's total merchandise trade increased to US$ 197 billion and the. gap in the two countries trade statistics narrowed slightly to US$ 16.5 billion. A comprehensive understanding of the U.S.-China bilateral trade balance and China's total trade is essential for several reams. First, the perceived gap contributes to trade friction between the two countries with U.S. statistics showing an ever increasing trade deficit with China while Chinese statistics indicated a U.S. trade surplus until Second, to determine U.S. competitiveness in the China market it is necessary to know what U.S. products are actually reaching its market and how the U.S. compares with China's other major trading partners. Third, U.S. competitiveness against China as an exporter rapidly moving up the technology ladder in the world market will be clearer. Fourth, clarification of China's world trade volume is critical to determining China's role in the new World Trade Organization (successor to the General Agreement on Tariffs and Trade or GATT). There are numerous reasons why the trade statistics of two countries differ. In fact, it would be unusual for them to be the same. It is common for the U.S. to experience a discrepancy between its trade statistics and those of its trading partner (Table 1). However, the gap between U.S. and Chinese statistics on bilateral trade has grown to the point where in 1992 it represented 56 percent of total bilateral trade based on U.S. statistics (or 106 percent based on Chinese statistics). Difference in U.S. (U.S. statistics) (partner statistics) Japan (1 990) South Korea (1 991) EC (1989) China (1 992) Sources: various press releases from U.S. Department of Commerce, Bureau of the Census, Foreign Trade Division CB-94-36, CB , CB , CB

13 The United States is not the only country with substantial differences between its published trade statistics and those published by China. A number of China's other major trading partners also face large discrepancies in trade statistics (Figure 1). The countries shown in Figure 1 were China's top twelve trading partners in 1992 and represented over 80 percent of total trade according to Chinese statistics. This common problem has led to several bilateral and multilateral trade reconciliation attempts. China and the European Community have undertaken two studies of the discrepancies in trade statistics, the first in 1988 and the most recent in The Working Group on the accession of China to GATT established an Informal Group of Experts on Export Statistics to analyze discrepancies in published trade flows. The Foreign Trade Division, U.S. Bureau of the Census is in the midst of a trade reconciliation exercise with China's Ministry of Foreign Trade and Economic Cooperation. The purpose of this study is to develop a methodology to reconcile China's trade statistics with those of the United States and China's other trading partners. The first step in devising such a methodology is to identify the sources and causes of the discrepancy. A careful examination of U.S. and Chinese trade procedures and definitions reveals a number of differences that can contribute to the discrepancy. There also are causes external to the trade statistics compilation systems of the two countries that have the potential to lead to gaps. After identifying the sources and causes, a determination is made as to which are likely to be major contributors to the discrepancy. We attempt to quantify those sources of discrepancy for which adequate information is available, using 1992 as the base. Many of the procedural and definitional differences result in only negligible divergences. However, it is found that two of the largest sources of discrepancy, transit trade markup and partner country attribution, are linked to the major role played by Hong Kong in China's indirect trade. Based on the identification and quantification of the sources of discrepancy, separate algorithms are developed that adjust U.S. import and export trade statistics for the discrepancies. After the adjustments are made, the remaining gap is comparable to that experienced between the U.S. and other trading partners. For trade flows from China to the United States, China's recording of exports to the U.S. as exports to a third country, primarily Hong Kong is the largest source of discrepancy, accounting for up to 80 percent of the gap between U.S. and Chinese statistics. The transit trade markup on Chinese goods shipped through Hong ~ ong accounts for roughly US$ 3 billion of the nearly US$ 19 billion gap. The gap is smaller in absolute and percentage terms for trade flows from the U.S. to China. The recording of exports to China shipped through Hong Kong as exports to Hong Kong by the U.S. is the major source of discrepancy along with the FOB-CIF valuation difference. Next, we apply what is learned in the detailed exercise on U.S.-China trade statistics and what is gleaned from a closer examination of the role of Hong Kong in indirect trade to develop algorithms for estimating China's adjusted global imports and exports. The identified sources of discrepancy indicate China overstates reported imports slightly. For China's reported global exports to be consistent with partner country statistics, some Chinese exports must not be recorded as domestic imports by the partner country.

14
15 II. SOURCES OF DISCREPANCIES IN TRADE STATISTICS The purpose of this section is to identify major sources of discrepancy and determine C what adjustments need to be made. The focus in this section is on U.S.-China trade and the differences in these two countries bilateral trade statistics. We begin with U.S.-China bilateral trade because the most detailed information is available on the trading systems of these two countries. However, we expect many of the sources of discrepancies discussed to be common to China's other trading partners as well.' The various sources can generally be 0 categorized as: 1) arising from differences in definition and procedures regarding the compilation of international trade statistics, and 2) external - arising from causes beyond the contrd of the trading systems in the two countries. Specific sources of discrepancies are discussed in more detail below. Differences in Definitions, Conce~md Methodology Both countries state that their statistical systems follow the United Nations guidelines for merchandise trade data and both rely on customs declarations for the source of their trade data. Nevertheless, in some instances definitional, conceptual, and methodological differences remain between import and export data for the two countries. Similarities and differences in trade statistics definitions and procedures are summarized in Table 2. I Valuation China values exports on a FOB basis (the selling price of the gds including expenses accrued to the point where the goods are loaded on board the exporting carrier). The United States, on the other hand, values exports on a FAS (free alongside ship) basis. FAS differs from FOB in that costs for loading the exporting carrier are not included. China 0 values imports on a CIF basis (the purchase price plus freight, insurance, and all other expenses incidental to the sale and delivery of the goods). The U.S. records imports on a CIF basis and a customs value basis. The customs import value is the price actually paid for the merchandise when it was sold for exportation to the U.S., excluding U.S. import duties, freight, insurance and other charges incurred in bringing the merchandise to the United States. This value approximates a FAS import value and hereafter is referred to as the FAS value. Consequently, for trade flows from China to the U.S., China records the FOB value of the good and the U.S. records the CIF and FAS values when it arrives. For imports, the U.S. also collects data on the cost of freight, insurance, and other expenses incurred in bringing the merchandise from alongside the carrier in the exporting country to alongside the carrier at the first port of entry in the U.S. These data provide an approximation of the difference between the CIF and FOB values. ' In many instances U.S. bilateral trade statistics with other trading partners are affected by these same sources of discrepancies.
 arising from differences in definition and procedures regarding the compilation of international trade statistics, and 2) external -")
16 Low-value threshold for Classification system Harmonized System - 8 Harmonized System - 10

17 When it leaves China FOB = C + L, When it arrives in the U.S. U.S. data on charges Difference CIF = C + IF + LC + UL, IF + LC + UL, CIF - FOB = IF + UL, where C is the cost of the merchandise, IF is the cost of insurance and freight, L, is the cost of loading the merchandise on the carrier in China, and Ul, is the cost of unloading the merchandise in the U.S. Therefore, U.S. data on charges overestimate the difference between FOB and CIF values by the cost of loading the exporting carrier. In a preliminary exercise the U.S. Bureau of the Census, Foreign Trade Division estimates charges represented 6.3 percent of the CIF value of U.S. imports from China in 1992 (Foreign Trade Division spreadsheet 1994). Conversely, for trade flows from the U.S. to China, the U.S. records the FAS value of the good and China records the CIF value of the same good when it clears customs. When it leaves the U.S. FAS = C When it arrives in China CIF = C + IF + L, + UL, Difference CIF - FAS = IF + L, + UL, where l, is the cost of loading the merchandise on the carrier in the United States and UL, is the cost of unloading the merchandise in China. Assuming charges for U.S. exports to China are the same as imports from China for the same type of merchandise, an estimate can be derived of the difference between the CIF and FAS values for U.S. exports. The Foreign Trade Division of the U.S. Bureau of the Census compiles disaggregated data on insurance and freight charges for imports down to the section level. These rates, weighted by China's reported import values of U.S. exports, indicate an average of 7.1 percent of the CIF value. Chinese trade corporations estimate that the cost of freight and insurance for China's imports from the European Community (EC) averaged about 10 percent of the CIF value of imports in the mid-1 980s (GACPRC and SOEC 1988, p.6). EC member countries estimate an average CIF-FOB difference of 7-10 percent of the CIF import values for the same time period (GACPRC and SOEC 1988, p.6). In the 1988 and 1993 EC-China trade reconciliation exercises a difference of 10 percent was assumed for CIF and FOB values. Jia (1 993) cites a general estimate used by international trade specialists of the CIF value being 9 percent higher than the FOB value. The United Nations recommends using the FOB method for exports and recording import values on both a FOB basis and a CIF basis. However, not all countries record import values on a FOB basis. Differences in valuing imports and exports, therefore, are common across most trading partners in the world. Partner country attribution Both the United States and China follow United Nations guidelines in reporting imports on a country of origin basis. The country of origin is defined as the country in which the merchandise was grown, mined or manufactured. ~etermining the

18 country of origin is not always straightforward and disagreements can arisa2 Merchandise may undergo processing in several countries before being shipped to its final destination. According to an offioial of China's Customs Administration, if a good has undergone substantial transformation in a processing country, then it is classified as an import from the processing country (personal interview November 2, 1993). Substantial transformation is considered to have taken place if the processing causes the good to change tariff category or the value added exceeds 30 percent. The good then is classified as an import from the processing country. These procedures are in accordance with the Kyoto Convention which provides international guidelines on the determination of the origin of goods. In addition to the use of a change of tariff heading or an ad valorem percentage, countries may refer to a list of manufacturing or processing operations to determine if substantial transformation has occurred. In the United States, U.S. Customs determines, on a case-by-case basis, whether a substantial transformation has occurred. The availability of multiple criteria may result in disagreements between countries as to the country of origin. The recently completed Uruguay Round of the General Agreement on Tariffs and Trade calls for the rules of origin to become more specific and uniform across countries. If harmonization is implemented, differences among countries should be reduced. For exports both countries define the country of consumption (final destination) as the partner co~ntry.~ However, a country may not know the final destination of its exports, especially for goods that are shipped through other countries. A very large percentage of China's exports arb shipped, mostly through Hong Kong and to a lesser extent through other countries, such as Singapore. Over 60 percent of China's exports to the United States pass through Hong Kong. Hong Kong transit trade is far greater for flows from China to the U.S. (US$ billion in 1992) as compared to flows from the U.S. to China (USS2.349 billion in 1992) (Lardy 1994L4 For U.S. trade statistics the country of shipment is available in addition to the country of origin. The value of U.S. imports from China on a country of shipment basis (excludes Chinese goods exported by other countries, such as Hong Kong, and includes third country goods imported from China) was US$ billion (FOB basis) in If all of the goods with a country of shipment of China are of China origin, that leaves US$ billion (FOB basis) of a total US$ billion (FOB basis) in Chinese goods being indirectly traded to the United States. These statistics confirm that a large volume of China's exports to the U.S. are shipped through a third country. The present discussion excludes false declarations of origin which are dealt with in a later section of the report. The country of consumption or final destination refers to the country or region in which the goods are to be consumed, utilized, or further processed or manufactured. When the country of final destination is not known at the time of exportation, the exporter declares the country of last shipment (consignment). 4 These statistics are from Hong Kong Census and Statistics Department. 7

19 a Prior to 1993 the majority of Chinese exports shipped through Hong Kong were recorded by China as exports to Hong Kong (personal interview November 2, 1993). The United States, howevef, recorded these imports as having China as a country of origin. The two EC-China studies also found the same situation for Chinese exports to Germany, the only country for which detailed indirect trade figures were available. This difference in partner country attribution is the single largest contributor to the trade statistics discrepancy. Quantifying the effect of this difference, therefore, is important and is deferred to Section Ill. To a lesser extent U.S. exports to China also are shipped through Hong Kong, and in some instances, the country of consignment is recorded as Hong Kong and not China. Hong Kmg reexports of U.S. goods to China include U.S. exports recorded by the U.S. as exports to China that are being shipped through Hong Kong and exports recorded by the U.S. as exports to Hong Kong. It is impossible to determine the amount of overlap without resorting to an examination of individual transactions. If Hong Kong reexports of U.S. goods to China (less any reexport margin) exceed reported U.S. exports to China, then it is almost certain shipments through Hong Kong also contribute to discrepancies in the westward trade flow between these two countries. 0 C Two examples serve to illustrate the underreporting of U.S. exports to China and the overreporting of exports to Hong Kong. China has long maintained a ban on U.S. fruit, except for small quantities imported by joint venture hotels catering to foreigners. In spite of the historical ban, U.S. fruit has been widely available in China's urban markets for the past several years. For example, U.S. grapes, Sunkist oranges, and Washington State apples are common in the southern province of Guangdong. U.S. exports of fresh fruit to China, however, have been minimal and declining in recent years according to U.S. statistics (Figure 2). But at the same time, U.S. fresh fruit exports to Hong Kong rose and reached a record US$ million in According to Hong Kong statistics, trsders then reexport a portion of U.S. fruit from Hong Kong to China. The shipment of U.S. fruit through Hong Kong, whether smuggled or official, now accounts for the majority of U.S. fruit consumed in China. * A second example involves the reexport of a large volume of U.S. cigarettes from Hong Kong to China. Smuggling may partially explain why U.S. exports and Hong Kong reexports of tobacco and tobacco products (dominated by cigarettes) exceeded China's reported total imports in 1989 and 1990 (Figure 3). For example, in 1990 according to U.S. trade statistics, the U.S. exported US$ 7.5 million of tobacco and tobacco products to China. In that same year, Hong Kong's Census and Statistics Department reported US$ million reexports of U.S. tobacco and tobacco products to China. China's trade statistics reflect total imports of tobacco and tobacco products from all countries at only US$ million. One explanation is that a portion of the tobacco products (primarily cigarettes) that cleared Hong Kong customs never cleared China's custom^.^ * Virtually all countries experience indirect trade or shipment through a third country for a portion of their imports and exports, resulting in minor partner country attribution Chinese customs reports that cigarettes are one of the top goods smuggled into China. Smuggling is discussed in more detail later.

20 Figure 2. U.S. Exports and Hong Kong Re-exports of U.S. Fresh Fruit to China, Thousand $' I Year U.S. exports Hong Kong re-exports Data Sources: U.S. Bureau of the Census and Hong Kong Customs.

21 Figure 3. Tobacco and Tobacco Products: U.S. Exports and Hong Kong Reexports to China and China Total Imports, ($ Million) U.S. exports H.K. reex~orts China total imports Year Data Sources: U.S. Bureau of the Census; China's Customs Statistice; Hong Kong Customs.
22 differences. However, the unique and large role Hong Kong plays in China's foreign trade results in an extraordinarily large volume of indirect trade for China exports and imports, especially exports. The China-Hong Kong relationship leads to partner country attribution differences of sizeable magnitude. System of trade China compiles trade statistics according to the special trade system which includes all merchandise passing through Chinese customs boundaries. Special trade statistics are based upon the clearance of goods through customs for home use. The United States, on the other hand, compiles general trade statistics based upon the movement of goods into and out of the national territory. These statistics reflect all trade crossing U.S. boundaries. The U.S. compiles export statistics only on a general trade basis, but records both general and "consumption" or special trade statistics for imports. Because China records trade according to the special trade system, goods exported from the United states that enter only bonded zones in China will be recorded by the U.S. as an export to China but will never appear in China's import statistics. Similarly goods that are processed in China's bonded zones and then reexported will not be recorded in China's exports but would be recorded in U.S. imports when they reach the United States. The major difference between general and special trade imports is in the treatment of goods entering a bonded zone or a bonded customs warehouse. General import statistics capture such goods when they enter the zone or warehouse. Special trade statistics will only include these goods when and i.f they are withdrawn for domestic consumption. International goods that stay within bonded zones never enter China's trade statistics. Since 1990 China has established 14 bonded zones in coastal cities and cities along the Yangtze River. The largest bonded zone covers 10 square kilometers, Waigaoqiao in Shanghai, and the smallest only 0.2 square kilometers, Shatoujiao in Shenzhen (Li ' Registered Chinese and foreign enterprises in these closed zones may engage in international entrepot trade, export processing, and warehousing. Because bonded zones are a recent phenomenon in China, most were constructed in the early 1990s and many became operational only in 1993, their effect on the discrepancy in trade statistics is probably minor in No published statistics are available on the value of bonded zone trade in Other U.S. trading partners, such as the EC, also use the special trade system and exclude trade into and out of bonded warehouses. This difference in compiling trade statistics leads to discrepancies in U.S.-EC bilateral statistics. Low-value threshold For both imports and exports China does not record transactions with values less than US$ 30. The United States fully compiles export statistics on transactions valued over US$ The total values of transactions valued under US are estimated for individual countries, but these estimates appear in a separate category and are excluded from commodity totals. The U.S. fully compiles import statistics on transactions valued over US$ 1250, except for quota items, such as textile articles, which are reported as formal entries when valued over US$ 250. Again, the total values of transactions valued under US$ 1250 (and under US$ 250 for textile articles) are estimated for individual ' Other bonded zones have been established in Tianjin, a second in Shenzhen, Dalian, Guangzhou, Zhangjiagang, Xiamen, Haikou, Qingdao, Ningbo, Fuzhou, and Shantou.
23 countries, appear in a special category and are excluded from individual commodities. The U.S. estimates that low-valued transactions account for slightly less than 4 percent of total I 1 0 imports (U.S. Bureau of the Census Valuation of processed goods Goods exported from the United States for further processing or assembly abroad and then returned to the United States are reflected in U.S. export and import statistics. The value of components and raw materials shipped abroad for further processing is included in export statistics; and the full value of the returned finished products, in import statistic^.^ Similarly, China states that imports for processing and the finished exported goods are recorded at their total value in trade statistics.' The import and export value of commodities involved in these processing transactions represented 41 percent of China's total 1993 trade value. Classification system Both countries currently use the Harmonized Commodity Description and Coding System (HS) for classifying merchandise traded. China adopted this system at the beginning of 1992, and the United States has been using the Harmonized System since The headings in the classification system are uniform to the six digit level. China then uses two additional digits as national subheadings for tariff, statistical, or administrative purposes. The U.S. adds four additional digits, two for U.S. legal subdivisions of the international system and two for statistical subdivisions. There is always the possibility that the two countries may classify the same transaction differently. Differences in classifying an individual transaction will result in discrepancies between the two countries trade statistics for specific subheadings; however, it will not cause total trade statistics to differ. Geographic definition of partner country China uses a geographic definition' of the United States that excludes Puerto Rico and the U.S. Virgin lslands while the U.S. includes Puerto Rico and U.S. Virgin lslands trade in its statistics. This difference in definition results in discrepancies between the two countries trade statistics. China's reported trade with Puerto 8 Rico in 1992 was only US$ 5.6 million (Table 3). China does not publish separate statistics on trade with the U.S. Virgin lslands because the trade volume is so small. The U.S. is unable to separate out trade statistics for Puerto Rico and the U.S. Virgin Islands. The closest approximation is statistics for the customs district that includes Puerto Rico and the customs district for the U.S. Virgin lslands (Table 4). U.S. customs district statistics on trade with China through Puerto Rico are substantially higher than China's reported statistics. a Nevertheless, U.S. officials concur that China's trade with the two regions is minor. Both countries exclude Taiwan, Hong Kong, and Macao from their trade statistics for China. Generally, other U.S. trading partners also exclude Puerto Rico and U.S. Virgin lslands trade from their statistics on trade with the United States. However, duty is only assessed upon the value of the processing outside the United States. This section refers to processing outside of the bonded zones.
24 I Administration of Customs of the People's Republic of China 1993b, e Through Puerto Rico and U.S. Virgin Islands Customs Coverage China and the U.S. differ in the items they include in their trade statistics (Table 5). First, China includes products mined from the seabed in international waters while the United States does not. China's inclusion of this product would not affect bilateral trade statistics as long as the origin is international waters and not attributed to a particular country. The United States includes fish and salvage landed from foreign vessels in national ports and China does not. It is expected that this value is relatively small. Barter tradg Both China and the United States include barter trade in their trade statistics. Overseas r e~alr~ China's import and export statistics do not include goods sent overseas for repairs. The U.S. includes this category of trade but records only the value of the replaced parts and other value added from the repair. Goods with hiah service content U.S. regulations require that high service content merchandise, such as blueprints and software, be reported at the value of the underlying media only. In practice, however, commercial software is usually reported at its commercial
25
26 national ports Fish and salvage acquired on the high seas from foreign vessels Monetary gold and silver Monetary coins in current circulation Goods and equipment delivered to and from installations in international waters no no no no no no no no
27 value while custom software is recorded as the value of the media. China Customs records commercial software packages only by the value of the media (diskette). The United States does not follow all United Nations recommendations on the recording of trade and hence encounters occasional differences with most of its trading partners in the coverage of goods. External Causes of Trade Discre~ancie~ Even if two countries follow exactly the same procedures in compiling their trade statistics, discrepancies still will arise due to other factors. In some cases, the countries may be able to reduce the effect of these external factors through appropriate policies. In other instances, the differences are unavoidable. Change in value in bansit The value of the merchandise may increase or decrease after it leaves the exporting country and before it arrives in the importing country. If the goods being shipped have not already been paid for or a price locked in, the reported export and import values may differ. It is not unusual for certain types of products to be stored in warehouses in third countries for an extended period of time before being withdrawn and sent to the final consumer. During the storage period, the prices may fluctuate. Even if the price is already determined, the importer and exporter may assign different values to the same transaction when making their declarations to customs. A detailed transaction-by-transaction review would be necessary to determine the extent to which this cause is contributing to discrepancies in bilateral trade statistics. Changes in the exchange rate between two countries also may affect the recorded value of a traded good. The U.S. experiences fluctuations in the exchange rate between the dollar and other major currencies that affect the value of trade as recorded by the U.S. and other trading partners. If all trade transactions between China and the U.S. are not denominated and recorded in US dollars, then appreciation or depreciation of the yuan will result in different values being recorded for imports and exports. Prior to 1994 China executed conversion between the yuan and the US dollar for trade accounts at the official exchange rate.' China converts and records in yuan the value of imports, regardless of currency denomination, and converts and records in US dollars the value of exports when the goods clear Customs (General Administration of Customs of the People's Republic of China 1993c, p.ll).1 The exchange rates used are the US dollar and yuan rate and cross rates for other major currencies published daily by the State Foreign Currency Control Bureau. The value of imports also are converted to US dollars. The conversion occurs at least monthly if not at the time the transaction is recorded in yuan. ' The exchange rate averaged 4.78, 5.32, 5.51, and 5.80 yuan to the dollar in 1990, 1991, 1992, and 1993, respectively. 10 Imports may take up to three weeks after their arrival to clear Customs (U.S. Bureau of the Census, Foreign Trade Division, trip report).
28 To assess the impact of the devaluation of the yuan on U.S.-China bilateral trade statistics one would need to know the prevailing practice for denominating Chinese exports and imports. One wouid also need to know the flow of trade (exports and imports separately) over the year. If imports and exports were denominated in yuan, the devaluation of China's currency over time would lead to a discrepancy opposite to the existing one. However, from the beginning to the end of 1992, under a managed float with no sharp devaluations, the devaluation totals less than 6 percent. Owing to the gradual, continual devaluation of China's currency, China's trade with the United States is more likely to be denominated in US dollars. Therefore, changes in the exchange rate are unlikely to have had a major impact on the trade discrepancy in Similarly for China's other trading partners, the US dollar or another major international currency is likely to dominate trade. While the yuan strengthened against the currencies of Australia, Canada, and Italy, it fell slightly relative to the currencies of China's other major trading partners (Table 6). The value also can change in transit if the merchandise undergoes further processing or packaging in a third country. This reexport margin or transit trade markup includes the profits and costs of shipment, storage, processing (not substantial transformation), and reselling. For much of U.S.-China trade the value of trade is raised as it passes through Hong Kong. According to surveys of Hong Kong companies conducted by the Research Department of the Hong Kong Development Council, the gross profit margin as a percentage of the FOB export price averaged 16 percent for reexports of China goods through Hong Kong in 1988
29 a a and 1991 (Hong Kong Trade Development Council 1991, pp '' The Hong Kong Census and Statistics Department reported to the GATT Informal Group of Experts on Export Statistics that the reexport margin varied from 13 percent in 1988 to 25 percent in A 1991 survey indicates a 17 percent reexport margin on goods shipped through Hong Kong from countries outside Asia (Hong Kong Trade Development Council 1991). While trade between the U.S. and other U.S. trading partners are subject to shipment through a third country as well, the unique role of Hong Kong in China trade makes this source of discrepancy larger in the case of China than it is for other U.S. trading partners. Change in destination after export While in route the destination of the merchandise may change, or at the time of exporting the final destination may be unknown. China frequently faces this situation with its exports through Hong Kong. Hong Kong middlemen are invdved in the production and marketing of many light manufactured goods in southern China, especially Guangdong province. These toys, garments, bags, shoes, and other products are sold in Europe, Canada, the United States, and other international markets. They are shipped * first to Hong Kong where they may undergo some final processing or packaging and then proceed to Europe, Canada, the United States, or elsewhere.l2 When a particular shipment leaves China for Hong Kong, it may not be known where it will eventually be shipped to next (Han, 1994 and Jia, 1993). In these situations, the exporter can only declare Hong Kong to be the destination. It will not be possible in every instance to know the true destination the time of exportation. For example, in the recent past, China has shipped oil to Japan and stored it in warehouses and only later sold it to consuming countries. Consequently, when the oil left China, it was recorded as an export to Japan. If the U.S. later imported some of this oil, the U.S. would record it as an import from China, the country of origin. Having goods sit in warehouses in third countries is not unique to China trade. However, having goods change final destination as they pass through a third country is more of a problem for China e trade through Hong Kong. Smuggling Smuggling or any other act which seeks to avoid the declaration of trade to customs will result in statistical dis~repancies.'~ China's Customs seized a record 2.35 billion yuan in smuggled goods in 1993, a nearly 80 percent increase over 1992 (Liang a '' Gross profit i's defined as sales less direct cost of the goods sold. Gross profit includes indirect costs such as marketing and product development expenses, banking charges, insurance costs, transportation and storage costs, other related handling fees and reexporter's own profit margin. For reexports through Hong Kong, most of these expenses are incurred in Hong Kong and the reexport margin is earned by Hong Kong companies. This reexport gross profit margin, therefore, largely reflects the value-added of reexport trade to the Hong Kong economy. '* Hong Kong. manufacturers, engaged in production in China, reexported through Hong Kong 86 percent of their products. The remainder, primarily goods manufactured in northern China such as fur, were shipped directly from China. l3 Only if the merchandise is both smuggled out of and into the two trading countries will no discrepancy arise because the transaction does not appear in either country's trade statistics. 18
International Merchandise Trade Statistics
 5 International Merchandise Trade Statistics Introduction 5.1 International merchandise trade statistics (IMTS) measure quantities and values of goods that, by moving into or out of an economy, add to
Assessing China s Merchandise Trade Data Using Mirror Statistics
 Assessing China s Merchandise Trade Data Using Mirror Statistics Iris Day* Given their timeliness, Chinese trade data have the potential to provide a useful early read on conditions in the Australian and
A New Effective Exchange Rate Index for the Canadian Dollar
 A New Effective Exchange Rate Index for the Canadian Dollar Janone Ong, Financial Markets Department A new Canadian-dollar effective exchange rate index (CERI) has been created to replace the C 6 index
TRADE COMPETITIVENESS MAP
 USER GUIDE TRADE COMPETITIVENESS MAP Benchmarking national and sectoral trade performance CONSISTENCY OF TRADE STATISTICS Market Analysis and Research Division of Market Development International Trade
International workshop on country practices in compilation of international merchandise trade statistics, Bangkok, Thailand, 12 15 December 2006
 UNITED NATIONS DEPARTMENT OF ECONOMIC AND SOCIAL AFFAIRS STATISTICS DIVISION International workshop on country practices in compilation of international merchandise trade statistics, Bangkok, Thailand,
Further Developments of Hong Kong s Offshore RMB Market: Opportunities and Challenges
 Further Developments of Hong Kong s Offshore RMB Market: Opportunities and Challenges Zhang Ying, Senior Economist In recent years, as the internationalization of the RMB has been steadily carrying out,
Chart 1: Zambia's Major Trading Partners (Exports + Imports) Q4 2008 - Q4 2009. Switzernd RSA Congo DR China UAE Kuwait UK Zimbabwe India Egypt Other
 Q4 2008 - Q4 2009. Switzernd RSA Congo DR China UAE Kuwait UK Zimbabwe India Egypt Other") Bank of Zambia us $ Million 1. INTRODUCTION This report shows Zambia s direction of merchandise trade for the fourth quarter of 2009 compared with the corresponding quarter in 2008. Revised 1 statistics,
Bank of Zambia us $ Million 1. INTRODUCTION This report shows Zambia s direction of merchandise trade for the fourth quarter of 2009 compared with the corresponding quarter in 2008. Revised 1 statistics,
Factors affecting the inbound tourism sector. - the impact and implications of the Australian dollar
 Factors affecting the inbound tourism sector - the impact and implications of the Australian dollar 1 Factors affecting the inbound tourism sector - the impact and implications of the Australian dollar
Canada Export Requirements Incoterms
 Canada Export Requirements Incoterms Topics of Discussion Canada export requirements Terms of sale Insurance Documentation Export Process Are there export restrictions? What are the import conditions?
China Customs Notice 36
 China Customs Notice 36 The following is an English translation of Customs Notice Number 36 issued by the General Administration of China Customs and should be used as a reference only. The official Notice
AN AUGMENTED TRADE-WEIGHTED INDEX OF THE AUSTRALIAN DOLLAR 1
 AN AUGMENTED TRADE-WEIGHTED INDEX OF THE AUSTRALIAN DOLLAR 1 Introduction Trade-weighted exchange rate indices provide a guide to a country s exchange rate against the currencies of its trading partners,
ANALYSIS OF NZ MERCHANDISE TRADE DATA YEAR ENDED JUNE 2013
 Page 1 of 14 ANALYSIS OF NZ MERCHANDISE TRADE DATA YEAR ENDED JUNE 2013 SUMMARY Provisional merchandise trade data for the June 2013 month was released in July. The June 2013 data provides us with our
Statement by Dean Baker, Co-Director of the Center for Economic and Policy Research (www.cepr.net)
") Statement by Dean Baker, Co-Director of the Center for Economic and Policy Research (www.cepr.net) Before the U.S.-China Economic and Security Review Commission, hearing on China and the Future of Globalization.
Statement by Dean Baker, Co-Director of the Center for Economic and Policy Research (www.cepr.net) Before the U.S.-China Economic and Security Review Commission, hearing on China and the Future of Globalization.
U.S. Merchandise Trade Statistics. A Quality Profile
 U.S. Merchandise Trade Statistics A Quality Profile International Trade Statistical Methods Branch Economic Statistical Methods Division U.S. Census Bureau October 3, 2014 1 Table of Contents I. Introduction
Internet address: http://www.bls.gov/fls USDL: 04-2343
 Internet address: http://www.bls.gov/fls USDL: 04-2343 Technical information: (202) 691-5654 For Release: 10:00 A.M. EST Media contact: (202) 691-5902 Thursday, November 18, 2004 INTERNATIONAL COMPARISONS
Presented by Terri Long Foreign Trade Division
 Trade data from the U.S. Census Bureau Presented by Terri Long Foreign Trade Division Overview Types of trade data Publicly l available data sources How to use trade data to: Find emerging markets Determine
EXTERNAL DEBT AND LIABILITIES OF INDUSTRIAL COUNTRIES. Mark Rider. Research Discussion Paper 9405. November 1994. Economic Research Department
 EXTERNAL DEBT AND LIABILITIES OF INDUSTRIAL COUNTRIES Mark Rider Research Discussion Paper 9405 November 1994 Economic Research Department Reserve Bank of Australia I would like to thank Sally Banguis
6. Gross Domestic Product by Country
 6. Gross Domestic Product by Country The economies of the six countries studied for this report have flourished, allowing for the very high growth rates in research and development (R&D) investment and
STATUS OF FOREIGN TRADE STATISTICS. Country Presentation Statistics Tanzania
 STATUS OF FOREIGN TRADE STATISTICS Country Presentation Statistics Tanzania OUTLINE Introduction INTRODUCTION National Bureau of Statistics (NBS) was officially launched as an Executive Agency on 26th
Statistics - Nigeria
 UNITED NATIONS DEPARTMENT OF ECONOMIC AND SOCIAL AFFAIRS STATISTICS DIVISION INTERNATIONAL TRADE STATISTICS BRANCH WORKSHOP ON THE COMPILATION OF INTERNATIONAL MERCHANDISE TRADE STATISTICS Addis Ababa,
Census of International Trade in Services and Royalties: Year ended June 2005
 Embargoed until 10:45 AM - Wednesday, October 26, 2005 Census of International Trade in Services and Royalties: Year ended June 2005 Highlights Major exports of commercial services were: communication,
FLEXIBLE EXCHANGE RATES
 FLEXIBLE EXCHANGE RATES Along with globalization has come a high degree of interdependence. Central to this is a flexible exchange rate system, where exchange rates are determined each business day by
Developments in the Trade-Weighted Index 1
 Reserve Bank of Australia Bulletin October 22 Developments in the Trade-Weighted Index 1 Introduction This article provides some background on the history and methodology of the trade-weighted index (TWI)
Tiger by the Tail? Canada's Trade with South Korea
 Catalogue no. 65-507-MIE No. 001 ISSN: 1712-1345 ISBN: 0-662-38252-8 Analytical Paper Canadian trade review Tiger by the Tail? Canada's Trade with South Korea by Sandra Bohatyretz International Trade Division
Summary of the Esa2010 revision of National Accounts
 9 September 2014 Summary of the Esa2010 revision of National Accounts Year 2011 In conjunction with the introduction of the new European system of national and regional accounts (Esa2010) Manual, Italy
U.S. Trade Overview, 2013
 U.S. Trade Overview, 213 Stephanie Han & Natalie Soroka Trade and Economic Analysis Industry and Analysis Department of Commerce International Trade Administration October 214 Trade: A Vital Part of the
Introduction and Development Strength of. Shenzhen Service Outsourcing Industry
 Introduction and Development Strength of Shenzhen Service Outsourcing Industry I. Profile of Shenzhen Shenzhen, strategically located on the south-central coast of Guangdong Province, is China s first
In 2012, GNP in constant prices increased by 1.8% compared with 2011.
 8 Economy In 2012, GNP in constant prices increased by 1.8% compared with 2011. The building and construction sector fell by 7.7% in value added terms in 2012 compared to 2011. Manufacturing industry decreased
Free Trade Agreements and State-Level Trade. By Joan Shipps Office of Trade Policy Analysis Industry Analysis
 Free Trade Agreements and State-Level Trade By Joan Shipps Office of Trade Policy Analysis Industry Analysis February 7, 2013 Free Trade Agreements and State-Level Trade Executive Summary: OTPA has conducted
I. World trade developments
 I. World trade developments World merchandise exports stagnated in value terms in 2012 while exports of commercial services increased by 2 per cent. Key developments in 2012: a snapshot Trade data List
Errors and omissions in the balance of payments statistics a problem?
 Errors and omissions in the balance of payments statistics a problem? BY GUNNAR BLOMBERG, LARS FORSS AND INGVAR KARLSSON The authors work in the Monetary Policy Department. The balance of payments statistics
Mexico Shipments Made Simple. Third-party logistics providers help streamline the U.S. Mexico cross-border process WHITE PAPER
 Mexico Shipments Made Simple Third-party logistics providers help streamline the U.S. Mexico cross-border process WHITE PAPER Introduction With the cost of manufacturing rising in Asia, many companies
China Textile Industry
 June, 2013 China Textile Industry Contents Market Overview - 2012 Industrial Development - Fixed Asset Investment in 2012 - Foreign Trade 2012 - Foreign Direct Investment on textile industry Labor Cost
How will the Statistical Adjustment on Manufacturing Services on Physical Inputs Owned by Others Affect China s Balance of Payments Statistics?
 BOPCOM 12/07 Twenty-Fifth Meeting of the IMF Committee on Balance of Payments Statistics Washington D.C., USA January 14 16, 2013 (Rescheduled from October 29 31, 2012) How will the Statistical Adjustment
THE U.S.-CHINA BILATERAL TRADE BALANCE:
 THE U.S.-CHINA BILATERAL TRADE BALANCE: Its Size and Determinants by Robert C. Feenstra Dept. of Economics, Univ. of California, Davis Haas School of Business, Univ. of California, Berkeley and National
A Brief Research Note on. Temasek Holdings. And Singapore: Mr. Madoff Goes to Singapore
 A Brief Research Note on Holdings And Singapore: Mr. Madoff Goes to Singapore Christopher Balding HSBC Business School Peking University Graduate School cbalding@phbs.pku.edu.cn Short Abstract: Holdings
1. HOW THE GLOBAL ENVIRONMENT HAS CHANGED
 CHAPTER 1 In a universe with a single currency, there would be no foreign exchange market, no foreign exchange rates, no foreign exchange. But in our world of mainly national currencies, the foreign exchange
Fifteenth Meeting of the IMF Committee on Balance of Payments Statistics Canberra, Australia, October 21 25, 2001
 BOPCOM-02/55 Fifteenth Meeting of the IMF Committee on Balance of Payments Statistics Canberra, Australia, October 21 25, 2001 Implementation of BPM5 in Compiling Balance of Payments Statistics of Hong
Explanation beyond exchange rates: trends in UK trade since 2007
 Explanation beyond exchange rates: trends in UK trade since 2007 Author Name(s): Michael Hardie, Andrew Jowett, Tim Marshall & Philip Wales, Office for National Statistics Abstract The UK s trade performance
ECONOMIC REVIEW(A Monthly Issue) March, 2014
 March, 2014") ECONOMIC REVIEW(A Monthly Issue) March, 2014 Economics & Strategic Planning Department http://www.bochk.com An Analysis on the Latest Developments and Comparative Advantages of Offshore RMB Centers Liu
ECONOMIC REVIEW(A Monthly Issue) March, 2014 Economics & Strategic Planning Department http://www.bochk.com An Analysis on the Latest Developments and Comparative Advantages of Offshore RMB Centers Liu
Busiest ports. Asian Tiger. Business friendly. Highest Trade/GDP Ratio. 4 th biggest financial centre
 Busiest ports Business friendly Asian Tiger Highest Trade/GDP Ratio 4 th biggest financial centre Singapore economy at a glance: Singapore is a global trading power. Its strategic geographical location,
China Pulse December 20 th, 2011
 China Pulse December 20 th, 2011 Business Travel in Mainland China and Hong Kong Understanding the Travel & Behavioral Preferences of Business Travelers in Mainland China and Hong Kong Contents Business
Fifty years of Australia s trade
 Fifty years of Australia s trade Introduction This edition of Australia s Composition of Trade marks the publication s 50th anniversary. In recognition of this milestone, this article analyses changes
MGE#12 The Balance of Payments
 MGE#12 The Balance of Payments The Current Account, the Capital Account and the Balance of Payments Introduction to the Foreign Exchange Market Savings, Investment and the Current Account 1 From last session
10 Goods and Services Account
 CHAPTER 10 Goods and Services Account A. Overview of the Goods and Services Account References: 2008 SNA, Chapter 6, The Production Account. United Nations, International Merchandise Trade Statistics:
World Manufacturing Production
 Quarterly Report World Manufacturing Production Statistics for Quarter IV, 2013 Statistics Unit www.unido.org/statistics Report on world manufacturing production, Quarter IV, 2013 UNIDO Statistics presents
China (Shanghai) Pilot Free Trade Zone
 Pilot Free Trade Zone") China (Shanghai) Pilot Free Trade Zone A New Era of Opening up and Reform in China www.pwccn.com What is the China (Shanghai) Pilot Free Trade Zone? On 29 September, 2013, the Chinese government formally
China (Shanghai) Pilot Free Trade Zone A New Era of Opening up and Reform in China www.pwccn.com What is the China (Shanghai) Pilot Free Trade Zone? On 29 September, 2013, the Chinese government formally
China (Shanghai) Pilot Free Trade Zone. Consulate General of P.R. China in Toronto
 Pilot Free Trade Zone. Consulate General of P.R. China in Toronto") Officially launched on 29 September 2013 The first of its kind on the Chinese mainland Three years to build to meet international standards What is FTZ? Why is it now? How is it? What kind of business
Officially launched on 29 September 2013 The first of its kind on the Chinese mainland Three years to build to meet international standards What is FTZ? Why is it now? How is it? What kind of business
Financial Instruments Traded on the Commodity Exchange
 Financial Instruments Traded on the Commodity Exchange Using the Financial Markets A cotton trader will almost always prefer to manage his price risk through physical positions and contracts for cotton,
Trade Liberalization and Its Role in Chinese Economic Growth. Nicholas R. Lardy Senior Fellow Institute for International Economics Washington, D.C.
 Trade Liberalization and Its Role in Chinese Economic Growth Nicholas R. Lardy Senior Fellow Institute for International Economics Washington, D.C. Prepared for an International Monetary Fund and National
The Evolving External Orientation of Manufacturing: A Profile of Four Countries
 The Evolving External Orientation of Manufacturing: A Profile of Four Countries José Campa and Linda S. Goldberg Changes in exchange rates, shifts in trade policy, and other international developments
Inventories: Cost Measurement and Flow Assumptions
 CHAPTER Inventories: Cost Measurement and Flow Assumptions OBJECTIVES After careful study of this chapter, you will be able to: 1. Describe how inventory accounts are classified. 2. Explain the uses of
Pilot Free Trade Zone Shanghai
 Pilot Free Trade Zone Shanghai Shanghai s first Free Trade zone was launched in September 2013, targeted to make Shanghai an international trade and finance hub. It was established on the strategic decision
The State of Canada s Processed Food Sector: Trade Balance
 Understanding the Processed Food Trade Balance The State of Canada s Processed Food Sector: Trade Balance November 2012 Report prepared by Douglas Hedley, PhD, and the Canadian Agri-Food Policy Institute
The Impact of Exchange Rate Movements on Vegetable Imports
 The Impact of Exchange Rate Movements on Vegetable Imports This paper examines whether movement in the exchange rate of the Australia dollar is the major explanatory factor for changes in the level of
ADVANTAGES OF INCORPORATING A TRADING COMPANY IN HONG KONG AND STRUCTURING CHINA INVESTMENTS VIA HONG KONG
 ADVANTAGES OF INCORPORATING A TRADING COMPANY IN AND STRUCTURING INVESTMENTS VIA Map of Guangdong province, China, and Hong Kong, SAR INCORPORATING A TRADING COMPANY IN & AT A SNAPSHOT CATEGORY Incorporating
Weiqiao Textile Announces its 2015 Interim Results
 Weiqiao Textile Announces its 2015 Interim Results Seize new opportunities in new normal development phase Continued leadership against the backdrop of industry changes Financial Summary Revenue was approximately
What Is the Balance of Payments?
 What Is the Balance of Payments? Norman S. Fieleke Vice President and Economist Federal Reserve Bank of Boston Federal Reserve Bank of Boston July 1976 Revised August 1985 and October 1996 Hypothetical
The Role of Hong Kong in China s Economic Development 1. Yue-Chim Richard Wong The University of Hong Kong
 The Role of Hong Kong in China s Economic Development 1 Yue-Chim Richard Wong The University of Hong Kong Abstract This paper surveys the continuing role of Hong Kong in China s economic development after
Klako Group International Accountants & Consultants in China & Hong Kong
 International Trade Programs Klako Group International Accountants & Consultants in China & Hong Kong Visit our website at http://www.klakogroup.com or contact our offices in China: Hong Kong 10A Seapower
Macroeconomic Influences on U.S. Agricultural Trade
 Macroeconomic Influences on U.S. Agricultural Trade In addition to the influence of shifting patterns of growth in foreign populations and per capita income, cyclical macroeconomic factors associated with
CEPA YOUR SPRINGBOARD TO CHINA
 CEPA YOUR SPRINGBOARD TO CHINA CLOSER ECONOMIC PARTNERSHIP ARRANGEMENT WHAT IS CEPA? A free trade agreement between Hong Kong and mainland China Effective from 1 January 2004 Preferential access to China
Economic Commentaries
 n Economic Commentaries Sweden has had a substantial surplus on its current account, and thereby also a corresponding financial surplus, for a long time. Nevertheless, Sweden's international wealth has
Chapter 12. National Income Accounting and the Balance of Payments. Slides prepared by Thomas Bishop
 Chapter 12 National Income Accounting and the Balance of Payments Slides prepared by Thomas Bishop Preview National income accounts measures of national income measures of value of production measures
US Exports to China by State
 US Exports to China by State 2004 2013 1818 N Street, NW, Suite 200, Washington, DC 20036 Tel: 202-429-0340 Fax: 202-775-2476 E-mail: info@uschina.org www.uschina.org Executive Summary Exports to China:
Australia s position in global and bilateral foreign direct investment
 Australia s position in global and bilateral foreign direct investment At the end of 213, Australia was the destination for US$592 billion of global inwards foreign direct investment (FDI), representing
Swiss Balance of Payments and International Investment Position 2014
 Swiss Balance of Payments and International Investment Position 214 Swiss Balance of Payments and International Investment Position 214 Volume 1 Contents Page 1 Overview 4 Innovations 4 Changes in the
LEGISLATIVE COUNCIL PANEL ON COMMERCE AND INDUSTRY. Proposed amendments to the Import and Export (Registration) Regulations (Cap. 60 sub. leg.
 Regulations (Cap. 60 sub. leg.") CB(1)278/06-07(06) For information On 21 November 2006 LEGISLATIVE COUNCIL PANEL ON COMMERCE AND INDUSTRY Proposed amendments to the Import and Export (Registration) Regulations (Cap. 60 sub. leg. E) Introduction
CB(1)278/06-07(06) For information On 21 November 2006 LEGISLATIVE COUNCIL PANEL ON COMMERCE AND INDUSTRY Proposed amendments to the Import and Export (Registration) Regulations (Cap. 60 sub. leg. E) Introduction
PANAMA. 1. General trends
 Economic Survey of Latin America and the Caribbean 2014 1 PANAMA 1. General trends The Panamanian economy continued on its growth path of recent years, posting an 8.4% expansion in 2013, thanks in large
List of tables. I. World Trade Developments
 List of tables I. World Trade Developments 1. Overview Table I.1 Growth in the volume of world merchandise exports and production, 2010-2014 39 Table I.2 Growth in the volume of world merchandise trade
New data on financial derivatives 1 for the UK National Accounts and Balance of Payments
 New data on financial derivatives 1 for the UK National Accounts and Balance of Payments By Andrew Grice Tel: 020 7601 3149 Email: mfsd_fmr@bankofengland.co.uk This article introduces the first publication
Comparative Analysis of Shanghai and Hong Kong s Financial Service Trade Competitiveness
 Comparative Analysis of Shanghai and Hong Kong s Financial Service Trade Competitiveness Ying Li Longfei Liu Lijun Liang Management School Shanghai University of Engineering and Science China Abstract
A Primer on Exchange Rates and Exporting WASHINGTON STATE UNIVERSITY EXTENSION EM041E
 A Primer on Exchange Rates and Exporting WASHINGTON STATE UNIVERSITY EXTENSION EM041E A Primer on Exchange Rates and Exporting By Andrew J. Cassey and Pavan Dhanireddy Abstract Opportunities to begin exporting
The Economic Outlook of Hong Kong. in the Context of China s 12th Five-Year Plan
 The Economic Outlook of Hong Kong in the Context of China s 12th Five-Year Plan A Speech by Dr Victor Fung to the Students and Professionals at Savantas Liberal Arts Academy 匯 賢 智 庫 學 苑 on 21 May 2011
Fresh Connections: China
 Fresh Connections: China China Market Overview Mabel Zhuang, PMA China Consultant M.Z. Marketing Communications March 20, 2014 Overview 1. Background 2. Production 3. Trade & Distribution 4. Trends Background:
THEORETICAL AND PRACTICAL ISSUES ON RECORDING TRANSPORTATION SERVICES IN THE BALANCE OF PAYMENTS
 THEORETICAL AND PRACTICAL ISSUES ON RECORDING TRANSPORTATION SERVICES IN THE BALANCE OF PAYMENTS PAGE 1 INTRODUCTION...2 2 METHODOLOGICAL ASPECTS...3 2.1 General background...3 2.2 Attribution of transportation
MULTIPLE CHOICE. Choose the one alternative that best completes the statement or answers the question.
 Chatper 34 International Finance - Test Bank MULTIPLE CHOICE. Choose the one alternative that best completes the statement or answers the question. 1) The currency used to buy imported goods is A) the
Analysis of Sino-U.S. Cultural Trade Deficit
 1036 Analysis of Sino-U.S. Cultural Trade Deficit Tian Zuhai, Yang Ning School of Economics, Wuhan University of Technology, Wuhan, P.R. China, 430070 (E-mail: miltontian@yahoo.com.cn, yangning1988123@163.com)
CHAPTER 21 INTERNATIONAL TAX ENVIRONMENT AND TRANSFER PRICING SUGGESTED ANSWERS AND SOLUTIONS TO END-OF-CHAPTER QUESTIONS AND PROBLEMS
 CHAPTER 21 INTERNATIONAL TAX ENVIRONMENT AND TRANSFER PRICING SUGGESTED ANSWERS AND SOLUTIONS TO END-OF-CHAPTER QUESTIONS AND PROBLEMS QUESTIONS 1. Discuss the twin objectives of taxation. Be sure to define
BALANCE OF PAYMENTS AND FOREIGN DEBT
 BALANCE OF PAYMENTS AND FOREIGN DEBT V 1. BALANCE OF PAYMENTS In 1997, the external current account deficit was 8.1 billion krónur, corresponding to 1. percent of GDP. It declined from 8.9 b.kr., or 1.8
Thailand s Logistics
 Thailand s Logistics Over the past fourteen years, overall international trade with Thailand has grown 340% and manufacturing trade 370%; this growth, aided in part by the nation s bilateral trade agreements
Regulations on Exports, Imports and Customs Affairs in Free Trade-Industrial Zones. Chapter One: Definitions. Article 1
 Regulations on Exports, Imports and Customs Affairs in Free Trade-Industrial Zones Chapter One: Definitions Article 1 In these Regulations, the following terms are used in lieu of the respective phrases:
Appendix SM1: Sources of Modal Data and Calculation of Modal Shares
 Online Appendix for Trade and the Greenhouse Gas Emissions from International Freight Transport, Cristea Anca, David Hummels, Laura Puzzello and Avetisyan Misak: Supplementary Materials The supplementary
Maritime Trade and Transportation by the Numbers
 By Matthew Chambers and Mindy Liu The nation will observe Maritime Day on May 22, which was designated by Congress in 1933 to honor U.S. merchant mariners and the maritime industry. 1 Water transportation
Preliminary Analysis of USDA s Organic Trade Data: 2011 to 2014
 REPORT TO THE ORGANIC TRADE ASSOCIATION Preliminary Analysis of USDA s Organic Trade Data: 2011 to 2014 Edward C. Jaenicke, Associate Professor, Penn State University, and Iryna Demko, Ph.D. Student, Penn
I. World trade developments
 I. World trade developments World merchandise exports grew by 2 per cent in value terms in 2013 while exports of commercial services increased by per cent. Key developments in 2013: a snapshot Trade data
October 2013 - Bottled Water Exports and Imports continue to grow!
 October 13 - Bottled Water Exports and Imports continue to grow! Annualised exports for the year to October 13 continue an upwards climb following their break through NZD1m last month. Leading markets
Lecture 10-1. The Twin Deficits
 Lecture 10-1 The Twin Deficits The IS-LM model of the previous lectures endogenised the interest rate while assuming that the portion (NX 0 ) of net exports not dependent on income was exogenously fixed.
International Labor Comparisons
 Charting International Labor Comparisons 2010 Edition U.S. Department of Labor Material contained in this document is in the public domain and may be reproduced, fully or partially, without permission
Best Essay from a First Year Student
 RBA ECONOMICS COMPETITION 2010 Appreciation of Australia s real exchange rate: causes and effects Best Essay from a First Year Student ASHVINI RAVIMOHAN The University of New South Wales Appreciation of
The physical side of E-commerce
 www.pwccustoms.com The physical side of E-commerce E-commerce in Asia is booming. China alone is forecast to grow to an over US $350 billion industry by 2016. While some markets may already be considered
International Investment. Australia. Economic Diplomacy, Trade Advocacy and Statistics Section Department of Foreign Affairs and Trade September 2015
 International Investment Australia 214 International Investment Australia 214 Economic Diplomacy, Trade Advocacy and Statistics Section Department of Foreign Affairs and Trade September 215 ISSN 223-6571
PDPE Market Analysis Tool: Import Parity Price. What insights can this tool provide? How to analyse, interpret and use the data
 PDPE Market Analysis Tool: Import Parity Price The import parity price (IPP) is the price at the border of a good that is imported, which includes international transport costs and tariffs. If a good is
Healthcare Product Import-Export Regulations: China, India and South Korea
 Healthcare Product - Regulations: China, India and South Korea By Philipp Novales-Li, DMedSc, PhD, DPhil (Oxford), RAC (US, EU, CAN) 22 February 2009 In the past 10 years, Asia has burgeoned into one of
Trends in Australia s Exports 1
 April 2 Trends in Australia s Exports 1 The reduction of trade barriers, and cheaper transportation and communication costs have contributed to Australia becoming more open and more closely integrated
BANK OF ISRAEL Office of the Spokesperson and Economic Information. Report to the public on the Bank of Israel s discussions prior to deciding on the
 BANK OF ISRAEL Office of the Spokesperson and Economic Information September 7, 2015 Report to the public on the Bank of Israel s discussions prior to deciding on the General interest rate for September
The structural shift of Hong Kong s external trade towards offshore trade
 The structural shift of Hong Kong s external trade towards offshore trade Reflecting the prominent role of Hong Kong as a business and service hub in the region, offshore trade in Hong Kong has been growing
CHAPTER 2 : TRADE IN GOODS. Except as otherwise provided, this Chapter applies to the trade in goods between the Parties.
 CHAPTER 2 : TRADE IN GOODS ARTICLE 2.1 : SCOPE AND COVERAGE Except as otherwise provided, this Chapter applies to the trade in goods between the Parties. ARTICLE 2.2 : DEFINITIONS For the purpose of this
THE ECONOMIC IMPACTS OF THE PORTS OF LOUISIANA AND THE MARITIME INDUSTRY
 THE ECONOMIC IMPACTS OF THE PORTS OF LOUISIANA AND THE MARITIME INDUSTRY Prepared by: TIMOTHY P. RYAN UNIVERSITY OF NEW ORLEANS February, 2001 EXECUTIVE SUMMARY The ports of Louisiana and the maritime