The Impact of Temporary Short Selling Restrictions on the Volatility of Financial Stock Prices: Does Firm Size Matter?
|
|
|
- Branden Newman
- 8 years ago
- Views:
Transcription
1 The Impact of Temporary Short Selling Restrictions on the Volatility of Financial Stock Prices: Does Firm Size Matter? Lisa A. Schwartz, Wingate University Kati D. Norris, Wingate University ABSTRACT In the fall of 2008 the financial system experienced a severe crisis. Financial firms were experiencing significant losses, leading to financial distress and even bankruptcy. The stock market reaction was quick and severe for these companies. Short selling intensified and the value of the shares tumbled. The Securities and Exchange Commission enacted an emergency order to halt short selling on 799 financial stocks to try and stem the market decline. This paper analyzes portfolios of restricted financial stocks and compares them to non restricted financial stocks to assess the impact of the ban on the distribution characteristics of the stocks. It also divides the firms into small, medium and large market capitalization firms to analyze size effects. All portfolios suffer declines in returns during the ban; however, only small and large non restricted firms have a significant difference from the pre event period. Volatility is higher during the event period for all portfolios, but small firms continue to have significantly higher volatility after the ban is lifted. Skewness results show that restricted firms have higher skewness in the positive direction during the ban, but unrestricted firms have a reduction in skewness, with medium and large firms showing negative skewness during the ban. The results of this paper show short term impacts on distribution characteristics for all financial firms during the time period of the ban. INTRODUCTION In 2007 and 2008, the hot real estate market was showing signs of slowing and the subprime mortgages that helped drive the market were starting to default. The financial firms that bundled, sold and owned derivative securities tied to the mortgages were experiencing losses. By the fall of 2008 the financial markets fell into a state of near crises led by the government takeover of Fannie Mae and Freddy Mac, the bankruptcy of Lehman Brothers, the sale of Merrill Lynch to Bank of America and the government bailout of American International Group (AIG). Due to sharp drops in the stock markets, driven by massive selling of financial stocks, and with the fear of a total market crash, the Securities and Exchange Commission (S.E.C.) implemented a ban on short selling of certain financial stocks. Short selling is when an investor borrows shares of stock and sells them, depositing the proceeds of the sale. The investor repurchases the shares at a later date to replace the ones loaned to him. The investor is anticipating that the share price will fall so that he will be able to replace

2 the borrowed shares at a lower price. Short selling impacts the demand for stock and depresses stock prices. Large volumes of short selling can drive share values to extremely low levels. This motivated the temporary ban. It was suggested by the Securities and Exchange Commission that excessive short selling, led by large hedge funds, was having a significant impact on the stability of financial firms. Both financially weak and strong firms were being affected by short selling. On September 18, 2008, the Securities and Exchange Commission halted short selling on 799 financial stocks. The restrictions were lifted on October 8, 2008, three business days after the passage of the Emergency Economic Stabilization Act of By prohibiting short selling, markets cannot fully reflect bearish sentiment and this can prevent share prices from falling to appropriate levels. Short selling restrictions are intended to limit downward price pressure, which may reduce stock price volatility. When temporary restrictions are lifted, stock prices may have a sudden reaction which would increase volatility. This study will look at stock price volatility and other distribution characteristics to see if the short selling ban had an impact on volatility. It will also segment the firms by market value to examine size effects. Many of the large financial firms were constantly in the news and are commonly known by small investors, who may overreact to information. Reactions to the short selling ban may have caused a different effect on large firms than on the smaller and medium sized firms that are not as well known. LITERATURE REVIEW Past research on the impact of short selling restrictions is mixed. Miller (1977) argues that prices will be driven up when there are restrictions on short selling due to excessively optimistic or poorly informed investors who will drive up demand, causing stocks to become overvalued. Bai, Chang, Wang (2006) find prices are driven down by short sale restrictions because it creates increased uncertainty that will reduce demand, resulting in lower prices and also higher variance. Past research has been performed on whether short selling restrictions affect the skewness of the return distribution. Diamond and Verrecchia (1987) and Hong and Stein (2003) find that restrictions do not increase prices, but will increase skewness of returns. Charoenrook and Daouk (2005) study market-wide short selling restrictions and find that restrictions do not affect skewness and that removing restrictions will not adversely affect markets. Much of the past literature on short selling is on markets where short selling is completely prohibited. Since this paper is studying temporary restrictions on a limited number of stocks, the market reactions may differ from markets where no short selling exists. There are a limited number of papers that look at temporary restrictions, and the most recent studies are not yet published in journals. Boulton & Braga-Alves (2008) study a temporary ban on naked short selling that took place in July Naked short selling is slightly different from regular short selling because the short sellers do not actually borrow the shares that are sold and do not deliver the stock to the buyer. It creates even more negative pressure on markets than regular short selling because of the ability to short large quantities without having to acquire the shares first. This ban was implemented two months before the more restrictive ban on all short selling. They find the ban caused an increase in volatility for both restricted stocks and non restricted financial stocks. Once the restrictions were lifted, the volatility returned to pre restriction levels.

3 Studies of the current short selling ban also find mixed results. Marsh and Niemer (2008) study the most recent temporary short selling bans that occurred in the U.S., U.K. Germany and France. They suggest the short selling restrictions reduced volatility and affected the distribution of returns (skewness and kurtosis); however, the results are mixed across countries. Specifically for the U.S., they find returns were negative after the restrictions, variance was higher and there were only slight changes in skewness and kurtosis. Lioui (2008) studied the effects of the short selling ban in the U.K and U.S. on global market indices and specific stocks. He finds the ban caused increased variance, but the general market reacted more strongly than the individual stocks. Skewness and kurtosis data was inconclusive and mixed, with American indices showing lower kurtosis and U.K. indices showing higher kurtosis. Gagnon and Witmer (2009) compared the affect of the ban on Canadian stocks crosslisted on U.S. exchanges and subject to the ban to a control group of non financial firms not subject to the ban. They find that volume in the restricted group lowered in the U.S., but increased in Canada. This volume effect was reversed after the ban was lifted. They also find that prices for the restricted stocks were higher in the U.S. market than in the Canadian market, but not pre or post ban. DATA All firms included in this analysis are held by Vanguard Index mutual funds and are classified by Vanguard as financial firms. The firms are divided into small, medium and large capitalization firms. Small firms had a market value at the time the data was collected of $1 billion or less. Medium size companies had capitalizations of $1 billion - $4 billion and large firms had capitalizations over $4 billion. Firms held by Vanguard Index funds were used in order to ensure the stocks were relatively liquid and were held by a large institutional investor. All stocks have been trading since June No stocks were included that have less than two years of history in order to exclude IPO effects. Also excluded are firms that went bankrupt, or were purchased by or merged with other firms. Firms are divided into restricted and non restricted portfolios. Restricted firms are financial firms whose stock was included in the temporary short selling ban the SEC ordered from September 19-October 8, Non restricted firms are financial firms whose stocks were not included in the short selling ban. Ten small, ten medium and ten large restricted firms are bundled separately into equally weighted portfolios. Ten small, ten medium and ten large non restricted firms are also bundled separately into equally weighted portfolios. This resulted in six distinct portfolios. All firms were randomly selected except for the large, restricted firms. For this portfolio, the authors wanted to specifically include firms that were receiving the most media coverage. This allows for a comparison of firms that were constantly in the news to firms that were receiving much less publicity to see if these highly publicized firms stocks reacted differently than the stocks of the less publicized firms. Since the authors do not have access to commonly used academic databases, all data was downloaded manually from For this reason, the authors included only 10 firms per portfolio. See Appendix 1 for a listing of the firms included in this study. Table 1 shows the mean market value of the different portfolios. The mean market value of the portfolio of small restricted stock is not significantly different from the mean for the
 studied the effects of the short selling ban in the U.K and U.S. on global market indices and specific stocks.")
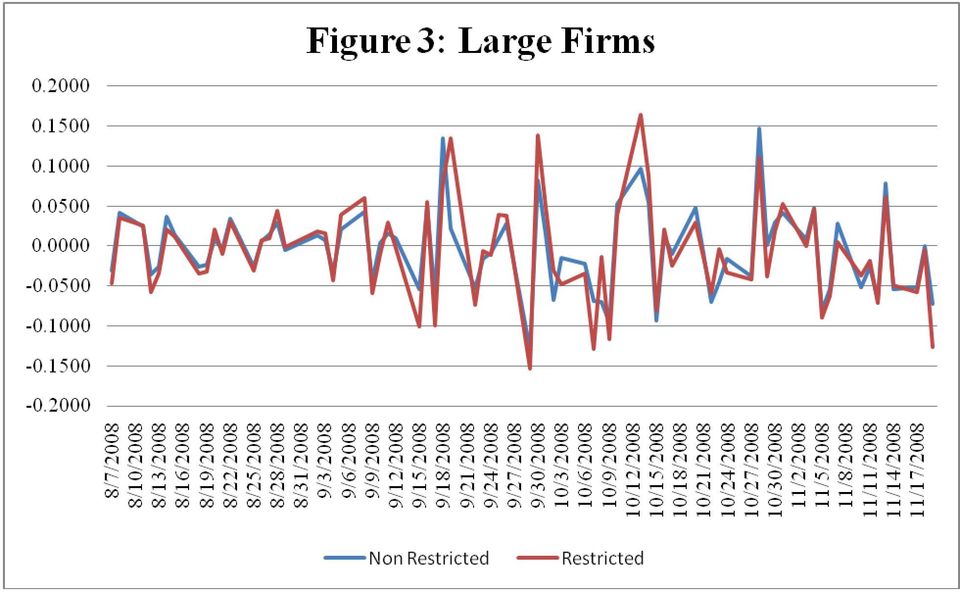
4 portfolio of small non restricted stock. The mean market value of the medium restricted stock portfolio is not significantly different from the medium non restricted portfolio. The mean market value of the large restricted stock portfolio is significantly larger than the mean market value of the non restricted portfolio. This was due to difficulty in identifying large financial firms whose stock was not included in the ban. The short selling ban was implemented on September 19, 2008 and ran until October 8, This 14 day time period is referred to as the event period. The 30 days prior to the ban, August 7 September 18 is defined as the pre event period. The 30 days after the ban, October 9 November 19 is defined as the post event period. These time periods were chosen so that the short term affect of the ban could be studied. Fourteen day pre and post event periods were also analyzed and provided similar results to the 30 day periods and, therefore, are not reported further in this paper. See Figure1, Figure 2 and Figure 3 for graphs of the returns during the time frame of the analysis. The portfolios show relative consistency in pattern from the beginning of the timeframe in August up to the time the ban was enacted. A change in pattern is observed from that point through November, when the analysis period ends. The paper also compares 2008 to the same time periods from September 19- October is identified as year ago event period. August 7-September is referred to as one year ago pre event period and October 9-November 19 is referred to as one year ago post event period. Comparing 2008 to 2007 provides additional information on what was happening in the market around the short selling ban. The primary objective of the paper is to study volatility of the portfolios before, during and after the short selling ban. The paper will also present the mean returns, skewness, kurtosis and correlation coefficients. CORRELATION Correlations coefficients are used to assess the similarity of the restricted and non restricted portfolios. The correlations in Table 2 show a strong relationship between the portfolios. Pre event, the correlation between the restricted and non restricted portfolios is above.90. The correlation drops during the event period to below.9, but is still strong. Post event, the correlation stays below.90 for small and medium firms, but returns to pre event levels for large firms. Correlation coefficients for 2007 in Table 3 display similar results. This shows that our randomly selected portfolios are actually very closely related to each other, so there is no indication that the selection process for stocks resulted in materially different portfolios. Correlations coefficients shown in Table 4 and Table 5 compare the non restricted portfolios to each other and the restricted portfolios to each other. Pre event, non restricted portfolios have a.90 correlation with each other and restricted portfolios also have a.90 correlation with each other. During the event, correlations drop below.90 except for the correlation between restricted small/large firms. Post event, non restricted correlations are between For restricted firms, small firms are less correlated with medium and large firms post event than before or during the event. Again, all correlations are strong, so the portfolios reacted very similarly during the time period of the analysis. Table 6 and Table 7 compare the size portfolios to each other during the same days in The small portfolios have slightly lower correlation with medium and large portfolios in 2007 than in Medium and large portfolios have similar correlation in 2007 as in All portfolios show strong relationships with correlation coefficients over.7. The size portfolios

5 historically displayed strong relationships with each other, so the strong correlations noted in 2008 are not unusual. MEAN RETURNS Mean returns are analyzed to study the performance of the portfolios throughout this time period; see Table 8 and Table 9. During the pre event time period, all portfolios had positive return except for large restricted firms. The restricted portfolios all have lower means than comparable non restricted portfolios, but the differences are not significant. During the short selling ban, all portfolios have a negative mean return; however, the decline is not significant for the restricted portfolios. The portfolios of non restricted small and large firms did show a significant difference between pre event and event returns. This indicates that the ban triggered a significant drop in returns for these non restricted firms. It is noted that all of the non restricted portfolios have lower mean returns than the restricted portfolios, but none of the differences are significant. Post event, all the portfolios still have negative returns. Even though the post event returns are less negative than the event returns for all portfolios except large restricted firms, no portfolios show any significant difference between event mean and post event mean return. No significant difference is noted between the restricted and non restricted firms of the same size during same time periods. The restrictions seem to have had a similar negative effect on the mean return for all firms, regardless of whether or not they were subject to the restrictions. This result is more consistent with Bae, Chang and Wang (2006) than Miller (1977). VOLATILITY An analysis of variance is performed to study the effect of the short selling restrictions on the volatility of the stock portfolios. Variance measures risk, so an increase in variance implies an increase in risk for investors. Table 10 shows data for restricted portfolios. During the 30 day pre event period, small size companies had the lowest variance. The variance increased based on the size of the company; therefore, the largest size companies had the highest variance. During the pre event period, there was a significant difference in variance between the small and mid size companies, as well as the small and large size companies. The small firm portfolios have significantly lower variance than the larger portfolios. There is no significant difference between the variance of the mid and large size companies. On September 19, when the temporary ban was placed on the stocks, there was a significant increase in variance for each size portfolio. Although, each of the different size companies experienced an increase in variance, the mid size company had the highest increase, therefore, now having the highest volatility. During the 14 day event period there were significant differences in the variance between the small and mid size firms, and the small and large size firms. There still remained to be no significant difference between mid and large size firms. Once the ban was lifted, the small firm portfolio continued to witness a significant increase in the variance. Unlike the small firms, both the mid size and large size firms saw a decrease in the variance. Even though there was not a significant difference in variance for these

6 two size firms, the large size company had a much larger drop in the variance than the mid size company. Within the 30 day post event period, there was only a significant difference in the small and mid size companies. Once more, there was not a significant difference within the mid and large size company, and now there was no difference between the small and large size companies. The short selling restrictions caused a short term increase in volatility for all firms under the ban. After the ban was lifted, only the small companies experienced a continued increase in volatility. It appears the restrictions caused risk to increase for small companies more than the medium or large companies whose stock was part of the ban. The data for the non restricted companies, shown in Table 11, is similar to that of the restricted companies. Over the 30 day pre event period, the variance for the portfolio of small companies was significantly lower than that of the large and mid size companies. The variance of the medium and large firm portfolios were similar, resulting in no significant difference between the two. Over the 14 day event period, the non restricted stocks also suffered an increase in variance; however, the increase in variance was not as large as the restricted stocks experienced. The small firms saw a minimal change in variance that was not significantly different from the pre event period. Medium and large firms saw a significant increase in variance from the pre event period. Comparing the different size companies within the event period, significant differences are denoted between small and medium companies as well as small and large size companies. The restrictions caused a significant stock reaction in medium and large firms that were not included in the ban. Once the ban was lifted from the market, the variance of the non restricted stocks continued to rise. During the post event period, the small companies saw the largest increase in variance. This was the only portfolio that showed a significant difference between the event period and the post event period. Because both the mid and large companies had only a small rise in variance, the volatility of each of the portfolios was relatively similar, causing no significant difference between any of the different size companies. The short selling restrictions affected financial firms whose stock was not part of the ban. The ban caused an immediate increase in volatility for medium and large firms, and ultimately, an increase in the volatility of small firms. The markets penalized small firms, who prior to the ban had significantly lower volatility than the larger firms. After the ban was lifted, the small firms had volatility that was no different from larger firms. Comparing the variance of the small non restricted portfolio to the small restricted portfolio finds no difference in volatility throughout the analyzed time period. The same is true for the medium portfolios. There is a significant difference observed for large portfolios. The large restricted portfolio has significantly higher variance during the ban than the large non restricted portfolio. This was a short term effect, as post event, the variance drops and is not significantly different from the non restricted firms. The large restricted firms in this analysis were closely followed by the media and were regularly in the news. The additional media coverage may have produced this significant increase in volatility for those firms. The goal of the short selling ban was to try and minimize the negative pressure on financial stocks, which should have resulted in lower volatility. This analysis shows that the ban actually caused an increase in volatility for all financial firms, and it was especially penalizing for small firms who experienced the highest increase in variance. The large, highly publicized

7 firms suffered from a sharp spike in volatility; however, medium restricted firms actually had the highest volatility during the ban. The increase in volatility for all portfolios still existed 30 days after the ban was lifted. To get a sense of how stock volatility was different in 2008 from 2007, the authors performed a comparison of variance in 2008 to variance in 2007; shown in Table 12 and Table 13. All portfolios show a significant increase in variance from 2007 to 2008 except for the small restricted portfolio in the pre event time period. Also evident is the fact that small firms do not have volatility that is significantly different from medium or large firms, with one exception (small/medium restricted firms during event period). In 2008, small firms have significantly lower variance from medium and large firms during pre event and event time frame. It appears that medium and large firms were feeling more volatility effects of the financial crises in the days prior to and during the short selling ban. Small companies felt the full volatility impact after the ban was lifted. Their variance significantly increased and was no longer significantly different variance from large firms. SKEWNESS AND KURTOSIS Past research suggests that return distributions may be affected by short selling restrictions. This study looks at skewness and kurtosis of the return distributions before, during and after the short selling ban. Skewness measures if the distribution has an asymmetric tail either the positive or negative direction. Kurtosis measures if the distribution is peaked (positive) or flattened (negative). The ban may cause the negative tail of the distribution to be truncated, which would result in positive skewness. The ban may also cause return distribution to be peaked due to the limitations in trading. In general, restricted firms see an increase in skewness during the ban and non restricted firms see a decrease in skewness during the ban; see Table 14 and Table 15. Small restricted firms see an increase in skewness during the event followed by a decrease in skewness after the event. Small non restricted firms see a drop in skewness during the event, followed by an increase in skewness after the event. Medium restricted firms see a large increase in skewness during the ban, and continued high skewness after the ban was lifted. Medium non restricted firms have positive skewness before the ban and negative skewness during the ban. Skewness is back to positive after the ban is lifted. Large restricted firms had negative skewness prior to the ban, positive skewness during the ban and after the ban. Large non restricted firms have positive skewness before the ban and negative skewness during the event. Skewness is again positive after the ban was lifted. The results suggest the ban did affect the skewness of the firms whose stocks were a part of the ban. Those firms all showed increased positive skewness. The firms whose stocks were not part of the ban actually showed lower or negative skewness during the ban. All firms show positive skewness after the ban was lifted. The kurtosis data shown in Table 16 and Table 17 is mixed depending on the size of the firm. Small restricted firms show a large increase in kurtosis during the ban and a drop to negative kurtosis after the ban. This is the pattern that is expected for stocks that were under the short selling ban. Small non restricted firms have positive kurtosis before and during the ban, followed by negative kurtosis after the ban.

8 Medium restricted firms show an overall pattern of increasing kurtosis from pre event to post event. Pre event kurtosis was negative and event/post event kurtosis was positive. Medium non restricted firms show an increase in kurtosis during the ban followed by a negative kurtosis afterward. Large restricted firms have a pattern of increasing kurtosis. Kurtosis is negative pre event and during the event and ends up positive post event. Large non restricted firms have an overall pattern of decreasing kurtosis. Pre event and event kurtosis are positive, but post event kurtosis is negative. It is expected that kurtosis would increase during the event and fall after the ban was lifted because of pent-up negative demand for restricted stocks. This pattern holds true for small firms only. Medium and large firms actually show higher kurtosis after the ban was lifted. It cannot be determined if the short selling restrictions caused the distribution to become more peaked during the event for those firms affected by the ban. CONCLUSIONS Ultimately, the short selling ban was intended to decrease the negative pressure on financial stocks which would result in a lower volatility. However, results show that the market does not always perform as predicted. Once the short selling restrictions were placed into effect, there was a short term increase in volatility for all firms, both restricted and non restricted. Although all firms were immediately affected by the ban, small companies were especially penalized due to the effect of them experiencing a continued significant increase in volatility after the ban was lifted. Based on this outcome, small firms felt the impact of volatility in the days following the ban, unlike larger companies who suffered the effects prior to and during the ban. The impact on volatility was comparatively the same for financial firms whose stock was placed under the ban as for financial firms whose stock was not placed under the ban. Nonetheless, there is a significant difference in one occurrence. Large, restricted companies had a significantly higher volatility during the event period than the large, non restricted companies. The substantial amount of time these companies spent in the news could be the reason for this. The returns decline for all portfolios during the analysis period. Prior to the event, all firms had a positive return with the exception of the large restricted companies. Yet, once the ban was placed, every portfolio had a negative return; although only non restricted small and large firms demonstrated a significant decline in return. During the post event period, all of the firms continued to have negative returns, but none are significantly different from the previous period. The returns show a consistent pattern of negativity during and after the ban, but only the non restricted small and large firms show any significant differences during the analysis period. With the short selling ban in place, the negative tail of the distribution for the financial firms under the restrictions was abridged. Accordingly, those firms witnessed a larger, positive skewness. The companies whose stock was not included in the ban observed contrasting results. The event caused either lower or negative skewness for these companies. When the ban was finally lifted, all firms show a positive skewness. While the short selling restrictions affected the mean returns of non restricted firms, volatility and skewness were affected for all financial firms. Based on the results of what occurred during the event period as well as the days prior to and following the event, the restrictions had a negative effect on the market. The negative effects are agreeable with the

9 theory of Bai, Chang, Wang (2006) and opposite of the S.E.C. s intention. The ban created higher volatility for all firms that dropped after the ban was lifted for all expect small firms. BIBLIOGRAPHY Bai, Yang, Chang, Eric C. & Wang, Jiang Asset Prices Under Short-Sale Constraints. Workimg paper. Boulton, Thomas J. & Braga-Alves, Marcus V The Skinny on the 2008 Naked Short Sale Restrictions. Social Science Research Network Working Paper Series. Charoenrook, Anachada and Daoud, Hazem 2005, Market-Wide Short Selling Restrictions. Working paper. Diamond D.W & Verrecchia R.E. 1987, Constraints on Short Selling and Asset Price Adjustment to Private Information. Journal of Financial Economics 18, Gagnon & Witmer 2009 Hong, Harrison & Stein, Jeremy C Differences of Opinion, Short-Sales Constraints, and Market Crashes. The Review of Financial Studies 16 (2) Lioui, Abraham The Undesirable Effects of Banning Short Sales. EDHEC Risk and Asset Management Research Centre. Marsh, Ian & Neimer, Norman The Impact of Short Sales Restrictions. Commissioned study by International Securities Lending Association, Alternative Investment Management Association and London Investment Banking Association. Miller, Edward M Risk, Uncertainty, and Divergence of Opinion. The Journal of Finance 32, Securities and Exchange Commission Releases:

10 Appendix 1 RESTRICTED FINANCIAL FIRMS Small Cap Texas Capital Bancshares, Inc. Signature Bank Heartland Financial USA Inc. MarketAxcess Holdings, Inc. optionsxpress Holdings Inc. Tower Group, Inc. Fulton Financial Corp. ViewPoint Financial Group Dollar Financial Corp. PICO Holdings inc. Mid Cap Genworth Financial Inc. XL Capital Ltd. Raymond James Financial Inc. Axis Capital Holdings Ltd. BOK Financial Corp. Arch Capital Group Ltd. TCF Financial Corp. HCC Insurance Holdings Inc. Markel Corp. Comerica, Inc. Large Cap Bank of America Corp. The Bank of New York Mellon Corp. BB&T Corp. Citigroup Inc. JPMorgan Chase & Co. Morgan Stanley PNC Financial Services Group Inc. The Goldman Sachs Group Inc. U.S. Bancorp Wells Fargo & Co. NON RESTRICTED FINANCIAL FIRMS Small Cap Life Partners Holdings World Acceptance Corp. TradeStation Group, Inc. Tejon Ranch Co. First Cash Financial Services Inc. Allied Capital Corp. Portfolio Recovery Associates Inc. American Capital Ltd. Cash America International Inc. Credit Acceptance Corp. Mid Cap CIT Group Inc. City National Corp. AmeriCredit Corp. Arthur J. Gallagher & Co. CB Richard Ellis Group, Inc. Brown & Brown Inc. Legg Mason Inc. SEI Investments Co. Fidelity National Financial Inc. Fifth Third Bancorp Large Cap Willis Group Holdings Ltd. M & T Bank Corp. Invesco, Ltd. Moody s Corp. Associated Banc-Corp. Annaly Capital Management, Inc. Capital One Financial Corp. Marsh & McLennan Companies Inc. MetLife Inc. American Express Co.

11 Table 1: Mean Market Value for Non Restricted vs Restricted Portfolios (in millions) Small Capitalization Portfolio Medium Capitalization Portfolio Large Capitalization Portfolio Non Restricted 505 2,526 11,367 Restricted 604 2,753 52,980 * *Significant difference in mean market value

12 Table 2: Correlation Coefficients: Restricted Firms vs Non Restricted Portfolios 2008 Small Firms Medium Firms Large Firms 30 Day Pre Event Day Pre Event Day Pre Event Day Event Day Event Day Event Day Post Event Day Post Event Day Post Event Table 3: Correlation Coefficients: Restricted Firms vs Non Restricted Portfolios 2007 Small Firms Medium Firms Large Firms 30 Day Pre Event Day Pre Event Day Pre Event Day Event Day Event Day Event Day Post Event Day Post Event Day Post Event Table 4: Correlation Coefficients for Non Restricted Portfolios Small vs Medium Small vs Large Medium vs Large 30 Day Pre Event Day Pre Event Day Pre Event Day Event Day Event Day Event Day Post Event Day Post Event Day Post Event Table 5: Correlation Coefficients for Restricted Portfolios Small vs Medium Small vs Large Medium vs Large 30 Day Pre Event Day Pre Event Day Pre Event Day Event Day Event Day Event Day Post Event Day Post Event Day Post Event Table 6: Correlation Coefficients for Non Restricted Portfolios 2007 Small vs Medium Small vs Large Medium vs Large 30 Day Pre Event Day Pre Event Day Pre Event Day Event Day Event Day Event Day Post Event Day Post Event Day Post Event Table 7: Correlation Coefficients for Restricted Portfolios 2007 Small vs Medium Small vs Large Medium vs Large 30 Day Pre Event Day Pre Event Day Pre Event Day Event Day Event Day Event Day Post Event Day Post Event Day Post Event

13 Table 8: Mean Returns for Restricted Portfolios 2008 Small Firms Medium Firms Large Firms 30 Day Pre Event Day Pre Event Day Pre Event Day Event Day Event Day Event Day Post Event Day Post Event Day Post Event No significant differences across time periods for any size firms Table 9: Mean Returns for Non Restricted Portfolios 2008 Small Firms Medium Firms Large Firms 30 Day Pre Event Day Pre Event Day Pre Event Day Event * 14 Day Event Day Event * 30 Day Post Event Day Post Event Day Post Event *Significant difference between pre event and event for small and large non restricted firms No significant difference between Non Restricted and Restricted firms

14 Table 10: Variance of Restricted Stock Portfolios Significant Difference in Variance Between Firms Small Firms Medium Firms Large Firms Small/Medium Medium/Large Small/Large 30 Day Pre Event * * 14 Day Event Period * * 30 Day Post Event * Significant Difference in Variance Between Time Periods Pre Event/ Event Period * * * Event/ Post Event * Pre Event/Post Event * * * Table 11: Variance of Non Restricted Stock Portfolios Significant Difference in Variance Between Firms Small Firms Medium Firms Large Firms Small/Medium Medium/Large Small/Large 30 Day Pre Event * * 14 Day Event Period * * 30 Day Post Event Significant Difference in Variance Between Time Periods Pre Event/ Event Period * * Event/ Post Event * Pre Event/Post Event * * * Significant Difference in Variance Between Restricted and Non Restricted Portfolios Pre Event/ Event Period Event/ Post Event * Pre Event/Post Event

15 Table 12: Variance of Restricted Stock Portfolios 2007 vs 2008 Significant Difference in Variance Between Firms Small Firms Medium Firms Large Firms Small/Medium Medium/Large Small/Large Pre Event Period (08) * * Pre Event Period (07) Significant Difference in Variance from 07 to 08 * * Significant Difference in Variance Between Firms Small Firms Medium Firms Large Firms Small/Medium Medium/Large Small/Large Event Period (08) * * Event Period (07) * Significant Difference in Variance from 07 to 08 * * * Significant Difference in Variance Between Firms Small Firms Medium Firms Large Firms Small/Medium Medium/Large Small/Large Post Event Period (08) * Post Event Period (07) Significant Difference in Variance from 07 to 08 * * * Table 13: Variance of Non Restricted Stock Portfolios 2007 vs 2008 Significant Difference in Variance Between Firms Small Firms Medium Firms Large Firms Small/Medium Medium/Large Small/Large Pre Event Period (08) * * Pre Event Period (07) Significant Difference in Variance from 07 to 08 * * Significant Difference in Variance Between Firms Small Firms Medium Firms Large Firms Small/Medium Medium/Large Small/Large Event Period (08) * * Event Period (07) Significant Difference in Variance from 07 to 08 * * * Significant Difference in Variance Between Firms Small Firms Medium Firms Large Firms Small/Medium Medium/Large Small/Large Post Event Period (08) Post Event Period (07) Significant Difference in Variance from 07 to 08 * * *
 0.00159 0.00755 0.00197 * * Event Period (07) 0.00019 0.00008 0.")
16 Table 14: Skewness of Restricted Portfolios 2008 Small Firms Medium Firms Large Firms 30 Day Pre Event Day Pre Event Day Pre Event Day Event Day Event Day Event Day Post Event Day Post Event Day Post Event Table 15: Skewness of Non Restricted Portfolios 2008 Small Firms Medium Firms Large Firms 30 Day Pre Event Day Pre Event Day Pre Event Day Event Day Event Day Event Day Post Event Day Post Event Day Post Event Table 16: Kurtosis of Restricted Portfolios 2008 Small Firms Medium Firms Large Firms 30 Day Pre Event Day Pre Event Day Pre Event Day Event Day Event Day Event Day Post Event Day Post Event Day Post Event Table 17: Kurtosis of Non Restricted Portfolios 2008 Small Firms Medium Firms Large Firms 30 Day Pre Event Day Pre Event Day Pre Event Day Event Day Event Day Event Day Post Event Day Post Event Day Post Event

17

18

19
OFFICE MARKET ANALYSIS SUBURBAN CHICAGO. According to Costar Property, the Suburban Chicago office market is distributed as follows:
 OFFICE MARKET ANALYSIS SUBURBAN CHICAGO Market Composition & Distribution According to Costar Property, the Suburban Chicago office market is distributed as follows: Office Submarket Cluster Distribution
Viral V Acharya NYU Stern School of Business February 2012
 Viral V Acharya NYU Stern School of Business February 2012 Released November 2010 September 15, 2008 Lehman declared bankruptcy and the most severe events of the financial crisis began. The U.S. had arranged
An Alternative Way to Diversify an Income Strategy
 Senior Secured Loans An Alternative Way to Diversify an Income Strategy Alternative Thinking Series There is no shortage of uncertainty and risk facing today s investor. From high unemployment and depressed
Research Paper No. 44: How short-selling activity affects liquidity of the Hong Kong stock market. 17 April 2009
 Research Paper No. 44: How short-selling activity affects liquidity of the Hong Kong stock market 17 April 2009 Executive Summary 1. In October 2008, the SFC issued a research paper entitled Short Selling
Lecture 16: Financial Crisis
 Lecture 16: Financial Crisis What is a Financial Crisis? A financial crisis occurs when there is a particularly large disruption to information flows in financial markets, with the result that financial
What s next for US banks
 JUNE 2009 f i n a n c i a l s e r v i c e s p r a c t i c e What s next for US banks Two different kinds of accounting fair value and hold to maturity have created two different kinds of crises. One is
Tenure by Household Size - 2009
 NEIGHBORHOOD APARTMENT MARKET ANALYSIS CITY OF CHICAGO Market Composition & Distribution The neighborhood apartment market consists of a range of properties developed from the early 1900s to more modern,
CAPITAL SHORTFALL: A NEW APPROACH TO RANKING and REGULATING SYSTEMIC RISKS Viral Acharya, Robert Engle and Matthew Richardson 1
 CAPITAL SHORTFALL: A NEW APPROACH TO RANKING and REGULATING SYSTEMIC RISKS Viral Acharya, Robert Engle and Matthew Richardson 1 We discuss a method to estimate the capital that a financial firm would need
THE EFFECTS OF STOCK LENDING ON SECURITY PRICES: AN EXPERIMENT
 THE EFFECTS OF STOCK LENDING ON SECURITY PRICES: AN EXPERIMENT Steve Kaplan Toby Moskowitz Berk Sensoy November, 2011 MOTIVATION: WHAT IS THE IMPACT OF SHORT SELLING ON SECURITY PRICES? Does shorting make
The Causes of the Financial Crisis and its Consequences
 The Causes of the Financial Crisis and its Consequences Peter J. Wallison June 18, 2010 Presentation to the IPAA, Colorado Springs What Happened Timeline of the Financial Crisis Timeline of Financial
1. The financial crisis of 2007/2008 and its impact on the UK and other economies
 1. The financial crisis of 2007/2008 and its impact on the UK and other economies Do you still feel vague about the causes and the effects of the financial crisis of 2007/8? Are you preparing for a job
Financial Markets, Lessors and Impacts on Aerospace Finance
 Financial Markets, Lessors and Impacts on Aerospace Finance Presentation to ITA Conference 2009 Nick Pastushan Chief Investment Officer Transportation Finance CIT September 15, 2009 CIT Commercial Segments
The Value of the Too Big to Fail Big Bank Subsidy
 Issue Brief September 2009 Center for Economic and Policy Research 1611 Connecticut Ave, NW Suite 400 Washington, DC 20009 tel: 202-293-5380 fax: 202-588-1356 www.cepr.net The Value of the Too Big to Fail
Short selling of Spanish bank shares
 Short selling of Spanish bank shares Ángel Berges and Daniel Suárez A.F.I. 1 Short selling, especially of bank shares, serves an important function in the stock market. However, the activity can also have
An overview of the financial system and the role of financial institutions
 An overview of the financial system and the role of financial institutions A. Three Goals of the Financial System I. The first goal of the financial system (FS) is to facilitate the flow of funds from
Presentation to the City of Los Angeles Investment Advisory Committee
 CHANDLER ASSET MANAGEMENT Presentation to the City of Los Angeles Investment Advisory Committee For the Month of March 2008 Economic Outlook 2 Impact on LA Bond yields were lower in March. The market s
Financial Markets and Institutions Abridged 10 th Edition
 Financial Markets and Institutions Abridged 10 th Edition by Jeff Madura 1 12 Market Microstructure and Strategies Chapter Objectives describe the common types of stock transactions explain how stock transactions
Research Paper No. 42 Short selling in the Hong Kong Stock Market. 23 October 2008
 Research Paper No. 42 Short selling in the Hong Kong Stock Market 23 ober 2008 Short selling in the Hong Kong Stock Market Executive Summary 1. Recently, several overseas jurisdictions have introduced
Purpose of Selling Stocks Short JANUARY 2007 NUMBER 5
 An Overview of Short Stock Selling An effective short stock selling strategy provides an important hedge to a long portfolio and allows hedge fund managers to reduce sector and portfolio beta. Short selling
High Yield Bonds in a Rising Rate Environment August 2014
 This paper examines the impact rising rates are likely to have on high yield bond performance. We conclude that while a rising rate environment would detract from high yield returns, historically returns
Synthetic Financing by Prime Brokers
 yale program on financial stability case study 2014-1e-v1 november 1, 2014 Basel III E: 1 Synthetic Financing by Prime Brokers Christian M. McNamara 2 Andrew Metrick 3 Abstract Hedge funds rely on prime
Investment Banks, Security, Brokers and Dealers, and Venture Capital Firms
 Investment Banks, Security, Brokers and Dealers, and Venture Capital Firms Investment Banks Investment banks are best known as Intermediaries that help corporations raise funds Investment banks provide
Mortgage Loan Conduit & Securitization Two Harbors Investment Corp. November 4, 2015
 Two Harbors Investment Corp. November 4, 2015 Two Harbors Investment Corp. is proud to present a webinar titled: Mortgage Loan Conduit and Securitization. Periodic webinars from Two Harbors will provide
Lecture Notes on MONEY, BANKING, AND FINANCIAL MARKETS. Peter N. Ireland Department of Economics Boston College. irelandp@bc.edu
 Lecture Notes on MONEY, BANKING, AND FINANCIAL MARKETS Peter N. Ireland Department of Economics Boston College irelandp@bc.edu http://www2.bc.edu/~irelandp/ec261.html Chapter 2: An Overview of the Financial
MONTHLY MARKET COMMENTARY
 MONTHLY MARKET COMMENTARY June 3, 2015 REVIEW May 31, 2015 December 31, 2014 % Change S&P/TSX 15,014.1 14,632.4 2.6% S&P 500 2,107.4 2,058.9 2.3% DJIA 18.010.7 17,823.1 1.0% NASDAQ 5,070.0 4,736.0 7.0%
 The State of the Corporate Banking Industry 2008 2009 Banking Industry Crisis Andrew Cardimen, Senior Vice President Middle Market Corporate Banking Harris Bank, N.A. 1 The 2008 2009 Credit Crisis 2 ~8,300
High Yield Bond fund flows know the flows
 NYSSA High Yield Bond Conference, June 2011 High Yield Bond fund flows know the flows WWW.EPFR.COM Investors have poured money into high-yield bond funds at a record pace this year as they seek less-risky
Mortgage Backed Securities. Masaryk University 2014- Brno, CZ
 Mortgage Backed Securities Masaryk University 2014- Brno, CZ Authored by: Vukman Manić Supervised by: Luděk Benada 12/6/2014 AGENDA 1. Introduction- Mortgage Backed Securities (MBS) 2. The MBS Market-
Credit Crunch A Realignment of Risk Management in Banking after(?) the Crisis
 the Crisis") Credit Crunch A Realignment of Risk Management in Banking after(?) the Crisis 3 rd European Security Conference Initiative, July 2, 2008 Gottfried Tröstl Seite 1 Seite 2 How did it come? 2000: burst of
Credit Crunch A Realignment of Risk Management in Banking after(?) the Crisis 3 rd European Security Conference Initiative, July 2, 2008 Gottfried Tröstl Seite 1 Seite 2 How did it come? 2000: burst of
Why a Floating Exchange Rate Regime Makes Sense for Canada
 Remarks by Gordon Thiessen Governor of the Bank of Canada to the Chambre de commerce du Montréal métropolitain Montreal, Quebec 4 December 2000 Why a Floating Exchange Rate Regime Makes Sense for Canada
Lecture 4: The Aftermath of the Crisis
 Lecture 4: The Aftermath of the Crisis 2 The Fed s Efforts to Restore Financial Stability A financial panic in fall 2008 threatened the stability of the global financial system. In its lender-of-last-resort
JPMORGAN VALUE OPPORTUNITIES FUND, INC. JPMORGAN TRUST II JPMorgan Large Cap Value Fund (All Share Classes)
") JPMORGAN VALUE OPPORTUNITIES FUND, INC. JPMORGAN TRUST II JPMorgan Large Cap Value Fund (All Share Classes) Supplement dated October 15, 2013 to the Summary Prospectuses dated November 1, 2012, as supplemented
JPMORGAN VALUE OPPORTUNITIES FUND, INC. JPMORGAN TRUST II JPMorgan Large Cap Value Fund (All Share Classes) Supplement dated October 15, 2013 to the Summary Prospectuses dated November 1, 2012, as supplemented
New York's 529 Advisor-Guided College Savings Program
 New York's 529 Advisor-Guided College Savings Program Data as of May 3, 204 month (as of 3/3/204) 0 yrs Expense ratio AGE-BASED PORTFOLIOS JPMorgan 529 Aggressive Age-Based Portfolio (Age 0-5) 2,3,4,5,6,7,8,9,37
ACTIVITY 17.1 UNDERSTANDING MARKET CRASHES
 ACTIVITY 17.1 UNDERSTANDING MARKET CRASHES Directions for the teacher: Make copies of this activity (for a class of 30, three copies; more copies for a larger class). Cut each copy into 12 sections as
New York's 529 Advisor-Guided College Savings Program
 New York's 529 Advisor-Guided College Savings Program yr AVERAGE TOTAL Expense ratio AGE-BASED PORTFOLIOS JPMorgan 529 Aggressive Age-Based Portfolio (Age 0-5) 2,3,4,5,6,7,8,9,37 Class A - 5/4/202, 5705,
FOR IMMEDIATE RELEASE November 7, 2013 MEDIA CONTACT: Lisa Gagnon 703-903-3385 INVESTOR CONTACT: Robin Phillips 571-382-4732
 FOR IMMEDIATE RELEASE MEDIA CONTACT: Lisa Gagnon 703-903-3385 INVESTOR CONTACT: Robin Phillips 571-382-4732 FREDDIE MAC REPORTS PRE-TAX INCOME OF $6.5 BILLION FOR THIRD QUARTER 2013 Release of Valuation
Licensed by the California Department of Corporations as an Investment Advisor
 Licensed by the California Department of Corporations as an Investment Advisor The Impact of the Alternative Minimum Tax (AMT) on Leverage Benefits My associate Matthias Schoener has pointed out to me
OCC Mortgage Metrics Report Disclosure of National Bank and Federal Savings Association Mortgage Loan Data
 OCC Mortgage Metrics Report Disclosure of National Bank and Federal Savings Association Mortgage Loan Data First Quarter 2014 Office of the Comptroller of the Currency Washington, D.C. June 2014 Contents
L2: Alternative Asset Management and Performance Evaluation
 L2: Alternative Asset Management and Performance Evaluation Overview of asset management from ch 6 (ST) Performance Evaluation of Investment Portfolios from ch24 (BKM) 1 Asset Management Asset Management
Too Big To Breach? The cybersecurity posture of the financial sector is an important factor in its overall health and stability.
 Too Big To Breach? Examining the Cybersecurity Risk of the Largest US Banks and Thrifts November 2015 The cybersecurity posture of the financial sector is an important factor in its overall health and
CENTER FOR WOODEN BOATS INVESTMENT POLICY
 CENTER FOR WOODEN BOATS INVESTMENT POLICY A. PURPOSE The Investment Policy establishes the Center for Wooden Boats (CWB) guidelines and responsibilities regarding the investment of either restricted or
Correlation of International Stock Markets Before and During the Subprime Crisis
 173 Correlation of International Stock Markets Before and During the Subprime Crisis Ioana Moldovan 1 Claudia Medrega 2 The recent financial crisis has spread to markets worldwide. The correlation of evolutions
WHAT HAPPENS WHEN A BROKER-DEALER FAILS? A SUMMARY OF CERTAIN KEY BANKRUPTCY CODE AND SIPA-RELATED ISSUES
 CLIENT MEMORANDUM WHAT HAPPENS WHEN A BROKER-DEALER FAILS? A SUMMARY OF CERTAIN KEY BANKRUPTCY CODE AND SIPA-RELATED ISSUES As widely reported, on March 16, 2008, J.P. Morgan Chase & Co. agreed to acquire
20472 Chartwell Center Drive, Cornelius, NC 28031-1-888-658-7638 - www.vectovest.com
 20472 Chartwell Center Drive, Cornelius, NC 28031-1-888-658-7638 - www.vectovest.com Gold Fever As we start a new decade, we can look back in stunned disbelief at the financial and economic wreckage that
Circuit Breakers: International Practices and Effectiveness
 22 Articles and Speeches Circuit Breakers: International Practices and Effectiveness by Supervision of Markets Division of the Securities and Futures Commission Overview "Circuit breakers" and "price limits"
RBC Money Market Funds Prospectus
 RBC Money Market Funds Prospectus November 25, 2015 Prime Money Market Fund RBC Institutional Class 1: RBC Institutional Class 2: RBC Select Class: RBC Reserve Class: RBC Investor Class: TPNXX TKIXX TKSXX
Stock Markets Correlation: before and during the Crisis Analysis *
 Theoretical and Applied Economics Volume XVIII (2011), No. 8(561), pp. 111-122 Stock Markets Correlation: before and during the Crisis Analysis * Ioana MOLDOVAN Bucharest Academy of Economic Studies ioana.moldovan@economie.ase.ro
Short Selling and the Economic Consequences
 SHORT SELLING Position paper April 2013 SHORT SELLING IN SUPPORT OF SHORT SELLING CFA UK believes covered short selling is a legitimate investment activity which enhances the integrity of the capital markets
GOLDMAN SACHS VARIABLE INSURANCE TRUST
 GOLDMAN SACHS VARIABLE INSURANCE TRUST Institutional and Service Shares of the Goldman Sachs Money Market Fund (the Fund ) Supplement dated July 29, 2015 to the Prospectuses and Summary Prospectuses, each
Conceptual Framework: What Does the Financial System Do? 1. Financial contracting: Get funds from savers to investors
 Conceptual Framework: What Does the Financial System Do? 1. Financial contracting: Get funds from savers to investors Transactions costs Contracting costs (from asymmetric information) Adverse Selection
C. How do corporations go public and continue to grow? What are agency problems? What is corporate governance?
 Mini Case (p.45) Assume that you recently graduated and have just reported to work as an investment advisor at the brokerage firm of Balik and Kiefer Inc. One of the firm's clients is Michelle Della Torre,
KBW Mortgage Finance Conference. June 2, 2015
 KBW Mortgage Finance Conference June 2, 2015 Forward Looking Statements This presentation contains forward looking statements within the meaning of the safe harbor provisions of the Private Securities
Analysis of Factors Influencing the ETFs Short Sale Level in the US Market
 Analysis of Factors Influencing the ETFs Short Sale Level in the US Market Dagmar Linnertová Masaryk University Faculty of Economics and Administration, Department of Finance Lipova 41a Brno, 602 00 Czech
Third Quarter 2012. Australia Mortgage Insurance & U.S. Mortgage Insurance Investor Materials October 30, 2012
 Third Quarter 2012 Australia Mortgage Insurance & U.S. Mortgage Insurance Investor Materials October 30, 2012 2012 Genworth Financial, Inc. All rights reserved. Cautionary Note Regarding Forward-Looking
DFA INVESTMENT DIMENSIONS GROUP INC.
 PROSPECTUS February 28, 2015 Please carefully read the important information it contains before investing. DFA INVESTMENT DIMENSIONS GROUP INC. DFA ONE-YEAR FIXED INCOME PORTFOLIO Ticker: DFIHX DFA TWO-YEAR
Regulating Short-Sales*
 Regulating Short-Sales* by Ronel Elul S hort-selling, the practice of selling a security the seller does not own, is done in an attempt to profit from an expected decline in the price of the security.
Brown Advisory WMC Strategic European Equity Fund Class/Ticker: Institutional Shares / BAFHX Investor Shares / BIAHX Advisor Shares / BAHAX
 Summary Prospectus October 30, 2015 Brown Advisory WMC Strategic European Equity Fund Class/Ticker: Institutional Shares / BAFHX Investor Shares / BIAHX Advisor Shares / BAHAX Before you invest, you may
FREE MARKET U.S. EQUITY FUND FREE MARKET INTERNATIONAL EQUITY FUND FREE MARKET FIXED INCOME FUND of THE RBB FUND, INC. PROSPECTUS.
 FREE MARKET U.S. EQUITY FUND FREE MARKET INTERNATIONAL EQUITY FUND FREE MARKET FIXED INCOME FUND of THE RBB FUND, INC. PROSPECTUS December 31, 2014 Investment Adviser: MATSON MONEY, INC. 5955 Deerfield
FUNDMARKET INSIGHT REPORT
 FUNDMARKET INSIGHT REPORT MAY 2013 LAUNCHES, LIQUIDATIONS, AND MERGERS IN THE EUROPEAN MUTUAL FUND INDUSTRY, Q1 2013 CHRISTOPH KARG Content Specialist for Germany & Austria Executive Summary As of the
A Bail-In or a Bail-Out? New Risks on the Horizon in the Banking Sector
 The US banking sector is currently characterized by good credit fundamentals and supportive technicals. A key risk offsetting this credit strength is the prospect of a new bank resolution regime (Orderly
Federated Total Return Government Bond Fund
 Summary Prospectus April 30, 2016 Share Class Institutional Service Ticker FTRGX FTGSX Federated Total Return Government Bond Fund Before you invest, you may want to review the Fund s Prospectus, which
The Importance of Data Quality to Compliance with the Dodd-Frank Act William Henley Senior Vice President, Regulation
 The Importance of Data Quality to Compliance with the Dodd-Frank Act William Henley Senior Vice President, Regulation Data Governance and Quality Why the focus now? Has always been an important pre-requisite
Interactive Brokers Group Strength and Security
 Interactive Brokers Group Strength and Security When placing your money with a broker, you need to make sure your broker is secure and can endure through good and bad times. The financial statements of
Central Bank of Ireland Macro-prudential policy for residential mortgage lending Consultation Paper CP87
 Central Bank of Ireland Macro-prudential policy for residential mortgage lending Consultation Paper CP87 An initial assessment from Genworth Financial The Central Bank ( CB ) published a consultation paper
High Yield Bonds A Primer
 High Yield Bonds A Primer With our extensive history in the Canadian credit market dating back to the Income Trust period, our portfolio managers believe that there is considerable merit in including select
A GUIDE TO FLOATING RATE BANK LOANS:
 Contact information: Advisor Services: (631) 629-4908 E-mail: info@catalystmf.com Website: www.catalystmf.com A GUIDE TO FLOATING RATE BANK LOANS: An Attractive Investment for a Rising Interest Rate Environment
RISK DISCLOSURE STATEMENT FOR SECURITY FUTURES CONTRACTS
 RISK DISCLOSURE STATEMENT FOR SECURITY FUTURES CONTRACTS This disclosure statement discusses the characteristics and risks of standardized security futures contracts traded on regulated U.S. exchanges.
SPDR S&P 400 Mid Cap Value ETF
 SPDR S&P 400 Mid Cap Value ETF Summary Prospectus-October 31, 2015 Before you invest in the SPDR S&P 400 Mid Cap Value ETF (the Fund ), you may want to review the Fund's prospectus and statement of additional
How To Invest In Stocks And Bonds
 Review for Exam 1 Instructions: Please read carefully The exam will have 21 multiple choice questions and 5 work problems. Questions in the multiple choice section will be either concept or calculation
Why asset management arms of banks should continue to lend bank shares
 Why asset management arms of banks should continue to lend bank shares Robert Peston of the BBA and Jeremy Warner of the Independent have recently asked why the asset management arms of banks continue
The Distressed Property Market and Shadow Inventory in Florida: Estimates and Analysis
 The Distressed Property Market and Shadow Inventory in Florida: Estimates and Analysis Introduction Florida was one of the states hardest hit by the real estate downturn. Delinquencies, foreclosures and
Investing in International Financial Markets
 APPENDIX 3 Investing in International Financial Markets http:// Visit http://money.cnn.com for current national and international market data and analyses. The trading of financial assets (such as stocks
Federal Reserve Monetary Policy
 Federal Reserve Monetary Policy To prevent recession, earlier this decade the Federal Reserve s monetary policy pushed down the short-term interest rate to just 1%, the lowest level for many decades. Long-term
Bond Fund Investing in a Rising Rate Environment
 MUTUAL FUND RESEARCH Danette Szakaly Ext. 71937 Date Issued: 1/14/11 Fund Investing in a Rising Rate Environment The recent rise in U.S. Treasury bond yields has some investors wondering how to manage
The Impact of Short Sales Restrictions
 The Impact of Short Sales Restrictions Ian W. Marsh and Norman Niemer 1 3 November 28 1 This independent analysis was commissioned and funded by the International Securities Lending Association (ISLA)
A Presentation On the State of the Real Estate Crisis 1/30/2009
 A Presentation On the State of the Real Estate Crisis 1/30/2009 Presented by Mike Anderson, CRMS President, Essential Mortgage, a Latter & Blum Realtors Company Immediate past president/legislative Chair
Evergreen INSTITUTIONAL MONEY MARKET FUNDS. Prospectus July 1, 2009
 Evergreen INSTITUTIONAL MONEY MARKET FUNDS Prospectus July 1, 2009 Evergreen Institutional 100% Treasury Money Market Fund Evergreen Institutional Money Market Fund Evergreen Institutional Municipal Money
The Impact of a Pre-Borrow Requirement for Short Sales. On Failures-to-Deliver and Market Liquidity. Robert J. Shapiro and Nam D.
 The Impact of a Pre-Borrow Requirement for Short Sales On Failures-to-Deliver and Market Liquidity Robert J. Shapiro and Nam D. Pham April 2009 The Impact of a Pre-Borrow Requirement for Short Sales On
MEASUREMENTS OF FAIR VALUE IN ILLIQUID (OR LESS LIQUID) MARKETS
 MARKETS") MEASUREMENTS OF FAIR VALUE IN ILLIQUID (OR LESS LIQUID) MARKETS Objective The objective of this paper is to discuss issues associated with the measurement of fair value under existing generally accepted
MEASUREMENTS OF FAIR VALUE IN ILLIQUID (OR LESS LIQUID) MARKETS Objective The objective of this paper is to discuss issues associated with the measurement of fair value under existing generally accepted
Maximizing Your Equity Allocation
 Webcast summary Maximizing Your Equity Allocation 130/30 The story continues May 2010 Please visit jpmorgan.com/institutional for access to all of our Insights publications. Extension strategies: Variations
Global high yield: We believe it s still offering value December 2013
 Global high yield: We believe it s still offering value December 2013 02 of 08 Global high yield: we believe it s still offering value Patrick Maldari, CFA Senior Portfolio Manager North American Fixed
VISUAL 1 TERMS OF MODERN FINANCIAL MARKETS
 VISUAL 1 TERMS OF MODERN FINANCIAL MARKETS Instruments Asset-backed security Credit default swap Bond Common stock Mortgage-backed security Mutual fund Option Futures contract Subprime mortgage Institutions
Amaranth Debacle : Lessons in Risk Management
 Amaranth Debacle : Lessons in Risk Management Amaranth Advisors LLC was an American multistrategy hedge fund managing US$9 billion in assets. In September 2006, it collapsed after losing roughly US$6 billion
2012 Survey of Credit Underwriting Practices
 2012 Survey of Credit Underwriting Practices Office of the Comptroller of the Currency Washington, D.C. June 2012 Contents Introduction... 1 Part I: Overall Results... 3 Primary Findings... 3 Commentary
Financial Markets and Institutions Abridged 10 th Edition
 Financial Markets and Institutions Abridged 10 th Edition by Jeff Madura 1 23 Mutual Fund Operations Chapter Objectives provide a background on mutual funds describe the various types of stock and bond
Analyzing Risk in an Investment Portfolio
 Introduction Analyzing Risk in an Investment Portfolio October 16, 2012 PUBLIC TRUST ADVISORS Neil Waud, CFA Director Portfolio Management neil.waud@publictrustadvisors.com (303) 244-0468 Matthew Tight
Federal Reserve Bank of Kansas City: Consumer Credit Report
 Federal Reserve Bank of Kansas City: Consumer Credit Report Tenth District Consumer Credit Report May 29, 2015 By Kelly Edmiston, Senior Economist and Mwai Malindi, Research Associate FIRST QUARTER 2015
Bullion and Mining Stocks Two Different Investments
 BMG ARTICLES Bullion and Mining Stock Two Different Investments 1 Bullion and Mining Stocks Two Different Investments March 2009 M By Nick Barisheff any investors believe their portfolios have exposure
Cross Sectional Analysis of Short Sale Determinants on U.S. Blue Chips
 DOI: 10.5817/FAI2015-2-2 No. 2/2015 Cross Sectional Analysis of Short Sale Determinants on U.S. Blue Chips Dagmar Linnertová Masaryk University Faculty of Economics and Administration, Department of Finance
Morgan Stanley Institutional Fund Trust
 INVESTMENT MANAGEMENT Morgan Stanley Institutional Fund Trust U.S. Equity Portfolios U.S. Mid Cap Value Portfolio U.S. Small Cap Value Portfolio Value Portfolio Prospectus Share Class and Ticker Symbol
FUNDMARKET INSIGHT REPORT
 FUNDMARKET INSIGHT REPORT NOVEMBER 2013 LAUNCHES, LIQUIDATIONS, AND MERGERS IN THE EUROPEAN MUTUAL FUND INDUSTRY, Q3 2013 CHRISTOPH KARG Content Specialist for Germany & Austria Executive Summary As of
Brown Advisory Strategic Bond Fund Class/Ticker: Institutional Shares / (Not Available for Sale)
") Summary Prospectus October 30, 2015 Brown Advisory Strategic Bond Fund Class/Ticker: Institutional Shares / (Not Available for Sale) Before you invest, you may want to review the Fund s Prospectus, which
Summary Prospectus October 30, 2015 Brown Advisory Strategic Bond Fund Class/Ticker: Institutional Shares / (Not Available for Sale) Before you invest, you may want to review the Fund s Prospectus, which
Money Supply. Key point: if banks hold 100% reserves (i.e., make no loans), they do not change the money supply. 1. Who affects the money supply?
, they do not change the money supply. 1. Who affects the money supply?") Money Supply 1. Who affects the money supply? 2. 100% reserve banking 3. Fractional reserve banking 4. Money Supply determination and the money multiplier 5. What causes money supply to change? 6. Instruments
Money Supply 1. Who affects the money supply? 2. 100% reserve banking 3. Fractional reserve banking 4. Money Supply determination and the money multiplier 5. What causes money supply to change? 6. Instruments
Short sales constraints and stock price behavior: evidence from the Taiwan Stock Exchange
 Feng-Yu Lin (Taiwan), Cheng-Yi Chien (Taiwan), Day-Yang Liu (Taiwan), Yen-Sheng Huang (Taiwan) Short sales constraints and stock price behavior: evidence from the Taiwan Stock Exchange Abstract This paper
This document contains a lesson from the National Council on Economic Education's Learning, Earning and Investing High School publication.
 This document contains a lesson from the National Council on Economic Education's Learning, Earning and Investing High School publication. To purchase the Learning, Earning and Investing materials, visit:
Frequently Asked Questions Q3 2007
 Frequently Asked Questions Q3 2007 1. Can you comment on the performance of CIBC Retail Markets during the quarter? CIBC Retail Markets reported net income for the third quarter of $555 million, up 14%
Salt Lake Housing Forecast
 2015 Salt Lake Housing Forecast A Sustainable Housing Market By James Wood Director of the Bureau of Economic and Business Research Commissioned by the Salt Lake Board of REALTORS By year-end 2013 home
The financial crisis and its issues
 The financial crisis and its issues James B. Bexley Sam Houston State University Joe F. James Sam Houston State University James Haberman Sam Houston State University ABSTRACT The financial crisis has