MSW waste-to-energy THE 2014 ERC DIRECTORY OF WASTE-TO-ENERGY FACILITIES. sustainable. green. innovation. baseload EfW. energy recovery electricity
|
|
|
- Ellen McGee
- 8 years ago
- Views:
Transcription
1 THE 2014 ERC DIRECTORY OF WASTE-TO-ENERGY FACILITIES THE ENERGY RECOVERY COUNCIL IS THE NATIONAL ASSOCIATION REPRESENTING COMPANIES, ORGANIZATIONS, AND LOCAL GOVERNMENTS ENGAGED IN THE WASTE-TO-ENERGY SECTOR IN THE UNITED STATES. BY TED MICHAELS innovation advanced renewable jobs WTE power MSW waste-to-energy thermal technology baseload EfW CHP avoid GHG conversion fuels resource recovery clean energy energy recovery electricity green sustainable W aste-to-energy is a proven technology used globally to generate clean, renewable energy from the sustainable management of municipal solid waste (MSW). Progressive communities around the world employ strategies to reduce, reuse, recycle, and recover energy from waste. With approximately 29 percent of America s waste being recycled, 7.6 percent processed at waste-to-energy facilities and 63.5 percent landfilled, MSW is an abundant, valuable, and underutilized source of domestic energy. By processing this material, waste-to-energy facilities: Produce renewable, baseload energy Reduce greenhouse gases Create good-paying, green jobs Operate with superior environmental performance Complement and enhance recycling goals Eighty-four waste-to-energy facilities in 23 states have the capacity to process more than 96,000 tons of waste per day with a baseload electric capacity of 2,769 megawatt hours. Due to superior operational reliability, the nation s waste-to-energy facilities process in excess of 30 million tons of trash per year, sell more than 14.5 million megawatt hours to the grid, and recover more than 730,000 tons of ferrous metals for recycling. In addition, many facilities sell steam directly to end users offsetting the use of fossil fuels to make that energy. renewable energy from waste 1
.")
2 Table of Contents Articles Page Facility Quick List 3 Waste-to-Energy Capacity 4 Waste-to-Energy Production 5 Waste-to-Energy Reduces Greenhouse Gas Emissions 7 Waste-to-Energy is a Renewable Resource 8 Nationwide Economic Benefits of the WTE Sector 9 EPA Memo Regarding WTE MACT Compliance 10 Update of Findings from Public Health and Environmental Studies of WTE Technologies 12 WTE, an Essential part of Sustainable Materials Management 14 A Compatibility Study: Recycling and WTE Work in Concert 16 The Global WTERT Council 18 WTE in Corporate Sustainability Efforts 22 Workplace Health & Safety A WTE Priority 24 ERC Membership 25 WTE Directory: Key Terms 26 Facilities (by State) Page Alabama 27 California 28 Connecticut 30 Florida 33 Hawaii 38 Indiana 39 Iowa 40 Maine 41 Maryland 43 Massachusetts 45 Michigan 48 Minnesota 50 New Hampshire 54 New Jersey 55 New York 57 North Carolina 61 Oklahoma 62 Oregon 63 Pennsylvania 64 Utah 67 Virginia 68 Washington 70 Wisconsin 71 Charts/Graphs Page WTE Capacity 4 WTE Production 5 Lifecycle Assessment of WTE GHG Reductions 7 Disposition of MSW in U.S. States 19 Disposition of MSW in Various Countries 21 Materials and Energy Recovery vs. Landfilling 23 Facility Owners 60 Facility Operators 60 Facility Technology Type 60 Facility Offtake 60 Discussions Page Renewable Energy Generation in the United States 27 EfW Can Help Curb GHG Emissions (Center for American Progress) 29 EIA Electric Generating Capacity Outlook 29 Waste is a Valuable Domestic Energy Resource (infographic) 32 World Economic Forum Green Investing 32 American Chemistry Council s Chemistry to Energy Campaign 37 Recent Capacity Additions 37 Growth in Canada Durham York Energy Center 38 Confederation of Waste-to-Energy Plants (CEWEP) 39 International Solid Waste Association (ISWA) 40 Solid Waste Association of North America (SWANA) 40 North American Waste-to-Energy Conference (NAWTEC) 42 Waste Conversion Technologies 42 U.S. Congress Relies on WTE 44 Maryland Recognizes WTE as a Tier 1 Renewable 44 WTE Carbon Offsets 47 Energy Recovery Council Membership 47 ASME Facility Recognition Awards 49 WTE as CHP Delivers Green Steam 49 QRO Qualification for WTE Operators 53 Ramsey/Washington Resource Recovery Facility 53 European WTE Markets 61 Prescription for Safety Program (Rx4Safety) 62 Metal Recovery and Recycling 65 WTE By the Numbers 66 Democratic Governors Association Report on Opportunities to Increase and Diversify Domestic Energy Resources 67 The Four R s (Reduce, Reuse, Recycle, Recover) 70 Maps Page WTE Plants in the United States 6 States Defining WTE as Renewable 6 Waste Feedstocks Track Population Density 20 2
 Page Alabama 27 California 28 Connecticut 30 Florida 33 Hawaii 38 Indiana 39 Iowa 40 Maine 41")
3 Quick List of WTE Facilities (by state) Alabama 1) Huntsville Waste-to-Energy Facility (Huntsville) California 2) Commerce Refuse-to-Energy Facility (Commerce) 3) Southeast Resource Recovery Facility (Long Beach) 4) Stanislaus County Resource Recovery Facility (Crows Landing) Connecticut 5) Bristol Resource Recovery Facility (Bristol) 6) CRRA Hartford Trash-to-Energy Plant (Hartford) 7) Southeastern Connecticut Resource Recovery Facility (Preston) 8) Wallingford Resource Recovery Facility (Wallingford) 9) Wheelabrator Bridgeport, L.P. (Bridgeport) 10) Wheelabrator Lisbon Inc. (Lisbon) Florida 11) Bay County Waste-to-Energy Facility (Panama City) 12) Hillsborough County Resource Recovery Facility (Tampa) 13) Lake County Resource Recovery Facility (Okahumpka) 14) Lee County Resource Recovery Facility (Ft. Myers) 15) McKay Bay Refuse-to-Energy Facility (Tampa) 16) Miami-Dade County Resource Recovery Facility (Miami) 17) Palm Beach Renewable Energy Facility #1 (West Palm Beach) 18) Pasco County Solid Waste Resource Recovery Facility (Spring Hill) 19) Pinellas County Resource Recovery Facility (St. Petersburg) 20) Wheelabrator North Broward Inc. (Pompano Beach) 21) Wheelabrator South Broward Inc. (Ft. Lauderdale) Hawaii 22) Honolulu Resource Recovery Venture HPOWER (Kapolei) Indiana 23) Indianapolis Resource Recovery Facility (Indianapolis) Iowa 24) Arnold O. Chantland Resource Recovery Plant (Ames) Maine 25) ecomaine (Portland) 26) Mid-Maine Waste Action Corporation (Auburn) 27) Penobscot Energy Recovery Company (Orrington) Maryland 28) Harford Waste-to-Energy Facility (Joppa) 29) Montgomery County Resource Recovery Facility (Dickerson 30) Wheelabrator Baltimore, L.P. (Baltimore) Massachusetts 31) Haverhill Resource Recovery Facility (Haverhill) 32) Pioneer Valley Resource Recovery Facility (Agawam) 33) Pittsfield Resource Recovery Facility (Pittsfield) 34) SEMASS Resource Recovery Facility (West Wareham) 35) Wheelabrator Millbury Inc. (Millbury) 36) Wheelabrator North Andover Inc. (North Andover) 37) Wheelabrator Saugus Inc. (Saugus) Michigan 38) Detroit Renewable Power (Detroit) 39) Jackson County Resource Recovery Facility (Jackson) 40) Kent County Waste-to-Energy Facility (Grand Rapids) Minnesota 41) Great River Energy - Elk River Station (Elk River) 42) Hennepin Energy Resource Center (Minneapolis) 43) Olmsted Waste-to-Energy Facility (Rochester) 44) Perham Resource Recovery Facility (Perham) 45) Polk County Solid Waste Resource Recovery Facility (Fosston) 46) Pope/Douglas Waste-to-Energy Facility (Alexandria) 47) Red Wing Resource Recovery Facility (Red Wing) 48) Xcel Energy - Red Wing Steam Plant (Red Wing) 49) Xcel Energy-Wilmarth Plant (Mankato) New Hampshire 50) Wheelabrator Claremont Company, L.P. (Claremont) 51) Wheelabrator Concord Company, L.P. (Concord) New Jersey 52) Covanta Camden Energy Recovery Center (Camden) 53) Covanta Warren Energy Resource Company Facility (Oxford) 54) Essex County Resource Recovery Facility (Newark) 55) Union County Resource Recovery Facility (Rahway) 56) Wheelabrator Gloucester Company, L.P. (Westville) New York 57) Babylon Resource Recovery Facility (West Babylon) 58) Covanta Hempstead (Westbury) 59) Dutchess County Resource Recovery Facility (Poughkeepsie) 60) Huntington Resource Recovery Facility (East Northport) 61) MacArthur Waste-to-Energy Facility (Ronkonkoma) 62) Niagara Resource Recovery Facility (Niagara Falls) 63) Onondaga County Resource Recovery Facility (Jamesville) 64) Oswego County Energy Recovery Facility (Fulton) 65) Wheelabrator Hudson Falls L.L.C. (Hudson Falls) 66) Wheelabrator Westchester, L.P. (Peekskill) North Carolina 67) New Hanover County-WASTEC (Wilmington) Oklahoma 68) Walter B. Hall Resource Recovery Facility (Tulsa) Oregon 69) Marion County Solid Waste-to-Energy Facility (Brooks) Pennsylvania 70) Covanta Plymouth Renewable Energy (Conshohocken) 71) Delaware Valley Resource Recovery Facility (Chester) 72) Lancaster County Resource Recovery Facility (Bainbridge) 73) Susquehanna Resource Management Complex (Harrisburg) 74) Wheelabrator Falls Inc. (Morrisville) 75) York County Resource Recovery Center (York) Utah 76) Davis Energy Recovery Facility (Layton) Virginia 77) Alexandria/Arlington Resource Recovery Facility (Alexandria) 78) Hampton-NASA Steam Plant (Hampton) 79) Harrisonburg Resource Recovery Facility (Harrisonburg) 80) I-95 Energy/Resource Recovery Facility (Lorton) 81) Wheelabrator Portsmouth Inc. (Portsmouth) Washington 82) Wheelabrator Spokane Inc. (Spokane) Wisconsin 83) Barron County Waste-to-Energy & Recycling Facility (Almena) 84) Xcel Energy French Island Generating Station (LaCrosse) Italicized facilities represent inactive capacity. These facilities are not currently operating. 3
 Florida 11) Bay County Waste-to-Energy Facility (Panama City) 12) Hillsborough County Resource Recovery Facility (Tampa) 13) Lake County Resource Recovery Facility (Okahumpka) 14) Lee County")
4 Waste-to-Energy Capacity W aste-to-energy facilities produce clean, renewable energy through the thermal conversion of municipal solid waste. The most common energy products produced at these facilities are steam and electricity. There are 84 total facilities in the United States today, including 80 that are currently operating, and 4 that are currently inactive but may return to active service at a future date. One additional facility is under construction and will be placed in service in Many others are in various stages of development. Sixty-four facilities (76.2%) employ mass burn technology which allows MSW to be combusted without pre-processing. Thirteen facilities (15.5%) utilize refuse derived fuel (RDF) which is pre-processed municipal solid waste. Seven facilities (8.3%) utilize modular combustion units which are similar to mass burn, but are typically smaller and pre-fabricated. The 84 facilities produce a combination of energy products. Sixty-two facilities (73.8%) produce electricity for sale to the grid as the only energy product. Four facilities (4.8%) export steam without any electric generation. Eighteen facilities (21.4%) are cogeneration or combined heat and power facilities, which export steam to end users and also have the ability to generate power. The daily throughput capacity of the nation s waste-to-energy facilities in 2014 is 96,249 tons of MSW per day. The gross electric generating capacity of these facilities is 2,554 megawatts. When the energy value of the exported steam is factored in and expressed in megawatts, the nation s 84 facilities have a equivalent generating capacity of 2,769 megawatts. Status of WTE Facilities in the U.S. Operating Facilities 80 Inactive Facilities 4 Total Facilities in the U.S. 84 Facilities Under Construction 1 WTE Facilities in the U.S. (by Technology) 64 Refuse Derived Fuel (RDF) 13 Modular 7 WTE Facilities in the U.S. (by Energy) Electricity Generation 62 Steam Export 4 Combined Heat & Power 18 WTE Capacity Daily Throughput (tpd) 96,249 Gross Electric Capacity (MW) 2,554 Equivalent CHP Capacity (MW) 2,769 4

5 Waste-to-Energy Production C apacity represents potential and production is that potential realized. Waste-to-energy operators are extremely proud of their ability to process waste and generated energy 24 hours per day, seven days per week, all year long. Their technological and operational expertise allow facilities to achieve high availability so they may provide baseload electricity to the grid and steam to their customers. While the primary purpose of a waste-to-energy facility is to manage municipal solid waste, energy production is a valuable part of the equation in order to maximize energy efficiency, environmental benefits, greenhouse gas mitigation, and economic revenue. The graph below illustrates that waste-to-energy facilities are extremely stable and reliable. In 2012, the waste-to-energy sector processed more than 30.2 million tons of waste and generated over 14.5 million megawatt hours (or 14.5 billion kilowatt hours) of net electrical generation. This is the amount of electricity sold to the grid and does not include electricity that was used internally to operate the facility. In addition to the amount of net electrical generation, 22 facilities export steam to local users. This energy is used for heating and cooling or for use in industrial processes and displaces the use of fossil fuels to make that energy. WTE Production 2012 MSW Throughput (tons) 30,211, Net Elec. Generation (MWh) 14,565,467 These incredibly reliable facilities have operated in this capacity for decades. This is a testament to maturity and reliability of the technology. While some units eventually close, and some new units have been added, waste-to-energy facilities have a proven track record of operational availability, reliability. Challenging market conditions in the energy and waste markets have served as an impediment to constructing more facilities and recovering energy from more of the 250 million tons of post-recycled waste that is sent to landfills each year. (data in 000s) 5

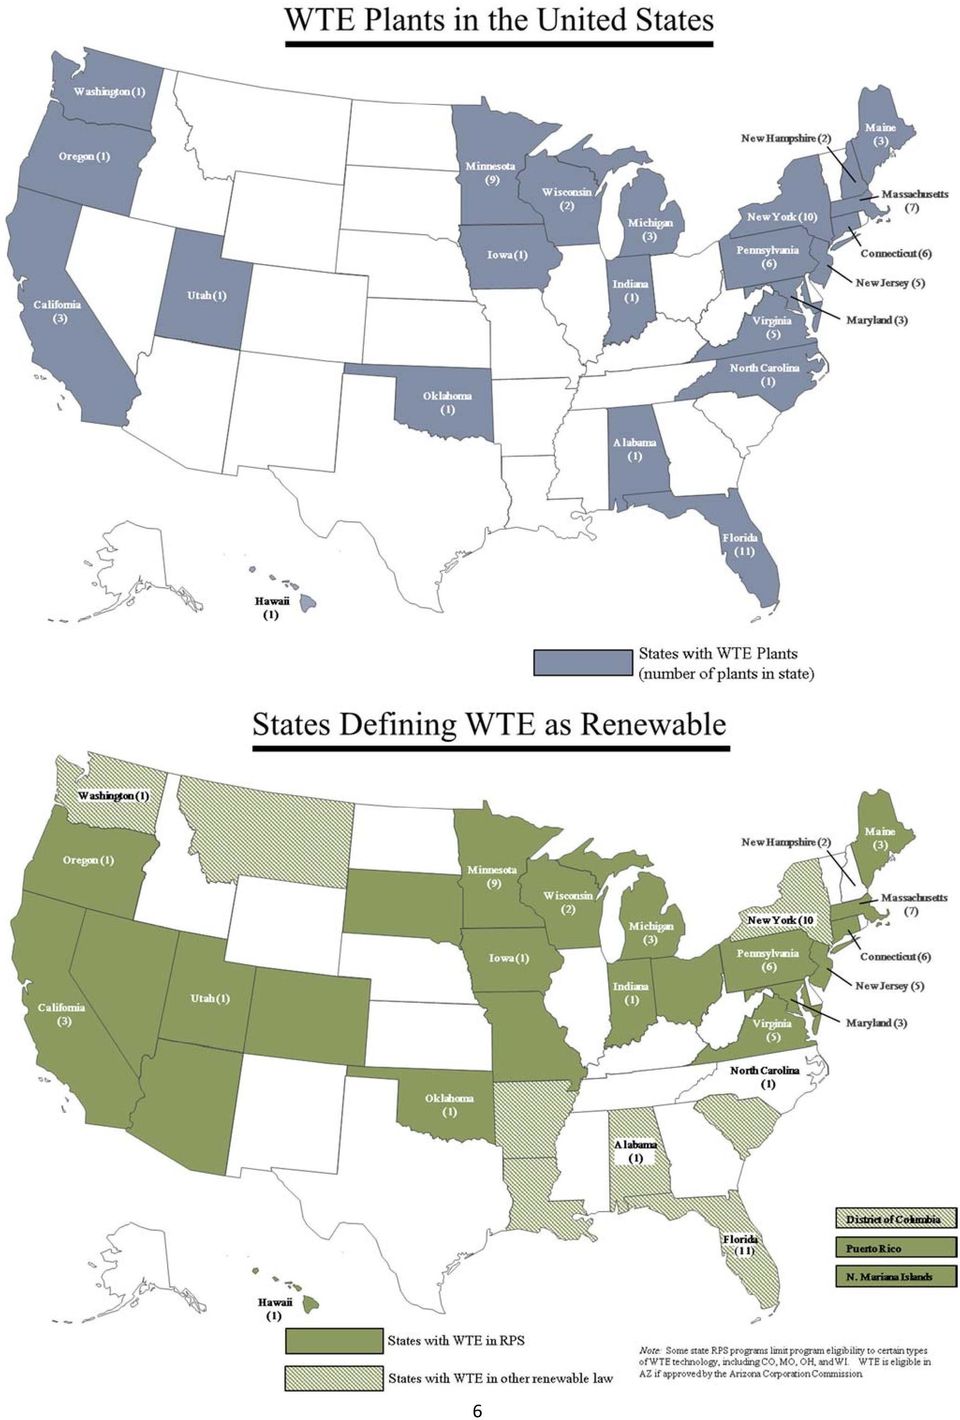
6 6
7 Waste-to-Energy Reduces Greenhouse Gas Emissions A ccording to U.S. EPA, life cycle emission analysis show that waste-to-energy (WTE) facilities actually reduce the amount of greenhouse gases expressed as CO2 equivalents (GHGs or CO2e) in the atmosphere by approximately 1 ton for every ton of municipal solid waste (MSW) combusted. ( U.S. EPA scientists, in a prominent peer reviewed paper, concluded WTE facilities reduce GHG emissions relative to even those landfills equipped with energy recovery systems. In addition, many other governmental and nongovernmental organizations have formally recognized WTE for its role in reducing world-wide GHG emissions including the: Intergovernmental Panel on Climate Change ( IPCC ) called WTE a key GHG mitigation technology, World Economic Forum (WEF) which identified WTE as one of eight renewable energy sources expected to make a significant contribution to a future low carbon energy system, European Union,, U.S. Conference of Mayors, which adopted a resolution in 2005 endorsing the U.S. Mayors Climate Protection Agreement, which identifies WTE as a clean, alternative energy source which can help reduce GHG emissions. As of January 1, 2014, 1,060 mayors have signed the agreement. Clean Development Mechanism of the Kyoto Protocol, Voluntary carbon markets, and Center for American Progress. Lifecycle Assessment of WTE GHG Reductions WTE GHG reductions are quantified using a life cycle assessment (LCA) approach that includes GHG reductions from avoided methane emissions from landfills, WTE electrical generation that offsets or displaces fossil -fuel based electrical generation, and the recovery of metals for recycling. The GHG reductions associated with these three factors more than offset WTE fossil-based CO2 emissions from combustion of plastics and other fossil fuel based MSW components. Using national averages as inputs, a LCA results in an approximate one ton reduction in GHG emissions for every ton of MSW combusted as was estimated by the U.S. EPA. 7
 combusted. (http:// www.epa.gov/wastes/nonhaz/municipal/wte/airem.htm#7) U.S.")
8 Waste-to-Energy is a Renewable Resource W aste-to-energy (WTE) meets the two basic criteria for establishing what a renewable energy resource is its fuel source (trash) is sustainable and indigenous. Waste-to-energy facilities recover valuable energy from trash after efforts to reduce, reuse, and recycle have been implemented by households and local governments. Waste-to-energy facilities generate clean renewable energy and deserve the same treatment as anyother renewable energy resource. Federal Statutes and Policies Establishing WTE Trash Would Otherwise go to a Landfill. Wasteto-energy facilities use no fuel sources other than as Renewable (as of 12/31/13) American Taxpayer Relief Act of 2012 the waste that would otherwise be sent to landfills. State Renewable Statutes Already Include WTE. 31 states, the District of Columbia, and two territories have defined waste-to-energy as renewable energy in various state statutes and regulations, including renewable portfolio standards. Communities with WTE Have Higher Recycling Rates. Studies have demonstrated that average recycling rate of communities served by waste-toenergy is higher than the national average. WTE Emissions Comply with EPA s Most Stringent Standards. All waste-to-energy facilities comply with EPA s Maximum Achievable Control Technology (MACT) standards. After analyzing the inventory of waste-to-energy emissions, EPA concluded that waste-to-energy facilities produce electricity with less environmental impact than almost any other source of electricity. American Recovery and Reinvestment Act of 2009 Emergency Economic Stabiliza on Act of 2008 Tax Relief and Healthcare Act of 2006 Energy Policy Act of 2005 American Jobs Crea on Act of 2004 Biomass Research and Development Act of 2000 Public U lity Regulatory Policies Act (PURPA) of 1978 Federal Power Act Pacific Northwest Power Planning and Conserva on Act Internal Revenue Code (Sec on 45) Execu ve Orders 13123, 13423, and Presiden al Memorandum on Federal Leadership on Energy Management (12/5/13) Federal Energy Regulatory Commissions Regula ons (18 CFR.Ch. I, 4/96 Edi on, Sec ) WTE Has a Long History as Renewable. Wasteto-energy has been recognized as renewable by the federal government for nearly thirty years under a variety of statutes, regulations, and policies. Many state have recognized as renewable under state statutes as well. The renewable status has enabled waste-to-energy plants to sell credits in renewable energy trading markets, as well as to the federal government through competitive bidding processes. Renewable Designations Benefit Many Local Governments and Residents. The sale of renewable energy credits creates revenue for local governments that own waste-to-energy facilities, helping to reduce a community s cost of processing waste. The U.S. Conference of Mayors has adopted several resolutions supporting wasteto-energy as a renewable resource. States Defining Waste to Energy as Renewable in State Law (as of 12/31/13) Alabama Maine Oklahoma Arizona Maryland Oregon Arkansas Massachuse s Pennsylvania California Michigan Puerto Rico Colorado Minnesota South Carolina Connec cut Missouri South Dakota Dist. of Columbia Montana Utah Florida Nevada Virginia Hawaii New Jersey Washington Indiana New York Wisconsin Iowa Louisiana N. Mariana Islands Ohio 8

9 Nationwide Economic Benefits of the Waste-to-Energy Sector By Eileen Brettler Berenyi, PhD, Governmental Advisory Associates, Inc. Summary The WTE sector creates $5.6 billion of gross economic sales output, encompassing nearly 14,000 jobs and nearly $890 million of total labor compensation. 5,350 employees servicing 85 plants in the United States earning $459 million in wages, salaries and benefits 8,557 additional full time equivalent jobs created in the U.S. sector outside the WTE sector, earning an additional $429 million in wages, salaries and benefits T he WTE sector serves three main functions: 1) managing post-recycled waste; 2) recycling post-consumer metals; and 3) producing energy. The revenues, employment, and labor earnings derived from these activities are the direct economic benefits of waste-to -energy. In addition, these activities generate indirect impacts as well as induced impacts. These impacts were calculated using multipliers from the U.S. Bureau of Economic Analysis RIMS II Handbook. Total Gross Sales Output Total gross sales numbers were used to approximate the economic output of the sector. Gross sales of the industry encompass revenues generated from: 1) tip fees amounts paid to the WTE plant to dispose of refuse; 2) energy sales revenues; 3) recycling sales revenues. Total output (sales revenues) was $3.2 billion. The total national economic impact of these revenues is $5.6 billion, including the initial $3.2 billion produced by the waste-to-energy sector directly. Every dollar of revenue generated by the waste-to-energy industry puts a total of 1.77 dollars into the economy through intermediate purchases of goods and services and payments to employees. the several regional and national firms that own and operate waste-to-energy facilities and local government personnel dedicated to plant oversight and maintenance. The WTE sector also creates an additional 8,600 jobs outside of the sector. Employees at waste-to-energy plants are technically skilled and are compensated at a relatively high average wage. For the purposes of this study a national average salary of $85,700 (inclusive of fringe benefits) was used. Employees in the waste-to-energy industry receive about $460 million in annual salary and benefits. The effect of this direct spending on employee compensation generated another $429 million of compensation for workers across various associated industries. Conclusion The waste-to-energy sector provides significant economic value in the communities in which these facilities operate. In addition to the revenues generated by the sector, waste-to-energy facilities provide stable, long-term, well-paying jobs, while simultaneously pumping dollars into local economies through the purchase of local goods and services and the payment of fees and taxes. In addition to the opportunities to provide baseload renewable electric generation, recover metals for recycling, and reduce greenhouse gas emissions, these facilities significantly contribute to the green economy in the communities in which they operate. Employment and Wage Earnings The waste-to-energy industry employs about 5,350 people nationwide. This number includes all workers at 85 specific sites, as well as off-site employees of 9

10 Placeholder for Walt Stevenson Emissions memo 10

11 11

12 Update of Findings from Public Health and Environmental Studies of Waste-to-Energy Technologies By Sarah Foster and Paul Chrostowski, Ph.D. CPF Associates, Inc. A large amount of information about the potential public health and environmental impacts of waste-to-energy (WTE) plants has become available since 2000, when the U.S. National Research Council (NRC) published its seminal report, Waste Incineration & Public Health. This information includes four different types of studies that can be used to evaluate WTE plants: risk assessments, epidemiological studies, environmental monitoring studies, and biomonitoring studies. Together, the current database of these studies supports the conclusions of the NRC that modern WTE facilities, designed and operated in accordance with current regulations in North America and the EU, do not adversely impact human health or the environment. In the U.S., human health risk assessments (HHRAs) are highly standardized and widely-accepted procedures for evaluating the probability and nature of health effects associated with existing or proposed emissions. The results of these studies, which address both cancer and non-cancer health effects, are usually compared to benchmark levels developed by regulatory agencies to be protective of public health. Ten HHRAs have been conducted in the past decade for North American WTE facilities. These studies show that emissions from modern WTE plants can meet health-based benchmarks and that adverse public health impacts are not anticipated from exposure to emissions from these facilities. Environmental monitoring studies rely on measurements of chemicals potentially associated with WTE in the surrounding natural environment to assess potential impacts. The most recent comprehensive review of environmental monitoring studies was conducted in 2009 as part of the Durham/York WTE project. This review evaluated 50 environmental monitoring studies published from and concluded that modern WTE plants are unlikely to impact the surrounding environment, although some old plants with high emissions and poor air pollution controls may have impacted the environment immediately surrounding the facility. The Durham/York study also concluded that environmental monitoring in the vicinity of a modern WTE plant is not justified based on the negligible potential for environmental impacts and because continuous and periodic emissions monitoring required under current regulations can ensure protection against health and environmental impacts. An extensive environ- 12

13 Update of Findings from Public Health and Environmental Studies of Waste-to-Energy Technologies (con t) Modern WTE facilities, designed and operated in accordance with current regulations in North America and the EU, do not adversely impact human health or the environment. mental monitoring program conducted for a WTE plant, at the Montgomery County, Maryland facility, confirms these conclusions. This 14-year environmental monitoring program involved collection of samples from a wide variety of environmental media before and many times after the plant began operating in The data provide no indication that facility operation has measurably impacted the environment. Epidemiologic studies investigate how health problems are distributed in groups of people and what factors contribute to these health problems. Essentially, these studies try to determine if there is a difference in disease between people potentially exposed to WTE emissions compared to the general population or those not exposed. These studies must in all cases be evaluated cautiously they can indicate whether there is a statistical association between exposure and disease, but they cannot indicate whether a specific facility is the cause of reported results. Many factors must be considered before one can leap from association to causation. Numerous epidemiologic studies have been conducted for combustion facilities over the past two decades but most of these have examined old facilities, plants accepting mixtures of different types of waste, or mixtures of WTE plants plus other types of sources. In general, these studies fail to present conclusive evidence of a link between WTE emissions and human illness. Biomonitoring studies analyze human tissues or excreta for evidence of exposure to chemical substances. These studies can measure internal exposure to compounds, but they do not necessarily indicate whether there may be a health effect. They also reflect total exposure to a person, so do not provide information about the possible sources of exposure. The 2009 study conducted as part of the Durham/ York project evaluated 25 biomonitoring studies from and found no correlation between WTE emissions and those measured in biomonitoring studies. A more recent study of a new WTE plant built in 2005 in Spain shows no increase in dioxin-like compounds or heavy metals among people living near the plant. In summary, available studies show that modern WTE facilities, designed and operated in accordance with North American or EU regulations, do not adversely impact human health or the environment. A weight of evidence approach can be used to evaluate WTE using different types of studies, but the usefulness of each study type can vary depending on the project needs. 13

14 Waste-to-Energy, an Essential Part of Sustainable Materials Management By Rick Brandes and Eileen Brettler Berenyi, Ph.D C ritics of the use of waste-toenergy (WTE) as an integral component of municipal solid waste (MSW) management in the U.S., the European Union, and Asia often focus on its impact on recycling rates, its cost, and its effect on other renewable energy sources. The problem with these arguments is that they are predicated on the belief that the municipal solid waste stream can be handled by recycling alone. History shows this is not a practical solution. A waste management strategy that combines all tools available to manage this waste is needed. Proponents take the position that WTE provides an essential service to municipalities that must constantly manage those materials that are not, or cannot, be recycled or recovered. WTE's primary purpose, therefore, is to capture from materials value that would otherwise be lost if buried. Pitting recycling against energy recovery draws public focus away from the real issue: what to do with the more than 260 million tons of waste this country sends to landfills each and every year. WTE as Part of Sustainable Materials Management Integrated materials management following the reduce, reuse, recycle, compost and energy recovery hierarchy is proven to work and is embraced by most developed countries. Energy recovery from waste is a key component to achieve MSW diversion and carbon reduction goals. The hierarchy is generally meant to convey preferred waste management priorities, with source reduction and direct reuse as the most desired actions by communities, and land disposal without treatment as the least desired. Overall, the hierarchy recognizes the degree of positive environmental and social benefit of the available waste management options and helps communities integrate them in a cohesive strategy that meets the needs of the communities themselves. MSW is a valuable energy resource Under any practical definition, energy recovered from MSW is renewable energy and should be legally defined as such by policymakers seeking to establish and maintain renewable energy portfolios. In a fundamental and realistic sense, MSW is constantly available and continuously replenished the very definition of the basic concept of "renewable energy." Post-consumer, post-recycled municipal waste is, and will be in the foreseeable future, generated in huge volumes. Post-recycled waste will not go away by idealistically visualizing a society where no waste is created. Forty years of intense focus on recycling and source reduction have succeeded in raising recycling rates but those efforts have not eliminated the generation of MSW. With the waste that is left over after efforts to reduce, reuse, and recycling, sustainable and valuable opportunities to manage this material must be found. WTE facilities can create that value by extracting 14

15 Waste-to-Energy, an Essential Part of Sustainable Materials Management (con t) extracting 500 to 700 kilowatt hours of power for each ton of waste they process. By contrast, landfills can only capture about 100 kilowatt hours per ton by burning the methane captured. Additionally, WTE facilities provide continuously available baseload power at the local level, augmenting intermittent renewable energy sources, such as wind and solar. Recovering energy from MSW has a very desirable carbon emissions impact because the positive carbon balance of WTE is significant. EPA's models for calculating GHG emissions reductions from the various MSW management techniques show that on average one ton of carbon equivalents can be avoided per ton of MSW processed by WTE facilities. The carbon emissions savings accrue from a combination of energy offsets from the displacement of fossil electricity, GHG benefits of metals recovery from waste-toenergy ash, and avoiding methane generation from landfills. various materials flowing through a consumer society, each to be managed in such a way as to recover the highest value possible. In this paradigm, waste-to -energy has a central role to play along with recycling. Consistent with the waste management hierarchy, this approach embodies the core principles of sustainable materials management and should be incentivized in renewable and clean energy standards, greenhouse gas programs, and other progressive policies. Rick Brandes is former chief of the Energy Recovery and Waste Disposal Branch, Office of Resource Conservation and Recovery, of the U.S. Environmental Protection Agency. Eileen Berenyi, Ph.D is President of Governmental Advisory Associates. Conclusion Waste management in the United States is evolving from a focus solely on the disposal of waste inexpensively to a focus on solid waste as a composite of 15

16 A Compatibility Study: Recycling and Waste-to-Energy Work in Concert, 2014 Update By Eileen Brettler Berenyi, Ph.D Executive Summary This study updates similar analyses conducted in 2008 and Their purpose was to answer the question: Does a community s use of a waste-to-energy plant to dispose of its waste impact the level of recycling in that community. The 2008 study answered that question with a resounding no. The means of disposal had no impact on the level of recycling; in fact, many communities which sent their waste to a waste-toenergy plant had higher levels of recycling than averages that prevailed across their state. This current paper, updates the study, using 2012 data as much as possible. In an examination of recycling rates of 700 communities in twenty-one states, which rely on waste -to-energy for their waste disposal, it was again demonstrated that this means of disposal had no impact on recycling. In fact, overall communities using waste-to-energy had a slightly higher level of recycling than that observed across their states and across the nation. Key Findings: The study covers 80 waste-to-energy facilities in 21 states serving about 30% of the population of those states. Recycling data was obtained from 700 local governments, including 601 cities, towns and villages and 98 counties, authorities or districts In addition, statewide data was obtained for each of the 21 states. The population of these states comprises about 56% of the U.S. population. As reported by the U.S. EPA the national recycling rate as of 2011 was 34.7%. The recycling rate for communities, using WTE plants is at 35.4%. Interestingly, the average recycling rate for the 21 states surveyed is 34.9%. Figure ES-1 below shows these rates graphically. Only tenths of a percent separate the three averages, indicating that waste-to-energy as a disposal method has no impact on the level of recycling in a community or a state. 16

17 A Compatibility Study: Recycling and Waste-to-Energy Work in Concert, 2014 Update By Eileen Brettler Berenyi, Ph.D All communities using waste-toenergy provide their residents an opportunity to recycle and most have curbside collection of recyclables. In fact, some of these communities are leaders in the adoption of innovative recycling programs, such as single stream collection and food waste collection and composting. The coincident nature of recycling programs and waste-to-energy in each community is evidence that these two waste management strategies easily exist side by side. They often complement each other, in that a waste-toenergy plant is often the largest recycler of post-consumer metal in the state. In most cases, recycling rates in waste-to-energy communities closely track the statewide recycling rate in the state where they are located as shown in Figure ES-2. State solid waste policies and programs, not whether a community relies on waste-toenergy as a disposal option, are a key influence on local recycling behaviors and rates. In conjunction with the graph above, Table ES-1 below indicates how individual community recycling rates mirror the overall state rate. In 16 of the 21 states which rely on waste-toenergy facilities, individual communities using these facilities have a slightly higher recycling rate than the overall state average. In total, rates have risen since 2009, with additional communities adopting single stream curbside recycling and more communities moving to curbside organics collection. The author is the president of Governmental Advisory Associates, Inc. in Westport, CT. The 2014 Update of this report builds upon reports she published on this topic in 2008 and WTE Supports High Quality Jobs The waste-to-energy sector provides significant economic value in the communities in which these facilities operate. In addition to the revenues generated by the sector, wasteto-energy facilities provide stable, long-term, well-paying jobs, while simultaneously pumping dollars into local economies through the purchase of local goods and services and the payment of fees and taxes. In addition to the opportunities to provide baseload renewable electric generation, recover metals for recycling, and reduce greenhouse gas emissions, these facilities significantly contribute to the green economy in the communities in which they operate. 17

18 The Global Waste-to-Energy Research and Technology Council ( By Prof. Nickolas J. Themelis, Director of Earth Engineering Center of Columbia University (EEC) S tarting in 1995, the Earth Engineering Center (EEC) of Columbia University has researched various aspects of existing and novel technologies for the recovery of materials and energy from wastes" and disseminated the results of these studies by means of publications, presentations and the web. The guiding principle of EEC research is that wastes are resources and must be managed on the basis of science and best available technology and not on ideology or economics that exclude environmental costs. The general principles of sustainable waste management are illustrated in the EEC Hierarchy of Waste Management (Figure 1). The EEC resources are its Research Associates and the graduate students who pursue degrees on sustainable waste management. One of the EEC activities is the periodic Survey of Waste Management in the U.S. The 2013 Survey was just completed and showed (see Table below) that landfilling remains at about 64% (247 million short tons) of the total U.S. MSW. In contrast, several nations, including Austria, Denmark, Germany, Japan, Netherlands, and Singapore have practically eliminated landfilling by a combination of recycling/composting and waste-to-energy (WTE). It is interesting to note that some U.S. states, e.g. Connecticut, are much more advanced with regard to managing their MSW. The main reason that the U.S. lags behind other developed nations is that there is no government policy on integrated waste management. In recognition of the fact that there was not enough academic research and training on sustainable waste management, in 2003 EEC co-founded, with the Energy Recovery Council of the U.S., the Waste-to-Energy Research and Technology Council. WTERT brings together scientists, engineers, and managers concerned with advancing sustainable waste management in the U.S. and worldwide. During the first ten years of its existence, WTERT has sponsored many academic research studies and published over one hundred papers on all means of waste management, including waste reduction, recycling, aerobic and anaerobic composting, waste-to-energy, and landfill gas recovery. By now WTERT has sister organizations in Brazil, Canada, China, France, Germany, Greece, India, Italy, Japan, Mexico, Singapore, South Korea, and the U.K. All these organizations are part of the Global WTERT Council (GWC). Information to the Public on Sustainable Waste Management Each year, WTERT-U.S. and its sister organizations receive many requests for information on WTE and waste management practice, in general. The principal means of communication between WTERT and the general public are the various national web pages that, worldwide, continue to be the premier source of up-to-date information on advances in managing wastes. Also, in , GWC contributed chapters to three books and half a volume to the Encyclopedia of Sustainability Science and Technology (Springer). In 2013, EEC published the WTE Guidebook for Latin America and the Caribbean, under the sponsorship of the InterAmerican Development Bank. Figure 1. The EEC hierarchy of waste management Percent Recycled Disposition of U.S. MSW in 2011 (2013 EEC National Survey) Percent Composted Percent Combusted Percent Landfilled

19 Disposition of MSW in U.S. States (EEC study, 2013) 19

20 Waste Feedstocks Track Population Density Waste is everywhere. With almost 250 million tons of waste landfilled each year, opportunities to recover valuable energy and materials from waste abound. The average American generates nearly 7 pounds of waste per day. Therefore, population density is an excellent indicator of where waste feedstocks are concentrated. 20

21 Disposition of MSW in various countries (EEC study, 2013) 21
22 WTE in Corporate Sustainability Efforts C ompanies in the United States and around the world have identified zero waste practices as a sound management practice in pursuit of sustainability, environmental achievement, and economic efficiency. Companies that have pledged to eliminate waste from landfills rely on waste-to-energy facilities for waste that cannot be recycled. Homogenous waste streams in industrial settings yield higher recycling rates than can be achieved on the residential curbside, but residual waste remains which must be managed in a waste-toenergy facility. The electricity that can be generated by a waste-to-energy facility is a feedstock in most industrial manufacturing settings, which allows the energy from the residual waste to be fed right back into the industrial process. We are proud of our role as stewards of the environment and of our progress in eliminating waste from our operations, said Terence O Day, Senior Vice President of Global Operations at The Hershey Company in 2013 as two more facilities achieved zero waste to landfill status. We achieved zero waste to landfill at these facilities through a rigorous process of eliminating waste, recycling and converting waste to energy. Our employees understand the importance of sustainability across our company and are working together to reach our reduction goals. General Motors GM is commi ed to waste reduc on throughout its opera ons. Currently, more than half of GM s manufacturing facili es are landfill free, bringing the total count to 85. On average, 97% of the waste generated from everyday manufacturing opera ons at these plants is recycled or reused, and 3% is converted to energy at waste to energy facili es. The Hershey Company The Hershey Company has six U.S. plants that no longer dispose rou ne waste into landfills. To achieve zero waste to landfill status, Hershey s manufacturing facili es have both reduced their overall waste streams and increased recycling rates to approximately 90 percent. All remaining waste is sent to nearby waste to energy plants, which also reduces overall reliance on fossil fuels. Proctor & Gamble Procter & Gamble announced in 2013 that 45 of their facili es have achieved zero manufacturing waste to landfill. Through quality assurance, packaging reduc on, compac on and recycling efforts, the company now ensures that 99% of all materials entering P&G plants leaves as finished product or is recycled, reused or converted to energy at waste to energy facili es. Subaru The Subaru of Indiana Automo ve (SIA) manufacturing plant in Lafaye e, Indiana, became the first auto manufacturing plant to achieve a zero landfill status. All of the plant s manufacturing waste goes is recycled and reused or sent to waste toenergy. SIA recycles 99.3 percent of its of excess steel, plas c, wood, paper, glass and other materials. The remaining 0.7 percent is shipped to the Indianapolis waste toenergy facility where it is converted to energy for the downtown steam loop. Toyota Toyota s target is to achieve near zero waste to landfill (measured annually as a 95% or greater reduc on in waste to landfill, averaged across our North American plants). Their zero landfill metric is driven by the Toyota Produc on System, where the elimina on of waste in all aspects of business is a main objec ve. For example, to avoid sending nonhazardous waste to a landfill, waste from our design centers in Michigan is sent to a waste to energy facility. Unilever In 2013, Unilever United States and Canada announced that all 26 of its manufacturing and non manufacturing headquarter facili es are now zero waste to landfill (ZLF). The key driver for this achievement in both North America manufacturing and non manufacturing headquarter facili es is the elimina on of waste. Where reduc on of waste is not sufficient, the company s facili es reuse, recycle, or recover energy from waste to reach zero waste to landfill. 22
23 Materials and Energy Recovery (EEC study, 2013) 23
24 Workplace Health & Safety A Waste-to-Energy Priority T he Occupational Safety & Health Administration (OSHA) sets standards for America s workers to ensure employees are safe and their health is protected. Waste-to-energy facilities, like all other workplaces, must meet these tough standards. However, waste-to-energy facilities takes tremendous pride in their health and safety programs, which often goes beyond what is required by law. Great importance is placed on developing and implementing successful programs that protect the people working in the plants. OSHA has recognized the stellar accomplishments of 48 waste-toenergy facilities with the designation of STAR status under the Voluntary Protection Program (VPP). status is the highest honor given to worksites with comprehensive, successful safety and health management systems. STAR sites are committed to effective employee protection beyond the requirements of federal standards and participants develop and implement systems to effectively identify, evaluate, prevent, and control occupational hazards to prevent injuries and illnesses. The keys to health and safety success under VPP are the employee engagement and ongoing involvement in onsite health and safety program development combined with longterm commitment and support from management. VPP-level recipients routinely incur injury and illness rates that are at or below the state average for their specific industry. Impressively, 48 of the 84 waste-to-energy facilities have earned status. Less than 0.02 percent of all worksites in the United States are enrolled in VPP, yet more than 57 percent of U.S. waste-to-energy facilities are have achieved STAR status. This illustrates the commitment of this sector is superior attention to health and safety. SAFETY: DO IT FOR LIFE Created under an ERC-OSHA Alliance Agreement, ERC and its members have celebrated Hauler Safety Day at their facilities to educate public and private waste haulers, municipal and private owners and operators, and facility employees about best health & safety practices to ensure a safe and healthy workplace. ERC member companies have coordinated the event by developing and utilizing a unified campaign with posters, stickers and 12 Rule cards to get the message out regarding health and safety on waste-to-energy tipping floors. Our goal is to ensure that everyone who conducts business at or visits a waste-to-energy facility will return home safe and sound at the end of each and every day. 24
25 ERC Membership Waste-to-Energy Owners/Operators Covanta Wheelabrator Technologies Inc. 445 South Street 4 Liberty Lane West Morristown, NJ Hampton, NH (862) (800) Green Conversion Systems, LLC 411 Theodore Fremd Ave. Suite 102 Rye, NY (914) ERC Municipal Members Bristol (CT) Resource Recovery Facility Operating Cmte. City and County of Honolulu, HI City of Alexandria/Arlington County (VA) City of Ames (IA) Resource Recovery System City of Long Beach, CA City of Tampa, FL Connecticut Resource Recovery Authority County Sanitation Districts of Los Angeles County, CA Dade-Miami County, FL Delaware Solid Waste Authority ecomaine Fairfax County, VA Hennepin County (MN) Dept. of Environmental Services Kent County Department of Public Works Lancaster County (PA) Solid Waste Management Authority Lee County (FL) Solid Waste Division Northeast Maryland Waste Disposal Authority Olmsted County (MN) Onondaga County (NY) Resource Recovery Agency Pinellas County (FL) Utilities Pope-Douglas (MN) Solid Waste Management Prairie Lakes Municipal Solid Waste Authority (MN) Solid Waste Authority of Palm Beach County (FL) Southeastern CT Regional Resources Recovery Authority Spokane (WA) Regional Solid Waste System Town of Wallingford (CT) Virgin Islands Waste Management Authority Wasatch (UT) Integrated Waste Management District York County (PA) Solid Waste Authority ERC Associate Members C&I Boiler Repair, Inc. Dvirka & Bartilucci Consulting Engineers Energy Answers International Gershman, Brickner, and Bratton, Inc. Great River Energy Hawkins Delafield & Wood LLC HDR, Inc. Helfrich Brothers Boiler Works, Inc. Hitachi Zosen Inova USA INASHCO North America Inc. Jansen Combustion & Boiler Technologies, Inc. Martin GmbH Minnesota Resource Recovery Association Morris, Manning & Martin, LLP New England Mechanical Overlay PERC Holdings LLC Plasma Power LLC Plattco Corporation Powerhouse Technology, Inc. Ramboll Renewable Resource Consultants LLC Resource Recovery Technologies, LLC RRT Design & Construction Southern Recycling Valmet Inc. Zampell Refractories, Inc. 25
26 Waste-to-Energy Directory: Key Terms City: The city in which the facility is physically located. County: The county in which the facility is physically located. U.S. Congressional District: The U.S. congressional district in which the facility is physically located in the 113th Congress ( ). Owner: The current owner of the facility is listed. Whether the owner is a private or public entity is noted parenthetically. Operator: The current operator of the facility is listed. Whether the operator is a private or public entity is noted parenthetically. Project Startup: The actual year in which commercial operation began. Operating Status: Indicates whether the facility is operating, inactive, or under construction in Indicates whether the facility is mass burn, modular, or refuse derived fuel (RDF). Throughput Capacity (TPD): Expressed in tons per day, the throughput capacity is the aggregate trash capacity for all units located at a facility. No. of Boilers: The number of boilers (or units) in use at the facility. Gross Electric Capacity (MW): Expressed in gross megawatts, the nameplate capacity of the turbine generators located at the facility. This figure represents the largest amount of gross electrical output that can be achieved. Gross Steam Capacity (lbs/hr): The gross amount of steam that can be generated. For combined heat and power facilities, this amount represents the typical amount of steam exported expressed in pounds per hour, in addition to electric generation. Full-time Employees: The approximate number of fulltime employees that work at a facility. This number is an estimate and fluctuates over time. Serves Waste Needs of (People): Indicates the number of individuals that are served by the facility in the waste catchment area. Certifications: Indicates whether the facility has achieved STAR status under the U.S. Occupational Safety and Health Administration (OSHA) Voluntary Protection Program (VPP) or is ISO certified. State Based Information WTE Facilities: The number of facilities located in that state. Total Waste Capacity: The aggregate trash capacity of all facilities located in that state. Total Electric Capacity: The aggregate gross electric capacity of all facilities located in that state. Total Steam Capacity: The aggregate gross steam capacity typically exported (expressed in lbs/hr) of all facilities located in that state. Population in 2010: The population of the state as reported in the 2010 census by the U.S. Census Bureau. MSW Managed in 2011: The total amount of MSW processed at all facilities in the state in 2011, as reported by the 2013 Columbia University EEC Survey. % of MSW Managed by WTE in 2011: The percentage of the state s waste processed by WTE in 2011, as reported by the 2013 Columbia University EEC Survey. WTE as % of Non-Hydro Renewable Elec. Generation in 2012: WTE electricity, expressed as a percentage of all non-hydro renewable electricity, generated in that state in Energy Produced by WTE in a State is enough to power (#) homes: The figure is derived by expressing energy capacity (electric and steam) in megawatts and dividing it by EIA s estimate that each household uses 1.24 kilowatts of capacity per hour (10,837 kwh per year). Recycling Rate of WTE Communities: The aggregate recycling rate of all WTE communities in the state, as reported by Eileen Berenyi s 2014 Recycling compatibility report. Jobs at WTE Facilities: The aggregate FTE jobs at facilities in the state listed in the directory. Total Jobs (Direct, Indirect, & Induced) Created by WTE: The total number of direct, indirect, and induced jobs created by WTE in the state, as reported by Eileen Berenyi in the 2013 National WTE Economic report. Total Economic Output (Direct, Indirect & Induced) by WTE: The total number of direct,indirect and induced economic output created by WTE in the state, as reported by Eileen Berenyi in the 2013 National WTE Economic report. State Law Defining WTE as Renewable: Citation of a state law defining WTE as renewable. In some states, more than one reference to WTE as renewable may exist, but may not be listed here. 26
Connecticut s Insurance Industry: Economic Impacts & Contributions
 Connecticut s Insurance Industry: Economic Impacts & Contributions Prepared by: Connecticut Economic Resource Center, Inc. December 2006 2006 Insure Connecticut s Future, Connecticut Insurance and Financial
National Heavy Duty Truck Transportation Efficiency Macroeconomic Impact Analysis
 National Heavy Duty Truck Transportation Efficiency Macroeconomic Impact Analysis Prepared for the: Union of Concerned Scientists 2397 Shattuck Ave., Suite 203 Berkeley, CA 94704 Prepared by: Marshall
90-400 APPENDIX B. STATE AGENCY ADDRESSES FOR INTERSTATE UIB CLAIMS
 INTERSTATE UIB CLAIMS Alabama Multi- Unit (#01) Industrial Relations Bldg. Montgomery, AL 31604 Alaska Interstate Unit (#02) P.O. Box 3-7000 Juneau, AK 99801 Arizona Interstate Liable Office (#03) Department
Arecibo Resource Recovery Project
 Arecibo Resource Recovery Project Energy Answers International, Inc., through its subsidiary, Energy Answers Arecibo, LLC, is developing a 77 MW Resource Recovery Project to generate renewable energy and
2014 INCOME EARNED BY STATE INFORMATION
 BY STATE INFORMATION This information is being provided to assist in your 2014 tax preparations. The information is also mailed to applicable Columbia fund non-corporate shareholders with their year-end
2010 Allocations to States of Volume Cap for Qualified School Construction Bonds
 2010 Allocations to States of Volume Cap for Qualified School Construction Bonds Total Dollar Allocation by State/ State/Territory Territory Alabama 140,453,000 Alaska 28,163,000 Arizona 171,115,000 Arkansas
Centers of Excellence
 Centers of Excellence A program of the NMSDC to enhance corporate minority supplier development through knowledge sharing and excellence in implementing NMSDC best practices. Centers of Excellence enhances
Chemical Engineer Office of Resource Conservation and Recovery
 Waste-to to-energy in the U.S. and Trends for the Future Jesse Miller Chemical Engineer Office of Resource Conservation and Recovery Tuesday, August 9, 2011 1 Presentation Outline ORCR Atiiti Activities
VCF Program Statistics (Represents activity through the end of the day on June 30, 2015)
") VCF Program Statistics (Represents activity through the end of the day on June 30, 2015) As of June 30, 2015, the VCF has made 12,712 eligibility decisions, finding 11,770 claimants eligible for compensation.
VCF Program Statistics (Represents activity through the end of the day on June 30, 2015) As of June 30, 2015, the VCF has made 12,712 eligibility decisions, finding 11,770 claimants eligible for compensation.
Construction Initiative: Distribution of $24.8 Billion In Bonding Authority Initial Estimates for H.R. 4094
 Alabama Alaska Arizona Arkansas California SEA Allocation 208,207 Birmingham City 33,463 Mobile County 51,654 Montgomery County 21,960 QZABS 39,638 Total 354,922 SEA Allocation 47,418 Total 53,398 SEA
LPSC Renewable Energy Pilot y RFPs issued by Utility Companies by Order of Commission, November 2010
 Renewable Energy LPSC Renewable Energy Pilot y RFPs issued by Utility Companies by Order of Commission, November 2010 y Searching for various forms of renewable energy and their actual cost in Louisiana
Real Progress in Food Code Adoption
 Real Progress in Food Code Adoption The Association of Food and Drug Officials (AFDO), under contract to the Food and Drug Administration, is gathering data on the progress of FDA Food Code adoptions by
Licensure Resources by State
 Licensure Resources by State Alabama Alabama State Board of Social Work Examiners http://socialwork.alabama.gov/ Alaska Alaska Board of Social Work Examiners http://commerce.state.ak.us/dnn/cbpl/professionallicensing/socialworkexaminers.as
Alabama Commission of Higher Education P. O. Box 302000 Montgomery, AL. Alabama
 Alabama Alaska Arizona Arkansas California Colorado Connecticut Delaware Alabama Commission of Higher Education P. O. Box 302000 Montgomery, AL 36130-2000 (334) 242-1998 Fax: (334) 242-0268 Alaska Commission
2016 Individual Exchange Premiums updated November 4, 2015
 2016 Individual Exchange Premiums updated November 4, 2015 Within the document, you'll find insights across 50 states and DC with available findings (i.e., carrier participation, price leadership, gross
Masters of Science in Finance Online Degree Program Updated February 5, 2014.
 Masters of Science in Finance Online Degree Program Updated February 5, 2014. This document contains the following information related to Georgetown University s Master of Science in Finance Online Program:
State and Federal Individual Capital Gains Tax Rates: How High Could They Go?
 Special Report State and Federal Individual Capital Gains Tax Rates: How High Could They Go? A Special Report by the ACCF Center for Policy Research As the debate on federal tax reform continues, the ACCF
BUSINESS DEVELOPMENT OUTCOMES
 BUSINESS DEVELOPMENT OUTCOMES Small Business Ownership Description Total number of employer firms and self-employment in the state per 100 people in the labor force, 2003. Explanation Business ownership
The Economic Impact of Local Parks
 The Economic Impact of Local Parks An Examination of the Economic Impacts of Operations and Capital Spending on the United States Economy Executive Summary National Recreation and Park Assocation 1 Table
University of Massachusetts School of Law: Career Services Office State-By-State Online Job Search Resources
 University of Massachusetts School of Law: Career Services Office State-By-State Online Job Search Resources Alabama http://www.alabar.org - Alabama Bar Association http://www.judicial.state.al.us - Alabama
The Obama Administration and Community Health Centers
 The Obama Administration and Community Health Centers Community health centers are a critical source of health care for millions of Americans particularly those in underserved communities. Thanks primarily
2009-10 STATE AND LOCAL GOVERNMENT TAX AND REVENUE RANKINGS. By Jacek Cianciara
 2009-10 STATE AND LOCAL GOVERNMENT TAX AND REVENUE RANKINGS By Jacek Cianciara Wisconsin Department of Revenue Division of Research and Policy December 12, 2012 TABLE OF CONTENTS Key Findings 3 Introduction
Chex Systems, Inc. does not currently charge a fee to place, lift or remove a freeze; however, we reserve the right to apply the following fees:
 Chex Systems, Inc. does not currently charge a fee to place, lift or remove a freeze; however, we reserve the right to apply the following fees: Security Freeze Table AA, AP and AE Military addresses*
CHP & ENVIRONMENTAL COMMODITIES: MARKET & POLICY UPDATE FOR MONETIZING RENEWABLE ENERGY CREDITS FROM CHP PROJECTS. Thomas Jacobsen October 2012
 CHP & ENVIRONMENTAL COMMODITIES: MARKET & POLICY UPDATE FOR MONETIZING RENEWABLE ENERGY CREDITS FROM CHP PROJECTS Thomas Jacobsen October 2012 ELEMENT MARKETS US Emissions House of the Year Launched in
Three-Year Moving Averages by States % Home Internet Access
 Three-Year Moving Averages by States % Home Internet Access Alabama Alaska Arizona Arkansas California Colorado Connecticut Delaware Florida Georgia Hawaii Idaho Illinois Indiana Iowa Kansas Kentucky Louisiana
Hail-related claims under comprehensive coverage
 Bulletin Vol. 29, No. 3 : April 2012 Hail-related claims under comprehensive coverage Claims for hail damage more than doubled in 2011 compared with the previous three years. Hail claims are primarily
COMMERCIAL FINANCE ASSOCIATION. Annual Asset-Based Lending and Factoring Surveys, 2008
 COMMERCIAL FINANCE ASSOCIATION Annual Asset-Based Lending and Factoring Surveys, 2008 Non-Member Edition May 6, 2009 R.S. Carmichael & Co., Inc. Commercial Finance Association 70 West Red Oak Lane (4 th
Percent change. Rank Most expensive states Average expenditure Rank Least expensive states Average expenditure
 Page 1 of 7 Auto Insurance AAA s 2010 Your Driving Costs study found that the average cost to own and operate a sedan rose by 4.8 percent to $8,487 per year, compared with the previous year. Rising fuel,
INTRODUCTION. Figure 1. Contributions by Source and Year: 2012 2014 (Billions of dollars)
") Annual Survey of Public Pensions: State- and Locally- Administered Defined Benefit Data Summary Report: Economy-Wide Statistics Division Briefs: Public Sector By Phillip Vidal Released July 2015 G14-ASPP-SL
Annual Survey of Public Pensions: State- and Locally- Administered Defined Benefit Data Summary Report: Economy-Wide Statistics Division Briefs: Public Sector By Phillip Vidal Released July 2015 G14-ASPP-SL
Public School Teacher Experience Distribution. Public School Teacher Experience Distribution
 Public School Teacher Experience Distribution Lower Quartile Median Upper Quartile Mode Alabama Percent of Teachers FY Public School Teacher Experience Distribution Lower Quartile Median Upper Quartile
PUBLIC HOUSING AUTHORITY COMPENSATION
 PUBLIC HOUSING AUTHORITY COMPENSATION Background After concerns were raised about the level of compensation being paid to some public housing authority (PHA) leaders, in August 2011 HUD reached out to
recovery: Projections of Jobs and Education Requirements Through 2020 June 2013
 recovery: Projections of Jobs and Requirements Through June 2013 Projections of Jobs and Requirements Through This report projects education requirements linked to forecasted job growth by state and the
http://agnis/sites/amsissuances/shared%20documents/282.7.htm
 Page 1 of 5 Directive Status List of Attachments Abatement of Air and Water Pollution at Federal Facilities I PURPOSE This Instruction sets forth policy and responsibilities in the Agricultural Marketing
Annual Survey of Public Employment & Payroll Summary Report: 2013
 Annual Survey of Public Employment & Payroll Summary Report: 2013 Economy-Wide Statistics Briefs: Public Sector by Robert Jesse Willhide Released December 19, 2014 G13-ASPEP INTRODUCTION This report is
ANTHONY P. CARNEVALE NICOLE SMITH JEFF STROHL
 State-Level Analysis HELP WANTED PROJECTIONS of JOBS and EDUCATION REQUIREMENTS Through 2018 JUNE 2010 ANTHONY P. CARNEVALE NICOLE SMITH JEFF STROHL Contents 1 Introduction 3 U.S. Maps: Educational concentrations
MainStay Funds Income Tax Information Notice
 The information contained in this brochure is being furnished to shareholders of the MainStay Funds for informational purposes only. Please consult your own tax advisor, who will be most familiar with
The Economic Impact of Local Parks
 The Economic Impact of Local Parks An Examination of the Economic Impacts of Operations and Capital Spending on the United States Economy Executive Summary National Recreation and Park Association 1 Table
APPENDIX 6-A. DETAILED DATA FOR EQUIPMENT PRICE MARKUPS TABLE OF CONTENTS
 APPENDIX 6-A. DETAILED DATA FOR EQUIPMENT PRICE MARKUPS TABLE OF CONTENTS 6-A.1 6-A.2 6-A.3 6-A.4 6-A.5 6-A.6 DETAILED WHOLESALER COST DATA... 6-A-1 DETAILED MECHANICAL CONTRACTOR DATA... 6-A-2 DETAILED
Eileen B. Berenyi, Ph.D.
 GOVERNMENTAL ADVISORY ASSOCIATES, INC. 599 RIVERSIDE AVE. SUITE #1 WESTPORT, CT 06880 203-226-3238 (PHONE) 203-226-3239 (FAX) gaa@connix.com Eileen B. Berenyi, Ph.D. EDUCATION: Columbia University, Ph.D.
ENERGY COST INDEX 2012: RANKING THE STATES
 ENERGY COST INDEX 2012: RANKING THE STATES Raymond J. Keating Chief Economist Small Business & Entrepreneurship Council June 2012 Protecting small business, promoting entrepreneurship www.sbecouncil.org
Cancellation of Debt (COD) R. Bruce McCommons Harford County, MD TrC 12/4/2013 rbrucemcc@comcast.net
 R. Bruce McCommons Harford County, MD TrC 12/4/2013 rbrucemcc@comcast.net") Cancellation of Debt (COD) R. Bruce McCommons Harford County, MD TrC 12/4/2013 rbrucemcc@comcast.net 1 Cancellation of debt (COD)... Generally, if a debt for which the taxpayer was personally responsible
Cancellation of Debt (COD) R. Bruce McCommons Harford County, MD TrC 12/4/2013 rbrucemcc@comcast.net 1 Cancellation of debt (COD)... Generally, if a debt for which the taxpayer was personally responsible
WWW.IMMIGRANTJUSTICE.ORG/KIDS
 On the following pages you will find addresses for: Dept. of Justice Immigration Courts AND Dept. of Homeland Security Offices of Chief Counsel (OCC) DISCLAIMER: The most current addresses for DOJ Immigration
Pollution Report Card
 Pollution Report Card Grading America s School Bus Fleets PATRICIA MONAHAN UNION OF CONCERNED SCIENTISTS February 2002 Pollution Report Card 1 Executive Summary Every day, parents watch the trusted yellow
List of State Residual Insurance Market Entities and State Workers Compensation Funds
 List of State Residual Insurance Market Entities and State Workers Compensation Funds On November 26, 2002, President Bush signed into law the Terrorism Risk Insurance Act of 2002 (Public Law 107-297,
Thank you for being here today
 Thank you for being here today Presenter: Rob Smoot, a senior engineer for the Solid Waste division of Parks and Environmental Services here at Metro, a licensed Chemical Engineer with over 27 years working
Next 10 is an independent nonpartisan organization that educates, engages and empowers Californians to improve the state s future.
 ISSUE BRIEF SEPTEMBER 3, 2015 Next 10 is an independent nonpartisan organization that educates, engages and empowers Californians to improve the state s future. Next 10 is focused on innovation and the
SEATTLE STEAM COMPANY FREQUENTLY ASKED QUESTIONS
 SEATTLE STEAM COMPANY FREQUENTLY ASKED QUESTIONS What products/services does Seattle Steam provide? The company provides thermal energy (heat) produced at two central heating plants in downtown Seattle.
(In effect as of January 1, 2004*) TABLE 5a. MEDICAL BENEFITS PROVIDED BY WORKERS' COMPENSATION STATUTES FECA LHWCA
 TABLE 5a. MEDICAL BENEFITS PROVIDED BY WORKERS' COMPENSATION STATUTES FECA LHWCA") (In effect as of January 1, 2004*) TABLE 5a. MEDICAL BENEFITS PROVIDED BY WORKERS' COMPENSATION STATUTES Full Medical Benefits** Alabama Indiana Nebraska South Carolina Alaska Iowa Nevada South Dakota
(In effect as of January 1, 2004*) TABLE 5a. MEDICAL BENEFITS PROVIDED BY WORKERS' COMPENSATION STATUTES Full Medical Benefits** Alabama Indiana Nebraska South Carolina Alaska Iowa Nevada South Dakota
ANNUAL FINANCIAL PROFILE OF AMERICA S FRANCHISED NEW-CAR DEALERSHIPS
 215 ANNUAL FINANCIAL PROFILE OF AMERICA S FRANCHISED NEW-CAR DEALERSHIPS Overview Steven Szakaly Chief Economist, NADA NADA Data the annual financial profile of new-car dealerships includes the many major
Table 1: Advertising, Marketing and Promotional Expense as a Percentage of Net Operating Revenue
 Table 1: Advertising, Marketing and Promotional Expense as a Percentage of Net Operating Revenue NAIC Group % Attorney s Title 3.8% Chicago / Fidelity 0.9% Diversified 0.6% First American 2.7% Investors
Recycling and Waste-to-Energy: Are They Compatible? 2009 Update
 Recycling and Waste-to-Energy: Are They Compatible? 2009 Update Eileen Brettler Berenyi, PhD Governmental Advisory Associates, Inc. 599 Riverside Avenue, Suite 1 Westport, CT 06880 June 2009 EXECUTIVE
We do require the name and mailing address of each person forming the LLC.
 Topic: LLC Managers/Members Question by: Jeff Harvey : Idaho Date: March 7, 2012 Manitoba Corporations Canada Alabama Alaska Arizona Arkansas California Colorado Arizona requires that member-managed LLCs
STATISTICAL BRIEF #273
 STATISTICAL BRIEF #273 December 29 Employer-Sponsored Health Insurance for Employees of State and Local Governments, by Census Division, 28 Beth Levin Crimmel, M.S. Introduction Employees of state and
Low-Profit Limited Liability Company (L3C) Date: July 29, 2013. [Low-Profit Limited Liability Company (L3C)] [July 29, 2013]
![Low-Profit Limited Liability Company (L3C) Date: July 29, 2013. [Low-Profit Limited Liability Company (L3C)] [July 29, 2013]](/thumbs/27/11522934.jpg "Low-Profit Limited Liability Company (L3C) Date: July 29, 2013. [Low-Profit Limited Liability Company (L3C)] [July 29, 2013]") Topic: Question by: : Low-Profit Limited Liability Company (L3C) Kevin Rayburn, Esq., MBA Tennessee Date: July 29, 2013 Manitoba Corporations Canada Alabama Alaska Arizona Arkansas California Colorado
Topic: Question by: : Low-Profit Limited Liability Company (L3C) Kevin Rayburn, Esq., MBA Tennessee Date: July 29, 2013 Manitoba Corporations Canada Alabama Alaska Arizona Arkansas California Colorado
The Unconventional Energy Revolution: Estimated Energy Savings for Public School Districts and State and Local Governments
 The Unconventional Energy Revolution: Estimated Energy Savings for Public School Districts and State and Local Governments Prepared for: American Petroleum Institute Prepared by: IHS Global Inc. 1150 Connecticut
STATISTICAL BRIEF #435
 STATISTICAL BRIEF #435 April 2014 Premiums and Employee Contributions for Employer-Sponsored Health Insurance: Private versus Public Sector, 2012 Karen E. Davis, MA Introduction Employer-sponsored health
Impacts of Sequestration on the States
 Impacts of Sequestration on the States Alabama Alabama will lose about $230,000 in Justice Assistance Grants that support law STOP Violence Against Women Program: Alabama could lose up to $102,000 in funds
US Exports to China by State
 US Exports to China by State 2004 2013 1818 N Street, NW, Suite 200, Washington, DC 20036 Tel: 202-429-0340 Fax: 202-775-2476 E-mail: info@uschina.org www.uschina.org Executive Summary Exports to China:
LLC Domestications. Date: March 23, 2015. [LLC Domestication] [March 23, 2015]
![LLC Domestications. Date: March 23, 2015. [LLC Domestication] [March 23, 2015]](/thumbs/27/9699692.jpg "LLC Domestications. Date: March 23, 2015. [LLC Domestication] [March 23, 2015]") Topic: Question by: : LLC Domestications Earl B. Weaver, Jr. Illinois Date: March 23, 2015 Manitoba Corporations Canada Alabama Alaska Arizona Alabama has removed the term domestication from our Code for
Topic: Question by: : LLC Domestications Earl B. Weaver, Jr. Illinois Date: March 23, 2015 Manitoba Corporations Canada Alabama Alaska Arizona Alabama has removed the term domestication from our Code for
US Department of Health and Human Services Exclusion Program. Thomas Sowinski Special Agent in Charge/ Reviewing Official
 US Department of Health and Human Services Exclusion Program Thomas Sowinski Special Agent in Charge/ Reviewing Official Overview Authority to exclude individuals and entities from Federal Health Care
Economic Impact and Variation in Costs to Provide Community Pharmacy Services
 Economic Impact and Variation in Costs to Provide Community Pharmacy Services Todd Brown MHP, R.Ph. Associate Clinical Specialist and Vice Chair Department of Pharmacy Practice School of Pharmacy Northeastern
Project Lead Location Amount Project Description. American Lung Association in Minnesota
 Project Lead Location Amount Project Description American Lung Association in Minnesota St. Paul, MN $248,788 The Accelerating Alternatives for Minnesota Drivers project will provide safety and technical
NON-RESIDENT INDEPENDENT, PUBLIC, AND COMPANY ADJUSTER LICENSING CHECKLIST
 NON-RESIDENT INDEPENDENT, PUBLIC, AND COMPANY ADJUSTER LICENSING CHECKLIST ** Utilize this list to determine whether or not a non-resident applicant may waive the Oklahoma examination or become licensed
AZ State Board of Physical Therapy, 1400 W Washington, Suite 230, Phoenix, AZ 85007, Phone: 520-542-3095 Fax: 520-542-3093
 General Information Licensing requirements vary state by state. This page will provide you links to each State Licensing Board, along with contact information; and, as we develop it. Please refer to each
Alabama Department of Agriculture and Industries 1445 Federal Drive Montgomery, AL 36107 http://www.agi.alabama.gov/pesticide_management
 Below is a list of the contact information for the department in each state that handles licenses for pesticides application, which is often required for HVAC system cleaners who use antimicrobial products.
Arizona Form 2014 Credit for Taxes Paid to Another State or Country 309
 Arizona Form 2014 Credit for Taxes Paid to Another State or Country 309 Phone Numbers For information or help, call one of the numbers listed: Phoenix (602) 255-3381 From area codes 520 and 928, toll-free
Electric Power Monthly with Data for May 2015
 Electric Power Monthly with Data for May 2015 July 2015 Independent Statistics & Analysis www.eia.gov U.S. Department of Energy Washington, DC 20585 This report was prepared by the U.S. Energy Information
Medicare Advantage Cuts in the Affordable Care Act: March 2013 Update Robert A. Book l March 2013
 Medicare Advantage Cuts in the Affordable Care Act: March 2013 Update Robert A. Book l March 2013 The Centers for Medicare and Medicaid Services (CMS) recently announced proposed rules that would cut payments
Benefits of Selling WorkLife 65
 PruTerm WorkLife 65 SM LEARN ABOUT THE PRODUCT AND MARKET Benefits of Selling WorkLife 65 Pru s new and innovative term product will resonate with your clients. WorkLife 65 is a new and innovative term
Center for Sustainable Business Growth
 Center for Sustainable Business Growth Progress Report; December 2014 Bridgeport Eco-Technology Park The south and west ends of Bridgeport, where the Eco-Technology Park resides, have been the home of
Health Insurance Coverage of Children Under Age 19: 2008 and 2009
 Health Insurance Coverage of Children Under Age 19: 2008 and 2009 American Community Survey Briefs Issued September 2010 ACSBR/09-11 IntroductIon Health insurance, whether private or public, improves children
U.S. charitable giving: 2014 results & initial 2015 forecast
 the exclusive resource for monthly U.S. charitable giving results and forecasts by sector, source and state U.S. charitable giving: 2014 results & initial 2015 forecast contents faq about the atlas of
A clean energy solution from cradle to grave
 Environmental Product Declaration A clean energy solution from cradle to grave Offshore wind power plant employing SWT-6.0-154 siemens.com / wind 2 Assessing the performance of a wind power plant The environmental
22 States do not provide access to Chapter 9 Bankruptcy
 22 States do not provide access to Chapter 9 Bankruptcy -Georgia explicitly denies access to municipal bankruptcy. (GA Code 36 80-5) States with No Statutes: Alaska Delaware Hawaii Indiana Kansas Maine
Notices of Cancellation / Nonrenewal and / or Other Related Forms
 Forms are listed alphabetically by form title. INDEX POLICY CODES 1. Auto 2. Fire and Multiple Peril 3. Liability 4. Property, other than Fire and Multiple Peril (e.g. Crime & Inland Marine) 5. Workers
States with In-State Resource RPS Requirements
 States with In-State Resource RPS Requirements Prepared by the North Carolina Clean Energy Technology Center This research is based on information from the Database of State Incentives for Renewables and
Closing the College Attainment Gap between the U.S. and Most Educated Countries, and the Contributions to be made by the States
 National Center for Higher Education Management Systems Closing the College Attainment Gap between the U.S. and Most Educated Countries, and the Contributions to be made by the States Patrick J. Kelly
The Economic Contributions of U.S. Mining (2012)
") The Economic Contributions of U.S. Mining (2012) September 2014 A report prepared by the National Mining Association TABLE OF CONTENTS Executive Summary...E-1 National Results...E-1 State Results...E-1
The Economic Contributions of U.S. Mining (2012) September 2014 A report prepared by the National Mining Association TABLE OF CONTENTS Executive Summary...E-1 National Results...E-1 State Results...E-1
STATE INCOME TAX WITHHOLDING INFORMATION DOCUMENT
 STATE INCOME TAX WITHHOLDING INFORMATION DOCUMENT Zurich American Life Insurance Company (ZALICO) Administrative Offices: PO BOX 19097 Greenville, SC 29602-9097 800/449-0523 This document is intended to
State Government Subsidies for Retirement Plans Sponsored by Local Governments. National Conference of State Legislatures, January 2010
 Government Subsidies for Retirement Plans Sponsored by Local Governments National Conference of State Legislatures, January 2010 In many states, city and county governments, independent school districts,
6 CONSIDERATION OF ALTERNATIVES
 6 CONSIDERATION OF ALTERNATIVES 6.1.1 Schedule 4 of the Town and Country Planning (Environmental Impact Assessment) (Scotland) Regulations 2011 sets out the information for inclusion in Environmental Statements
SECTION 109 HOST STATE LOAN-TO-DEPOSIT RATIOS. The Board of Governors of the Federal Reserve System (Board), the Federal Deposit
, the Federal Deposit") SECTION 109 HOST STATE LOAN-TO-DEPOSIT RATIOS The Board of Governors of the Federal Reserve System (Board), the Federal Deposit Insurance Corporation (FDIC), and the Office of the Comptroller of the Currency
SECTION 109 HOST STATE LOAN-TO-DEPOSIT RATIOS The Board of Governors of the Federal Reserve System (Board), the Federal Deposit Insurance Corporation (FDIC), and the Office of the Comptroller of the Currency
ENS Governmental Format Status (As of 06/16/2008)
") Alaska AK Production (G) Region D Tan - Development Required Alabama AL Production (G) Region C Arkansas AR Production (G) Region C D Yellow - Pended for required Beta Site Green - In Production - Direct
Alaska AK Production (G) Region D Tan - Development Required Alabama AL Production (G) Region C Arkansas AR Production (G) Region C D Yellow - Pended for required Beta Site Green - In Production - Direct
Waste a source of energy. Regional Solid Waste Management Plan Review: Engaging solutions for tomorrow. Incineration. Incineration
 Waste a source of energy Regional Solid Waste Management Plan Review: Engaging solutions for tomorrow Garbage School 301: Waste to Energy All organic materials contains energy Plant or animal based Plastics
Delivering Clean Energy
 Delivering Clean Energy Meeting Energy Needs Homes and businesses across the country depend on energy to support the economy and sustain a high quality of life. Yet there s also a responsibility to provide
Facing Cost-Sensitive Shoppers, Health Plan Providers Must Demonstrate Value
 w Reports: Health Insurance Marketplace Exchange Enrollment Satisfaction Improves Significantly in Second Year Facing Cost-Sensitive Shoppers, Health Plan Providers Must Demonstrate Value WESTLAKE VILLAGE,
Full Medical Benefits**
 (In effect as of January 1, 2006*) TABLE 5a. MEDICAL BENEFITS PROVIDED BY WORKERS' COMPENSATION STATUTES Full Medical Benefits** Alabama Indiana Nebraska South Carolina Alaska Iowa Nevada South Dakota
State-by-State Listing of Departments of Insurance Updated August 2005
 BUREAUS State-by-State Listing of Departments of Insurance Updated August 2005 Alabama Dept. of Insurance P.O. Box 303351 201 Monroe St. #1700 Montgomery AL 36104 (334) 269-3550 http://www.aldoi.org E-mail:
How To Get An R22 In Massachusetts
 MAIA Bulletin #2004-26 December 2004 (updated 6/6/05) SR-22 Project One of the most common complaints we receive is that consumers in Massachusetts are unable to secure SR-22 (financial responsibility)
EMBARGOED UNTIL 6:00 AM ET WEDNESDAY, NOVEMBER 30, 2011
 A State-by-State Look at the President s Payroll Tax Cuts for Middle-Class Families An Analysis by the U.S. Department of the Treasury s Office of Tax Policy The President signed into law a 2 percentage
How to Earn the LEED Green Power Credit
 3D EG REES WH ITE PAPER How to Earn the LEED Green Power Credit Using on-site and off-site renewable energy to mitigate the impact of greenhouse gas emissions associated with a LEED project s energy use
STATE CONSUMER ASSISTANCE PROGRAMS UNDER PHS ACT SECTION 2793
 STATE CONSUMER ASSISTANCE PROGRAMS UNDER PHS ACT SECTION 2793 Alabama (No program) Alaska (No program) Arizona (No program) Arkansas Arkansas Insurance Department Consumer Services Division 1200 West Third
STATE DATA CENTER. District of Columbia MONTHLY BRIEF
 District of Columbia STATE DATA CENTER MONTHLY BRIEF N o v e m b e r 2 0 1 2 District Residents Health Insurance Coverage 2000-2010 By Minwuyelet Azimeraw Joy Phillips, Ph.D. This report is based on data
SECTION 109 HOST STATE LOAN-TO-DEPOSIT RATIOS. or branches outside of its home state primarily for the purpose of deposit production.
 SECTION 109 HOST STATE LOAN-TO-DEPOSIT RATIOS The Board of Governors of the Federal Reserve System, the Federal Deposit Insurance Corporation, and the Office of the Comptroller of the Currency (the agencies)
Janitors in 2000: An Overview of NCS Data
 Janitors in 2000: An Overview of NCS Data by Laura Pfuntner Originally Posted: November 24, 2003 New data reveal that pay for janitors is influenced by the type of work performed and whether the job is
Real Progress in Food Code Adoption
 Real Progress in Food Code Adoption August 27, 2013 The Association of Food and Drug Officials (AFDO), under contract to the Food and Drug Administration, is gathering data on the progress of FDA Food
American C.E. Requirements
 American C.E. Requirements Alaska Board of Nursing Two of the following: 30 contact hours 30 hours of professional nursing activities 320 hours of nursing employment Arizona State Board of Nursing Arkansas
Employment and Earnings of Registered Nurses in 2010
 Employment and Earnings of Registered Nurses in 2010 Thursday, May 25, 2011 The Bureau of Labor Statistics (BLS) released 2010 occupational employment data on May 17, 2011. This document provides several
Alaska (AK) Arizona (AZ) Arkansas (AR) California-RN (CA-RN) Colorado (CO)
 Arizona (AZ) Arkansas (AR) California-RN (CA-RN) Colorado (CO)") Beth Radtke 50 Included in the report: 7/22/2015 11:15:28 AM Alaska (AK) Arizona (AZ) Arkansas (AR) California-RN (CA-RN) Colorado (CO) Connecticut (CT) Delaware (DE) District Columbia (DC) Florida (FL)
Beth Radtke 50 Included in the report: 7/22/2015 11:15:28 AM Alaska (AK) Arizona (AZ) Arkansas (AR) California-RN (CA-RN) Colorado (CO) Connecticut (CT) Delaware (DE) District Columbia (DC) Florida (FL)