How To Understand Failure On Flash Based Flash Memory (Samsung)
|
|
|
- Letitia Montgomery
- 3 years ago
- Views:
Transcription
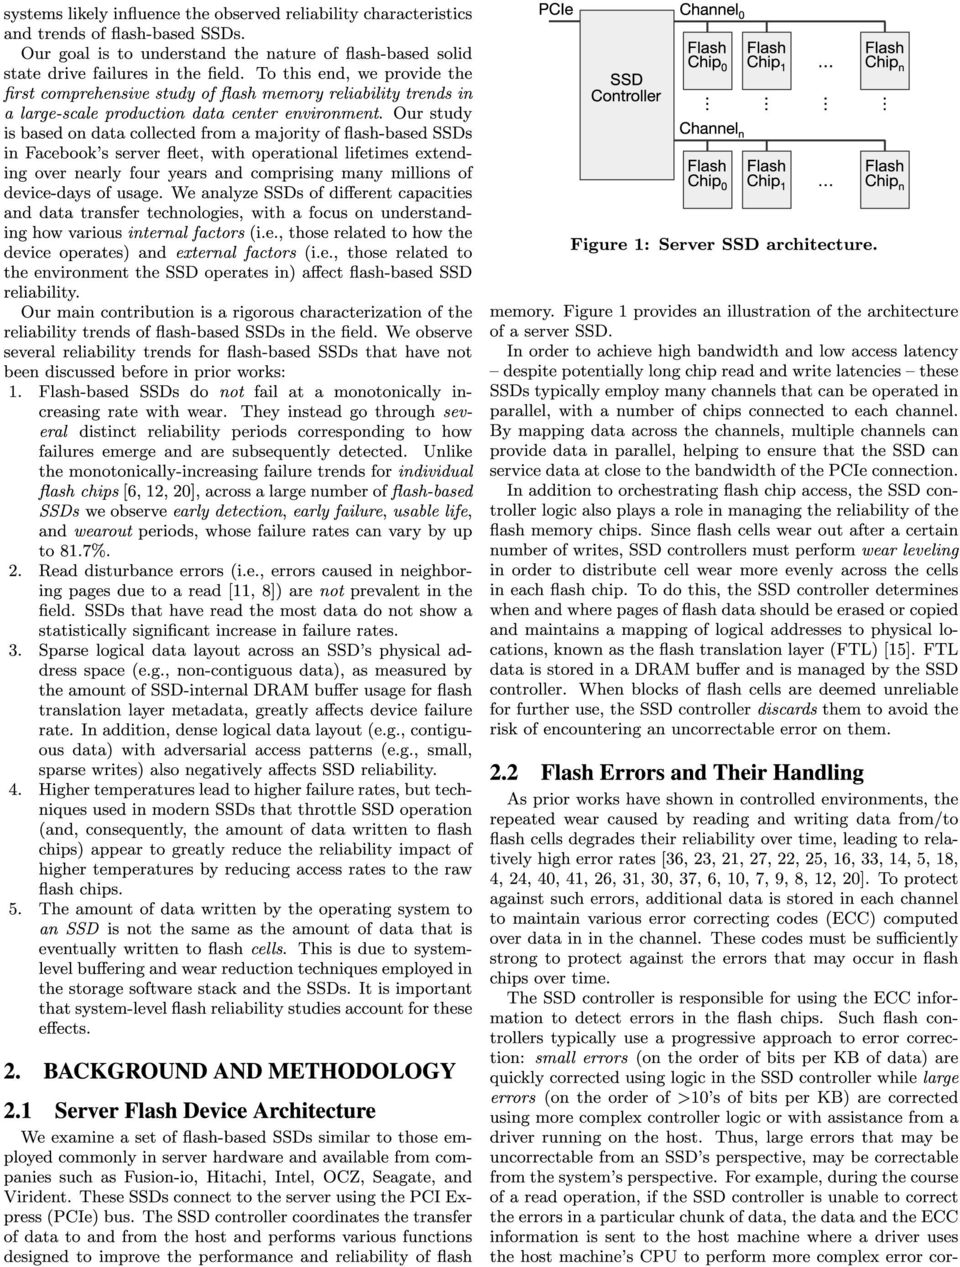
1 A Large-Scale Study of Flash Memory Failures in the Field Justin Meza Carnegie Mellon University Qiang Wu Facebook, Inc. Sanjeev Kumar Facebook, Inc. Onur Mutlu Carnegie Mellon University ABSTRACT Servers use flash memory based solid state drives (SSDs) as a high-performance alternative to hard disk drives to store persistent data. Unfortunately, recent increases in flash density have also brought about decreases in chip-level reliability. In a data center environment, flash-based SSD failures can lead to downtime and, in the worst case, data loss. As a result, it is important to understand flash memory reliability characteristics over flash lifetime in a realistic production data center environment running modern applications and system software. This paper presents the first large-scale study of flash-based SSD reliability in the field. We analyze data collected across a majority of flash-based solid state drives at Facebook data centers over nearly four years and many millions of operational hours in order to understand failure properties and trends of flash-based SSDs. Our study considers a variety of SSD characteristics, including: the amount of data written to and read from flash chips; how data is mapped within the SSD address space; the amount of data copied, erased, and discarded by the flash controller; and flash board temperature and bus power. Based on our field analysis of how flash memory errors manifest when running modern workloads on modern SSDs, this paper is the first to make several major observations: (1) s do not increase monotonically with flash chip wear; instead they go through several distinct periods corresponding to how failures emerge and are subsequently detected, (2) the effects of read disturbance errors are not prevalent in the field, (3) sparse logical data layout across an SSD s physical address space (e.g., non-contiguous data), as measured by the amount of metadata required to track logical address translations stored in an SSD-internal DRAM buffer, can greatly affect, (4) higher temperatures lead to higher failure rates, but techniques that throttle SSD operation appear to greatly reduce the negative reliability impact of higher temperatures, and (5) data written by the operating system to flash-based SSDs does not always accurately indicate the amount of wear induced on flash cells due to optimizations in the SSD controller and buffering employed in the system software. We hope that the findings of this first large-scale flash memory reliability study can inspire others to develop other publicly-available analyses and novel flash reliability solutions. Permission to make digital or hard copies of part or all of this work for personal or classroom use is granted without fee provided that copies are not made or distributed for profit or commercial advantage, and that copies bear this notice and the full citation on the first page. Copyrights for third-party components of this work must be honored. For all other uses, contact the owner/author(s). Copyright is held by the author/owner(s). SIGMETRICS 15, June 15 19, 2015, Portland, OR, USA. ACM /15/06. Categories and Subject Descriptors B.3.4. [Hardware]: Memory Structures Reliability, Testing, and Fault-Tolerance Keywords flash memory; reliability; warehouse-scale data centers 1. INTRODUCTION Servers use flash memory for persistent storage due to the low access latency of flash chips compared to hard disk drives. Historically, flash capacity has lagged behind hard disk drive capacity, limiting the use of flash memory. In the past decade, however, advances in NAND flash memory technology have increased flash capacity by more than This rapid increase in flash capacity has brought both an increase in flash memory use and a decrease in flash memory reliability. For example, the number of times that a cell can be reliably programmed and erased before wearing out and failing dropped from 10,000 times for 50 nm cells to only 2,000 times for 20 nm cells [28]. This trend is expected to continue for newer generations of flash memory. Therefore, if we want to improve the operational lifetime and reliability of flash memory-based devices, we must first fully understand their failure characteristics. In the past, a large body of prior work examined the failure characteristics of flash cells in controlled environments using small numbers e.g., tens) of raw flash chips (e.g., [36, 23, 21, 27, 22, 25, 16, 33, 14, 5, 18, 4, 24, 40, 41, 26, 31, 30, 37, 6, 11, 10, 7, 13, 9, 8, 12, 20]). This work quantified a variety of flash cell failure modes and formed the basis of the community s understanding of flash cell reliability. Yet prior work was limited in its analysis because these studies: (1) were conducted on small numbers of raw flash chips accessed in adversarial manners over short amounts of time, (2) did not examine failures when using real applications running on modern servers and instead used synthetic access patterns, and (3) did not account for the storage software stack that real applications need to go through to access flash memories. Such conditions assumed in these prior studies are substantially different from those experienced by flash-based SSDs in large-scale installations in the field. In such large-scale systems: (1) real applications access flash-based SSDs in different ways over a time span of years, (2) applications access SSDs via the storage software stack, which employs various amounts of buffering and hence affects the access pattern seen by the flash chips, (3) flash-based SSDs employ aggressive techniques to reduce device wear and to correct errors, (4) factors in platform design, including how many SSDs are present in a node, can affect the access patterns to SSDs, (5) there can be significant variation in reliability due to the existence of a very large number of SSDs and flash chips. All of these real-world conditions present in large-scale

2
3 Platform SSDs PCIe Per SSD Capacity Age (years) Data written Data read UBER A TB 23.8 TB v1, GB 2.4 ± B TB 45.1 TB C TB 43.4 TB TB 1.6 ± D TB 30.6 TB v2, 4 11 E TB 51.1 TB TB 0.5 ± F TB 18.2 TB Table 1: The platforms examined in our study. PCIe technology is denoted by vx, Y where X = version and Y = number of lanes. Data was collected over the entire age of the SSDs. Data written and data read are to/from the physical storage over an SSD s lifetime. UBER = uncorrectable bit error rate (Section 3.2). rection and forwards the result to the host s OS. Errors that are not correctable by the driver result in data loss. 1 Our SSDs allow us to collect information only on large errors that are uncorrectable by the SSD but correctable by the host. For this reason, our results are in terms of such SSDuncorrectable but host-correctable errors, and when we refer to uncorrectable errors we mean these type of errors. We refer to the occurrence of such uncorrectable errors in an SSD as an SSD failure. 2.3 The Systems We examined the majority of flash-based SSDs in Facebook s server fleet, which have operational lifetimes extending over nearly four years and comprising many millions of SSD-days of usage. Data was collected over the lifetime of the SSDs. We found it useful to separate the SSDs based on the type of platform an SSD was used in. We define a platform as a combination of the device capacity used in the system, the PCIe technology used, and the number of SSDs in the system. Table 1 characterizes the platforms we examine in our study. We examined a range of high-capacity multi-level cell (MLC) flash-based SSDs with capacities of 720 GB, 1.2 TB, and 3.2 TB. The technologies we examined spanned two generations of PCIe, versions 1 and 2. Some of the systems in the fleet employed one SSD while others employed two. Platforms A and B contain SSDs with around two or more years of operation and represent 16.6% of the SSDs examined; Platforms C and D contain SSDs with around one to two years of operation and represent 50.6% of the SSDs examined; and Platforms E and F contain SSDs with around half a year of operation and represent around 22.8% of the SSDs examined. 2.4 Measurement Methodology The flash devices in our fleet contain registers that keep track of statistics related to SSD operation (e.g., number of bytes read, number of bytes written, number of uncorrectable errors). These registers are similar to, but distinct from, the standardized SMART data stored by some SSDs to monitor their reliability characteristics [3]. The values in these registers can be queried by the host machine. We use a collector script to retrieve the raw values from the SSD and parse them into a form that can be curated in a Hive [38] table. This process is done in real time every hour. The scale of the systems we analyzed and the amount of data being collected posed challenges for analysis. To process the many millions of SSD-days of information, we used a cluster of machines to perform a parallelized aggregation of the data stored in Hive using MapReduce jobs in order to get a set of 1 We do not examine the rate of data loss in this work. lifetime statistics for each of the SSDs we analyzed. We then processed this summary data in R [2] to collect our results. 2.5 Analytical Methodology Our infrastructure allows us to examine a snapshot of SSD data at a point in time (i.e., our infrastructure does not store timeseries information for the many SSDs in the fleet). This limits our analysis to the behavior of the fleet of SSDs at a point in time (for our study, we focus on a snapshot of SSD data taken during November 2014). Fortunately, the number of SSDs we examine and the diversity of their characteristics allow us to examine how reliability trends change with various characteristics. When we analyze an SSD characteristic (e.g., the amount of data written to an SSD), we group SSDs into buckets based on their value for that characteristic in the snapshot and plot the failure rate for SSDs in each bucket. For example, if an SSD s is placed in a bucket for N TB of data written, it is not also placed in the bucket for (N k) TB of data written (even though at some point in its life it did have only (N k) TB of data written). When performing bucketing, we round the value of an SSD s characteristic to the nearest bucket and we eliminate buckets that contain less than 0.1% of the SSDs analyzed to have a statistically significant sample of SSDs for our measurements. In order to express the confidence of our observations across buckets that contain different numbers of servers, we show the 95th percentile confidence interval for all of our data (using a binomial distribution when considering failure rates). We measure SSD failure rate for each bucket in terms of the fraction of SSDs that have had an uncorrectable error compared to the total number of SSDs in that bucket. 3. BASELINE STATISTICS We will first focus on the overall error rate and error distribution among the SSDs in the platforms we analyze and then examine correlations between different failure events. 3.1 Bit Error Rate The bit error rate (BER) of an SSD is the rate at which errors occur relative to the amount of information that is transmitted from/to the SSD. BER can be used to gauge the reliability of data transmission across a medium. We measure the uncorrectable bit error rate (UBER) from the SSD as: UBER = Uncorrectable errors Bits accessed For flash-based SSDs, UBER is an important reliability metric that is related to the SSD lifetime. SSDs with high UBERs are expected to have more failed cells and encounter more (severe) errors that may potentially go undetected and corrupt
. rection and forwards the result to the host s OS.")
4 data than SSDs with low UBERs. Recent work by Grupp et al. examined the BER of raw MLC flash chips (without performing error correction in the flash controller) in a controlled environment [20]. They found the raw BER to vary from for the least reliable flash chips down to for the most reliable, with most chips having a BER in the to range. Their study did not analyze the effects of the use of chips in SSDs under real workloads and system software. Table 1 shows the UBER of the platforms that we examine. We find that for flash-based SSDs used in servers, the UBER ranges from to While we expect that the UBER of the SSDs that we measure (which correct small errors, perform wear leveling, and are not at the end of their rated life but still being used in a production environment) should be less than the raw chip BER in Grupp et al. s study (which did not correct any errors in the flash controller, exercised flash chips until the end of their rated life, and accessed flash chips in an adversarial manner), we find that in some cases the BERs were within around one order of magnitude of each other. For example, the UBER of Platform B in our study, , comes close to the lower end of the raw chip BER range reported in prior work, Thus, we observe that in flash-based SSDs that employ error correction for small errors and wear leveling, the UBER ranges from around 1/10 to 1/1000 the raw BER of similar flash chips examined in prior work [20]. This is likely due to the fact that our flash-based SSDs correct small errors, perform wear leveling, and are not at the end of their rated life. As a result, the error rate we see is smaller than the error rate the previous study observed. As shown by the SSD UBER, the effects of uncorrectable errors are noticeable across the SSDs that we examine. We next turn to understanding how errors are distributed among a population of SSDs and how failures occur within SSDs. 3.2 SSD Failure Rate and Error Count Figure 2 (top) shows the SSD incidence failure rate within each platform the fraction of SSDs in each platform that have reported at least one uncorrectable error. We find that SSD failures are relatively common events with between 4.2% and 34.1% of the SSDs in the platforms we examine reporting uncorrectable errors. Interestingly, the failure rate is much lower for Platforms C and E despite their comparable amounts of data written and read (cf. Table 1). This suggests that there are differences in the failure process among platforms. We analyze which factors play a role in determining the occurrence of uncorrectable errors in Sections 4 and 5. Figure 2 (bottom) shows the average yearly uncorrectable error rate among SSDs within the different platforms the sum of errors that occurred on all servers within a platform over 12 months ending in November 2014 divided by the number of servers in the platform. The yearly rates of uncorrectable errors on the SSDs we examined range from 15,128 for Platform D to 978,806 for Platform B. The older Platforms A and B have a higher error rate than the younger Platforms C through F, suggesting that the incidence of uncorrectable errors increases as SSDs are utilized more. We will examine this relationship further in Section 4. Platform B has a much higher average yearly rate of uncorrectable errors (978,806) compared to the other platforms (the second highest amount, for Platform A, is 106,678). We find that this is due to a small number of SSDs having a much Yearly uncorrectable errors per SSD e+00 4e+05 8e+05 A B C D E F A B C D E F Figure 2: The failure rate (top) and average yearly uncorrectable errors per SSD (bottom), among SSDs within each platform. higher number of errors in that platform: Figure 3 quantifies the distribution of errors among SSDs in each platform. The x axis is the normalized SSD number within the platform, with SSDs sorted based on the number of errors they have had over their lifetime. The y axis plots the number of errors for a given SSD in log scale. For every platform, we observe that the top 10% of SSDs with the most errors have over 80% of all uncorrectable errors seen for that platform. For Platforms B, C, E, and F, the distribution is even more skewed, with 10% of SSDs with errors making up over 95% of all observed uncorrectable errors. We also find that the distribution of number of errors among SSDs in a platform is similar to that of a Weibull distribution with a shape parameter of 0.3 and scale parameter of The solid black line on Figure 3 plots this distribution. An explanation for the relatively large differences in errors per machine could be that error events are correlated. Examining the data shows that this is indeed the case: during a recent two weeks, 99.8% of the SSDs that had an error during the first week also had an error during the second week. We therefore conclude that an SSD that has had an error in the past is highly likely to continue to have errors in the future. With this in mind, we next turn to understanding the correlation between errors occurring on both devices in the two-ssd systems we examine. 3.3 Correlations Between Different SSDs Given that some of the platforms we examine have two flashbased SSDs, we are interested in understanding if the likeli-

5

6 directly to flash cells), cells are read, programmed, and erased, and unreliable cells are identified by the SSD controller, resulting in an initially high failure rate among devices. Figure 4 pictorially illustrates the lifecycle failure pattern we observe, which is quantified by Figure 5. Figure 5 plots how the failure rate of SSDs varies with the amount of data written to the flash cells. We have grouped the platforms based on the individual capacity of their SSDs. Notice that across most platforms, the failure rate is low when little data is written to flash cells. It then increases at first (corresponding to the early detection period, region 1 in the figures), and decreases next (corresponding to the early failure period, region 2 in the figures). Finally, the error rate generally increases for the remainder of the SSD s lifetime (corresponding to the useful life and wearout periods, region 3 in the figures). An obvious outlier for this trend is Platform C in Section 5, we observe that some external characteristics of this platform lead to its atypical lifecycle failure pattern. Note that different platforms are in different stages in their lifecycle depending on the amount of data written to flash cells. For example, SSDs in Platforms D and F, which have the least amount of data written to flash cells on average, are mainly in the early detection or early failure periods. On the other hand, SSDs in older Platforms A and B, which have more data written to flash cells, span all stages of the lifecycle failure pattern (depicted in Figure 4). For SSDs in Platform A, we observe up to an 81.7% difference between the failure rates of SSDs in the early detection period and SSDs in the wearout period of the lifecycle. As explained before and as depicted in Figure 4, the lifecycle failure rates we observe with the amount of data written to flash cells does not follow the conventional bathtub curve. In particular, the new early detection period we observe across the large number of devices leads us to investigate why this early detection period behavior exists. Recall that the early detection period refers to failure rate increasing early in lifetime (i.e., when a small amount of data is written to the SSD). After the early detection period, failure rate starts decreasing. We hypothesize that this non-monotonic error rate behavior during and after the early detection period can be accounted for by a two-pool model of flash blocks: one pool of blocks, called the weaker pool, consists of cells whose error rate increases much faster than the other pool of blocks, called the stronger pool. The weaker pool quickly generates uncorrectable errors (leading to increasing failure rates observed in the early detection period as these blocks keep failing). The cells comprising this pool ultimately fail and are taken out of use early by the SSD controller. As the blocks in the weaker pool are exhausted, the overall error rate starts decreasing (as we observe after the end of what we call the early detection period) and it continues to decrease until the more durable blocks in the stronger pool start to wear out due to typical use. We notice a general increase in the duration of the lifecycle periods (in terms of data written) for SSDs with larger capacities. For example, while the early detection period ends after around 3 TB of data written for 720 GB and 1.2TB SSDs (in Platforms A, B, C, and D), it ends after around 10 TB of data written for 3.2 TB SSDs (in Platforms E and F). Similarly, the early failure period ends after around 15 TB of data written for 720 GB SSDs (in Platforms A and B), 28 TB for 1.2 TB SSDs (in Platforms C and D), and 75 TB for 3.2 TB SSDs (in Platforms E and F). This is likely due to the more flexibility a higher-capacity SSD has in reducing wear across a larger number of flash cells. 4.2 Data Read from Flash Cells Similar to data written, our framework allows us to measure the amount of data directly read from flash cells over each SSD s lifetime. Prior works in controlled environments have shown that errors can be induced due to read-based access patterns [5, 32, 6, 8]. We are interested in understanding how prevalent this effect is across the SSDs we examine. Figure 6 plots how failure rate of SSDs varies with the amount of data read from flash cells. For most platforms (i.e., A, B, C, and F), the failure rate trends we see in Figure 6 are similar to those we observed in Figure 5. We find this similarity when the average amount of data written to flash cells by SSDs in a platform is more than the average amount of data read from the flash cells. Platforms A, B, C, and F show this behavior. 2 2 Though Platform B has a set of SSDs with a large amount of data read, the average amount of data read across all SSDs in this platform is less than the average amount of data written. Platform A Platform B Platform C Platform D Platform E Platform F e+00 4e+13 8e e e e e e+14 Data written (B) Data written (B) Data written (B) Figure 5: vs. the amount of data written to flash cells. SSDs go through several distinct phases throughout their life: increasing failure rates during early detection of less reliable cells (1), decreasing failure rates during early cell failure and subsequent removal (2), and eventually increasing error rates during cell wearout (3).

7 Platform A Platform B Platform C Platform D Platform E Platform F e e e e e e e e+14 Data read (B) Data read (B) Data read (B) Figure 6: vs. the amount of data read from flash cells. SSDs in Platform E, where over twice as much data is read from flash cells as written to flash cells, do not show failures dependent on the amount of data read from flash cells. In Platform D, where more data is read from flash cells than written to flash cells (30.6 TB versus 18.9 TB, on average), we notice error trends associated with the early detection and early failure periods. Unfortunately, even though devices in Platform D may be prime candidates for observing the occurrence of read disturbance errors (because more data is read from flash cells than written to flash cells), the effects of early detection and early failure appear to dominate the types of errors observed on this platform. In Platform E, however, over twice as much data is read from flash cells as written to flash cells (51.1 TB versus 23.9 TB on average). In addition, unlike Platform D, devices in Platform E display a diverse amount of utilization. Under these conditions, we do not observe a statistically significant difference in the failure rate between SSDs that have read the most amount of data versus those that have read the least amount of data. This suggests that the effect of read-induced errors in the SSDs we examine is not predominant compared to other effects such as write-induced errors. This corroborates prior flash cell analysis that showed that most errors occur due to retention effects and not read disturbance [32, 11, 12]. 4.3 Block Erases Before new data can be written to a page in flash memory, the entire block needs to be first erased. 3 Each erase wears out the block as shown in previous works [32, 11, 12]. Our infrastructure tracks the average number of blocks erased when an SSD controller performs garbage collection. Garbage collection occurs in the background and erases blocks to ensure that there is enough available space to write new data. The basic steps involved in garbage collection are: (1) selecting blocks to erase (e.g., blocks with many unused pages), (2) copying pages from the selected block to a free area, and (3) erasing the selected block [29]. While we do not have statistics on how frequently garbage collection is performed, we examine the number of erases per garbage collection period metric as an indicator of the average amount of erasing that occurs within each SSD. We examined the relationship between the number of erases performed versus the failure rate (not plotted). Across the 3 Flash pages (around 8 KB in size) compose each flash block. A flash block is around KB flash pages. SSDs we examine, we find that the failure trends in terms of erases are correlated with the trends in terms of data written (shown in Figure 5). This behavior reflects the typical operation of garbage collection in SSD controllers: As more data is written, wear must be leveled across the flash cells within an SSD, requiring more blocks to be erased and more pages to be copied to different locations (an effect we analyze next). 4.4 Page Copies As data is written to flash-based SSDs, pages are copied to free areas during garbage collection in order to free up blocks with unused data to be erased and to more evenly level wear across the flash chips. Our infrastructure measures the number of pages copied across an SSD s lifetime. We examined the relationship between the number of pages copied versus (not plotted). Since the page copying process is used to free up space to write data and also to balance the wear due to writes, its operation is largely dictated by the amount of data written to an SSD. Accordingly, we observe similar trends with the number of copied pages (not plotted) as we observed with the amount of data written to flash cells (shown in Figure 5). 4.5 Discarded Blocks Blocks are discarded by the SSD controller when they are deemed unreliable for further use. Discarding blocks affects the usable lifetime of a flash-based SSD by reducing the amount of over-provisioned capacity of the SSD. At the same time, discarding blocks has the potential to reduce the amount of errors generated by an SSD, by preventing unreliable cells from being accessed. Understanding the reliability effects of discarding blocks is important, as this process is the main defense that SSD controllers have against failed cells and is also a major impediment for SSD lifetime. Figure 7 plots the versus number of discarded blocks over the SSD s lifetime. For SSDs in most platforms, we observe an initially decreasing trend in SSD failure rate with respect to the number of blocks discarded followed by an increasing and then finally decreasing failure rate trend. We attribute the initially high when few blocks have been discarded to the two-pool model of flash cell failure discussed in Section 4.1. In this case, the weaker pool of flash blocks (corresponding to weak blocks that fail
, we notice error trends associated with the early detection and early failure periods.")
8 Platform A Platform B Platform C Platform D Platform E Platform F 0e+00 4e+06 8e+06 0e+00 3e+08 6e e e e e e e e e e+08 Discarded blocks Discarded blocks Discarded blocks Discarded blocks Discarded blocks Discarded blocks Figure 7: vs. the number of discarded blocks. We find that (1) failure rate is relatively high among SSDs that have discarded few blocks (far left of plots), (2) some SSDs seem to effectively mask failures by discarding blocks (initial decrease in failure rates), and (3) discarding a large amount of blocks is indicative of higher failure rates (toward the right of plots). early) cause errors before they can be discarded by the SSD controller, causing an initially high. On the other hand, the stronger pool of flash blocks (which fail due to gradual wearout over time) contribute to the subsequent decrease in. Some SSDs that have discarded a large number of blocks have high error rates (e.g., Platforms A, B, and E), indicating that discarding a large number of blocks is a good indicator of the likelihood of SSD failure. We further examined the devices with the largest number of discarded blocks and found that the number of blocks that are discarded is not correlated with the amount of data written to or read from flash cells (examined in Sections 4.1 and 4.2). In other words, we observe SSDs of both low and high usage across their lifetime (measured by flash cell reads and writes) that have discarded large amounts of blocks and have high failure rates. This suggests that the relationship between discarded blocks and failure rate is to some extent intrinsic to the SSD. Thus, some SSDs, despite discarding many blocks, continue to encounter uncorrectable errors at a much higher rate than their peers. 4.6 DRAM Buffer Usage Flash-based SSDs use internal DRAM to provide buffer space for SSD controller metadata or for data to be written to the flash chips. The SSDs we examine use the internal DRAM buffer space only to store metadata related to the flash translation layer mapping for logical addresses to physical addresses. This allows the SSD controller to locate data on an SSD quickly, reducing the performance impact of address translation. The SSDs we examine use the DRAM buffer less when data is densely allocated (e.g., contiguous data) and use the DRAM buffer more when data is sparsely allocated (e.g., noncontiguous data). As an illustrative example, using an SSD to read from a large file would lead to a contiguous allocation of data on the SSD and a small DRAM buffer usage (due to a small number of mappings that need to be tracked in the FTL). On the other hand, using an SSD to read from and write to many small files would lead to many non-contiguous allocations of data on the SSD and a large DRAM buffer usage (due to a large number of mappings that need to be tracked in the FTL). Examining DRAM buffer usage can therefore provide an indication of how system data allocation behavior affects flash reliability. To capture the DRAM buffer usage of SSDs, we examine the average amount of DRAM buffer space used over two recent weeks of SSD operation, sampled at one hour intervals. Figure 8 plots the failure rate for SSDs that use different amounts of DRAM buffer space on average. For some platforms (A, B, and D), we observe that as more DRAM buffer space is used, increases. Such a trend indicates that some systems that allocate data more sparsely have higher failure rates. Such behavior is potentially due to the fact that sparse data allocation can correspond to access patterns that write small amounts of non-contiguous data, causing the SSD controller to more frequently erase and copy data compared to writing contiguous data. While Platform C does not appear to be sensitive to DRAM buffer usage, Platforms E and F demonstrate a trend of higher error rates at lower DRAM buffer usage. We attribute this behavior to a separate pattern of write behavior that we hypothesize these SSDs are subjected to. In these platforms, we believe that the SSDs allocate large, contiguous regions of data (resulting in low DRAM buffer usage) but write to them sparsely but intensely (leading to cell wearout). This could occur, for example, when frequently updating small fields in a large, contiguously-allocated data structure. Interestingly, we observe similar failure behavior with DRAM buffer usage at the application level (Figure 9). We examine six of the largest distributions of applications on Platform B: Graph Search is a distributed graph search service; Batch Processor executes long-running asynchronous jobs; Key Value Store stores persistent mappings of keys to values; Load Balancer is a programmable traffic routing framework; Distributed Key Value Store is like a Key Value Store with strong reliability, availability, and consistency guarantees; and Flash Cache is a cache for data with a large working set and low access frequency [19]. Applications across SSDs have increasing failure rates with increasing DRAM buffer usage (sparse data mappings) and in some cases have increases in failure rates at lower DRAM buffer usage (dense data mappings, e.g., Batch Processor and Flash Cache). We conclude that small, sparse writes negatively affect SSD failure rates the most for sparse data mappings (e.g., noncontiguous data). But failures are also noticeable for dense data mappings (e.g., contiguous data). Given this behavior, we believe that there is the potential for developing more effective techniques to handle the adversarial access pattern of small, sparse writes.
, and (3) discarding a large amount of blocks is indicative of higher failure rates (toward the right of plots).")
9 Platform A Platform B Platform C Platform D Platform E Platform F 5.0e e e e e e+09 Figure 8: vs. DRAM buffer usage. Sparse data mappings (e.g., non-contiguous data, indicated by high DRAM buffer usage to store flash translation layer metadata) negatively affect SSD reliability the most (Platforms A, B, and D). Additionally, some dense data mappings (e.g., contiguous data in Platforms E and F) also negatively affect SSD reliability, likely due to the effect of small, sparse writes. Graph Search Batch Processor Key Value Store Load Balancer Distributed Key Value Store Flash Cache 2.5e e e e e e e e e e+08 4e+08 8e+08 Figure 9: vs. DRAM buffer usage across six applications that run on Platform B. We observe similar DRAM buffer effects to Figure 8, even among SSDs running the same application. 5. THE ROLE OF EXTERNAL FACTORS We next examine how factors external to the SSD influence the errors observed over an SSD s lifetime. We examine the effects of temperature, PCIe bus power, and system-level writes reported by the OS. 5.1 Temperature It is commonly assumed that higher temperature negatively affects the operation of flash-based SSDs. In flash cells, higher temperatures have been shown to cause cells to age more quickly due to the temperature-activated Arrhenius effect [39]. Temperature-dependent effects are especially important to understand for flash-based SSDs in order to make adequate data center provisioning and cooling decisions. To examine the effects of temperature, we used temperature measurements from temperature sensors embedded on the SSD cards, which provide a more accurate portrayal of the temperature of flash cells than temperature sensors at the server or rack level. Figure 10 plots the failure rate for SSDs that have various average operating temperatures. We find that at an operating temperature range of 30 to 40 C, SSDs across server platforms see similar failure rates or slight increases in failure rates as temperature increases. Outside of this range (at temperatures of 40 C and higher), we find that SSDs fall into one of three categories with respect to their reliability trends vs. temperature: (1) temperaturesensitive with increasing failure rate (Platforms A and B), (2) less temperature-sensitive (Platforms C and E), and (3) temperature-sensitive with decreasing failure rate (Platforms D and F). There are two factors that may affect the trends we observe with respect to SSD temperature. One potential factor when analyzing the effects of temperature is the operation of the SSD controller in response to changes in temperature. The SSD controllers in some of the SSDs we examine attempt to ensure that SSDs do not exceed certain temperature thresholds (starting around 80 C). Similar to techniques employed in processors to reduce the amount of processor activity in order to keep the processor within a certain temperature range, our SSDs attempt to change their behavior (e.g., reduce the frequency of SSD access or, in the extreme case, shut down the SSD) in order not to exceed temperature thresholds. A second potential factor is the thermal characteristics of the machines in each platform. The existence of two SSDs in a machine (in Platforms B, D, and F) compared to one SSD in a machine may (1) increase the thermal capacity of the machine (causing its SSDs to reach higher temperatures more quickly and increase the work required to cool the SSDs) and (2) potentially reduce airflow to the components, prolonging the effects of high temperatures when they occur. One hypothesis is that temperature-sensitive SSDs with increasing error rates, such as Platforms A and B, may not employ as aggressive temperature reduction techniques as other platforms. While we cannot directly measure the actions the SSD controllers take in response to temperature events, we examined an event that can be correlated with temperature

10 Platform A Platform B Platform C Platform D Platform E Platform F Figure 10: vs. temperature. Operational temperatures of 30 to 40 C generally show increasing failure rates. Failure trends at and above 40 C follow three distinct failure rate patterns: increasing, not sensitive, and decreasing. reduction: whether or not an SSD has throttled its operation in order to reduce its power consumption. Performing a large number of writes to an SSD consumes power and increases the temperature of the SSD. Figure 11 plots, for each temperature, the fraction of machines that have ever been throttled. Examining this figure confirms that Platforms A and B, where no machines or few machines have been throttled, exhibit behavior that is typical for SSDs without much preventative action against temperature increases. In these platforms, as temperature increases, failure rate of SSDs increases. In contrast to Platforms A and B, Platforms C and E, which are less temperature-sensitive, throttle their SSDs more aggressively across a range of temperatures. From Figure 10 we can see that throttled SSDs have lower failure rates (in Platforms C and E) compared to SSDs that are throttled less or not throttled at all (Platforms A and B). We attribute the relatively low for Platforms C and E we have observed in our measurements to the very aggressive throttling that occurs for SSDs in these two platforms. Such throttling could potentially reduce performance, though we are not able to examine this effect. SSDs in Platforms D and F employ a relatively low amount of throttling (Figure 11), but exhibit the counter-intuitive trend of decreasing failure rate with increased temperature. Recall from Section 4.1 that these SSDs are predominantly in their early detection and early failure periods and so the failure rates for most SSDs in these platforms are relatively high compared to their peers in Platforms C and E. It is likely that a combination of power throttling and some other form of temperature-dependent throttling employed by the SSD controller that we are not able to measure is responsible for reducing the failure rate among the SSDs in Platforms D and F as temperature increases. 5.2 Bus Power Consumption According to the PCIe standard, the nominal bus power consumption for the PCIe 4 SSDs that we analyze is 10 W (regardless of PCIe version 1 or 2). Our infrastructure allows us to measure the average amount of power consumed on the PCIe bus by SSDs. As power consumption in servers can lead to increased electricity use for operation and cooling in data centers, we are interested in understanding the role that SSD power draw plays with respect to errors. Figure 12 plots the failure rate for SSDs that operate at different average amounts of bus power consumption. Recall that Platforms A and B use PCIe v1 and that Platforms C through F use PCIe v2. We make three observations about the operation of these SSDs. First, PCIe v2 SSDs (Platforms C through F) support twice the bandwidth of PCIe v1 SSDs (Platforms A and B) by operating at twice the frequency, leading to around twice the amount of power consumed between the two sets of SSDs: SSDs supporting PCIe v1 operate in the range of 4 to 7.5 W and SSDs supporting PCIe v2 operate in the range of 8 to 14.5 W. Second, we find that the bus power that SSDs consume can vary over a range of around 2 between the SSDs that consume the least bus power and Platform A Platform B Platform C Platform D Platform E Platform F Throttled SSD fraction Figure 11: Fraction of SSDs ever throttled vs. SSD temperature. While SSDs in some platforms are never throttled (A and B), others are throttled more aggressively (C and E).

11 Platform A Platform B Platform C Platform D Platform E Platform F Bus power (W) Bus power (W) Bus power (W) Figure 12: vs. bus power consumption. PCIe v2 SSDs (Platforms C through F) consume more bus power than PCIe v1 SSDs (Platforms A and B) due to their higher frequency. Bus power consumption range (1) spans up to around 2 for SSDs within a platform (e.g., Platform B) and (2) is typically different from the nominal PCIe bus power of 10 W. those that consume the most within a platform. Third, we find that PCIe v2 SSDs in systems that use two SSDs (Platforms D and F) tend to consume lower bus power compared to PCIe v2 SSDs in systems that use one SSD (Platforms C and E). This may be due to SSD access being distributed between the two SSDs. Note, however, that the total bus power consumption of a two-ssd system is larger than a single-ssd system. With regard to failure rates, we observe that the trends for bus power consumption are correlated with those of average temperature. We believe that the higher bus power consumption is due to more data being transmitted and more data being transmitted requires more power to read or write from the SSD, which in turn increases the SSD temperature. One interesting result of this correlation is that techniques that aim to reduce SSD temperature in the absence of precise temperature sensors may be able to use bus power consumption as a proxy. 5.3 Data Written by the System Software While we have shown that the amount of data that is written to flash cells has a direct effect on flash-based SSD lifetime, it is less clear what effect system-level writes reported by the OS (i.e., writes initiated by the system software on behalf of user programs or the file system) have on SSD error characteristics. Note that not all data written by system software may get written to flash chips due to system-level buffering. However, the reduction of writes performed by the system software is often used as a figure of merit in techniques that evaluate flash reliability in lieu of modeling the wear reduction techniques present in SSDs. Therefore, we are interested in examining whether or not different amounts of writes performed by the system software lead to different error characteristics in SSDs. To this end, we measured the number of sectors (512 B in size) modified by the OS on behalf of the applications running on our machines over their lifetime, which we refer to as data written by the system software. Figure 13 plots the failure rate for SSDs where the OS has written different numbers of sectors over their lifetime. In general, we observe that the total amount of data written by the system software is correlated with increased failure rates (following similar trends as the SSD lifecycle from Figure 4). There is one important caveat: some systems where a large amount of data has been written by the system software, have lower failure rates. This can be seen, for example, in Platforms A, B, and F: while there is a general trend toward higher s with larger amounts of data written by the system software for other platforms, the SSDs in Platforms A, B, and F can have lower failure rates with larger amounts of data written by the system software. We believe that this is due to the fact that systems that write more data may be able to benefit more from system-level buffering (e.g., the OS page cache) along with techniques employed by the SSD controller to reduce the amount of wear on flash cells (e.g., data encoding schemes that help reduce the number of program or erase operations). To confirm this trend, Figure 14 plots the amount of data actually written to the flash chips compared to the amount of data the system software reported as having written. SSDs in Platforms B and F clearly show that writing more data at the system software-level does not always imply physically writing more data to flash chips. In fact, writing more data at the system software level may actually offer the system software more opportunities to coalesce data in system-level buffers before writing it to the flash cells, resulting in smaller numbers of actual writes to the flash chips. This observation suggests that work concerned with improving flash reliability must consider the effects of buffering across the system when evaluating different techniques. 6. LIMITATIONS AND POTENTIAL CONFOUNDING FACTORS Workload changes due to SSD failure. In order to make systems more resilient to SSD failures, data replication is employed at the software level in some workloads. Such replication stores multiple copies of data (e.g., three copies) across different servers. In the event that data on one SSD becomes unavailable (e.g., due to an SSD failure), a copy of data can still be readily accessible. In Section 3.3, we examined the correlation between SSD failures within the same server. Note that, with replication, an SSD failure will not shift the workload to the other SSD in the same server, as replicated copies are spread out among

12 Platform A Platform B Platform C Platform D Platform E Platform F 0e+00 3e+10 6e e e e+11 0e+00 2e+11 4e+11 Figure 13: vs. system data written by the system software. Interestingly, the amount of data written by the system software is not always an accurate indication of the amount of wear induced in an SSD, as seen in Platforms A and B, where more data written by the system software can correspond to lower failure rates. Data written to flash cells (B) 2e+13 6e+13 Platform A 0e+00 2e+10 4e+10 2e+13 6e+13 Platform B 0.0e e+14 Platform C 0e+00 2e+13 0e+00 3e+10 6e e e e e e e e e e+11 Platform D 0.0e e e+14 Platform E 0.0e e+13 Platform F 0e+00 2e+10 4e+10 Figure 14: Actual data written to flash cells vs. data the OS reported as having been written. Due to buffering present in the system software (e.g., the page cache), the amount of data written by the system software does not always correspond to the amount of data written to the SSD (e.g., in Platforms A, B, and F). different servers. Replication will, however, increase the utilization of other SSDs that contain copies of data. As such, correlation between SSD failures in different servers may exist, though we do not examine such effects in this work. Performance effects. We also did not examine how the performance of a system was affected by the rate of uncorrectable errors on its SSDs and whether this made machines with SSDs reporting errors less effective at executing their workload. SSD and flash chip access patterns. Our data collection infrastructure did not allow us to collect detailed access traces to the SSDs and flash chips we examined. This posed challenges for understanding the underlying causes of error behavior. While we examined the aggregate behavior of SSDs (e.g., amount of data written/read to/from flash chips in Sections 4.1 and 4.2) in order to gain insight into potential underlying access pattern trends, we believe that further SSD and flash chip access pattern analysis is needed to fully understand the underlying causes of the reliability trends we have identified. Error correction scheme. The SSDs we examined used one viable strategy for error correction. Data uncorrectable by the SSD is forwarded to the host for repair. We note that such an error correction scheme may not be employed on other SSDs (and may not even be possible for some SSDs, such as those that use the NVMe interface [1]). While our results are still representative of the types of uncorrectable errors that such SSDs face, we believe that it will be beneficial for future studies to examine the effects of different error correction schemes in SSDs. SSD data loss and repair. Recall from Section 2.2 that when an error is not correctable by an SSD, it is forwarded for repair to the host that the SSD is connected to. When the host cannot repair an error, data loss ensues. We did not examine the rate of data loss in the systems we evaluated. Nor did we examine the rate of SSD replacement. However, we believe that such an analysis (potentially combined with various error correction schemes, as mentioned above) would be very useful to perform in future work. As we also mentioned in Section 2.2, the amount of errors the SSDs we examined can tolerate without the assistance of the host is on the order of bits per KB of data (similar to data reported in [17]). However, we do not have visibility into the error correction schemes employed on the host for larger amounts of errors (>10 s of bits per KB of data). 7. RELATED WORK To our knowledge, this paper provides the first comprehensive study of flash-based SSD reliability trends in the field. Prior flash memory reliability studies focused on flash chip reliability and evaluated only a small number of flash chips in controlled environments.

13 The closest related work, by Grupp et al. [20], examined the cost, performance, capacity, and reliability trends of flash memory in the context of a prototypical server flash storage device similar in architecture to SSDs deployed in data centers (Figure 1). Based on their study, the authors project several challenges for the adoption of flash in a server context. One drawback of the reliability results presented in [20] is that the experiments were performed in a controlled environment, under synthetic workloads, while modeling only the latency but not the function of the SSD controller on a small number (45) of flash chips. A recent work by Ouyang et al. [34] performed a study of programmable SSD controllers at a large-scale web services company, Baidu. While this work examined flash-based SSDs in the field, it did not analyze the reliability characteristics of SSDs and instead focused on bandwidth, capacity, and cost. Several studies examined flash chips in controlled environments in order to understand their error characteristics. Our study is orthogonal to these works. Early analysis of flash circuitry identified flash reliability trends attributed to program disturbance due to tunneling effects and hot-electron injection [36, 23, 21, 27, 22], quantum-level noise effects [25, 16], erratic tunneling [33, 14], data-retention and read disturbance [5, 18, 4], and detrapping-induced retention effects [24, 40, 41, 26, 31, 30, 37]. A series of works by Cai et al. [6, 11, 10, 7, 9, 13, 8, 12] identified patterns of errors for more recent MLC flash chips and proposed techniques to help mitigate their effects. These studies can help identify (and mitigate) the trends in flash error patterns at the raw chip level. However, it is unclear from these studies to what extent flash-based SSDs in the field running real workloads and real system software over a long time may exhibit such error patterns (and how to ensure the reliability of such SSDs). For example, compared to prior chip-level studies, we find that s do not increase monotonically with flash chip wear; that read disturbance errors are not prevalent in the field; that the data layout across an SSD s physical address space has an effect on ; that SSD controller throttling techniques can help mitigate temperature-induced errors; and that optimizations in the SSD controllers and buffering employed in the system software reduces the amount of data written to flash chips. These differences from prior studies can be attributed to our holistic study of flash errors when running on real SSD controllers, under real system software, and with real data center workloads. 8. SUMMARY AND CONCLUSIONS We performed an extensive analysis of the effects of various factors on flash-based SSD reliability across a majority of the SSDs employed at Facebook, running production data center workloads. We analyze a variety of internal and external characteristics of SSDs and examine how these characteristics affect the trends for uncorrectable errors. To conclude, we briefly summarize the key observations from our study and discuss their implications for SSD and system design. Observation 1: We observe that SSDs go through several distinct failure periods early detection, early failure, usable life, and wearout during their lifecycle, corresponding to the amount of data written to flash chips. Due to pools of flash blocks with different reliability characteristics, failure rate in a population does not monotonically increase with respect to amount of data written to flash chips. This is unlike the failure rate trends seen in raw flash chips. We suggest that techniques should be designed to help reduce or tolerate errors throughout SSD lifecycle. For example, additional error correction at the beginning of an SSD s life could help reduce the failure rates we see during the early detection period. Observation 2: We find that the effect of read disturbance errors is not a predominant source of errors in the SSDs we examine. While prior work has shown that such errors can occur under certain access patterns in controlled environments [5, 32, 6, 8], we do not observe this effect across the SSDs we examine. This corroborates prior work which showed that the effect of retention errors in flash cells dominate error rate compared to read disturbance [32, 6]. It may be beneficial to perform a more detailed study of the effect of these types of errors in flash-based SSDs used in servers. Observation 3: Sparse data layout across an SSD s physical address space (e.g., non-contiguously allocated data) leads to high s; dense data layout (e.g., contiguous data) can also negatively impact reliability under certain conditions, likely due to adversarial access patterns. Further research into flash write coalescing policies with information from the system level may help improve SSD reliability. For example, information about write access patterns from the operating system could potentially inform SSD controllers of non-contiguous data that is accessed very frequently, which may be one type of access pattern that adversely affects SSD reliability and is a candidate for storing in a separate write buffer. Observation 4: Higher temperatures lead to increased failure rates, but do so most noticeably for SSDs that do not employ throttling techniques. In general, we find techniques like throttling, which may be employed to reduce SSD temperature, to be effective at reducing the failure rate of SSDs. We also find that SSD temperature is correlated with the power used to transmit data across the PCIe bus, which can potentially be used as a proxy for temperature in the absence of SSD temperature sensors. Observation 5: The amount of data reported to be written by the system software can overstate the amount of data actually written to flash chips, due to system-level buffering and wear reduction techniques. Techniques that simply reduce the rate of software-level writes may not reduce the failure rate of SSDs. Studies seeking to model the effects of reducing software-level writes on flash reliability should also consider how other aspects of SSD operation, such as system-level buffering and SSD controller wear leveling, affect the actual amount of data written to SSDs. Conclusions. We hope that our new observations, with real workloads and real systems from the field, can aid in (1) understanding the effects of different factors, including system software, applications, and SSD controllers on flash memory reliability, (2) the design of more reliable flash architectures and systems, and (3) improving the evaluation methodologies for future flash memory reliability studies. 9. ACKNOWLEDGMENTS We thank the anonymous reviewers for their insightful comments. This work is supported in part by Samsung and the Intel Science and Technology Center for Cloud Computing, as well as NSF grants , , , and

14 10. REFERENCES [1] NVM Express Specification. [2] The R Project for Statistical Computing. [3] American National Standards Institute. AT Attachment 8 ATA/ATAPI Command Set. docs2008/d1699r6a-ata8-acs.pdf, [4] H. Belgal, N. Righos, I. Kalastirsky, et al. A New Reliability Model for Post-Cycling Charge Retention of Flash Memories. IRPS, [5] A. Brand, K. Wu, S. Pan, et al. Novel Read Disturb Failure Mechanism Induced By Flash Cycling. IRPS, [6] Y. Cai, E. F. Haratsch, O. Mutlu, et al. Error Patterns in MLC NAND Flash Memory: Measurement, Characterization, and Analysis. In DATE, [7] Y. Cai, E. F. Haratsch, O. Mutlu, et al. Threshold Voltage Distribution in MLC NAND Flash Memory: Characterization, Analysis, and Modeling. In DATE, [8] Y. Cai, Y. Luo, S. Ghose, et al. Read Disturb Errors in MLC NAND Flash Memory: Characterization and Mitigation. In DSN, [9] Y. Cai, Y. Luo, E. F. Haratsch, et al. Data Retention in MLC NAND Flash Memory: Characterization, Optimization and Recovery. In HPCA, [10] Y. Cai, O. Mutlu, E. F. Haratsch, et al. Program Interference in MLC NAND Flash Memory: Characterization, Modeling, and Mitigation. In ICCD, [11] Y. Cai, G. Yalcin, O. Mutlu, et al. Flash Correct-and-Refresh: Retention-Aware Error Management for Increased Flash Memory Lifetime. In ICCD, [12] Y. Cai, G. Yalcin, O. Mutlu, et al. Error Analysis and Retention-Aware Error Management for NAND Flash Memory. ITJ, [13] Y. Cai, G. Yalcin, O. Mutlu, et al. Neighbor-Cell Assisted Error Correction for MLC NAND Flash Memories. In SIGMETRICS, [14] A. Chimenton and P. Olivo. Erratic Erase in Flash Memories Part I: Basic Experimental and Statistical Characterization. IEEE Trans. Elect. Dev., 50(4), [15] T.-S. Chung, D.-J. Park, S. Park, et al. A survey of flash translation layer. J. Sys. Arch., 55, [16] C. Compagnoni, A. Spinelli, R. Gusmeroli, et al. First Evidence for Injection Statistics Accuracy Limitations in NAND Flash Constant-Current Fowler-Nordheim Programming. IEDM Tech Dig., [17] J. Cooke. The Inconvenient Truths of NAND Flash Memory. In Flash Memory Summit, [18] R. Degraeve, F. Schuler, B. Kaczer, et al. Analytical Percolation Model for Predicting Anomalous Charge Loss in Flash Memories. IEEE Trans. Elect. Dev., 51(9), [19] A. Gartrell, M. Srinivasan, B. Alger, et al. McDipper: A Key-Value Cache for Flash Storage. https: // [20] L. M. Grupp, J. D. Davis, and S. Swanson. The Bleak Future of NAND Flash Memory. In FAST, [21] S. Hur, J. Lee, M. Park, et al. Effective Program Inhibition Beyond 90nm NAND Flash Memories. NVSM, [22] S. Joo, H. Yang, K. Noh, et al. Abnormal Disturbance Mechanism of Sub-100 nm NAND Flash Memory. Japanese J. Applied Physics, 45(8A), [23] T. Jung, Y. Choi, K. Suh, et al. A 3.3V 128Mb Multi-Level NAND Flash Memory for Mass Storage Applications. ISSCC, [24] M. Kato, N. Miyamoto, H. Kume, et al. Read-Disturb Degradation Mechanism Due to Electron Trapping in the Tunnel Oxide for Low-Voltage Flash Memories. IEDM, [25] H. Kurata, K. Otsuga, A. Kotabe, et al. The Impact of Random Telegraph Signals on the Scaling of Multilevel Flash Memories. VLSI, [26] J. Lee, J. Choi, D. Park, et al. Degradation of Tunnel Oxide by FN Current Stress and Its Effects on Data Retention Characteristics of 90-nm NAND Flash Memory. IRPS, [27] J. Lee, C. Lee, M. Lee, et al. A New Program Disturbance Phenomenon in NAND Flash Memory by Source/Drain Hot-Electrons Generated by GIDL Current. NVSM, [28] A. Maislos. A New Era in Embedded Flash Memory, Presentation at Flash Memory Summit. [29] Micron. Garbage Collection in Single-Level Cell NAND Flash Memory. Technical report, [30] N. Mielke, H. Belgal, A. Fazio, et al. Recovery Effects in the Distributed Cycling of Flash Memories. IRPS, [31] N. Mielke, H. Belgal, I. Kalastirsky, et al. Flash EEPROM Threshold Instabilities due to Charge Trapping During Program/Erase Cycling. IEEE Trans. Dev. and Mat. Reliability, 2(3), [32] N. Mielke, T. Marquart, N. Wu, et al. Bit Error Rate in NAND Flash Memories. In IRPS, [33] T. Ong, A. Fazio, N. Mielke, et al. Erratic Erase in ETOX TM Flash Memory Array. VLSI, [34] J. Ouyang, S. Lin, S. Jiang, et al. SDF: Software-Defined Flash for Web-Scale Internet Storage Systems. ASPLOS, [35] B. Schroeder and G. A. Gibson. Disk Failures in the Real World: What Does an MTTF of 1,000,000 Hours Mean to You? In FAST, [36] K. Suh, B. Suh, Y. Lim, et al. A 3.3 V 32 Mb NAND Flash Memory with Incremental Step Pulse Programming Scheme. IEEE JSSC, 30(11), [37] K. Takeuchi, S. Satoh, T. Tanaka, et al. A Negative Vth Cell Architecture for Highly Scalable, Excellently Noise-Immune, and Highly Reliable NAND Flash Memories. IEEE JSSC, 34(5), [38] A. Thusoo, J. Sen Sarma, N. Jain, et al. Hive A Petabyte Scale Data Warehouse Using Hadoop. In ICDE, [39] M. Xu, C. Tan, and L. MingFu. Extended Arrhenius Law of Time-to-Breakdown of Ultrathin Gate Oxides. Applied Physics Letters, 82(15), [40] R. Yamada, Y. Mori, Y. Okuyama, et al. Analysis of Detrap Current Due to Oxide Traps to Improve Flash Memory Retention. IRPS, [41] R. Yamada, T. Sekiguchi, Y. Okuyama, et al. A Novel Analysis Method of Threshold Voltage Shift Due to Detrap in a Multi-Level Flash Memory. VLSI, 2001.
![A New Reliability Model for Post-Cycling Charge Retention of Flash Memories. IRPS, 2002. [5] A. Brand, K. Wu, S. Pan, et al. Novel Read Disturb Failure Mechanism Induced By Flash Cycling. IRPS, 1993.](/docs-images/58/4719601/images/page_14.jpg "[6] Y. Cai, E. F. Haratsch, O. Mutlu, et al. Error Patterns in MLC NAND Flash Memory: Measurement, Characterization, and Analysis. In DATE, 2012. [7] Y. Cai, E. F. Haratsch, O. Mutlu, et al. Threshold Voltage Distribution in MLC NAND Flash Memory: Characterization, Analysis, and Modeling.")
Revisiting Memory Errors in Large-Scale Production Data Centers: Analysis and Modeling of New Trends from the Field
 Revisiting Memory Errors in Large-Scale Production Data Centers: Analysis and Modeling of New Trends from the Field Justin Meza Qiang Wu Sanjeev Kumar Onur Mutlu Carnegie Mellon University Facebook, Inc.
Database!Fatal!Flash!Flaws!No!One! Talks!About!!!
 MarcStaimer,President&CDSDragonSlayerConsulting W h i t e P A P E R DatabaseFatalFlashFlawsNoOne TalksAbout AndHowtoAvoidThem WHITEPAPER DatabaseFatalFlashFlawsNoOneTalksAbout AndHowtoAvoidThem DatabaseFatalFlashFlawsNoOneTalksAbout
Important Differences Between Consumer and Enterprise Flash Architectures
 Important Differences Between Consumer and Enterprise Flash Architectures Robert Sykes Director of Firmware Flash Memory Summit 2013 Santa Clara, CA OCZ Technology Introduction This presentation will describe
Don t Let RAID Raid the Lifetime of Your SSD Array
 Don t Let RAID Raid the Lifetime of Your SSD Array Sangwhan Moon Texas A&M University A. L. Narasimha Reddy Texas A&M University Abstract Parity protection at system level is typically employed to compose
Data Retention in MLC NAND Flash Memory: Characterization, Optimization, and Recovery
 Data Retention in MLC NAND Flash Memory: Characterization, Optimization, and Recovery Yu Cai, Yixin Luo, Erich F. Haratsch*, Ken Mai, Onur Mutlu Carnegie Mellon University, *LSI Corporation 1 Many use
HP SN1000E 16 Gb Fibre Channel HBA Evaluation
 HP SN1000E 16 Gb Fibre Channel HBA Evaluation Evaluation report prepared under contract with Emulex Executive Summary The computing industry is experiencing an increasing demand for storage performance
Benchmarking Hadoop & HBase on Violin
 Technical White Paper Report Technical Report Benchmarking Hadoop & HBase on Violin Harnessing Big Data Analytics at the Speed of Memory Version 1.0 Abstract The purpose of benchmarking is to show advantages
Accelerating Enterprise Applications and Reducing TCO with SanDisk ZetaScale Software
 WHITEPAPER Accelerating Enterprise Applications and Reducing TCO with SanDisk ZetaScale Software SanDisk ZetaScale software unlocks the full benefits of flash for In-Memory Compute and NoSQL applications
SOLID STATE DRIVES AND PARALLEL STORAGE
 SOLID STATE DRIVES AND PARALLEL STORAGE White paper JANUARY 2013 1.888.PANASAS www.panasas.com Overview Solid State Drives (SSDs) have been touted for some time as a disruptive technology in the storage
High-Performance SSD-Based RAID Storage. Madhukar Gunjan Chakhaiyar Product Test Architect
 High-Performance SSD-Based RAID Storage Madhukar Gunjan Chakhaiyar Product Test Architect 1 Agenda HDD based RAID Performance-HDD based RAID Storage Dynamics driving to SSD based RAID Storage Evolution
Solid State Drive (SSD) FAQ
 FAQ") Solid State Drive (SSD) FAQ Santosh Kumar Rajesh Vijayaraghavan O c t o b e r 2 0 1 1 List of Questions Why SSD? Why Dell SSD? What are the types of SSDs? What are the best Use cases & applications for
Solid State Drive (SSD) FAQ Santosh Kumar Rajesh Vijayaraghavan O c t o b e r 2 0 1 1 List of Questions Why SSD? Why Dell SSD? What are the types of SSDs? What are the best Use cases & applications for
Flash In The Enterprise
 Flash In The Enterprise Technology and Market Overview Chris M Evans, Langton Blue Ltd Architecting IT January 2014 Doc ID: AI1401-01S Table of Contents The Need for Flash Storage... 3 IOPS Density...
OCZ s NVMe SSDs provide Lower Latency and Faster, more Consistent Performance
 OCZ s NVMe SSDs provide Lower Latency and Faster, more Consistent Performance by George Crump, Lead Analyst! When non-volatile flash memory-based solid-state drives (SSDs) were introduced, the protocol
enabling Ultra-High Bandwidth Scalable SSDs with HLnand
 www.hlnand.com enabling Ultra-High Bandwidth Scalable SSDs with HLnand May 2013 2 Enabling Ultra-High Bandwidth Scalable SSDs with HLNAND INTRODUCTION Solid State Drives (SSDs) are available in a wide
Flash Solid State. Are we there yet?
 Flash Solid State Storage Reliability Are we there yet? Presenter: David Flynn NAND Flash Reliability/Availability y The GOOD: No moving parts Predicable wear out The BAD: Bit error rate increases with
1 / 25. CS 137: File Systems. Persistent Solid-State Storage
 1 / 25 CS 137: File Systems Persistent Solid-State Storage Technology Change is Coming Introduction Disks are cheaper than any solid-state memory Likely to be true for many years But SSDs are now cheap
Solid State Drive Architecture
 Solid State Drive Architecture A comparison and evaluation of data storage mediums Tyler Thierolf Justin Uriarte Outline Introduction Storage Device as Limiting Factor Terminology Internals Interface Architecture
Performance Beyond PCI Express: Moving Storage to The Memory Bus A Technical Whitepaper
 : Moving Storage to The Memory Bus A Technical Whitepaper By Stephen Foskett April 2014 2 Introduction In the quest to eliminate bottlenecks and improve system performance, the state of the art has continually
Analyzing Big Data with Splunk A Cost Effective Storage Architecture and Solution
 Analyzing Big Data with Splunk A Cost Effective Storage Architecture and Solution Jonathan Halstuch, COO, RackTop Systems JHalstuch@racktopsystems.com Big Data Invasion We hear so much on Big Data and
In-Block Level Redundancy Management for Flash Storage System
 , pp.309-318 http://dx.doi.org/10.14257/ijmue.2015.10.9.32 In-Block Level Redundancy Management for Flash Storage System Seung-Ho Lim Division of Computer and Electronic Systems Engineering Hankuk University
Accelerating Business Intelligence with Large-Scale System Memory
 Accelerating Business Intelligence with Large-Scale System Memory A Proof of Concept by Intel, Samsung, and SAP Executive Summary Real-time business intelligence (BI) plays a vital role in driving competitiveness
Understanding endurance and performance characteristics of HP solid state drives
 Understanding endurance and performance characteristics of HP solid state drives Technology brief Introduction... 2 SSD endurance... 2 An introduction to endurance... 2 NAND organization... 2 SLC versus
Differential RAID: Rethinking RAID for SSD Reliability
 Differential RAID: Rethinking RAID for SSD Reliability ABSTRACT Asim Kadav University of Wisconsin Madison, WI kadav@cs.wisc.edu Vijayan Prabhakaran vijayanp@microsoft.com Deployment of SSDs in enterprise
Trends in NAND Flash Memory Error Correction
 Trends in NAND Flash Memory Error Correction June 2009 Eric Deal Cyclic Design Introduction NAND Flash is a popular storage media because of its ruggedness, power efficiency, and storage capacity. Flash
SLC vs MLC: Which is best for high-reliability apps?
 SLC vs MLC: Which is best for high-reliability apps? Here's an examination of trade-offs, with an emphasis on how they affect the reliability of storage targeted at industrial, military and avionic applications.
Flash-optimized Data Progression
 A Dell white paper Howard Shoobe, Storage Enterprise Technologist John Shirley, Product Management Dan Bock, Product Management Table of contents Executive summary... 3 What is different about Dell Compellent
Speeding Up Cloud/Server Applications Using Flash Memory
 Speeding Up Cloud/Server Applications Using Flash Memory Sudipta Sengupta Microsoft Research, Redmond, WA, USA Contains work that is joint with B. Debnath (Univ. of Minnesota) and J. Li (Microsoft Research,
Data Distribution Algorithms for Reliable. Reliable Parallel Storage on Flash Memories
 Data Distribution Algorithms for Reliable Parallel Storage on Flash Memories Zuse Institute Berlin November 2008, MEMICS Workshop Motivation Nonvolatile storage Flash memory - Invented by Dr. Fujio Masuoka
The search engine you can see. Connects people to information and services
 The search engine you can see Connects people to information and services The search engine you cannot see Total data: ~1EB Processing data : ~100PB/day Total web pages: ~1000 Billion Web pages updated:
NAND Flash Architecture and Specification Trends
 NAND Flash Architecture and Specification Trends Michael Abraham (mabraham@micron.com) NAND Solutions Group Architect Micron Technology, Inc. August 2012 1 Topics NAND Flash Architecture Trends The Cloud
Benchmarking Cassandra on Violin
 Technical White Paper Report Technical Report Benchmarking Cassandra on Violin Accelerating Cassandra Performance and Reducing Read Latency With Violin Memory Flash-based Storage Arrays Version 1.0 Abstract
Managing Capacity Using VMware vcenter CapacityIQ TECHNICAL WHITE PAPER
 Managing Capacity Using VMware vcenter CapacityIQ TECHNICAL WHITE PAPER Table of Contents Capacity Management Overview.... 3 CapacityIQ Information Collection.... 3 CapacityIQ Performance Metrics.... 4
Temperature Considerations for Industrial Embedded SSDs
 I-Temp SSDs: Temperature Considerations for Industrial Embedded SSDs NAND flash-based SSDs and memory cards continue to be the dominant storage media for most industrial-embedded systems. Historically,
EMC XTREMIO EXECUTIVE OVERVIEW
 EMC XTREMIO EXECUTIVE OVERVIEW COMPANY BACKGROUND XtremIO develops enterprise data storage systems based completely on random access media such as flash solid-state drives (SSDs). By leveraging the underlying
SLC vs MLC: Proper Flash Selection for SSDs in Industrial, Military and Avionic Applications. A TCS Space & Component Technology White Paper
 SLC vs MLC: Proper Flash Selection for SSDs in Industrial, Military and Avionic Applications A TCS Space & Component Technology White Paper Introduction As with most storage technologies, NAND Flash vendors
How To Scale Myroster With Flash Memory From Hgst On A Flash Flash Flash Memory On A Slave Server
 White Paper October 2014 Scaling MySQL Deployments Using HGST FlashMAX PCIe SSDs An HGST and Percona Collaborative Whitepaper Table of Contents Introduction The Challenge Read Workload Scaling...1 Write
Maximizing Your Server Memory and Storage Investments with Windows Server 2012 R2
 Executive Summary Maximizing Your Server Memory and Storage Investments with Windows Server 2012 R2 October 21, 2014 What s inside Windows Server 2012 fully leverages today s computing, network, and storage
Accelerating Business Intelligence with Large-Scale System Memory
 Accelerating Business Intelligence with Large-Scale System Memory A Proof of Concept by Intel, Samsung, and SAP Executive Summary Real-time business intelligence (BI) plays a vital role in driving competitiveness
Lab Evaluation of NetApp Hybrid Array with Flash Pool Technology
 Lab Evaluation of NetApp Hybrid Array with Flash Pool Technology Evaluation report prepared under contract with NetApp Introduction As flash storage options proliferate and become accepted in the enterprise,
Comparison of NAND Flash Technologies Used in Solid- State Storage
 An explanation and comparison of SLC and MLC NAND technologies August 2010 Comparison of NAND Flash Technologies Used in Solid- State Storage By Shaluka Perera IBM Systems and Technology Group Bill Bornstein
NetApp FAS Hybrid Array Flash Efficiency. Silverton Consulting, Inc. StorInt Briefing
 NetApp FAS Hybrid Array Flash Efficiency Silverton Consulting, Inc. StorInt Briefing PAGE 2 OF 7 Introduction Hybrid storage arrays (storage systems with both disk and flash capacity) have become commonplace
NAND Flash FAQ. Eureka Technology. apn5_87. NAND Flash FAQ
 What is NAND Flash? What is the major difference between NAND Flash and other Memory? Structural differences between NAND Flash and NOR Flash What does NAND Flash controller do? How to send command to
21 st Century Storage What s New and What s Changing
 21 st Century Storage What s New and What s Changing Randy Kerns Senior Strategist Evaluator Group Overview New technologies in storage - Continued evolution - Each has great economic value - Differing
Benefits of Solid-State Storage
 This Dell technical white paper describes the different types of solid-state storage and the benefits of each. Jeff Armstrong Gary Kotzur Rahul Deshmukh Contents Introduction... 3 PCIe-SSS... 3 Differences
Amazon EC2 Product Details Page 1 of 5
 Amazon EC2 Product Details Page 1 of 5 Amazon EC2 Functionality Amazon EC2 presents a true virtual computing environment, allowing you to use web service interfaces to launch instances with a variety of
Accelerating I/O- Intensive Applications in IT Infrastructure with Innodisk FlexiArray Flash Appliance. Alex Ho, Product Manager Innodisk Corporation
 Accelerating I/O- Intensive Applications in IT Infrastructure with Innodisk FlexiArray Flash Appliance Alex Ho, Product Manager Innodisk Corporation Outline Innodisk Introduction Industry Trend & Challenge
FAST 11. Yongseok Oh <ysoh@uos.ac.kr> University of Seoul. Mobile Embedded System Laboratory
 CAFTL: A Content-Aware Flash Translation Layer Enhancing the Lifespan of flash Memory based Solid State Drives FAST 11 Yongseok Oh University of Seoul Mobile Embedded System Laboratory
Dell Reliable Memory Technology
 Dell Reliable Memory Technology Detecting and isolating memory errors THIS WHITE PAPER IS FOR INFORMATIONAL PURPOSES ONLY, AND MAY CONTAIN TYPOGRAPHICAL ERRORS AND TECHNICAL INACCURACIES. THE CONTENT IS
Reliability of Data Storage Systems
 Zurich Research Laboratory Ilias Iliadis April 2, 25 Keynote NexComm 25 www.zurich.ibm.com 25 IBM Corporation Long-term Storage of Increasing Amount of Information An increasing amount of information is
Chapter 7: Distributed Systems: Warehouse-Scale Computing. Fall 2011 Jussi Kangasharju
 Chapter 7: Distributed Systems: Warehouse-Scale Computing Fall 2011 Jussi Kangasharju Chapter Outline Warehouse-scale computing overview Workloads and software infrastructure Failures and repairs Note:
Promise of Low-Latency Stable Storage for Enterprise Solutions
 Promise of Low-Latency Stable Storage for Enterprise Solutions Janet Wu Principal Software Engineer Oracle janet.wu@oracle.com Santa Clara, CA 1 Latency Sensitive Applications Sample Real-Time Use Cases
OPTIMIZING VIDEO STORAGE AT THE EDGE OF THE NETWORK
 White Paper OPTIMIZING VIDEO STORAGE AT THE EDGE OF THE NETWORK Leveraging Intelligent Content Distribution Software, Off-the-Shelf Hardware and MLC Flash to Deploy Scalable and Economical Pay-As-You-Grow
Flash 101. Violin Memory Switzerland. Violin Memory Inc. Proprietary 1
 Flash 101 Violin Memory Switzerland Violin Memory Inc. Proprietary 1 Agenda - What is Flash? - What is the difference between Flash types? - Why are SSD solutions different from Flash Storage Arrays? -
Solid State Drive Technology
 Technical white paper Solid State Drive Technology Differences between SLC, MLC and TLC NAND Table of contents Executive summary... 2 SLC vs MLC vs TLC... 2 NAND cell technology... 2 Write amplification...
VMware Virtual SAN Design and Sizing Guide TECHNICAL MARKETING DOCUMENTATION V 1.0/MARCH 2014
 VMware Virtual SAN Design and Sizing Guide TECHNICAL MARKETING DOCUMENTATION V 1.0/MARCH 2014 Table of Contents Introduction... 3 1.1 VMware Virtual SAN...3 1.2 Virtual SAN Datastore Characteristics and
Linux flash file systems JFFS2 vs UBIFS
 Linux flash file systems JFFS2 vs UBIFS Chris Simmonds 2net Limited Embedded Systems Conference UK. 2009 Copyright 2009, 2net Limited Overview Many embedded systems use raw flash chips JFFS2 has been the
Concepts Introduced in Chapter 6. Warehouse-Scale Computers. Important Design Factors for WSCs. Programming Models for WSCs
 Concepts Introduced in Chapter 6 Warehouse-Scale Computers introduction to warehouse-scale computing programming models infrastructure and costs cloud computing A cluster is a collection of desktop computers
Intel Solid-State Drive 320 Series
 Intel Solid-State Drive 320 Series Enterprise Server/Storage Application Product Specification Addendum Form Factors: 1.8-inch and 2.5-inch Capacity: 80/160/300 GB (1.8-inch) 40/80/120/160/300/600 GB (2.5-inch)
VMware Virtual SAN Backup Using VMware vsphere Data Protection Advanced SEPTEMBER 2014
 VMware SAN Backup Using VMware vsphere Data Protection Advanced SEPTEMBER 2014 VMware SAN Backup Using VMware vsphere Table of Contents Introduction.... 3 vsphere Architectural Overview... 4 SAN Backup
CAVE: Channel-Aware Buffer Management Scheme for Solid State Disk
 CAVE: Channel-Aware Buffer Management Scheme for Solid State Disk Sung Kyu Park, Youngwoo Park, Gyudong Shim, and Kyu Ho Park Korea Advanced Institute of Science and Technology (KAIST) 305-701, Guseong-dong,
Windows 8 SMB 2.2 File Sharing Performance
 Windows 8 SMB 2.2 File Sharing Performance Abstract This paper provides a preliminary analysis of the performance capabilities of the Server Message Block (SMB) 2.2 file sharing protocol with 10 gigabit
ioscale: The Holy Grail for Hyperscale
 ioscale: The Holy Grail for Hyperscale The New World of Hyperscale Hyperscale describes new cloud computing deployments where hundreds or thousands of distributed servers support millions of remote, often
Intel Solid-State Drives Increase Productivity of Product Design and Simulation
 WHITE PAPER Intel Solid-State Drives Increase Productivity of Product Design and Simulation Intel Solid-State Drives Increase Productivity of Product Design and Simulation A study of how Intel Solid-State
FAWN - a Fast Array of Wimpy Nodes
 University of Warsaw January 12, 2011 Outline Introduction 1 Introduction 2 3 4 5 Key issues Introduction Growing CPU vs. I/O gap Contemporary systems must serve millions of users Electricity consumed
Comparison of Hybrid Flash Storage System Performance
 Test Validation Comparison of Hybrid Flash Storage System Performance Author: Russ Fellows March 23, 2015 Enabling you to make the best technology decisions 2015 Evaluator Group, Inc. All rights reserved.
Flash for Databases. September 22, 2015 Peter Zaitsev Percona
 Flash for Databases September 22, 2015 Peter Zaitsev Percona In this Presentation Flash technology overview Review some of the available technology What does this mean for databases? Specific opportunities
Understanding Flash SSD Performance
 Understanding Flash SSD Performance Douglas Dumitru CTO EasyCo LLC August 16, 2007 DRAFT Flash based Solid State Drives are quickly becoming popular in a wide variety of applications. Most people think
Accelerating Applications and File Systems with Solid State Storage. Jacob Farmer, Cambridge Computer
 Accelerating Applications and File Systems with Solid State Storage Jacob Farmer, Cambridge Computer SNIA Legal Notice The material contained in this tutorial is copyrighted by the SNIA unless otherwise
Solid State Storage in Massive Data Environments Erik Eyberg
 Solid State Storage in Massive Data Environments Erik Eyberg Senior Analyst Texas Memory Systems, Inc. Agenda Taxonomy Performance Considerations Reliability Considerations Q&A Solid State Storage Taxonomy
Everything you need to know about flash storage performance
 Everything you need to know about flash storage performance The unique characteristics of flash make performance validation testing immensely challenging and critically important; follow these best practices
Best Practices for Optimizing SQL Server Database Performance with the LSI WarpDrive Acceleration Card
 Best Practices for Optimizing SQL Server Database Performance with the LSI WarpDrive Acceleration Card Version 1.0 April 2011 DB15-000761-00 Revision History Version and Date Version 1.0, April 2011 Initial
Embedded Operating Systems in a Point of Sale Environment. White Paper
 Embedded Operating Systems in a Point of Sale Environment White Paper December 2008 Contents Embedded Operating Systems in a POS Environment... 3 Overview... 3 POS Operating Systems... 3 Operating Systems
An Overview of Flash Storage for Databases
 An Overview of Flash Storage for Databases Vadim Tkachenko Morgan Tocker http://percona.com MySQL CE Apr 2010 -2- Introduction Vadim Tkachenko Percona Inc, CTO and Lead of Development Morgan Tocker Percona
SSDs and RAID: What s the right strategy. Paul Goodwin VP Product Development Avant Technology
 SSDs and RAID: What s the right strategy Paul Goodwin VP Product Development Avant Technology SSDs and RAID: What s the right strategy Flash Overview SSD Overview RAID overview Thoughts about Raid Strategies
StreamStorage: High-throughput and Scalable Storage Technology for Streaming Data
 : High-throughput and Scalable Storage Technology for Streaming Data Munenori Maeda Toshihiro Ozawa Real-time analytical processing (RTAP) of vast amounts of time-series data from sensors, server logs,
Recommendations for Performance Benchmarking
 Recommendations for Performance Benchmarking Shikhar Puri Abstract Performance benchmarking of applications is increasingly becoming essential before deployment. This paper covers recommendations and best
Indexing on Solid State Drives based on Flash Memory
 Indexing on Solid State Drives based on Flash Memory Florian Keusch MASTER S THESIS Systems Group Department of Computer Science ETH Zurich http://www.systems.ethz.ch/ September 2008 - March 2009 Supervised
A Storage Architecture for High Speed Signal Processing: Embedding RAID 0 on FPGA
 Journal of Signal and Information Processing, 12, 3, 382-386 http://dx.doi.org/1.4236/jsip.12.335 Published Online August 12 (http://www.scirp.org/journal/jsip) A Storage Architecture for High Speed Signal
SOS: Software-Based Out-of-Order Scheduling for High-Performance NAND Flash-Based SSDs
 SOS: Software-Based Out-of-Order Scheduling for High-Performance NAND -Based SSDs Sangwook Shane Hahn, Sungjin Lee, and Jihong Kim Department of Computer Science and Engineering, Seoul National University,
Motivation: Smartphone Market
 Motivation: Smartphone Market Smartphone Systems External Display Device Display Smartphone Systems Smartphone-like system Main Camera Front-facing Camera Central Processing Unit Device Display Graphics
HADOOP ON ORACLE ZFS STORAGE A TECHNICAL OVERVIEW
 HADOOP ON ORACLE ZFS STORAGE A TECHNICAL OVERVIEW 757 Maleta Lane, Suite 201 Castle Rock, CO 80108 Brett Weninger, Managing Director brett.weninger@adurant.com Dave Smelker, Managing Principal dave.smelker@adurant.com
Temperature Management in Datacenters
 POWER Temperature Management in Datacenters Cranking Up the Thermostat Without Feeling the Heat NOSAYBA EL-SAYED, IOAN STEFANOVICI, GEORGE AMVROSIADIS, ANDY A. HWANG, AND BIANCA SCHROEDER Nosayba El-Sayed
SQL Server Virtualization
 The Essential Guide to SQL Server Virtualization S p o n s o r e d b y Virtualization in the Enterprise Today most organizations understand the importance of implementing virtualization. Virtualization
EFFICIENT EXTERNAL SORTING ON FLASH MEMORY EMBEDDED DEVICES
 ABSTRACT EFFICIENT EXTERNAL SORTING ON FLASH MEMORY EMBEDDED DEVICES Tyler Cossentine and Ramon Lawrence Department of Computer Science, University of British Columbia Okanagan Kelowna, BC, Canada tcossentine@gmail.com
Performance of VMware vcenter (VC) Operations in a ROBO Environment TECHNICAL WHITE PAPER
 Operations in a ROBO Environment TECHNICAL WHITE PAPER") Performance of VMware vcenter (VC) Operations in a ROBO Environment TECHNICAL WHITE PAPER Introduction Many VMware customers have virtualized their ROBO (Remote Office Branch Office) offices in order to
Performance of VMware vcenter (VC) Operations in a ROBO Environment TECHNICAL WHITE PAPER Introduction Many VMware customers have virtualized their ROBO (Remote Office Branch Office) offices in order to
IS IN-MEMORY COMPUTING MAKING THE MOVE TO PRIME TIME?
 IS IN-MEMORY COMPUTING MAKING THE MOVE TO PRIME TIME? EMC and Intel work with multiple in-memory solutions to make your databases fly Thanks to cheaper random access memory (RAM) and improved technology,
89 Fifth Avenue, 7th Floor. New York, NY 10003. www.theedison.com 212.367.7400. White Paper. HP 3PAR Adaptive Flash Cache: A Competitive Comparison
 89 Fifth Avenue, 7th Floor New York, NY 10003 www.theedison.com 212.367.7400 White Paper HP 3PAR Adaptive Flash Cache: A Competitive Comparison Printed in the United States of America Copyright 2014 Edison
FLASH GAINS GROUND AS ENTERPRISE STORAGE OPTION
 FLASH GAINS GROUND AS ENTERPRISE STORAGE OPTION With new management functions placing it closer to parity with hard drives, as well as new economies, flash is gaining traction as a standard media for mainstream
A Data De-duplication Access Framework for Solid State Drives
 JOURNAL OF INFORMATION SCIENCE AND ENGINEERING 28, 941-954 (2012) A Data De-duplication Access Framework for Solid State Drives Department of Electronic Engineering National Taiwan University of Science
Diablo and VMware TM powering SQL Server TM in Virtual SAN TM. A Diablo Technologies Whitepaper. May 2015
 A Diablo Technologies Whitepaper Diablo and VMware TM powering SQL Server TM in Virtual SAN TM May 2015 Ricky Trigalo, Director for Virtualization Solutions Architecture, Diablo Technologies Daniel Beveridge,
BENCHMARKING CLOUD DATABASES CASE STUDY on HBASE, HADOOP and CASSANDRA USING YCSB
 BENCHMARKING CLOUD DATABASES CASE STUDY on HBASE, HADOOP and CASSANDRA USING YCSB Planet Size Data!? Gartner s 10 key IT trends for 2012 unstructured data will grow some 80% over the course of the next
Choosing the Right NAND Flash Memory Technology
 Choosing the Right NAND Flash Memory Technology A Basic Introduction to NAND Flash Offerings Dean Klein Vice President of System Memory Development Micron Technology, Inc. Executive Summary A 75% increase
An Oracle White Paper May 2011. Exadata Smart Flash Cache and the Oracle Exadata Database Machine
 An Oracle White Paper May 2011 Exadata Smart Flash Cache and the Oracle Exadata Database Machine Exadata Smart Flash Cache... 2 Oracle Database 11g: The First Flash Optimized Database... 2 Exadata Smart
Samsung 3bit 3D V-NAND technology
 White Paper Samsung 3bit 3D V-NAND technology Yield more capacity, performance and power efficiency Stay abreast of increasing data demands with Samsung's innovative vertical architecture Introduction
NAND Flash Memory Reliability in Embedded Computer Systems
 WHITE PAPER NAND Flash Memory Reliability in Embedded Computer Systems Ian Olson INTRODUCTION NAND flash memory named after the NAND logic gates it is constructed from is used for nonvolatile data storage
Evaluation Report: HP Blade Server and HP MSA 16GFC Storage Evaluation
 Evaluation Report: HP Blade Server and HP MSA 16GFC Storage Evaluation Evaluation report prepared under contract with HP Executive Summary The computing industry is experiencing an increasing demand for
A New Chapter for System Designs Using NAND Flash Memory
 A New Chapter for System Designs Using Memory Jim Cooke Senior Technical Marketing Manager Micron Technology, Inc December 27, 2010 Trends and Complexities trends have been on the rise since was first
A Close Look at PCI Express SSDs. Shirish Jamthe Director of System Engineering Virident Systems, Inc. August 2011
 A Close Look at PCI Express SSDs Shirish Jamthe Director of System Engineering Virident Systems, Inc. August 2011 Macro Datacenter Trends Key driver: Information Processing Data Footprint (PB) CAGR: 100%
p-oftl: An Object-based Semantic-aware Parallel Flash Translation Layer
 p-oftl: An Object-based Semantic-aware Parallel Flash Translation Layer Wei Wang, Youyou Lu, and Jiwu Shu Department of Computer Science and Technology, Tsinghua University, Beijing, China Tsinghua National
DIABLO TECHNOLOGIES MEMORY CHANNEL STORAGE AND VMWARE VIRTUAL SAN : VDI ACCELERATION
 DIABLO TECHNOLOGIES MEMORY CHANNEL STORAGE AND VMWARE VIRTUAL SAN : VDI ACCELERATION A DIABLO WHITE PAPER AUGUST 2014 Ricky Trigalo Director of Business Development Virtualization, Diablo Technologies