Lecture 5. Displaying and Summarizing Data
|
|
|
- Kathlyn Reeves
- 7 years ago
- Views:
Transcription
1 Lecture 5 Displaying and Summarizing Data
2 Thought Question 1: If you were to read the results of a study showing that daily use of a certain exercise machine resulted in an average 10-pound weight loss, what more would you want to know about the numbers in addition to the average? (Hint: Do you think everyone who used the machine lost 10 pounds?)
3 Thought Question 2: Suppose you are comparing two job offers, and one of your considerations is the cost of living in each area. You get the local newspapers and record the price of 50 advertised apartments for each community. What summary measures of the rent values for each community would you need in order to make a useful comparison? Would lowest rent in list be enough info?
4 Thought Question 3: A real estate website reported that the median price of single family homes sold in the past 9 months in the local area was $136,900 and the average price was $161,447. How do you think these values are computed? Which do you think is more useful to someone considering the purchase of a home, the median or the average?
5 What to do when you have the data We saw in the previous chapters how to collect data. We will spend the rest of this course looking at how to analyse the data that we have collected.
6 7.1 Turning Data Into Information Four kinds of useful information about a set of data: 1. Center 2. Unusual values (outliers) 3. Variability 4. Shape
7 Numerical Data Properties Center (Location) Variation (Dispersion) Shape
8 Shape 1. Describes How Data Are Distributed 2. Measures of Shape Skew = Symmetry Left-Skewed Mean Median Mode Symmetric Mean = Median = Mode Right-Skewed Mode Median Mean
9 Definitions Mean: The Mean of a quantitative dataset is the sum of the observations in the dataset divided by the number of observations in the dataset. Median: The Median (m) of a quantitative dataset is the middle number when the observations are arranged in ascending order. Mode: The Mode of a datset is the observation that occurs most frequently in the dataset.
10 Procedure to calculate the median: M 1. Arrange all observations in order of size, from smallest to largest. 2. If the number of observations, n, is odd, the median M is the center observation in the ordered list. 3. If n is even, then M is the mean of the two center observations in the ordered list. Note: (n+1)/2 is the location of the median, not the median itself.
11 Mean, Median and Mode If the distribution is exactly symmetric, the mean, the median and the mode are exactly the same. If the distribution is skewed, the three measures differ. Mode Mean Median Mean Mode Median
12
13 Mean vs. Median Mean: easy to calculate easy to work with algebraically highly affected by outliers Not a resistant measure Median: can be time consuming to calculate more resistant to a few extreme observations (sometimes outliers) robust
14 The Mean, Median, and Mode Ordered Listing of 28 Exam Scores 32, 55, 60, 61, 62, 64, 64, 68, 73, 75, 75, 76, 78, 78, 79, 79, 80, 80, 82, 83, 84, 85, 88, 90, 92, 93, 95, 98 Mean (numerical average): Median: 78.5 (halfway between 78 and 79) Mode (most common value): no single mode exists, many occur twice.
15 Ordered Listing of 28 Exam Scores 32, 55, 60, 61, 62, 64, 64, 68, 73, 75, 75, 76, 78, 78, 79, 79, 80, 80, 82, 83, 84, 85, 88, 90, 92, 93, 95, 98 Outliers: Outliers = values far removed from rest of data. Median of 78.5 higher than mean of because one very low score (32) pulled down mean. Variability: How spread out are the values? A score of 80 compared to mean of 76 has different meaning if scores ranged from 72 to 80 versus 32 to 98.
16 Ordered Listing of 28 Exam Scores 32, 55, 60, 61, 62, 64, 64, 68, 73, 75, 75, 76, 78, 78, 79, 79, 80, 80, 82, 83, 84, 85, 88, 90, 92, 93, 95, 98 Minimum, Maximum and Range: Range = max min = = 66 points. Other variability measures include interquartile range and standard deviation. Shape: Are most values clumped in middle with values tailing off at each end? Are there two distinct groupings? Pictures of data will provide this info.
17 7.2 Picturing Data: Stemplots and Histograms Stemplot: quick and easy way to order numbers and get picture of shape. Stemplot for Exam Scores Example: 3 2 = 32 Histogram: better for larger data sets, also provides picture of shape.
18 Creating a Stemplot Step 1: Create the Stems Divide range of data into equal units to be used on stem. Have 6 15 stem values, representing equally spaced intervals. Step 1: Creating the stem Example: each of the 7 stems represents a range of 10 points in test scores
19 Creating a Stemplot Step 2: Attach the Leaves Attach a leaf to represent each data point. Next digit in number used as leaf; drop remaining digits. Example: Exam Scores 75, 95, 60, 93, First 4 scores attached. Step 2: Attaching leaves Optional Step: order leaves on each branch.
20 Further Details for Creating Stemplots Splitting Stems: Reusing digits two or five times. Stemplot A: Two times: 1 st stem = leaves 0 to 4 2 nd stem = leaves 5 to 9 Stemplot B: Five times: 1 st stem = leaves 0 and 1 2 nd stem =leaves 2 and 3, etc.
21 Example 1: Stemplot of Median Income for Families of Four Median incomes range from $46,596 (New Mexico) to $82,879 (Maryland). Stems: 4 to 8, reusing two times with leaves truncated to $1,000s. Note leaves have been ordered. Example: $46,596 would be truncated to 46,000 and shown as 4 6 Stemplot of Median Incomes: Example: 4 6 = $46,xxx Source: Federal Registry, April 15, 2003
22 Obtaining Info from the Stemplot Determine shape, identify outliers, locate center. Pulse Rates: Bell-shape Centered mid 60 s no outliers Exam Scores Outlier of 32. Apart from 55, rest uniform from the 60 s to 90 s. Median Incomes: Wide range with 4 unusually high values. Rest bell-shape around high $50,000s.
23 Creating a Histogram Divide range of data into intervals. Count how many values fall into each interval. Draw bar over each interval with height = count (or proportion). Histogram of Median Family Income Data
24 Histogram for Discrete Numerical Data 1. Draw a horizontal X-axis and on it mark the possible values taken by the observations 2. Draw a vertical Y-axis marked with either relative frequencies or frequencies 3. Above each possible value on the X-axis draw a rectangle centred on the value with width 1 and height equal to the relative frequency or frequency of that value.

25 Example 2: Heights of British Males Heights of 199 randomly selected British men, in millimeters. Bell-shaped, centered in the mid-1700s mm with no outliers. Source: Marsh, 1988, p. 315; data reproduced in Hand et al., 1994, pp

26 Example 3: The Old Faithful Geyser Times between eruptions of the Old Faithful geyser. Two clusters, one around 50 min., other around 80 min. Source: Hand et al., 1994
27 Defining a Common Language about Shape Symmetric: if draw line through center, picture on one side would be mirror image of picture on other side. Example: bell-shaped data set. Unimodal: single prominent peak Bimodal: two prominent peaks Skewed to the Right: higher values more spread out than lower values Skewed to the Left: lower values more spread out and higher ones tend to be clumped
28 Defining a Common Language About Shape When investigators speak about the "shape" of the data, they are referring to the shape of the histogram resulting from the data. Symmetric Data Sets: A data set for which the histogram is (approximately) symmetric. 10 Symmetric Histogram
29 Unimodal or Bimodal A data set is referred to as Unimodal if there is a single prominent peak in the histogram. An example is the Symmetric histogram. A data set is referred to as Bimodal is there are two prominent peaks in the histogram. 10 Bimodal Histogram
30 A Skewed Data Set is one that is basically unimodal but is substantially off from being bell-shaped Skewed Left Histogram Skewed Right Histogram NOTE: The direction of the skew is in the direction of the long tail.
31 7.3 Five Useful Numbers: A Summary The five-number summary display Median Lower Quartile Upper Quartile Lowest Highest Lowest = Minimum Highest = Maximum Median = number such that half of the values are at or above it and half are at or below it (middle value or average of two middle numbers in ordered list). Quartiles = medians of the two halves.
32 Five-Number Summary for Income n = 51 observations Lowest: $46,xxx => $46,596 Highest: $82,xxx => $82,879 Median: (51+1)/2 => 26 th value $61,xxx => $61,036 Quartiles: Lower quartile = median of lower 25 values => 13 th value, $56,xxx => $56,067; Upper quartile = median of upper 25 values => 13 th value, $66,xxx => $66,507 Median Incomes: Five-number summary for family income $61,036 $56,067 $66,507 $46,596 $82,879 Provides center and spread. Can compare gaps between extremes and quartiles, gaps between quartiles and median.
33 Example: Give the 5 number summary for the following list. 3, 5, 2, 1, 9, 7, 8, 2, 4, 5, 8, 3, 0 FIRST ORDER THE DATA!!!! Min=0 Max= 9 Median = 4 Q1 = 2 Q3 = 7 Five Number Summary: Min =0 Q1 = 2 Median = 4 Q3 = 7 Max = 9
34 Percentiles (Quantiles) Percentiles (Quantiles) are derived from the ordered data values. The pth percentile (also called the p% quantile) is the value such that p percent of the observations fall at or below it. The median = the 50 th percentile.
35 Quartiles The sample quartiles are the values that divide the sorted sample into quarters, just as the median divides it into half. The most commonly used quantiles are The median M = 50th percentile The first quartile Q1 = 25 th percentile The third quartile Q3 = 75 th percentile
36 Calculations of Quartiles The first quartile Q1 is the median of the observations who are less than the overall median. The third quartile Q3 is the median of the observations who are greater than the overall median.
37 7.4 Boxplots Visual picture of the five-number summary Example 5: How much do statistics students sleep? 190 statistics students asked how many hours they slept the night before (a Tuesday night). Five-number summary for number of hours of sleep Two students reported 16 hours; the max for the remaining 188 students was 12 hours.
38 Creating a Boxplot 1. Draw horizontal (or vertical) line, label it with values from lowest to highest in data. 2. Draw rectangle (box) with ends at quartiles. 3. Draw line in box at value of median. 4. Compute IQR = distance between quartiles. 5. Compute 1.5(IQR); outlier is any value more than this distance from closest quartile. 6. Draw line (whisker) from each end of box extending to farthest data value that is not an outlier. (If no outlier, then to min and max.) 7. Draw asterisks to indicate the outliers.
39 Creating a Boxplot for Sleep Hours 1. Draw horizontal line and label it from 3 to Draw rectangle (box) with ends at 6 and Draw line in box at median of Compute IQR = 8 6 = Compute 1.5(IQR) = 1.5(2) = 3; outlier is any value below 6 3 = 3, or above = Draw line from each end of box extending down to 3 but up to Draw asterisks at outliers of 12 and 16 hours.
40 Interpreting Boxplots Divide the data into fourths. Easily identify outliers. Useful for comparing two or more groups. Outlier: any value more than 1.5(IQR) beyond closest quartile. ¼ of students slept between 3 and 6 hours, ¼ slept between 6 and 7 hours, ¼ slept between 7 and 8 hours, and final ¼ slept between 8 and 16 hours
41 Example 6: Who Are Those Crazy Drivers? What s the fastest you have ever driven a car? mph. Males (87 Students) Females (102 Students) About 75% of men have driven 95 mph or faster, but only about 25% of women have done so. Except for few outliers (120 and 130), all women s max speeds are close to or below the median speed for men.
42 7.5 Traditional Measures: Mean, Variance, and Standard Deviation Mean: represents center Standard Deviation: represents spread or variability in the values; Variance = (standard deviation) 2 Mean and standard deviation most useful for symmetric sets of data with no outliers.
43 The Mean and When to Use It Mean most useful for symmetric data sets with no outliers. Examples: Student taking four classes. Class sizes are 20, 25, 35, and 200. What is the typical class size? Median is 30. Mean is 280/4 = 70 (distorted by the one large size of 200 students). Incomes or prices of things often skewed to the right with some large outliers. Mean is generally distorted and is larger than the median. Distribution of British male heights was roughly symmetric. Mean height is mm and median height is 1725 mm.
44 Variability: Why do we need Spread? Knowing the center of a distribution alone is not a good enough description of the data. Two basketball players with the same shooting percentage may be very different in terms of consistency. Two companies may have the same average salary, but very different distributions. We need to know the spread, or the variability of the values.
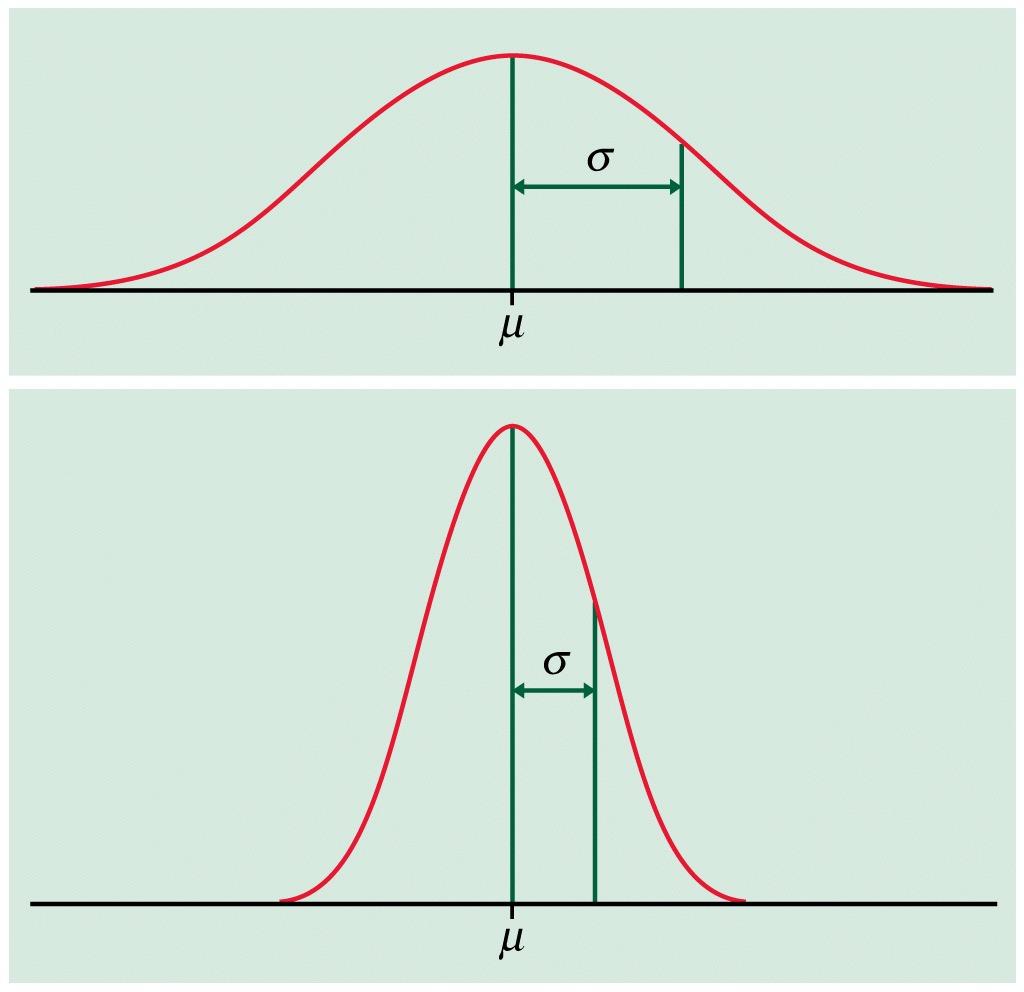
45 Numerical Measures of Variability When we want to describe a dataset providing a measure of the centre of that dataset is only part of the story. Consider the following two distributions:
46 Both of these distributions are symmetric and meana = meanb, modea=modeb and mediana=medianb. However these two distributions are obviously different, the data in A is quite spread out compared to the data in B. This spread is technically called variability and we will now examine how best to measure it.
47 The Standard Deviation and Variance Consider two sets of numbers, both with mean of 100. Numbers 100, 100, 100, 100, , 90, 100, 110, 110 Mean Standard Deviation 0 10 First set of numbers has no spread or variability at all. Second set has some spread to it; on average, the numbers are about 10 points away from the mean. The standard deviation is roughly the average distance of the observed values from their mean.
48 Computing the Standard Deviation 1. Find the mean. 2. Find the deviation of each value from the mean. Deviation = value mean. 3. Square the deviations. 4. Sum the squared deviations. 5. Divide the sum by (the number of values) 1, resulting in the variance. 6. Take the square root of the variance. The result is the standard deviation.
49 Computing the Standard Deviation Try it for the set of values: 90, 90, 100, 110, The mean is The deviations are -10, -10, 0, 10, The squared deviations are 100, 100, 0, 100, The sum of the squared deviations is The variance = 400/(5 1) = 400/4 = The standard deviation is the square root of 100, or 10.
50
51 7.6 Caution: Being Average Isn t Normal Common mistake to confuse average with normal. Example 7: How much hotter than normal is normal? October came in like a dragon Monday, hitting 101 degrees in Sacramento by late afternoon. That temperature tied the record high for Oct. 1 set in 1980 and was 17 degrees higher than normal for the date. (Korber, 2001, italics added.) Article had thermometer showing normal high for the day was 84 degrees. High temperature for Oct. 1 st is quite variable, from 70s to 90s. While 101 was a record high, it was not 17 degrees higher than normal if normal includes the range of possibilities likely to occur on that date.
52 Case Study 7.1: Detecting Exam Cheating with a Histogram Details: Summer of 1984, class of 88 students taking 40-question multiple-choice exam. Student C accused of copying answers from Student A. Of 16 questions missed by both A and C, both made same wrong guess on 13 of them. Prosecution argued match that close by chance alone very unlikely; Student C found guilty. Case challenged. Prosecution unreasonably assumed any of four wrong answers on a missed question equally likely to be chosen. Source: Boland and Proschan, Summer 1991, pp
53 Case Study 7.1: Detecting Exam Cheating with a Histogram Second Trial: For each student (except A), counted how many of his or her 40 answers matched the answers on A s paper. Histogram shows Student C as obvious outlier. Quite unusual for C to match A s answers so well without some explanation other than chance. Defense argued based on histogram, A could have been copying from C. Guilty verdict overturned. However, Student C was seen looking at Student A s paper jury forgot to account for that.
54 For Those Who Like Formulas
Introduction to Environmental Statistics. The Big Picture. Populations and Samples. Sample Data. Examples of sample data
 A Few Sources for Data Examples Used Introduction to Environmental Statistics Professor Jessica Utts University of California, Irvine jutts@uci.edu 1. Statistical Methods in Water Resources by D.R. Helsel
Chapter 1: Looking at Data Section 1.1: Displaying Distributions with Graphs
 Types of Variables Chapter 1: Looking at Data Section 1.1: Displaying Distributions with Graphs Quantitative (numerical)variables: take numerical values for which arithmetic operations make sense (addition/averaging)
AP * Statistics Review. Descriptive Statistics
 AP * Statistics Review Descriptive Statistics Teacher Packet Advanced Placement and AP are registered trademark of the College Entrance Examination Board. The College Board was not involved in the production
STATS8: Introduction to Biostatistics. Data Exploration. Babak Shahbaba Department of Statistics, UCI
 STATS8: Introduction to Biostatistics Data Exploration Babak Shahbaba Department of Statistics, UCI Introduction After clearly defining the scientific problem, selecting a set of representative members
Center: Finding the Median. Median. Spread: Home on the Range. Center: Finding the Median (cont.)
") Center: Finding the Median When we think of a typical value, we usually look for the center of the distribution. For a unimodal, symmetric distribution, it s easy to find the center it s just the center
Center: Finding the Median When we think of a typical value, we usually look for the center of the distribution. For a unimodal, symmetric distribution, it s easy to find the center it s just the center
Exploratory data analysis (Chapter 2) Fall 2011
 Fall 2011") Exploratory data analysis (Chapter 2) Fall 2011 Data Examples Example 1: Survey Data 1 Data collected from a Stat 371 class in Fall 2005 2 They answered questions about their: gender, major, year in school,
Exploratory data analysis (Chapter 2) Fall 2011 Data Examples Example 1: Survey Data 1 Data collected from a Stat 371 class in Fall 2005 2 They answered questions about their: gender, major, year in school,
Lecture 1: Review and Exploratory Data Analysis (EDA)
") Lecture 1: Review and Exploratory Data Analysis (EDA) Sandy Eckel seckel@jhsph.edu Department of Biostatistics, The Johns Hopkins University, Baltimore USA 21 April 2008 1 / 40 Course Information I Course
Lecture 1: Review and Exploratory Data Analysis (EDA) Sandy Eckel seckel@jhsph.edu Department of Biostatistics, The Johns Hopkins University, Baltimore USA 21 April 2008 1 / 40 Course Information I Course
The right edge of the box is the third quartile, Q 3, which is the median of the data values above the median. Maximum Median
 CONDENSED LESSON 2.1 Box Plots In this lesson you will create and interpret box plots for sets of data use the interquartile range (IQR) to identify potential outliers and graph them on a modified box
Descriptive Statistics
 Y520 Robert S Michael Goal: Learn to calculate indicators and construct graphs that summarize and describe a large quantity of values. Using the textbook readings and other resources listed on the web
Chapter 1: Exploring Data
 Chapter 1: Exploring Data Chapter 1 Review 1. As part of survey of college students a researcher is interested in the variable class standing. She records a 1 if the student is a freshman, a 2 if the student
Exploratory Data Analysis
 Exploratory Data Analysis Johannes Schauer johannes.schauer@tugraz.at Institute of Statistics Graz University of Technology Steyrergasse 17/IV, 8010 Graz www.statistics.tugraz.at February 12, 2008 Introduction
Exercise 1.12 (Pg. 22-23)
") Individuals: The objects that are described by a set of data. They may be people, animals, things, etc. (Also referred to as Cases or Records) Variables: The characteristics recorded about each individual.
Individuals: The objects that are described by a set of data. They may be people, animals, things, etc. (Also referred to as Cases or Records) Variables: The characteristics recorded about each individual.
Variables. Exploratory Data Analysis
 Exploratory Data Analysis Exploratory Data Analysis involves both graphical displays of data and numerical summaries of data. A common situation is for a data set to be represented as a matrix. There is
Pie Charts. proportion of ice-cream flavors sold annually by a given brand. AMS-5: Statistics. Cherry. Cherry. Blueberry. Blueberry. Apple.
 Graphical Representations of Data, Mean, Median and Standard Deviation In this class we will consider graphical representations of the distribution of a set of data. The goal is to identify the range of
a. mean b. interquartile range c. range d. median
 3. Since 4. The HOMEWORK 3 Due: Feb.3 1. A set of data are put in numerical order, and a statistic is calculated that divides the data set into two equal parts with one part below it and the other part
Data Exploration Data Visualization
 Data Exploration Data Visualization What is data exploration? A preliminary exploration of the data to better understand its characteristics. Key motivations of data exploration include Helping to select
HISTOGRAMS, CUMULATIVE FREQUENCY AND BOX PLOTS
 Mathematics Revision Guides Histograms, Cumulative Frequency and Box Plots Page 1 of 25 M.K. HOME TUITION Mathematics Revision Guides Level: GCSE Higher Tier HISTOGRAMS, CUMULATIVE FREQUENCY AND BOX PLOTS
AP Statistics Solutions to Packet 2
 AP Statistics Solutions to Packet 2 The Normal Distributions Density Curves and the Normal Distribution Standard Normal Calculations HW #9 1, 2, 4, 6-8 2.1 DENSITY CURVES (a) Sketch a density curve that
Descriptive statistics Statistical inference statistical inference, statistical induction and inferential statistics
 Descriptive statistics is the discipline of quantitatively describing the main features of a collection of data. Descriptive statistics are distinguished from inferential statistics (or inductive statistics),
Descriptive Statistics and Measurement Scales
 Descriptive Statistics 1 Descriptive Statistics and Measurement Scales Descriptive statistics are used to describe the basic features of the data in a study. They provide simple summaries about the sample
The Big Picture. Describing Data: Categorical and Quantitative Variables Population. Descriptive Statistics. Community Coalitions (n = 175)
") Describing Data: Categorical and Quantitative Variables Population The Big Picture Sampling Statistical Inference Sample Exploratory Data Analysis Descriptive Statistics In order to make sense of data,
Describing Data: Categorical and Quantitative Variables Population The Big Picture Sampling Statistical Inference Sample Exploratory Data Analysis Descriptive Statistics In order to make sense of data,
1.3 Measuring Center & Spread, The Five Number Summary & Boxplots. Describing Quantitative Data with Numbers
 1.3 Measuring Center & Spread, The Five Number Summary & Boxplots Describing Quantitative Data with Numbers 1.3 I can n Calculate and interpret measures of center (mean, median) in context. n Calculate
Diagrams and Graphs of Statistical Data
 Diagrams and Graphs of Statistical Data One of the most effective and interesting alternative way in which a statistical data may be presented is through diagrams and graphs. There are several ways in
Lesson 4 Measures of Central Tendency
 Outline Measures of a distribution s shape -modality and skewness -the normal distribution Measures of central tendency -mean, median, and mode Skewness and Central Tendency Lesson 4 Measures of Central
BNG 202 Biomechanics Lab. Descriptive statistics and probability distributions I
 BNG 202 Biomechanics Lab Descriptive statistics and probability distributions I Overview The overall goal of this short course in statistics is to provide an introduction to descriptive and inferential
Northumberland Knowledge
 Northumberland Knowledge Know Guide How to Analyse Data - November 2012 - This page has been left blank 2 About this guide The Know Guides are a suite of documents that provide useful information about
Means, standard deviations and. and standard errors
 CHAPTER 4 Means, standard deviations and standard errors 4.1 Introduction Change of units 4.2 Mean, median and mode Coefficient of variation 4.3 Measures of variation 4.4 Calculating the mean and standard
consider the number of math classes taken by math 150 students. how can we represent the results in one number?
 ch 3: numerically summarizing data - center, spread, shape 3.1 measure of central tendency or, give me one number that represents all the data consider the number of math classes taken by math 150 students.
Mind on Statistics. Chapter 2
 Mind on Statistics Chapter 2 Sections 2.1 2.3 1. Tallies and cross-tabulations are used to summarize which of these variable types? A. Quantitative B. Mathematical C. Continuous D. Categorical 2. The table
Summarizing and Displaying Categorical Data
 Summarizing and Displaying Categorical Data Categorical data can be summarized in a frequency distribution which counts the number of cases, or frequency, that fall into each category, or a relative frequency
MEASURES OF VARIATION
 NORMAL DISTRIBTIONS MEASURES OF VARIATION In statistics, it is important to measure the spread of data. A simple way to measure spread is to find the range. But statisticians want to know if the data are
2. Here is a small part of a data set that describes the fuel economy (in miles per gallon) of 2006 model motor vehicles.
 of 2006 model motor vehicles.") Math 1530-017 Exam 1 February 19, 2009 Name Student Number E There are five possible responses to each of the following multiple choice questions. There is only on BEST answer. Be sure to read all possible
Math 1530-017 Exam 1 February 19, 2009 Name Student Number E There are five possible responses to each of the following multiple choice questions. There is only on BEST answer. Be sure to read all possible
Lecture 2. Summarizing the Sample
 Lecture 2 Summarizing the Sample WARNING: Today s lecture may bore some of you It s (sort of) not my fault I m required to teach you about what we re going to cover today. I ll try to make it as exciting
3: Summary Statistics
 3: Summary Statistics Notation Let s start by introducing some notation. Consider the following small data set: 4 5 30 50 8 7 4 5 The symbol n represents the sample size (n = 0). The capital letter X denotes
Statistics Chapter 2
 Statistics Chapter 2 Frequency Tables A frequency table organizes quantitative data. partitions data into classes (intervals). shows how many data values are in each class. Test Score Number of Students
MATH 103/GRACEY PRACTICE EXAM/CHAPTERS 2-3. MULTIPLE CHOICE. Choose the one alternative that best completes the statement or answers the question.
 MATH 3/GRACEY PRACTICE EXAM/CHAPTERS 2-3 Name MULTIPLE CHOICE. Choose the one alternative that best completes the statement or answers the question. Provide an appropriate response. 1) The frequency distribution
Sampling and Descriptive Statistics
 Sampling and Descriptive Statistics Berlin Chen Department of Computer Science & Information Engineering National Taiwan Normal University Reference: 1. W. Navidi. Statistics for Engineering and Scientists.
Exploratory Data Analysis. Psychology 3256
 Exploratory Data Analysis Psychology 3256 1 Introduction If you are going to find out anything about a data set you must first understand the data Basically getting a feel for you numbers Easier to find
Introduction to Statistics for Psychology. Quantitative Methods for Human Sciences
 Introduction to Statistics for Psychology and Quantitative Methods for Human Sciences Jonathan Marchini Course Information There is website devoted to the course at http://www.stats.ox.ac.uk/ marchini/phs.html
EXAM #1 (Example) Instructor: Ela Jackiewicz. Relax and good luck!
 Instructor: Ela Jackiewicz. Relax and good luck!") STP 231 EXAM #1 (Example) Instructor: Ela Jackiewicz Honor Statement: I have neither given nor received information regarding this exam, and I will not do so until all exams have been graded and returned.
STP 231 EXAM #1 (Example) Instructor: Ela Jackiewicz Honor Statement: I have neither given nor received information regarding this exam, and I will not do so until all exams have been graded and returned.
Mean = (sum of the values / the number of the value) if probabilities are equal
 if probabilities are equal") Population Mean Mean = (sum of the values / the number of the value) if probabilities are equal Compute the population mean Population/Sample mean: 1. Collect the data 2. sum all the values in the population/sample.
Population Mean Mean = (sum of the values / the number of the value) if probabilities are equal Compute the population mean Population/Sample mean: 1. Collect the data 2. sum all the values in the population/sample.
Shape of Data Distributions
 Lesson 13 Main Idea Describe a data distribution by its center, spread, and overall shape. Relate the choice of center and spread to the shape of the distribution. New Vocabulary distribution symmetric
Name: Date: Use the following to answer questions 2-3:
 Name: Date: 1. A study is conducted on students taking a statistics class. Several variables are recorded in the survey. Identify each variable as categorical or quantitative. A) Type of car the student
Statistics Revision Sheet Question 6 of Paper 2
 Statistics Revision Sheet Question 6 of Paper The Statistics question is concerned mainly with the following terms. The Mean and the Median and are two ways of measuring the average. sumof values no. of
Module 4: Data Exploration
 Module 4: Data Exploration Now that you have your data downloaded from the Streams Project database, the detective work can begin! Before computing any advanced statistics, we will first use descriptive
Descriptive Statistics. Purpose of descriptive statistics Frequency distributions Measures of central tendency Measures of dispersion
 Descriptive Statistics Purpose of descriptive statistics Frequency distributions Measures of central tendency Measures of dispersion Statistics as a Tool for LIS Research Importance of statistics in research
Week 1. Exploratory Data Analysis
 Week 1 Exploratory Data Analysis Practicalities This course ST903 has students from both the MSc in Financial Mathematics and the MSc in Statistics. Two lectures and one seminar/tutorial per week. Exam
Students summarize a data set using box plots, the median, and the interquartile range. Students use box plots to compare two data distributions.
 Student Outcomes Students summarize a data set using box plots, the median, and the interquartile range. Students use box plots to compare two data distributions. Lesson Notes The activities in this lesson
First Midterm Exam (MATH1070 Spring 2012)
") First Midterm Exam (MATH1070 Spring 2012) Instructions: This is a one hour exam. You can use a notecard. Calculators are allowed, but other electronics are prohibited. 1. [40pts] Multiple Choice Problems
First Midterm Exam (MATH1070 Spring 2012) Instructions: This is a one hour exam. You can use a notecard. Calculators are allowed, but other electronics are prohibited. 1. [40pts] Multiple Choice Problems
4.1 Exploratory Analysis: Once the data is collected and entered, the first question is: "What do the data look like?"
 Data Analysis Plan The appropriate methods of data analysis are determined by your data types and variables of interest, the actual distribution of the variables, and the number of cases. Different analyses
Density Curve. A density curve is the graph of a continuous probability distribution. It must satisfy the following properties:
 Density Curve A density curve is the graph of a continuous probability distribution. It must satisfy the following properties: 1. The total area under the curve must equal 1. 2. Every point on the curve
DESCRIPTIVE STATISTICS. The purpose of statistics is to condense raw data to make it easier to answer specific questions; test hypotheses.
 DESCRIPTIVE STATISTICS The purpose of statistics is to condense raw data to make it easier to answer specific questions; test hypotheses. DESCRIPTIVE VS. INFERENTIAL STATISTICS Descriptive To organize,
Bar Graphs and Dot Plots
 CONDENSED L E S S O N 1.1 Bar Graphs and Dot Plots In this lesson you will interpret and create a variety of graphs find some summary values for a data set draw conclusions about a data set based on graphs
MBA 611 STATISTICS AND QUANTITATIVE METHODS
 MBA 611 STATISTICS AND QUANTITATIVE METHODS Part I. Review of Basic Statistics (Chapters 1-11) A. Introduction (Chapter 1) Uncertainty: Decisions are often based on incomplete information from uncertain
Def: The standard normal distribution is a normal probability distribution that has a mean of 0 and a standard deviation of 1.
 Lecture 6: Chapter 6: Normal Probability Distributions A normal distribution is a continuous probability distribution for a random variable x. The graph of a normal distribution is called the normal curve.
Common Tools for Displaying and Communicating Data for Process Improvement
 Common Tools for Displaying and Communicating Data for Process Improvement Packet includes: Tool Use Page # Box and Whisker Plot Check Sheet Control Chart Histogram Pareto Diagram Run Chart Scatter Plot
Geostatistics Exploratory Analysis
 Instituto Superior de Estatística e Gestão de Informação Universidade Nova de Lisboa Master of Science in Geospatial Technologies Geostatistics Exploratory Analysis Carlos Alberto Felgueiras cfelgueiras@isegi.unl.pt
Interpreting Data in Normal Distributions
 Interpreting Data in Normal Distributions This curve is kind of a big deal. It shows the distribution of a set of test scores, the results of rolling a die a million times, the heights of people on Earth,
Midterm Review Problems
 Midterm Review Problems October 19, 2013 1. Consider the following research title: Cooperation among nursery school children under two types of instruction. In this study, what is the independent variable?
The Normal Distribution
 Chapter 6 The Normal Distribution 6.1 The Normal Distribution 1 6.1.1 Student Learning Objectives By the end of this chapter, the student should be able to: Recognize the normal probability distribution
How To Write A Data Analysis
 Mathematics Probability and Statistics Curriculum Guide Revised 2010 This page is intentionally left blank. Introduction The Mathematics Curriculum Guide serves as a guide for teachers when planning instruction
Classify the data as either discrete or continuous. 2) An athlete runs 100 meters in 10.5 seconds. 2) A) Discrete B) Continuous
 An athlete runs 100 meters in 10.5 seconds. 2) A) Discrete B) Continuous") Chapter 2 Overview Name MULTIPLE CHOICE. Choose the one alternative that best completes the statement or answers the question. Classify as categorical or qualitative data. 1) A survey of autos parked in
Chapter 2 Overview Name MULTIPLE CHOICE. Choose the one alternative that best completes the statement or answers the question. Classify as categorical or qualitative data. 1) A survey of autos parked in
Lecture 2: Descriptive Statistics and Exploratory Data Analysis
 Lecture 2: Descriptive Statistics and Exploratory Data Analysis Further Thoughts on Experimental Design 16 Individuals (8 each from two populations) with replicates Pop 1 Pop 2 Randomly sample 4 individuals
THE BINOMIAL DISTRIBUTION & PROBABILITY
 REVISION SHEET STATISTICS 1 (MEI) THE BINOMIAL DISTRIBUTION & PROBABILITY The main ideas in this chapter are Probabilities based on selecting or arranging objects Probabilities based on the binomial distribution
5/31/2013. 6.1 Normal Distributions. Normal Distributions. Chapter 6. Distribution. The Normal Distribution. Outline. Objectives.
 The Normal Distribution C H 6A P T E R The Normal Distribution Outline 6 1 6 2 Applications of the Normal Distribution 6 3 The Central Limit Theorem 6 4 The Normal Approximation to the Binomial Distribution
1) Write the following as an algebraic expression using x as the variable: Triple a number subtracted from the number
 Write the following as an algebraic expression using x as the variable: Triple a number subtracted from the number") 1) Write the following as an algebraic expression using x as the variable: Triple a number subtracted from the number A. 3(x - x) B. x 3 x C. 3x - x D. x - 3x 2) Write the following as an algebraic expression
1) Write the following as an algebraic expression using x as the variable: Triple a number subtracted from the number A. 3(x - x) B. x 3 x C. 3x - x D. x - 3x 2) Write the following as an algebraic expression
Topic 9 ~ Measures of Spread
 AP Statistics Topic 9 ~ Measures of Spread Activity 9 : Baseball Lineups The table to the right contains data on the ages of the two teams involved in game of the 200 National League Division Series. Is
Describing, Exploring, and Comparing Data
 24 Chapter 2. Describing, Exploring, and Comparing Data Chapter 2. Describing, Exploring, and Comparing Data There are many tools used in Statistics to visualize, summarize, and describe data. This chapter
Descriptive Statistics
 Descriptive Statistics Suppose following data have been collected (heights of 99 five-year-old boys) 117.9 11.2 112.9 115.9 18. 14.6 17.1 117.9 111.8 16.3 111. 1.4 112.1 19.2 11. 15.4 99.4 11.1 13.3 16.9
Section 1.3 Exercises (Solutions)
") Section 1.3 Exercises (s) 1.109, 1.110, 1.111, 1.114*, 1.115, 1.119*, 1.122, 1.125, 1.127*, 1.128*, 1.131*, 1.133*, 1.135*, 1.137*, 1.139*, 1.145*, 1.146-148. 1.109 Sketch some normal curves. (a) Sketch
Section 1.3 Exercises (s) 1.109, 1.110, 1.111, 1.114*, 1.115, 1.119*, 1.122, 1.125, 1.127*, 1.128*, 1.131*, 1.133*, 1.135*, 1.137*, 1.139*, 1.145*, 1.146-148. 1.109 Sketch some normal curves. (a) Sketch
Biostatistics: DESCRIPTIVE STATISTICS: 2, VARIABILITY
 Biostatistics: DESCRIPTIVE STATISTICS: 2, VARIABILITY 1. Introduction Besides arriving at an appropriate expression of an average or consensus value for observations of a population, it is important to
Chapter 3. The Normal Distribution
 Chapter 3. The Normal Distribution Topics covered in this chapter: Z-scores Normal Probabilities Normal Percentiles Z-scores Example 3.6: The standard normal table The Problem: What proportion of observations
The Effect of Dropping a Ball from Different Heights on the Number of Times the Ball Bounces
 The Effect of Dropping a Ball from Different Heights on the Number of Times the Ball Bounces Or: How I Learned to Stop Worrying and Love the Ball Comment [DP1]: Titles, headings, and figure/table captions
3 Describing Distributions
 www.ck12.org CHAPTER 3 Describing Distributions Chapter Outline 3.1 MEASURES OF CENTER 3.2 RANGE AND INTERQUARTILE RANGE 3.3 FIVE-NUMBER SUMMARY 3.4 INTERPRETING BOX-AND-WHISKER PLOTS 3.5 REFERENCES 46
TEACHER NOTES MATH NSPIRED
 Math Objectives Students will understand that normal distributions can be used to approximate binomial distributions whenever both np and n(1 p) are sufficiently large. Students will understand that when
Chapter 2: Frequency Distributions and Graphs
 Chapter 2: Frequency Distributions and Graphs Learning Objectives Upon completion of Chapter 2, you will be able to: Organize the data into a table or chart (called a frequency distribution) Construct
2 Describing, Exploring, and
 2 Describing, Exploring, and Comparing Data This chapter introduces the graphical plotting and summary statistics capabilities of the TI- 83 Plus. First row keys like \ R (67$73/276 are used to obtain
Summary of Formulas and Concepts. Descriptive Statistics (Ch. 1-4)
") Summary of Formulas and Concepts Descriptive Statistics (Ch. 1-4) Definitions Population: The complete set of numerical information on a particular quantity in which an investigator is interested. We assume
Summary of Formulas and Concepts Descriptive Statistics (Ch. 1-4) Definitions Population: The complete set of numerical information on a particular quantity in which an investigator is interested. We assume
2. Filling Data Gaps, Data validation & Descriptive Statistics
 2. Filling Data Gaps, Data validation & Descriptive Statistics Dr. Prasad Modak Background Data collected from field may suffer from these problems Data may contain gaps ( = no readings during this period)
+ Chapter 1 Exploring Data
 Chapter 1 Exploring Data Introduction: Data Analysis: Making Sense of Data 1.1 Analyzing Categorical Data 1.2 Displaying Quantitative Data with Graphs 1.3 Describing Quantitative Data with Numbers Introduction
Probability Distributions
 Learning Objectives Probability Distributions Section 1: How Can We Summarize Possible Outcomes and Their Probabilities? 1. Random variable 2. Probability distributions for discrete random variables 3.
6 3 The Standard Normal Distribution
 290 Chapter 6 The Normal Distribution Figure 6 5 Areas Under a Normal Distribution Curve 34.13% 34.13% 2.28% 13.59% 13.59% 2.28% 3 2 1 + 1 + 2 + 3 About 68% About 95% About 99.7% 6 3 The Distribution Since
Sta 309 (Statistics And Probability for Engineers)
") Instructor: Prof. Mike Nasab Sta 309 (Statistics And Probability for Engineers) Chapter 2 Organizing and Summarizing Data Raw Data: When data are collected in original form, they are called raw data. The
Instructor: Prof. Mike Nasab Sta 309 (Statistics And Probability for Engineers) Chapter 2 Organizing and Summarizing Data Raw Data: When data are collected in original form, they are called raw data. The
Chapter 2 Data Exploration
 Chapter 2 Data Exploration 2.1 Data Visualization and Summary Statistics After clearly defining the scientific question we try to answer, selecting a set of representative members from the population of
6.4 Normal Distribution
 Contents 6.4 Normal Distribution....................... 381 6.4.1 Characteristics of the Normal Distribution....... 381 6.4.2 The Standardized Normal Distribution......... 385 6.4.3 Meaning of Areas under
Box-and-Whisker Plots
 Mathematics Box-and-Whisker Plots About this Lesson This is a foundational lesson for box-and-whisker plots (boxplots), a graphical tool used throughout statistics for displaying data. During the lesson,
Statistics E100 Fall 2013 Practice Midterm I - A Solutions
 STATISTICS E100 FALL 2013 PRACTICE MIDTERM I - A SOLUTIONS PAGE 1 OF 5 Statistics E100 Fall 2013 Practice Midterm I - A Solutions 1. (16 points total) Below is the histogram for the number of medals won
CA200 Quantitative Analysis for Business Decisions. File name: CA200_Section_04A_StatisticsIntroduction
 CA200 Quantitative Analysis for Business Decisions File name: CA200_Section_04A_StatisticsIntroduction Table of Contents 4. Introduction to Statistics... 1 4.1 Overview... 3 4.2 Discrete or continuous
seven Statistical Analysis with Excel chapter OVERVIEW CHAPTER
 seven Statistical Analysis with Excel CHAPTER chapter OVERVIEW 7.1 Introduction 7.2 Understanding Data 7.3 Relationships in Data 7.4 Distributions 7.5 Summary 7.6 Exercises 147 148 CHAPTER 7 Statistical
Statistics. Measurement. Scales of Measurement 7/18/2012
 Statistics Measurement Measurement is defined as a set of rules for assigning numbers to represent objects, traits, attributes, or behaviors A variableis something that varies (eye color), a constant does
How Far is too Far? Statistical Outlier Detection
 How Far is too Far? Statistical Outlier Detection Steven Walfish President, Statistical Outsourcing Services steven@statisticaloutsourcingservices.com 30-325-329 Outline What is an Outlier, and Why are
determining relationships among the explanatory variables, and
 Chapter 4 Exploratory Data Analysis A first look at the data. As mentioned in Chapter 1, exploratory data analysis or EDA is a critical first step in analyzing the data from an experiment. Here are the
Box-and-Whisker Plots
 Learning Standards HSS-ID.A. HSS-ID.A.3 3 9 23 62 3 COMMON CORE.2 Numbers of First Cousins 0 3 9 3 45 24 8 0 3 3 6 8 32 8 0 5 4 Box-and-Whisker Plots Essential Question How can you use a box-and-whisker
Exploratory Data Analysis
 Exploratory Data Analysis Paul Cohen ISTA 370 Spring, 2012 Paul Cohen ISTA 370 () Exploratory Data Analysis Spring, 2012 1 / 46 Outline Data, revisited The purpose of exploratory data analysis Learning
Characteristics of Binomial Distributions
 Lesson2 Characteristics of Binomial Distributions In the last lesson, you constructed several binomial distributions, observed their shapes, and estimated their means and standard deviations. In Investigation
Descriptive statistics parameters: Measures of centrality
 Descriptive statistics parameters: Measures of centrality Contents Definitions... 3 Classification of descriptive statistics parameters... 4 More about central tendency estimators... 5 Relationship between
Frequency Distributions
 Descriptive Statistics Dr. Tom Pierce Department of Psychology Radford University Descriptive statistics comprise a collection of techniques for better understanding what the people in a group look like
Good luck! BUSINESS STATISTICS FINAL EXAM INSTRUCTIONS. Name:
 Glo bal Leadership M BA BUSINESS STATISTICS FINAL EXAM Name: INSTRUCTIONS 1. Do not open this exam until instructed to do so. 2. Be sure to fill in your name before starting the exam. 3. You have two hours
BASIC STATISTICAL METHODS FOR GENOMIC DATA ANALYSIS
 BASIC STATISTICAL METHODS FOR GENOMIC DATA ANALYSIS SEEMA JAGGI Indian Agricultural Statistics Research Institute Library Avenue, New Delhi-110 012 seema@iasri.res.in Genomics A genome is an organism s