Biological Survey, Assessment and Management Recommendations for Ayer s Ponds
|
|
|
- Janel Brown
- 7 years ago
- Views:
Transcription


1 Biological Survey, Assessment and Management Recommendations for Ayer s Ponds Final Report May 2016 i Prepared for: Ayer Conservation Commission Town Hall One Main Street Ayer, MA 01432
2 Contents Executive Summary... 1 Section 1. Water Quality Water Quality Sampling Methodology Water Quality Sampling Results Recommendations for Continued Water Quality Sampling Sampling Locations Sampling Parameters, Methods, and Equipment Sampling Frequency, Timing, and Costs Trophic Status Assessments Section 2. Phosphorus Budgets and Modeling Phosphorus Budgets Phosphorus in Stormwater Runoff Phosphorus from Septic Systems Phosphorus from Aerial Deposition Phosphorus Concentration Modeling Mean Lake Depth and Hydraulic Residence Time Vollenweider Model Water Quality Goals Section 3. Aquatic Vegetation Surveys Methodology Vegetation Survey Results Aquatic Plant Management Recommendations Balch Pond Grove Pond Lower Long Pond Pine Meadow Pond Sandy Pond Flannagan Pond Section 4. Field Watershed Investigation Watershed BMP Recommendations Section 5. Recommended 5-Year Management Plan Attachment Grove Pond Human Health Recreational Risk Assessment (October 2014) i
3 List of Tables Table 1.1 Water Quality Sampling Locations Table 1.2 Water Quality Sampling Results Table 1.3 Carlson TSI Results for Ayer Ponds Table 2.1 Simple Method Calculation of Phosphorus Load - Lower Long Pond Watershed Table 2.2 Simple Method Calculation of Phosphorus Load - Sandy Pond Watershed Table 2.3 Simple Method Calculation of Phosphorus Load - Pine Meadow Pond Watershed Table 2.4 Simple Method Calculation of Phosphorus Load - Flannagan Pond Watershed Table 2.5 Simple Method Calculation of Phosphorus Load - Balch Pond Watershed Table 2.6 Simple Method Calculation of Phosphorus Load - Grove Pond Watershed Table 2.7 Aerial Phosphorus Deposition to Ayer Ponds Table 2.8 Hydrologic (Water Budget) Modeling Results Table 2.9 Lower Long Pond Vollenweider Calculation Table 2.10 Sandy Pond Vollenweider Calculation Table 2.11 Pine Meadow Pond Vollenweider Calculation Table 2.12 Flannagan Pond Vollenweider Calculation Table 2.13 Balch Pond Vollenweider Calculation Table 2.14 Grove Pond Vollenweider Calculation Table 2.15 Summary of Vollenweider Modeling Results Table 2.16 Recommended Phosphorus Concentration Goals Table 3.1 Key to Plant Density and Biomass Ratings Table 3.2 Comparative Summary of Ayer Ponds Vegetation Surveys Table 3.3 Balch Pond - Aquatic Vegetation Survey Tally Sheet Table 3.4 Grove Pond - Aquatic Vegetation Survey Tally Sheet Table 3.5 Lower Long Pond - Aquatic Vegetation Survey Tally Sheet Table 3.6 Pine Meadow Pond - Aquatic Vegetation Survey Tally Sheet Table 3.7 Sandy Pond - Aquatic Vegetation Survey Tally Sheet Table 3.8 Flannagan Pond - Aquatic Vegetation Survey Tally Sheet Table 4.1 Stormwater BMP Construction Cost Estimates Table 5.1 Recommended 5-Year Management Plan List of Figures Figure 1.1 Ayer Ponds Sampling Locations... 5 Figure 1.2 Dissolved Oxygen and Temperature Profiles for the Ayer Ponds... 7 Figure 1.3 Carlson Trophic State Index Figure 2.1 Conceptual Pond Phosphorus Dynamics Figure 2.2 Annual Precipitation, Ashburnham COOP ID: , Figure 2.3 Land Use - Lower Long Pond Watershed Figure 2.4 Land Use - Sandy Pond Watershed Figure 2.5 Land Use - Pine Meadow Pond Watershed Figure 2.6 Land Use - Balch Pond Watershed Figure 2.7 Land Use - Flannagan Pond Watershed Figure 2.8 Land Use - Grove Pond Watershed Figure 2.9 Impervious Surfaces - Lower Long Pond Watershed Figure 2.10 Impervious Surfaces - Sandy Pond Watershed Figure 2.11 Impervious Surfaces - Pine Meadow Pond Watershed Figure 2.12 Impervious Surfaces - Balch Pond Watershed Figure 2.13 Impervious Surfaces - Flannagan Pond Watershed Figure 2.14 Impervious Surfaces - Grove Pond Watershed Figure 2.15 Area-Discharge Relationship for New England USGS Stream Gages (<3000 acres) Figure 2.16 Comparison of Modeled and Observed Phosphorus Concentrations in Ayer Ponds Figure 2.17 Estimated Phosphorus Load Reductions Needed to Reduce Pond TP Concentration by 1 ug/l Figure 3.1 Balch Pond Aquatic Vegetation Density Figure 3.2 Grove Pond Aquatic Vegetation Density Figure 3.3 Lower Long Pond Aquatic Vegetation Density Figure 3.4 Pine Meadow Pond Aquatic Vegetation Density Figure 3.5 Sandy Pond Aquatic Vegetation Density Figure 3.6 Flannagan Pond Aquatic Vegetation Density Figure 4.1 Ayer Ponds Potential BMP Improvement Sites Figure 4.2 Ayer Ponds Hydrologic Soil Classifications ii
4 Executive Summary Project Overview Geosyntec Consultants, Inc. (Geosyntec) was contracted by the Ayer Conservation Commission to conduct water quality sampling, water quality modeling, aquatic vegetation assessments, and watershed investigations for Balch Pond, Grove Pond, Lower Long Pond, Pine Meadow Pond, Sandy Pond, and Flannagan Pond. These interconnected ponds exhibit a wide range of water quality and ecological conditions, public uses, and resource management challenges. The Conservation Commission s primary project objective was to establish an updated, scientific basis for the long-term management of these important ecological and recreational resources. Specific project tasks and goals included the following: 1. Conduct water quality sampling to (a) provide an updated baseline on pond conditions, and (b) provide the basis for recommendations for a continued monitoring program. 2. Conduct lake modeling to characterize each pond s biological productivity and response to changes in phosphorus loading (e.g., stormwater management improvements). Phosphorus (P) is typically the nutrient that has the most influence on abundance of algae and aquatic plants in ponds. High P levels are often associated with nuisance algae blooms and nuisance plant growth. 3. Assess each pond s vegetation and provide management recommendations. This information will provide a baseline for tracking plant abundance and species composition over time and in response to management efforts. It also provides an assessment of each pond s plant community with regard to beneficial native species and invasive, non-native species that may require control. 4. Conduct a field investigation to identify recommended best management practices (BMPs) for stormwater management and phosphorus load reduction for the six ponds. 5. A human health risk assessment was performed for Grove Pond. This assessment was conducted to evaluate the potential cancer and non-cancer risks from exposure to Grove Pond water and sediment during recreational use of the pond and adjacent Pirone Park. This assessment is provided as an Attachment to this report. Summary of Findings Table 5.1 (Recommended 5-Year Management Plan) provides estimated costs and a schedule for pond management actions and monitoring recommended for the 5-year period of Water Quality/Trophic State The Carlson Trophic State Index (TSI) characterizes pond biological productivity based on water clarity, total phosphorus, and chlorophyll-a. The TSI indicates that the ponds range from mesotrophic (moderate productivity) to eutrophic (high productivity). Ponds in the headwaters of the system (Pine Meadow, Lower Long, and Sandy Ponds) generally had mesotrophic conditions. Flannagan Pond was the most highly eutrophic pond according to the TSI, indicating conditions that support abundant plant and algae growth. Although the August 2014 sampling results begin to characterize conditions for each pond, additional data is needed to have greater confidence in the results and to understand water quality trends. A recommended water quality sampling program is presented in Section
5 Phosphorus Budgets and Modeling The Vollenweider model predicts in-lake phosphorus (P) concentrations as a function of annual P loading, mean lake depth, and hydraulic residence time. The Vollenweider model results compare reasonably well to the August 2014 sampling results for Lower Long Pond, Sandy Pond, Pine Meadow Pond, and Balch Pond. The Vollenweider results did not match well with the observed conditions for Flannagan Pond and Grove Pond. Discretion should be used when comparing results from a single summer sampling event to model results meant to represent year-long averages. A more robust sampling program could provide better data with which to compare the model results in the future. The Vollenweider model relationship between flushing rate, external phosphorus load, and in-lake phosphorus concentration has implications for pond management strategies. The model estimates the external phosphorus load reduction required to reduce in-lake phosphorus concentration by a given amount. The figure below shows this relationship for the six ponds, to allow for a comparison of the relative level of effort required to reduce P concentrations in each pond by an equal amount. Pine Meadow Pond would require the least amount of external P load reduction to lower its in-pond concentration by 1 ug/l (4.2 lb/yr), whereas Grove Pond would require over 13 times that load reduction (55.6 lb/yr) to achieve the same in-pond P concentration reduction. Watershed management strategies that target nutrient load reduction will be most effective for ponds with lower ratios of external load to in-pond concentration lbs. P load reduction (lbs/year) 4.2 lbs. 6.3 lbs lbs lbs lbs. Estimated P Load Reductions Needed to Reduce Pond Total P Concentration by 1 ug/l Aquatic Plant Surveys / Recommendations: Balch Pond: Given this pond s small size, limited accessibility, and overall sparse-moderate growth of predominantly native plants, no plant management actions are recommended at this time. Grove Pond: This pond has extensive growth of invasive fanwort and variable milfoil. Given its shallow depths and limited recreational use, aggressive and repeated efforts to control these species are not recommended. The infestation of water chestnut in the pond s eastern end has the potential to spread rapidly if control actions are not taken. Early infestations of this plant can be controlled with annual harvesting. Lower Long Pond: Lower Long Pond could be considered a regionally significant example of a healthy and diverse native aquatic plant community. No plant management actions are recommended at this time. Ongoing monitoring is highly recommended to ensure rapid identification and response to any future non-native species infestations that may occur. 2
6 Pine Meadow Pond: This pond s dense assemblage of aquatic species was predominantly native during the 2014 survey, with only a minor presence of one non-native species (variable milfoil). To maintain boating channels, periodic spot treatments with glyphosate are recommended to target water lilies and watershield. Ongoing monitoring is recommended to determine if the small population of variable milfoil is stable, or if increased future growth warrants re-evaluation of the need for management. Sandy Pond: Most of Sandy Pond is sparsely vegetated, with a narrow perimeter band of predominantly native vegetation. No immediate plant management actions are recommended. Continued focus on maintaining safe and enjoyable conditions in the Town Beach area is recommended. As needed, future management could include targeted herbicide spot treatments or diver harvesting to control new areas of infestation. Flannagan Pond: Although variable milfoil and fanwort were observed only in the eastern end of the pond during the 2014 survey, recurrence of these species is anticipated. Based on the multi-year treatment longevity for fanwort control that fluridone products have provided at Flannagan Pond, future applications are recommended on an as-needed basis. Periodic spot treatments with glyphosate are recommended to control water lilies when conditions impair boat access to shoreline properties. Field Watershed Investigation Based on Geosyntec s watershed investigations in 2014 and 2015, Section 4 of this report presents potential BMPs and restoration practices that relate to storm water management and phosphorus load reduction for the six ponds. The sites discussed in Section 4 are not intended to be an all-inclusive listing of potential stormwater improvements in the pond watersheds. Rather, these sites are representative examples of potential stormwater improvements and retrofits that could be implemented at numerous sites throughout the watersheds. Grove Pond Human Health Recreational Risk Assessment A human health risk assessment evaluated potential cancer and non-cancer risks from exposure to water and sediment during recreational use of Grove Pond and adjacent Pirone Park. Cancer risks are expressed as the potential increase in cancers in the exposure population, with 1 x 10⁻⁵ set as the acceptable lifetime cancer risk in the Massachusetts Contingency Plan (MCP). Non-cancer risks are expressed as Hazard Quotients (HQ), with HQs and Hazard Indices (HI) (the sum of HQs for each chemical of concern) greater than 1.0 being identified as risk drivers. The cancer risk from recreational exposure to water and sediments was, with the exception of adult dermal exposure to sediment arsenic, below the MCP limit. Cumulative lifetime cancer risks to children from exposure to all chemicals in sediment and water were 8.01 x Adult lifetime cancer risk from dermal (bare skin) exposure to sediment arsenic was 1.18 x With the uncertainty in the calculation of dose and cancer risk, this exposure risk is essentially within the range of acceptable lifetime cancer risk. Examined within the context of the total arsenic dose that American adults typically experience, the major component of which is from our diet, the total dose for adults from recreational exposure to Grove Pond water and sediments would be very low. Grove Pond arsenic total doses would be only approximately 1.5% of the typical daily dose for the typical American adult. As such, the typical lifetime cancer risk from arsenic exposure for the typical adult already exceeds the 1.0 x 10⁻⁵ MCP limit, and the additional dose from Grove Pond recreational exposure would only increase this cancer risk slightly. The cumulative non-cancer risk to adults from the combined exposure to all chemicals present in Grove Pond sediment and water was a hazard index (HI) of 0.9. For children, the cumulative non-cancer risk from the combined exposure to all chemicals present in Grove Pond sediment and water was a HI of However, when the cumulative non-cancer risks to children were examined based on the organs targeted by specific toxicants, none of the resulting calculated HIs were greater than
7 Section 1. Water Quality 1.1 Water Quality Sampling Methodology Geosyntec performed water quality sampling on August 25 and 26, 2014 at the following six ponds in Ayer, Massachusetts: Balch Pond Grove Pond Lower Long Pond Pine Meadow Pond Sandy Pond Flannagan Pond The following parameters were sampled at a deep spot location and a tributary inlet of each pond (see sampling locations on Figure 1.1): Temperature/dissolved oxygen(in-situ) Specific conductance (in-situ) ph (in-situ) Secchi disk clarity (in-situ) Total Phosphorus (lab) Ammonia Nitrogen (lab) Chlorophyll-a (lab, deep hole only) In-situ measurements were taken with a YSI multi-parameter sampler. Two ponds, Lower Long Pond and Sandy Pond, were deep enough that in-situ measurements were performed at 0.5 meter (~1.5 feet) intervals. Grab samples taken for laboratory analysis were sent to Alpha Analytical Laboratory in Westborough, MA. Nutrient samples were obtained with a Kemmerer sampler at the surface, middle, and near the bottom of each pond and at each tributary sampling location. Chlorophyll-a samples were collected as a grab sample just below the water surface. 4
8 Lower Long Pond!.!. LLP-T LLP-DH q!. UFP-T Pine Meadow Pond!. UFP-DH Flannagan Pond!. FP-T!. SP-DH!. SP-T!. FP-DH Sandy Pond Grove Pond BP-T!.!. BP-DH Q:\GISProjects\BW0265-Ayer_ponds\sampling_plan.mxd!. GP-DH ACTON, MASSACHUSETTS Ayer Conservation Commission Ayer Pond Assessments 6/24/2015!. GP-T Balch Pond 1, ,500 Feet Legend Pond!. Deep-Hole Sample!. Tributary Sample AYER PONDS SAMPLING LOCATIONS

9 1.2 Water Quality Sampling Results Results of the August 2014 water quality sampling are presented in Table 1.1 and summarized below. It is important to note that these results represent only a single sampling event for each pond. Pond sampling results can vary significantly for a variety of reasons, including seasonal factors, weather conditions, sampling location, laboratory analytical methods, and time of day. Although the August 2014 sampling results are helpful in beginning to characterize current baseline conditions for each pond, additional sampling data is needed to have greater confidence in the results and to understand water quality trends for each pond. As such, the discussion of sampling results and trophic conditions (Section 1.4) should be considered preliminary and should be refined over time as additional water quality data becomes available. Recommendations for continued water quality sampling are provided in Section 1.3. Temperature/Dissolved Oxygen profiles are measurements that help to characterize conditions associated with a lake s seasonal thermal stratification and related habitat for fish and other aquatic organisms. A pond of sufficient depth (such as Lower Long Pond and Sandy Pond) will typically be well mixed in the early spring (immediately after ice-off) and then gradually separate into three thermal layers throughout the summer: The epilimnion (upper layer) will contain warmer water with high levels of dissolved oxygen due to contact with the atmosphere and wind/wave mixing. The metalimnion (middle layer, also known as the thermocline) is a transition zone between the warm upper layer and the cooler, denser lower layer. Due to the rapid change in temperature and water density in this layer, it acts as a barrier to mixing between the top and bottom waters. The hypolimnion (deepest layer) typically exhibits lower temperature and lower DO concentrations, as biological decomposition of organic sediments gradually depletes the available oxygen. In shallow ponds (or in shallow areas of deeper ponds), the thermal stratification described above may not occur, or may occur weakly and be frequently disrupted by wind mixing. DO levels have an important impact on fish and other aquatic biota. Low DO concentrations can impair the health and spawning of fish and other organisms. Anoxic (oxygen depleted) conditions in the hypolimnion are also associated with the release of phosphorus from lake sediments back into the water column, helping to fuel summer algae and plant growth. Figure 1.2 shows the dissolved oxygen and temperature profiles for the six Ayer Ponds. Pine Meadow Pond, Flannagan Pond, Balch Pond, and Grove Pond are shallow and did not exhibit significant thermal stratification. Despite its shallow depth, Grove Pond exhibited very low DO levels that are likely indicative of high oxygen demand from biological processes in its bottom sediments. Lower Long Pond and Sandy Pond, which are both over 20 feet deep, exhibited highly stratified conditions and associated hypolimnetic oxygen depletion that are typical of the late summer period when these measurements were conducted. 6
10 a) Pine Meadow Pond (08/25/2014) b) Flannagan Pond (08/25/2014) Temperature (oc) Temperature (oc) Depth (ft) 3 4 Depth (ft) Dissolved Oxygen (mg/l) Dissolved Oxygen (mg/l) Dissolved Oxygen Temperature Dissolved Oxygen Temperature c) Lower Long Pond (08/26/2014) d) Sandy Pond (08/25/2014) 0 Temperature (oc) Temperature (oc) Depth (ft) 10 Depth (ft) Dissolved Oxygen (mg/l) Dissolved Oxygen (mg/l) Dissolved Oxygen Temperature Dissolved Oxygen Temperature e) Balch Pond (08/26/2014) f) Grove Pond (08/26/2014) Temperature (oc) Temperature (oc) Depth (ft) 3 4 Depth (ft) Dissolved Oxygen (mg/l) Dissolved Oxygen (mg/l) Dissolved Oxygen Temperature Dissolved Oxygen Temperature Figure 1.2 Dissolved Oxygen and Temperature Profiles for the Ayer Ponds 7


11 Total phosphorus (TP) is a measure of all organic and inorganic phosphorus forms present in the water. In freshwater lakes, phosphorus is usually the most important nutrient determining the growth of algae and aquatic plants. Because phosphorus is typically relatively less abundant than nitrogen, it is considered the limiting nutrient for biological productivity. However, the response of rooted aquatic plants and freefloating microscopic plant algae to changes in phosphorus loading are often quite different. Plant algae will readily use soluble phosphorus in the water column for growth, and algal abundance will respond rapidly to changes in phosphorus availability. The growth of rooted plants responds much more slowly, because these plants get the vast majority of their phosphorus from existing pond sediments. Over the long-term, higher nutrient loads to a pond will result in increased sediment nutrient concentrations that will fuel rooted plant growth. Conversely, reduced nutrient loads can result in less abundant plant growth over the long term as sediments become depleted of nutrients, but this process can take many years. The average TP measurements in the Ayer ponds ranged from 14 ug/l (Lower Long Pond) up to 77 ug/l (Flannagan Pond). Higher TP concentrations were typically observed near the bottoms of the ponds, including a very high pond bottom reading at Flannagan Pond (606 ug/l) which was flagged as an outlier potentially due to lab and/or sampling error. For the purposes of averaging, results that were reported as below the lab detection limit were conservatively calculated at the detection limit (e.g., 10 ug/l for TP). TP concentrations from 10 ug/l to 25 ug/l are indicative of mesotrophic conditions, with higher concentrations (above 25 ug/l) indicating eutrophic conditions supportive of abundant aquatic plant and algae growth. See Section 1.4 for a more detailed description of pond trophic classifications and phosphorus sampling results. Chlorophyll-a measurements provide an indirect measure of algal biomass and, as discussed in Section 1.3, can be used as a metric to estimate a lake s trophic status. Chlorophyll-a is a green pigment used by plants, phytoplankton, and cyanobacteria to convert sunlight into the chemical energy needed to convert carbon dioxide into carbohydrates. Chlorophyll-a levels were below the lab detection limits at Lower Long Pond, and were in the mesotrophic range of 5-10 ug/l for all other ponds except Flannagan Pond. Flannagan Pond s chlorophyll-a concentration of 32 ug/l was in the upper eutrophic range. The Secchi disk is a black and white disk that is lowered into the water by a calibrated chain until it is not visible. This method measures of water clarity (light penetration), which is primarily a function of algal productivity, water color, and turbidity caused by suspended particulate matter. Water clarity influences the growth of rooted aquatic plants by determining the depth to which sunlight can penetrate to the lake sediments. Due to shallow depths, Secchi disk measurements were limited by the sampling station depth at Flannagan Pond, Grove Pond, and Balch Pond (Secchi disk visible to the pond bottom for each). Pine Meadow Pond had a Secchi disk transparency of 3.5 feet, indicating eutrophic conditions. In the deeper Lower Long Pond and Sandy Pond, Secchi disk transparency measurements were 8 and 10 feet respectively, indicating mesotrophic conditions. ph is a measure of acidity based on the presence of hydrogen ions. A ph of 7.0 is neutral. Values below 7.0 indicate acidic waters and values above 7.0 indicate basic (alkaline) waters. Lower ph values typically found at depth are due to biological decomposition that leads to anoxic (oxygen-depleted) conditions and other chemical reactions that reduce ph. Most fish cannot tolerate a ph below 4 or above 11, and their growth and health is affected by long-term exposure to a ph less than 6.0 and over 9.5. Most freshwater lakes and pond in Massachusetts have a ph of 6.0 to 8.0. With the exception of Lower Long Pond, all ph measurements for the Ayer ponds were within this range. Lower Long Pond ranged from 6.3 to 5.8, with this lower ph range a natural characteristic 8
12 attributed to the gradual transition from the pond to its bordering high-quality acidic peatland community. Specific conductance measures the ability of water to conduct electricity by measuring the presence of ions in solution. Chloride is typically the predominant ion found in surface waters, including man-made sources of chloride ions such as wastewater and road salt. The primary natural sources of chloride ions in surface waters include the weathering of soils/rocks and wet and dry precipitation. Regional variations in watershed geology can result in a wide range of normal conductance levels in freshwater, from 0 to 1,300 µs/cm. However, abnormally high conductance levels or significant changes over time can be an indicator of pollutants sources such as road salting, wastewater discharges, and runoff from developed areas. Freshwater fish and other aquatic organisms generally tolerate a wide range of electrical conductivity. The Ayer ponds were all within the normal range for Massachusetts ponds, with Lower Long Pond and Sandy Pond having the lowest average measurements (137 us/cm and 163 us/cm, respectively). Grove Pond had the highest average measurement (333 us/cm), within the range more typically observed in urbanized or densely developed watersheds. Ammonia nitrogen is a reduced form of nitrogen resulting from the microbial decomposition of organic matter, and can be indicative of pollution from wastewater sources. Ammonia-N is the form of nitrogen that is easiest for phytoplankton (plant algae) to assimilate. Although nitrogen is a nutrient required for plant growth, the general ratio of nitrogen to phosphorus in plants (and plant algae) is 16:1 (referred to as the Redfield Ratio ). In most freshwater ponds, the N:P ratio is typically higher than this, which means that phosphorus is the limiting nutrient and that any additional input of nitrogen will not stimulate plant growth. At high in-lake phosphorus concentrations, nitrogen may become the limiting nutrient to plant growth. In addition, nuisance blue-green algal blooms are associated with lakes that have low nitrogen to phosphorus ratios. During the August 2014 sampling, ammonia levels were above laboratory detection limits at only two locations: the Sandy Pond and Flannagan Pond deep measurements near the pond bottoms. 9

13 1.3 Recommendations for Continued Water Quality Sampling As stated in Section 1.2, additional sampling data is needed to allow for greater confidence in the results and to understand long-term water quality trends for each pond. The water quality sampling program recommended for the Ayer ponds includes the following primary features: 1. The sampling program is based on Geosyntec s 2014 sampling program, which focused on the key water quality parameters for characterizing pond health and trophic state. 2. Although it is always possible to add additional sampling parameters and increase sampling frequency, the recommended program is intended to target sampling efforts and limit expenses (i.e., equipment rental and laboratory analytical fees) to the parameters and sampling times that are most useful for long-term pond assessment and management planning. 3. Sampling can be conducted by either properly trained volunteers and/or town staff and has relatively modest equipment requirements Sampling Locations Figure 1.1 shows the sampling locations from Geosyntec s 2014 sampling program and the direction of flow to and from each pond. The sampling locations include a central deep spot and a tributary inlet location for each pond, which are recommended for continued sampling. The coordinates of these locations are provided in Table 1.1. Table 1.1 Water Quality Sampling Locations Description ID Longitude (x) Latitude (y) Grove Pond Deep Spot GP-DH Grove Pond Tributary GP-T Balch Pond Deep Spot BP-DH Balch Pond Tributary BP-T Flannagan Pond Deep Spot FP-DH Flannagan Pond Tributary FP-T Pine Meadow Pond Deep Spot UFP-DH Pine Meadow Pond Tributary UFP-T Balch Pond Deep Spot SP-DH Balch Pond Tributary SP-T Balch Pond Deep Spot LLP-DH Balch Pond Tributary LLP-T Sampling Parameters, Methods, and Equipment The recommended sampling parameters and associated methods for sample collection are the same as those described in Section 1.1 (Water Quality Sampling Methodology). Note that at the tributary locations, samples should be taken as a surface grab sample at the upstream extent of where the tributary meets the pond. 10
14 Equipment needed to conduct sampling will include the following: Sample bottles (typically provided by analytical laboratory, with preservatives included as needed) Cooler and ice to store samples until delivered to lab Kemmerer sampler (or similar depth sampling device) to obtain nutrient samples at specified depths. This can either be purchased (e.g., from Wildco, Amazon, or other supplier) or can be rented (e.g., from U.S. Environmental Rental, Pine Environmental Services, etc.) Multi-parameter in-situ probe (e.g., YSI) equipped for measurement of temperature, dissolved oxygen, specific conductance, and ph. The probe should be equipped with a minimum 25-foot cable (long enough to reach the bottom of Sandy Pond and Lower Long Pond). Secchi disk for water clarity measurement Waterproof field notebook and Sharpie pens (for recording measurements, labeling sample bottles, etc.) Sampling Frequency, Timing, and Costs Three water quality sampling events are recommended each year, which should take place during spring (late April/early May), mid-summer (early to mid-july) and late summer (early- to mid- September). This sampling regime will allow for characterization of water quality patterns during growing season, including trends related to internal nutrient recycling which tend to peak in the late summer. Estimated annual costs for the sampling program are $5,375, which include the following: Lab fees (3 sampling events x $1,650 per event): $4,950 In-situ probe rental (3 sampling events x $125 per event): $375 Misc. supplies (sharpie pens, zip-lock bags, ice, etc.): $50 Estimated Annual Total: $5,375 11
15 Table 1.2 Water Quality Sampling Results POND (Sampling Date) SAMPLE LOCATION SAMPLE ID Depth Temp. ph Dissolved Oxygen Dissolved Oxygen Conductivity Conductivity Secchi Disk Total Phosphorus Ammonia- Nitrogen R =10 RL = Chlorophyll-a (ft) ( o C) (mg/l) (%) (us/cm) (us/cm3) (ft) (ug/l) (mg/l) (ug/l) Pine Meadow (08/ 25/2015) Flannagan Pond (08/25/2015) Sandy Pond (08/25/2015) Deep UFP-D ND Middle UFP-M ND ND Surface UFP-S ND 5.04 Tributary FP-T ND Deep FP-D Middle FP-M ND Surface FP-S (bottom) 23 ND 31.6 Tributary SP-T ND ND Deep SP-D Middle SP-M ND Surface SP-S ND ND
16 Table 1.2 Water Quality Sampling Results (continued) POND (Sampling Date) Grove Pond (08/26/2015) Balch Pond (08/26/2015) Lower Long Pond (08/26/2015) SAMPLE LOCATION SAMPLE ID Depth Temp. ph Dissolved Oxygen Dissolved Oxygen Conductivity Conductivity Secchi Disk Total Phosphorus R =10 ug/l Ammonia- Nitrogen RL = mg/l Chlorophyll-a (ft) ( o C) (mg/l) (%) (us/cm) (us/cm3) (ft) (ug/l) (mg/l) (ug/l) Tributary GP-T ND Deep GP-D ND Middle GP-M ND Surface GP-S (bottom) ND ND 4.82 Tributary BP-T ND Deep BP-D ND Middle BP-M ND Surface BP-S (bottom) 18 ND 9.98 Tributary LLP-T Deep LLP-D ND Middle LLP-M ND Surface LLP-S ND ND ND ND ND 13

17 1.4 Trophic Status Assessments Lakes and ponds are typically categorized according to trophic state as follows: Oligotrophic: Low biological productivity. Oligotrophic lakes are very low in nutrients and algae, and typically have high water clarity and a nutrient-poor inorganic substrate. Oligotrophic lakes can produce and support relatively small populations of organisms (plants, fish, and wildlife). If the water body is thermally stratified, hypolimnetic (deep water) oxygen is usually abundant. Mesotrophic: Moderate biological productivity and moderate water clarity. A mesotrophic water body is capable of producing and supporting moderate populations of living organisms (plant, fish, and wildlife). Mesotrophic water bodies may begin to exhibit periodic algae blooms and other symptoms of increased nutrient enrichment and biological productivity. Eutrophic: High biologically productivity due to relatively high rates of nutrient input and nutrientrich organic sediments. Eutrophic lakes typically exhibit periods of oxygen deficiency and reduced water clarity. Nuisance levels of macrophytes and algae may result in recreational impairments. Hypereutrophic: Dense growth of algae through summer. Dense macrophyte beds, but growth may be light-limited due to dense algae and low water clarity. Summer fish kills are possible. Geosyntec calculated the trophic status of the Ayer ponds using the Carlson Trophic Status Index (TSI), one of the most commonly used means of characterizing a lake's trophic state. As illustrated in Figure 1.3, the TSI assigns values based upon logarithmic scales which describe the relationship between three parameters (total phosphorus, chlorophyll-a, and Secchi disk water clarity) and the lake's overall biological productivity. TSI scores below 40 are oligotrophic, scores between are mesotrophic, scores between are eutrophic, and scores from are hypereutrophic. Figure 1.3 Carlson Trophic State Index (Figure adapted from 1988 Lake and Reservoir Restoration Guidance Manual. USEPA. EPA 440/ ) Oligotrophic Mesotrophic Eutrophic Hypereutrophic Trophic State Index (TSI) Transparency (Secchi disk, m) Chlorophyll-a (ppb) Total Phosphorus (ppb) Trophic Status TSI TP 1 (ppb) Secchi Disk (m) Chl-a 2 (ppb) Oligotrophic <40 <12 >4 <2.6 Mesotrophic Eutrophic Hypereutrophic >70 >96 <0.5 >56 14 Notes: 1. For TP, parts per billion (ppb)=µg/l 2. For Chl-a, ppb=mg/m3
18 Calculation of the TSI value for total phosphorus is based on a pond s average summer epilimnetic (surface water) concentration. For shallow ponds (Pine Meadow Pond, Flannagan Pond, Balch Pond, and Grove Pond), we have used the average of the surface and middle samples, since these measurements were obtained from typical epilimnion depths. For the deeper, stratified ponds (Sandy Pond, Lower Long Pond) we have used only the surface sample to calculate the total phosphorus TSI. The TSI scores presented in Table 1.3 have been calculated based on the epilimnetic (surface water) results from a single sampling event for each pond (Geosyntec s August 2014 sampling). As such, these scores should be considered only as a preliminary initial estimate. For the purposes of calculating TSI scores, results that were reported as below the lab detection limit were conservatively calculated at the detection limit. To further refine these estimates and allow for greater confidence in the results, additional summer sampling should be conducted. Incorporating a larger data set to represent average conditions over the summer months will allow for greater confidence in the pond TSI assessments. Table 1.3 Carlson TSI Results for Ayer Ponds Carlson TSI Scores Parameter TSI Relationship Pine Meadow Pond Flannagan Pond Lower Long Pond Sandy Pond Balch Pond Grove Pond Transparency TSI = In Secchi Disk (m) NA* NA* NA* Chlorophyll-a TSI = (9.81) (In Chlorophyll-a) NA Total Phosphorus TSI = (14.42) (In TP µg/l) *Secchi disk TSI not available because disk was visible to pond bottom The results of the Carlson TSI Index calculation indicate that the six ponds range from mesotrophic to eutrophic. Generally, ponds in the headwaters of the system (Pine Meadow, Lower Long, and Sandy Ponds) had the most mesotrophic conditions. Flannagan Pond was the most highly eutrophic pond according to the TSI calculation. Flannagan Pond exhibited the highest total phosphorus concentration observed during the sampling (132 ug/l); while this high observation might be an outlier, it is supported by an equally high chlorophyll-a concentration (31.6 ug/l), leading to similar upper-eutrophic TSI values of 64.5 and 66.9 for chlorophyll-a and total phosphorus, respectively. The preliminary TSI results for Grove Pond are notable because the pond s TSI for both the phosphorus and chlorophyll-a are in the mid-mesotrophic range. Observed conditions in the pond indicate that Grove Pond is clearly a eutrophic water body, with high biological productivity, very dense aquatic plant growth throughout, and deep organic sediments. The phosphorus load estimates and modeling presented in Section 2 support these observations. One of the limitations of the Carlson TSI is that it uses algal biomass (as measured indirectly through chlorophyll-a and water clarity) as the basis for determining biological productivity, and the abundance of macrophytes (vascular aquatic plants) is not considered. If a pond is heavily dominated by macrophytes rather than microscopic plant algae, the Carlson TSI score may underestimate trophic status. 15

19 Section 2. Phosphorus Budgets and Modeling 2.1 Phosphorus Budgets Eutrophication is the gradual process of nutrient enrichment in aquatic ecosystems such as lakes. Eutrophication occurs naturally as lakes become more biologically productive over geological time, but this process is often accelerated by human activities in the watershed. As shown in Figure 2.1, nutrients that contribute to eutrophication can come from many natural and anthropogenic sources, such as fertilizers applied to residential lawns and agricultural land, septic systems, deposition of nitrogen from the atmosphere, erosion of soil containing nutrients, and sewage treatment plant discharges. Land development not only increases the sources of nutrients, but also decreases opportunities for natural attenuation (e.g., uptake by vegetation) of such nutrients before they can reach a water body. Figure 2.1 Conceptual Pond Phosphorus Dynamics 16
20 Nutrients such as phosphorus and nitrogen can stimulate abundant growth of algae and rooted plants in water bodies. However, the response of rooted aquatic plants and free-floating microscopic plant algae to changes in nutrient loading are often quite different. Plant algae will readily use soluble nutrients in the water column for growth, and algal abundance will respond rapidly to changes in nutrient availability. The growth of rooted plants responds much more slowly, because these plants get the vast majority of their nutrition from existing pond sediments. Over the long-term, higher nutrient loads to a pond will result in increased sediment nutrient concentrations that will fuel rooted plant growth. Over time, this enhanced plant growth leads to reduced dissolved oxygen in the water, as plant material decomposes and consumes oxygen. Conversely, reduced nutrient loads can result in less abundant plant growth over the long term as sediments become depleted of nutrients, but this process can take many years. Phosphorus is typically the limiting nutrient for freshwater lakes, which means that rooted plant and algae growth is most often controlled by the supply of this nutrient. Increases in phosphorus load to a pond are closely correlated with increases in algae/plant abundance and nuisance conditions such as seasonal algae blooms. 25 ug/l of phosphorus is considered the threshold for eutrophic pond conditions, above which nuisance algae and plant conditions may be common. Geosyntec calculated an annual phosphorus budget for each of the six Ayer ponds by considering various phosphorus sources from each watershed, including stormwater runoff, septic system discharges, and aerial deposition Phosphorus in Stormwater Runoff Phosphorus is transported to the ponds through a variety of pathways during a storm event. Particulate phosphorus that has built up on impervious surfaces such as roads, parking lots, and rooftops is washed off by stormwater and conveyed through stormwater infrastructure or natural drainage pathways to the ponds. Additionally, erosion causes phosphorus-containing soil particles to move from the surrounding watershed to the pond, via splash erosion during storm events, or subsequent rill and gully erosion as stormwater moves overland toward the pond. A straightforward method of estimating the total phosphorus load entering the pond requires calculation of two values: the annual volume of stormwater runoff, and a typical concentration of phosphorus within that stormwater (referred to as an Event Mean Concentration, or EMC). One method for determining these two quantities and using them to calculate a pollutant load is known as the Simple Method. Annual stormwater runoff volume (Qr) is calculated for a given area using precipitation depth (P), an assumed fraction of precipitation that contributes to runoff (Pr), impervious percentage (I), and area (A), as shown below: QQ rr = AA PP PP rr ( II) Average annual precipitation for the region was estimated using the most recent five years of precipitation data from the nearby Ashburnham weather station (NCDC COOP ID: ). From , annual precipitation ranged from 46 to 64 in/yr, with an average of 50 in/yr (Figure 2.2). The percentage of impervious cover for each land use type was calculated using land use and impervious cover data supplied by MassGIS. 17
21 Annual Precipitation (inches) Figure 2.2 Annual Precipitation, Ashburnham COOP ID: , The annual pollutant load (L) is calculated by multiplying stormwater runoff volume (Qr) by the EMC (C). LL = QQ rr CC Typical EMC values are presented in literature according to the land use type from which they originate. For example, runoff from a road or residential surface will generally exhibit a higher EMC value than runoff from a forested area. To calculate the total load for an entire watershed, the areal extent of each land use type is first calculated, and then the Simple Method equations shown above are applied to each individual land use. The sum of the pollutant loads from each individual land use is the total load for the watershed. Figures (Land Use Maps) display the land uses present within the Ayer pond watersheds, and Figures (Impervious Cover Maps) show impervious cover within the watersheds. Tables present the calculated annual loads for each land use type within the watersheds, as well as the predicted total annual external loads. 18
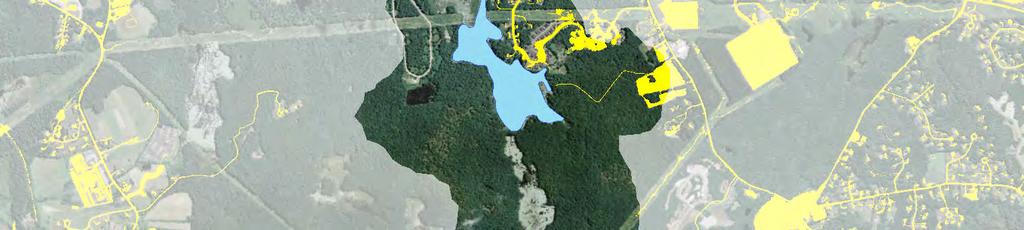
22 Legend Ayer Pond Subwatershed Residential Commercial Industrial Institutional Transportation Agricultural Recreation Forest Open Water Wetland q Q:\GISProjects\BW0265-Ayer_ponds\ayer_ponds-land_use.mxd ACTON, MASSACHUSETTS Ayer Conservation Commission Ayer Ponds Assessments 6/25/2015 2,000 1, ,000 Feet AYER PONDS - LAND USE Lower Long Pond 3
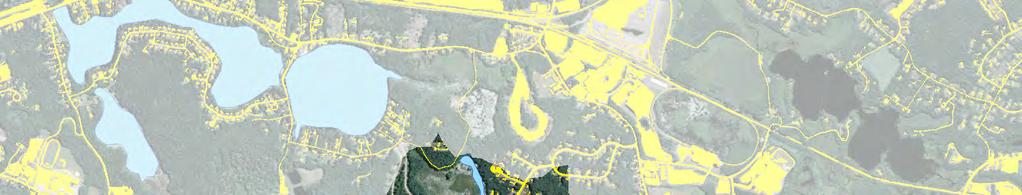
23 Legend Ayer Pond Subwatershed Residential Commercial Industrial Institutional Transportation Agricultural Recreation Forest Open Water Wetland q Q:\GISProjects\BW0265-Ayer_ponds\ayer_ponds-land_use.mxd ACTON, MASSACHUSETTS Ayer Conservation Commission Ayer Ponds Assessments 6/25/2015 2,000 1, ,000 Feet AYER PONDS - LAND USE Sandy Pond 2 4
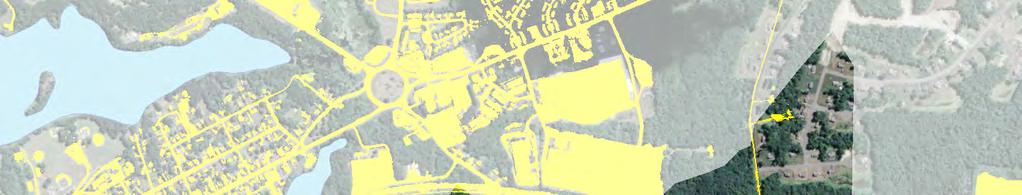
24 Legend Ayer Pond Subwatershed Residential Commercial Industrial Institutional Transportation Agricultural Recreation Forest Open Water Wetland q Q:\GISProjects\BW0265-Ayer_ponds\ayer_ponds-land_use.mxd ACTON, MASSACHUSETTS Ayer Conservation Commission Ayer Ponds Assessments 6/25/2015 2,000 1, ,000 Feet AYER PONDS - LAND USE Pine Meadow Pond 5
25 Legend Ayer Pond Subwatershed Residential Commercial Industrial Institutional Transportation Agricultural Recreation Forest Open Water Wetland q Q:\GISProjects\BW0265-Ayer_ponds\ayer_ponds-land_use.mxd ACTON, MASSACHUSETTS Ayer Conservation Commission Ayer Ponds Assessments 6/25/2015 1, ,000 Feet AYER PONDS - LAND USE Balch Pond Figure 2.6
26 Legend Ayer Pond Subwatershed Residential Commercial Industrial Institutional Transportation Agricultural Recreation Forest Open Water Wetland q Q:\GISProjects\BW0265-Ayer_ponds\ayer_ponds-land_use.mxd ACTON, MASSACHUSETTS Ayer Conservation Commission Ayer Ponds Assessments 6/25/2015 1, ,000 Feet AYER PONDS - LAND USE Flannagan Pond Figure 2.7
27 Legend Ayer Pond Subwatershed Residential Commercial Industrial Institutional Transportation Agricultural Recreation Forest Open Water Wetland q Q:\GISProjects\BW0265-Ayer_ponds\ayer_ponds-land_use.mxd ACTON, MASSACHUSETTS Ayer Conservation Commission Ayer Ponds Assessments 6/25/2015 4,000 2, ,000 Feet AYER PONDS - LAND USE Grove Pond Figure 2.8

28 Legend Ayer Pond Subwatershed Impervious Surface Lower Long Pond Watershed % Impervious: 3.9 % q Q:\GISProjects\BW0265-Ayer_ponds\ayer_ponds-impervious.mxd ACTON, MASSACHUSETTS Ayer Conservation Commission Ayer Ponds Assessments 10/20/2015 2,000 1, ,000 Feet AYER PONDS - IMPERVIOUS SURFACES Lower Long Pond Figure 2.9


29 Legend Ayer Pond Subwatershed Impervious Surface Sandy Pond Watershed % Impervious: 11.0% q Q:\GISProjects\BW0265-Ayer_ponds\ayer_ponds-impervious.mxd ACTON, MASSACHUSETTS Ayer Conservation Commission Ayer Ponds Assessments 10/20/2015 2,000 1, ,000 Feet AYER PONDS - IMPERVIOUS SURFACES Sandy Pond Figure 2.10


30 Legend Ayer Pond Subwatershed Impervious Surface Pine Meadow Pond Watershed % Impervious: 3.3 % q Q:\GISProjects\BW0265-Ayer_ponds\ayer_ponds-impervious.mxd ACTON, MASSACHUSETTS Ayer Conservation Commission Ayer Ponds Assessments 10/20/2015 2,000 1, ,000 Feet AYER PONDS - IMPERVIOUS SURFACES Pine Meadow Pond Figure 2.11


31 Legend Ayer Pond Subwatershed Impervious Surface Balch Pond Watershed % Impervious: 29.9 % q Q:\GISProjects\BW0265-Ayer_ponds\ayer_ponds-impervious.mxd ACTON, MASSACHUSETTS Ayer Conservation Commission Ayer Ponds Assessments 10/20/2015 1, ,000 Feet AYER PONDS - IMPERVIOUS SURFACES Balch Pond Figure 2.12


32 Legend Ayer Pond Subwatershed Impervious Surface Flannagan Pond Watershed % Impervious: 10.2 % q Q:\GISProjects\BW0265-Ayer_ponds\ayer_ponds-impervious.mxd ACTON, MASSACHUSETTS Ayer Conservation Commission Ayer Ponds Assessments 10/20/2015 1, ,000 Feet AYER PONDS - IMPERVIOUS SURFACES Flannagan Pond Figure 2.13


33 Legend Ayer Pond Subwatershed Impervious Surface Grove Pond Watershed % Impervious: 10.5 % q Q:\GISProjects\BW0265-Ayer_ponds\ayer_ponds-impervious.mxd ACTON, MASSACHUSETTS Ayer Conservation Commission Ayer Ponds Assessments 10/20/2015 4,000 2, ,000 Feet AYER PONDS - IMPERVIOUS SURFACES Grove Pond Figure 2.14
34 Table 2.1 Simple Method Calculation of Phosphorus Load - Lower Long Pond Watershed Land Use Type Residential Annual Precipitation % of Precipitation Contributing to Runoff Impervious Cover % Area Annual Stormwater Volume Event Mean Concentration Annual Stormwater Phosphorus Load (in) (ac) (ac-ft) (mg/l) (lb/yr) P P r I A Q r C L 22.68% Commercial 60.73% Industrial 64.82% Institutional 39.02% Transportation 79.18% Agriculture 50 90% 3.56% Recreation 11.94% Forest 2.65% Wetland 0.12% Transitional 55.99% Open 8.62% Open Water 0.08% TOTAL: Table 2.2 Simple Method Calculation of Phosphorus Load - Sandy Pond Watershed Land Use Type Annual Precipitation % of Precipitation Contributing to Runoff Impervious Cover % Area Annual Stormwater Volume Event Mean Concentration Annual Stormwater Phosphorus Load (in) (ac) (ac-ft) (mg/l) (lb/yr) P P r I A Q r C L Residential 22.68% Commercial 60.73% Industrial 64.82% Institutional 39.02% Transportation 79.18% Agriculture 50 90% 3.56% Recreation 11.94% Forest 2.65% Wetland 0.12% Transitional 55.99% Open 8.62% Open Water 0.08% TOTAL:
35 Table 2.3 Simple Method Calculation of Phosphorus Load - Pine Meadow Pond Watershed Land Use Type Annual Precipitation % of Precipitation Contributing to Runoff Impervious Cover % Area Annual Stormwater Volume Event Mean Concentration Annual Stormwater Phosphorus Load (in) (ac) (ac-ft) (mg/l) (lb./yr) P P r I A Q r C L Residential 22.68% Commercial 60.73% Industrial 64.82% Institutional 39.02% Transportation 79.18% Agriculture 50 90% 3.56% Recreation 11.94% Forest 2.65% Wetland 0.12% Transitional 55.99% Open 8.62% Open Water 0.08% TOTAL: 81.4 Table 2.4 Simple Method Calculation of Phosphorus Load - Flannagan Pond Watershed Land Use Type Annual Precipitation % of Precipitation Contributing to Runoff Impervious Cover % Area Annual Stormwater Volume Event Mean Concentration Annual Stormwater Phosphorus Load (in) (ac) (ac-ft) (mg/l) (lb./yr) P P r I A Q r C L Residential 22.68% Commercial 60.73% Industrial 64.82% Institutional 39.02% Transportation 79.18% Agriculture 50 90% 3.56% Recreation 11.94% Forest 2.65% Wetland 0.12% Transitional 55.99% Open 8.62% Open Water 0.08% TOTAL:
36 Table 2.5 Simple Method Calculation of Phosphorus Load - Balch Pond Watershed Land Use Type Annual Precipitation % of Precipitation Contributing to Runoff Impervious Cover % Area Annual Stormwater Volume Event Mean Concentration Annual Stormwater Phosphorus Load (in) (ac) (ac-ft) (mg/l) (lb./yr) P P r I A Q r C L Residential 22.68% Commercial 60.73% Industrial 64.82% Institutional 39.02% Transportation 79.18% Agriculture 50 90% 3.56% Recreation 11.94% Forest 2.65% Wetland 0.12% Transitional 55.99% Open 8.62% Open Water 0.08% TOTAL: Table 2.6 Simple Method Calculation of Phosphorus Load - Grove Pond Watershed Land Use Type Annual Precipitation % of Precipitation Contributing to Runoff Impervious Cover % Area Annual Stormwater Volume Event Mean Concentration Annual Stormwater Phosphorus Load (in) (ac) (ac-ft) (mg/l) (lb./yr) P P r I A Q r C L Residential 22.68% Commercial 60.73% Industrial 64.82% Institutional 39.02% Transportation 79.18% Agriculture 50 90% 3.56% Recreation 11.94% Forest 2.65% Wetland 0.12% Transitional 55.99% Open 8.62% Open Water 0.08% TOTAL:
37 2.1.2 Phosphorus from Septic Systems Septic systems allow treated wastewater effluent, which is rich in phosphorus and other nutrient content, to leach into the groundwater and potentially migrate to the lake. Because phosphorus has a tendency to become bound to soil particles, the distance it can travel may be relatively short. For this reason, it is customary to only include septic systems in the near shore area (within 200 feet of shoreline) when calculating an annual septic system phosphorus load. Based on discussions with Town of Ayer Sewer Department employees, the areas surrounding the six Ayer Ponds are believed to be fully sewered. Based on this information, there is assumed to be no current phosphorus input from septic systems to any of the six ponds Phosphorus from Aerial Deposition Atmospheric deposition of phosphorus is an estimate of the load of phosphorus delivered through wet or dryfall precipitation depositing phosphorus-containing particles directly on the surface of the Ayer ponds. Deposition rates were determined from published literature (Reckhow, 1980). The annual atmospheric deposition load was calculated assuming a deposition rate of 0.24 lb. P/ac/yr. Table 2.7 Aerial Phosphorus Deposition to Ayer Ponds Pond Area Aerial Deposition Rate Aerial Deposition Load ac (lb P/ac/yr) (lb P/yr) Lower Long Pond Sandy Pond Balch Pond Pine Meadow Pond Flannigan Pond Grove Pond
38 2.2 Phosphorus Concentration Modeling In-lake phosphorus response models are commonly used to predict in-lake phosphorus concentrations as a function of annual phosphorus loading, mean lake depth, and hydraulic residence time. These models are useful for understanding the relationships between current phosphorus loading and in-lake concentration, as well as for estimating in-lake concentrations under hypothetical scenarios, such as future buildout. One of the most commonly used in-lake response models is the Vollenweider model, which predicts an average annual in-lake phosphorus concentration. The following sections discuss the results of Vollenweider modeling for the Ayer ponds Mean Lake Depth and Hydraulic Residence Time Bathymetry maps are typically used to determine the volume and mean depth for a lake or pond. Bathymetry maps for five of the six Ayer Ponds were unavailable at the time of this analysis (bathymetry for Grove Pond was provided by USGS), and collection of bathymetry data/production of bathymetry maps was beyond the scope of this project. Therefore, mean lake depth values were obtained from the Aquatic Control Technology, Inc. (ACT) report entitled Baseline Biological Survey Report and Management Recommendations for the Ayer Ponds. Volume estimates were obtained by multiplying mean lake depth by lake surface area. Mean lake depth and volume estimates for each pond are provided in Table 2.8. Hydraulic residence time is the average amount of time for the entire volume of water in a lake to be replaced. Residence time is estimated by dividing the lake volume by the average annual discharge of the lake. Average annual discharge is calculated by estimating a hydrologic budget for the watershed, which can be performed in several ways. Ideally, the optimal method involves direct measurement, such as installation of stream and precipitation gages to construct a full annual water budget. When time or budget prevents the use of direct measurement, other methods can be used. Geosyntec has performed two separate calculations of annual water budgets for the six ponds, presented below. The hydrologic budget is calculated as: QQ = QQ ww + QQ dd QQ ee = QQ ww + (PP AA ss ) ρρ EE pppppp AA ss Where Q is the annual discharge from the lake, Qw is the annual discharge entering the lake from the watershed, Qd is the water resulting from direct precipitation to the lake, and Qe is the amount of water removed from the lake via evaporation, P is the annual precipitation, As is the lake surface area, Epan is the pan evaporation rate (32 in/yr for New England), and ρ is the pan evaporation coefficient necessary to adjust pan evaporation to lake evaporation (0.75 for New England). Watershed discharge, Qw, was calculated using two separate methods. The first method involved using a map of annual runoff amounts prepared by USGS (Randall, 1996). For the Ayer region, the Randall mean annual runoff value is approximately 26 inches. In this case, the term runoff refers to all water that remains after interception, evaporation, and transpiration, including any water that infiltrated and enters the lake via groundwater. Multiplying this runoff depth by the watershed area results in an estimated Q, provided in Table 2.8. The second method incorporated USGS stream gaging results from 94 New England stream gages (a total of 942 water-years) to develop an area-discharge relationship (Figure 2.15). Linear regression of these data resulted in: log[qq dddd ] = log[aa ww ] Where Qda is an average daily discharge in ft 3 /s and Aw is the watershed area in acres. This equation is used to estimate annual discharge (by multiplying Qda by the number of seconds in a year), the results of which are shown in Table 2.8. Geosyntec used an average of the two methods to determine the final estimates of Qw for the six Ayer ponds. 35
39 Hydraulic residence time, or the average length of time a parcel of water will remain in the pond, is calculated by dividing the lake volume (V) by the lake discharge (Q). 2 1 y = x R² = Log Q (log cfs) Log A (log acres) Figure 2.15 Area-Discharge Relationship for New England USGS Stream Gages (<3000 acres) 36
40 Table 2.8 Hydrologic (Water Budget) Modeling Results Lower Long Pond Sandy Pond Balch Pond Pine Meadow Pond Flannagan Pond Grove Pond Surface Area (ac) A s (m 2 ) 203, ,327 22, , , ,617 Mean Depth (m) z Volume (m 3 ) V 683, ,525 42, , , ,000 Direct Precipitation (m 3 ) P A s 258, ,335 29, , , ,814 Pan Evaporation (in/yr) E pan Lake Evaporation (in/yr) ρ E pan Evaporation Volume (m 3 /yr) ρ E pan A s 124, ,641 14,020 82, , ,551 Watershed Area (ac) A w 623 1,351 2, ,191 10,104 Randall Watershed Discharge Volume Regression Equation Watershed Discharge Volume Average Watershed Discharge Volume Total Annual Lake Discharge Hydraulic Residence Time (m 3 /yr) Q w 1,664,380 3,609,992 6,312,495 1,238,296 5,855,623 27,004,130 (m 3 /yr) Q w 1,578,599 3,192,481 5,307,421 1,206,296 4,956,843 19,909,004 (m 3 /yr) Q w 1,621,490 3,401,236 5,809,958 1,222,296 5,406,233 23,456,567 (m 3 /yr) Q 1,756,066 3,596,931 5,825,146 1,311,861 5,637,772 23,647,831 (yr) τ Vollenweider Model The Vollenweider model is commonly used to predict in-lake phosphorus (P) concentrations as a function of annual phosphorus loading, mean lake depth and hydraulic residence time. Phosphorus concentrations predicted by the Vollenweider equation are based on an assumption that the lake is uniformly mixed, such as at spring and fall turnover. The Vollenweider model is based on a five-year study of about 200 waterbodies in Europe, North America, Japan and Australia. The Vollenweider Equation is: LL pp pp vv = qq ss 1 + ττ ww where: pp vv = mean in-lake phosphorus concentration (mg/l) estimated by Vollenweider equation; LL pp = annual phosphorus load/lake area, (grams/m2/year); Τ = hydraulic residence time (yr); qq ss = hydraulic overflow rate=mean depth /hydraulic residence time (m/yr)= zz/ττ ww ; zz = average depth (m) 37
41 The annual phosphorus load used to calculate the term Lp is the sum of the external phosphorus load from stormwater and aerial deposition (calculated in Section 2.1) as well as the phosphorus export from any of the Ayer ponds upstream of a given pond. In this way, the ponds are modeled in series, and the phosphorus dynamics of one pond affect each downstream pond. The annual phosphorus load exported from a pond is calculated by multiplying the pond s average phosphorus concentration (pv) by the annual lake discharge (Q). The Vollenweider model calculations for each of the Ayer ponds are presented below in Tables Table 2.9 Lower Long Pond Vollenweider Calculation Phosphorus Load Stormwater Runoff lb P/yr Aerial Deposition lb P/yr 12.1 Load from Upstream Pond(s) lb P/yr 0 Vollenweider Model Total External Phosphorus Load W ext lb P/yr kg P/yr 51.9 Surface Area A s m 2 203,779 Volume V m 3 683,232 Mean Depth z m 3.35 Annual Discharge Q m 3 /yr 1,756,066 Areal Loading Rate L ext mg/m 2 /yr Hydraulic Overflow Rate q s m/yr 8.62 Hydraulic Residence Time τ yr 0.39 Average Phosphorus Concentration p v ug/l kg P/yr 31.9 Load to Downstream Lake lb P/yr
42 Table 2.10 Sandy Pond Vollenweider Calculation Phosphorus Load Stormwater Runoff lb P/yr Aerial Deposition lb P/yr 17.6 Load from Upstream Pond(s) lb P/yr 70.4 Vollenweider Model lb P/yr Total External Phosphorus Load W ext kg P/yr Surface Area A s m 2 296,327 Volume V m 3 993,525 Mean Depth z m 3.35 Annual Discharge Q m 3 /yr 3,472,707 Areal Loading Rate L ext mg/m 2 /yr Hydraulic Overflow Rate q s m/yr Hydraulic Residence Time τ yr 0.29 Average Phosphorus Concentration p v ug/l kg P/yr Load to Downstream Lake lb P/yr Table 2.11 Pine Meadow Pond Vollenweider Calculation Phosphorus Load Stormwater Runoff lb P/yr 81.4 Aerial Deposition lb P/yr 8.0 Load from Upstream Pond(s) lb P/yr 0.0 Vollenweider Model lb P/yr 89.4 Total External Phosphorus Load W ext kg P/yr 40.6 Surface Area A s m 2 135,622 Volume V m 3 268,695 Mean Depth z m 1.98 Annual Discharge Q m 3 /yr 1,311,861 Areal Loading Rate L ext mg/m 2 /yr Hydraulic Overflow Rate q s m/yr 9.67 Hydraulic Residence Time τ yr 0.20 Average Phosphorus Concentration p v ug/l kg P/yr 27.9 Load to Downstream Lake lb P/yr
43 Table 2.12 Flannagan Pond Vollenweider Calculation Phosphorus Load Stormwater Runoff lb P/yr Aerial Deposition lb P/yr 20.8 Load from Upstream Pond(s) lb P/yr Vollenweider Model lb P/yr Total External Phosphorus Load W ext kg P/yr Surface Area A s m 2 350,603 Volume V m 3 480,888 Mean Depth z m 1.37 Annual Discharge Q m 3 /yr 5,250,232 Areal Loading Rate L ext mg/m 2 /yr Hydraulic Overflow Rate q s m/yr Hydraulic Residence Time τ yr 0.09 Average Phosphorus Concentration p v ug/l kg P/yr Load to Downstream Lake lb P/yr Table 2.13 Balch Pond Vollenweider Calculation Phosphorus Load Stormwater Runoff lb P/yr Aerial Deposition lb P/yr 1.4 Load from Upstream Pond(s) lb P/yr Vollenweider Model lb P/yr Total External Phosphorus Load W ext kg P/yr Surface Area A s m 2 22,998 Volume V m 3 42,059 Mean Depth z m 1.83 Annual Discharge Q m 3 /yr 5,223,878 Areal Loading Rate L ext mg/m 2 /yr Hydraulic Overflow Rate q s m/yr Hydraulic Residence Time τ yr 0.01 Average Phosphorus Concentration p v ug/l kg P/yr Load to Downstream Lake lb P/yr
44 Table 2.14 Grove Pond Vollenweider Calculation Phosphorus Load Stormwater Runoff lb P/yr Aerial Deposition lb P/yr 17.2 Load from Upstream Pond(s) lb P/yr Vollenweider Model lb P/yr Total External Phosphorus Load W ext kg P/yr Surface Area A s m 2 289,617 Volume V m 3 209,000 Mean Depth z m 0.72 Annual Discharge Q m 3 /yr 23,032,543 Areal Loading Rate L ext mg/m 2 /yr Hydraulic Overflow Rate q s m/yr Hydraulic Residence Time τ yr 0.01 Average Phosphorus Concentration p v ug/l kg P/yr 1,339.0 Load to Downstream Lake lb P/yr 2,951.0 Table 2.15 Summary of Vollenweider Modeling Results Pond Estimated Average P Concentration (ug/l) Estimated Trophic Class Estimated P Load Reduction to Reduce Pond TP by 1 ug/l (lbs/yr) Estimated Annual P Load Reduction Required for Pond TP<25 ug/l (lbs/yr) 1 Lower Long Pond mesotrophic 6.3 (42.9) Pine Meadow Pond mesotrophic 4.2 (15.5) Sandy Pond eutrophic Flannagan Pond eutrophic Balch Pond eutrophic Grove Pond eutrophic ug/l of P is the threshold for classification as a eutrophic pond Figure 2.16 compares the modeled total phosphorus (TP) concentrations with the observed TP concentrations from Geosyntec s August 2014 sampling. The observed TP concentration refers to the average of the surface, middle, and deep samples. The average of these results is appropriate for comparison because the Vollenweider model is intended to estimate the average in-lake phosphorus concentration during fully mixed conditions (i.e., conditions during fall or spring turnover). The Vollenweider model results appear to compare reasonably well to the observed results for Lower Long Pond, Sandy Pond, Pine Meadow Pond, and Balch Pond, given the limited sampling data available. The Vollenweider results did not match well with observed conditions for Flannagan Pond and Grove Pond. Natural phosphorus attenuation in Bowers Brook may play a role in lowering the external load to Grove Pond, causing observed concentrations to be lower than modeled concentrations. Additionally, nutrient 41

45 uptake by the dense community of macrophytes in Grove Pond may result in temporary reduction in observed in-lake phosphorus concentrations. The reasons for Flannagan Pond s observed phosphorus concentrations greatly exceeding the model estimate are unclear based on the limited available data. As previously stated, discretion should be used when comparing results from a single summer sampling event to model results meant to represent year-long averages (as well as fully-mixed conditions in stratified lakes). A more robust sampling program which obtains measurements throughout the spring-fall season could provide better data with which to compare the model results in the future. 25 ug/l threshold for eutrophic conditions Figure 2.16 Comparison of Modeled and Observed Phosphorus Concentrations in Ayer Ponds The relationship between flushing rate, external phosphorus load, and in-lake phosphorus concentration presented by the Vollenweider model also has implications for pond management. The relationships predict the amount of load reduction required to reduce in-lake phosphorus concentration by a given amount. Table 2.15 and Figure 2.17 shows this relationship for the 6 ponds. Pine Meadow Pond requires the least amount of phosphorus load reduction to lower its in-pond concentration by 1 ug/l (4.2 lb/yr), whereas Grove Pond would require over thirteen times that load reduction (55.6 lb/yr) to lower in-pond concentration by the same amount. Watershed management strategies that target nutrient load reduction would therefore be most effective for ponds with lower ratios of external load to in-pond concentration lbs. P load reduction (lbs/year) 4.2 lbs. 6.3 lbs lbs lbs lbs. Figure 2.17 Estimated Phosphorus Load Reductions Needed to Reduce Pond TP Concentration by 1 ug/l 42
46 2.2.3 Water Quality Goals Based on the Vollenweider modeling results, recommended water quality goals for phosphorus concentration in each pond are presented below. These water quality goals should be considered preliminary, and refined as additional field sampling data is available and can be used to calibrate model results. It is important to keep in mind that phosphorus reductions achieved in upstream ponds will also contribute to loading reductions for downstream ponds. As presented in Table 2.16, the Vollenweider model predicts that Pine Meadow Pond and Lower Long Pond have good water quality (mesotrophic status) and the recommended total phosphorus (TP) goal for these ponds is to protect/maintain current water quality. The watersheds for these ponds are predominantly undeveloped, with significant areas of forest and wetlands, and therefore offer very limited opportunity for phosphorus loading reductions. These watersheds should be carefully managed and protected to prevent pollutant load increases associated with future land development. Sandy Pond, Flannagan Pond, and Balch Pond are predicted to have total phosphorus levels that moderately exceed the eutrophic threshold of 25 ug/l. Ponds above this threshold will typically support nuisance levels of rooted aquatic plant and algae growth, and may have periods of low dissolved oxygen that impair aquatic habitat for fish and other organisms. For Sandy Pond and Flannagan Pond, the recommended goal is to improve phosphorus levels to below the eutrophic threshold. Reaching this goal will require a long-term commitment on behalf on the Town and watershed residents, but is realistically achievable and will benefit both pond ecology and recreational use of the ponds. The high degree of development and impervious land cover in Balch Pond s proximal watershed may make it infeasible to achieve TP levels below 25 ug/l. As such, a target of <30 ug/l is recommended as being realistic based on current information. Geosyntec does not recommend focusing pond management funds on efforts to target a TP goal for Grove Pond. Grove Pond is highly eutrophic and has a high ratio of external P load to in-pond TP concentration, which means that any dollars spent to reduce pollutant loading will yield very little benefit to pond water quality. Grove Pond is also very shallow and has deep organic sediments that can support very dense plant growth even if P load is significantly reduced. Table 2.16 presents a summary of the recommended water quality goals for phosphorus concentration in each pond. 43
47 Table 2.16 Recommended Phosphorus Concentration Goals Pond Estimated Avg. TP (ug/l) Recommended Avg. TP Goal (ug/l) Comments Lower Long Pond Pine Meadow Pond For Lower Long Pond and Pine Meadow Pond, maintain current mesotrophic status and P concentrations. Given the largely undeveloped watersheds of these ponds, this will require a combination of (1) land protection and conservation, and (2) measures (e.g., stormwater management practices) to prevent new sources from increasing P load in the event of future land development in these watersheds. Sandy Pond 28.9 < 25.0 Flannagan Pond 28.1 < 25.0 For Sandy Pond and Flannagan Pond, establish a longterm goal of decreasing in-pond TP levels to below the eutrophic threshold of 25 ug/l. This will require a minimum reduction in annual P load of 45.8 lbs. and 46.4 lbs., respectively. This will also require appropriate measures to prevent increases in P loading from future land development. Balch Pond 35.7 < 30.0 If the TP goal for Flannagan Pond (< 25 ug/l) is met, this will reduce Balch Pond s in-pond TP to 32.7 ug/l. The high degree of development and impervious land cover in Balch Pond s proximal watershed may make it infeasible to achieve TP levels below 25 ug/l. As such, a target of <30 ug/l is recommended, which would require an additional P load reduction of 33.9 lbs/yr from the proximal watershed. Grove Pond 58.1 NA Geosyntec does not recommend focusing pond management funds on efforts to target a TP goal for Grove Pond. Grove Pond has a high ratio of external P load to in-pond concentration, and will yield relatively little response to P loading reductions. Grove Pond is also very shallow and has deep organic sediments that can support very dense plant growth even if P load is significantly reduced. 44
48 Section 3. Aquatic Vegetation Surveys 3.1 Methodology Between August 27, 2014 and September 19, 2014, Geosyntec conducted surveys of the aquatic vegetation communities of the following six ponds in Ayer, Massachusetts: Balch Pond Grove Pond Lower Long Pond Pine Meadow Pond Sandy Pond Flannagan Pond Plant species were identified at representative sampling locations in each pond, as presented in Figures 1-6. Plants were identified by visual inspection and by using an aquatic vegetation grappling hook to sample submerged vegetation. At each station, the dominant plant(s) were recorded, along with estimates of plant growth density and biomass. As categorized in Table 3.1, plant density is an estimate of aerial coverage when looking down to the pond bottom from the water surface. Biomass estimates the amount of plant matter within the water column. For example, a sampling station with dense growth of low-growing plants may have a high density estimate but a relatively low plant biomass estimate. A station with dense growth of a long, ropey plant with stems reaching the water surface would have both high plant density and high biomass estimates. In addition to recording information from the sampling stations, a running documentation of plant growth densities was estimated throughout each of the pondwide surveys. Table 3.1 Key to Plant Density and Biomass Ratings Rating Density (% cover) Biomass 0 No plants observed No plants observed 1 Sparse: 1 25% Trace to sparse plant biomass 2 Moderate: 26-50% 3 Dense: 51-75% 4 Very Dense: % Less abundant growth, or in less than half of the water column Substantial growth through majority of water column Abundant growth throughout water column to surface 3.2 Vegetation Survey Results A listing of plant species observed in each pond is provided in Tables , including information on vegetation density, plant biomass, and dominant plants at each station. Table 3.2 provides a comparative overview of the plant community in the six ponds, and is followed by more detailed summaries of the findings for each pond. The indices in the table below are intended to allow for a comparison of relative changes in plant growth conditions over time if similar plant surveys are conducted in the future. 45

49 Table 3.2 Comparative Summary of Ayer Ponds Vegetation Surveys Water Body # Species Observed Species Richness 1 Avg. Growth Density Avg. Biomass Most Common Species Non-native Species Balch Pond Robbin s pondweed, white water lily, eastern purple bladderwort, arrow arum 2 species: fanwort, purple loosestrife Grove Pond fanwort, variable milfoil, white water lily, coontail 4 species: fanwort, variable milfoil, water chestnut, purple loosestrife Lower Long Pond white water lily, rannoch rush, common bladderwort, pickerelweed None Pine Meadow Pond white water lily, watershield, coontail, common bladderwort 1 species: variable milfoil Sandy Pond pickerelweed, Robbin s pondweed, white water lily, watershield 3 species: fanwort, variable milfoil, common reed Flannagan Pond white water lily, eastern purple bladderwort, watershield, ribbonleaf pondweed 4 species: variable milfoil, purple loosestrife, fanwort, curly-leaf pondweed 1 Average number of species observed at each sampling station A northern green frog (Lithobates clamitans melanotus) surrounded by watermeal along the eastern shoreline of Grove Pond. Watermeal is a free-floating aquatic plant and is one of the smallest flowering plants in the world. 46
50 Balch Pond Geosyntec conducted a vegetation survey of Balch Pond (6 acres) on August 28, The species observed during the survey are listed to the right, in order of relative abundance as observed at the sampling stations presented on Figure 3.1. General Observations: 22 species were observed at Balch Pond, with a predominantly native assemblage (20 native species and two non-native species that were observed in small quantities). The southern shoreline of Balch Pond was characterized by patchy surface cover of white water lilies and emergent arrow arum, with sparse to moderate submersed growth dominated by eastern purple bladderwort, Robbin s pondweed, and ribbonleaf pondweed. The northern shoreline was dominated by a band of moderate to dense white water lilies, with patchy stands of eastern purple bladderwort. Plant abundance in the central area of the pond was generally sparse and dominated by low growth of Robbin s pondweed near the pond bottom. Aquatic plant growth was most abundant at the eastern tip of the pond, and in a shallow cove to the north of the main body of Balch Pond. Non-Native Species: Balch Pond Plant Species, 09/19/2014 Scientific Name Common Name Potamogeton robbinsii Robbin's pondweed Nymphaea odorata white water lily Peltandra virginica arrow arum Cabomba caroliniana* fanwort Utricularia purpurea eastern purple bladderwort Utricularia minor lesser bladderwort Potamogeton epihydrus ribbonleaf pondweed Pontederia cordata pickerelweed Ludwigia palustris water purslane Utricularia vulgaris common bladderwort Nuphar variegatum yellow water lily Brasenia schreberi watershield Sparganium sp. bur-reed Lythrum salicaria* purple loosestrife Polygonum pensylvanicum Pennsylvania smartweed Potamogeton diversifolius waterthread pondweed Eleocharis obtusa blunt spike rush Polygonum amphibium water smartweed Ceratophyllum demersum coontail Typha latifolia broadleaf cattail Cephalanthus occidentalis common buttonbush Potamogeton spirallus spiral pondweed * non-native, invasive species Fanwort was observed in trace quantities (scattered individual plants or fragments) at 9 out of 18 sampling stations. Fanwort was somewhat more abundant a one sampling station (#14) in the eastern part of the pond, but was not a dominant plant at this location. Purple loosestrife, an invasive emergent wetland plant, was observed at 2 locations along the northern shoreline. Other Observations: While conducting the vegetation survey, Geosyntec observed an oily sheen that covered most of the pond. A shoreline resident stated that the sheen had been on the pond for several months, dating back at least as far as November Geosyntec discussed the sheen with the Ayer Conservation Agent and later reported the sheen to the Massachusetts Department of Environmental Protection on behalf of the Conservation Commission. 47


51 Balch Pond Representative Photos Photo 1: View across Balch Pond towards its northern shoreline. Plant abundance in the central portions of the pond was generally sparse and dominated by low growth of Robbin s pondweed near the pond bottom. Photo 2: The eastern end of Balch Pond had moderate to very dense plant growth, dominated by surface growth of white water lily and submerged growth of Robbin s pondweed and eastern purple bladderwort. 48


52 Photo 3: Blunt spike rush growing in the shallow cove area to the north of the main body of Balch Pond. Photo 4: Dense growth of white water lilies along the central portion of Balch Pond s northern perimeter. 49
53 Legend Station Location Vegetation Density: Sparse: 0-25% Moderate: 26-50% Dense: 51-75% Very Dense: % Q:\GISProjects\BW0265-Ayer_ponds\vegetation_maps_nov14.mxd ACTON, MASSACHUSETTS Ayer Conservation Commission Ayer Pond Assessments Aquatic Vegetation Survey Date: 8/28/ Feet q BALCH POND AQUATIC VEGETATION DENSITY Figure 3.1
 Date: 8/28/2014 Surveyed by: Bob Hartzel species present at monitoring station species dominant at monitoring station Plant Species")
54 Table 3.3: Aquatic Vegetation Survey Tally Sheet - Balch Pond (Ayer, MA) Date: 8/28/2014 Surveyed by: Bob Hartzel species present at monitoring station species dominant at monitoring station Plant Species scientific name common name # stations present # stations dominant Monitoring Locations Potamogeton robbinsii Robbin's pondweed 14 5 Nymphaea odorata white water lily 13 5 Peltandra virginica arrow arum 10 1 Cabomba caroliniana* fanwort 10 0 Utricularia purpurea eastern purple bladderwort 9 3 Utricularia minor lesser bladderwort 8 0 Potamogeton epihydrus ribbonleaf pondweed 7 3 Pontederia cordata pickerelweed 7 0 Ludwigia palustris water purslane 6 0 Utricularia vulgaris common bladderwort 3 1 Nuphar variegatum yellow water lily 3 0 Brasenia schreberi watershield 2 0 Sparganium sp. bur-reed 2 0 Lythrum salicaria* purple loosestrife 2 0 Polygonum pensylvanicum Pennsylvania smartweed 2 0 Potamogeton diversifolius waterthread pondweed 2 0 Eleocharis obtusa blunt spike rush 2 0 Polygonum amphibium water smartweed 1 0 Ceratophyllum demersum coontail 1 0 Typha latifolia broadleaf cattail 1 0 Cephalanthus occidentalis common buttonbush 1 0 Potamogeton spirillus spiral pondweed 1 0 * non-native, invasive species # of species present Plant Density Rating Plant Biomass Rating Note: Cabomba caroliniana observed in trace quantities (individual plants or fragments) at all noted stations except for station # Average
55 Grove Pond Geosyntec conducted a vegetation survey of Grove Pond (72 acres) on August 28, The species observed during the survey are listed in the table to the right, in order of relative abundance as observed at the sampling stations presented on Figure 3.2. General Observations: 25 species were observed at Grove Pond, including 4 invasive species. Grove Pond had extremely dense growth of submerged and floating-leaf vegetation over nearly its entire area. Of the six ponds included in this study, Grove Pond had by far the highest average plant growth density, biomass, and species richness. The most abundant native species was coontail, a free-floating submerged species that was observed throughout the pond and was a dominant plant at 10 out of 26 stations. Other abundant native species included two floatingleaf plants, white water lily and watershield (photo 5). Non-native Species: Fanwort was the most abundant plant in Grove Pond, observed at 23 sampling stations and a dominant plant at 12 stations. This plant dominated significant portions of the eastern and western ends of the pond, including large and very dense near-monoculture stands (photo 7). Grove Pond Plant Species, 08/28/2014 Scientific Name Common Name Lemna minor lesser duckweed Wolffia sp. watermeal Cabomba caroliniana* fanwort Myriophyllum heterophyllum* variable milfoil Nymphaea odorata white water lily Ceratophyllum demersum coontail Utricularia vulgaris common bladderwort Nuphar variegatum yellow water lily Brasenia schreberi watershield Peltandra virginica arrow arum Elodea nuttallii Nuttall's waterweed Pontederia cordata pickerelweed Sparganium americanum bur-reed Polygonum pensylvanicum Pennsylvania smartweed Utricularia minor lesser bladderwort Potamogeton zosteriformis flat-stem pondweed Potamogeton natans floating-leaf pondweed Trapa natans* water chestnut Lythrum salicaria* purple loosestrife Sagittaria latifolia arrowhead Typha latifolia broadleaf cattail Potamogeton epihydrus ribbonleaf pondweed Cephalanthus occidentalis common buttonbush Cicuta maculata water hemlock Lemna trisulca star duckweed * non-native, invasive species Variable milfoil also abundant, observed at 22 stations and a dominant plant at 8 stations. This invasive plant commonly co-occurs and competes with fanwort in Massachusetts lakes. Water chestnut was observed growing in small patches at 4 sampling stations and several other locations in the eastern portion of the pond. This invasive annual plant has the ability to spread aggressively by seed dispersal once introduced to a water body. Grove Pond is the only pond in this study where water chestnut was observed. Fortunately, the other ponds are located upstream of Grove Pond, which limits the risk of spread to those ponds. Geosyntec notified the Ayer Conservation Agent of this infestation immediately following the vegetation survey, and the potential for volunteer hand harvesting of the water chestnut plants was discussed. See additional discussion of control recommendations in Section


56 Grove Pond Representative Photos Photo 5: View across Grove Pond to the west, from an area in the eastern end of the pond dominated by native watershield. Very dense floating-leaf and submerged vegetation was present over the vast majority of Grove Pond. Photo 6: A stand of native water smartweed in flower along the southern perimeter of Grove Pond. 53


57 Photo 7: A large, near-monoculture stand of fanwort was observed in the western/central portion of Grove Pond. As shown in the photo, fanwort has small white flowers that typically appear at the water surface in late summer. Photo 8: Small to moderately sized clusters of invasive water chestnut were observed at locations in the eastern end of Grove Pond. This annual plant can spread prolifically by seed, and has the potential to spread aggressively once introduced to a waterbody. 54
58 23 24 Legend Station Location Vegetation Density: Sparse: 0-25% Moderate: 26-50% Dense: 51-75% Very Dense: % Q:\GISProjects\BW0265-Ayer_ponds\vegetation_maps_nov14.mxd ACTON, MASSACHUSETTS Ayer Conservation Commission Ayer Pond Assessments Aquatic Vegetation Survey Date: 8/28/ Feet q GROVE POND AQUATIC VEGETATION DENSITY Figure 3.2
 Date: 8/28/2014 Surveyed by: Bob Hartzel species present at monitoring station species dominant at monitoring station Plant Species")
59 Table 3.4: Aquatic Vegetation Survey Tally Sheet - Grove Pond (Ayer, MA) Date: 8/28/2014 Surveyed by: Bob Hartzel species present at monitoring station species dominant at monitoring station Plant Species scientific name common name Lemna minor lesser duckweed 26 0 Wolffia sp. watermeal 26 0 Cabomba caroliniana* fanwort Myriophyllum heterophyllum* variable milfoil 22 8 Nymphaea odorata white water lily 22 7 Ceratophyllum demersum coontail Utricularia vulgaris common bladderwort 17 0 Nuphar variegatum yellow water lily 16 4 Brasenia schreberi watershield 13 7 Peltandra virginica arrow arum 10 2 Elodea nuttallii Nuttall's waterweed 10 1 Pontederia cordata pickerelweed 9 1 Sparganium americanum bur-reed 8 0 Polygonum pensylvanicum Pennsylvania smartweed 8 0 Utricularia minor lesser bladderwort 6 0 Potamogeton zosteriformis flat-stem pondweed 5 1 Potamogeton natans floating-leaf pondweed 4 0 Trapa natans* water chestnut 4 0 Lythrum salicaria* purple loosestrife 2 0 Sagittaria latifolia arrowhead 2 0 Typha latifolia broadleaf cattail 1 1 Potamogeton epihydrus ribbonleaf pondweed 1 0 Cephalanthus occidentalis common buttonbush 1 0 Cicuta maculata water hemlock 1 0 Lemna trisulca star duckweed 1 0 * non-native, invasive species # stations present # stations dominant # of species present Plant Density Rating Plant Biomass Rating Monitoring Locations Average
60 Lower Long Pond Geosyntec conducted a vegetation survey of Lower Long Pond on September 3, Lower Long Pond transitions gradually from open water to an extensive shrub swamp and bog system at its southern end. For the purposes of this study and vegetation survey, Geosyntec defined the pond boundary as the 50-acre area classified as either Open Water or Deep Marsh according to the Massachusetts Department of Environmental Protection wetlands datalayer. The species observed during the survey are listed in the table to the right, in order of relative abundance as observed at the sampling stations presented on Figure 3.3. General observations from the Lower Long Pond vegetation survey are summarized below: Lower Long Pond had the highest diversity of species among the ponds in the study group (28 species), and was the only pond to exhibit an entirely native plant assemblage. Lower Long Pond could be considered a regionally significant example of a healthy and diverse aquatic plant community. Healthy native aquatic plant communities help prevent the establishment of invasive non-native plants and provide the foundation for a healthy pond ecosystem. The pond provides a relatively wide range of high-quality aquatic habitats including areas characterized by sparsely vegetated open water, emergent marsh, floating-leaf community, and submerged aquatic bed community. The northern end of the pond has significant areas of floating bog mats supporting scrub-shrub vegetation and carnivorous herbaceous species such as spatulate-leaved sundew and pitcher plant (see photo 10). Lower Long Pond Plant Species, 09/03/2014 Scientific Name Common Name Nymphaea odorata white water lily Scheuchzeria palustris rannoch rush Utricularia vulgaris common bladderwort Pontederia cordata pickerelweed Utricularia gibba humped bladderwort Brasenia schreberi watershield Nuphar variegatum yellow water lily Potamogeton natans floating-leaf pondweed Sparganium sp. bur-reed Decodon verticillatus water willow Rhexia virginica Virginia meadow beauty Sarracenia purpurea pitcher plant Clethra alnifolia sweet pepperbush Utricularia radiata little floating bladderwort Eriocaulon septangulare pipewort Potamogeton epihydrus ribbonleaf pondweed Potamogeton pulcher spotted pondweed Utricularia purpurea eastern purple bladderwort Cladium mariscoides twig rush Nymphoides cordata little floating-heart Myriophyllum humile low watermilfoil Drosera intermedia spatulate-leaved sundew Peltandra virginica arrow arum Juncus canadensis Canada rush Eleocharis sp. spike rush Polygonum pensylvanicum Pennsylvania smartweed Lemna minor lesser duckweed Scirpus cyperinus wool grass The most abundant and well distributed plant in the pond was white water lily, which was observed at 14 out of 17 sampling stations and was a dominant plant at 11 stations. Rannoch rush was also well-distributed around the pond (11 stations). This plant was most abundant in the northern end of the pond in its emergent form (see photo 9), but was observed throughout the pond in both its emergent and sterile submersed forms. Wildlife observations during the vegetation survey included painted turtles, several beaver lodges, and great blue heron. 57


61 Lower Long Pond Representative Photos Photo 9: Rannoch rush was found growing in shallow areas throughout Lower Long Pond, and was a dominant plant at this location (sampling station #5) along the shallow northeastern edge of the pond. Photo 10: Bog species found observed in the northern end of Lower Long Pond included spatulate-leaved sundew (left photo) and pitcher plant (right photo). Both of these species are carnivorous plants that capture invertebrates and digest them to supplement their nutrient uptake. 58

: little")


62 Photo 11: The diverse native plant assemblage at Lower Long Pond included (clockwise from the upper left): little floating-heart, Virginia meadow beauty, floating-leaf pondweed, spotted pondweed, little floating bladderwort, and water willow. Photo 12: View to the north across Lower Long Pond. In general, the pond had very dense growth throughout its shallow perimeter and coves, with sparse growth throughout the deeper central area. 59
63 Legend Station Location Vegetation Density: Sparse: 0-25% Moderate: 26-50% Dense: 51-75% Very Dense: % Q:\GISProjects\BW0265-Ayer_ponds\vegetation_maps_nov14.mxd ACTON, MASSACHUSETTS Ayer Conservation Commission Ayer Pond Assessments Aquatic Vegetation Survey Date: 8/28/ Feet q LOWER LONG POND AQUATIC VEGETATION DENSITY
64 Table 3.5: Aquatic Vegetation Survey Tally Sheet - Lower Long Pond (Ayer, MA) Location: Lower Long Pond (Ayer, MA) Date: 9/3/2014 Surveyed by: Bob Hartzel species present at monitoring station species dominant at monitoring station Plant Species scientific name common name # stations present # stations dominant Monitoring Locations Nymphaea odorata white water lily Scheuchzeria palustris rannoch rush 11 1 Utricularia vulgaris common bladderwort 10 0 Pontederia cordata pickerelweed 9 0 Utricularia gibba humped bladderwort 8 0 Brasenia schreberi watershield 7 1 Nuphar variegatum yellow water lily 6 1 Potamogeton natans floating-leaf pondweed 6 1 Sparganium sp. bur-reed 4 0 Decodon verticillatus water willow 4 0 Rhexia virginica Virginia meadow beauty 4 0 Sarracenia purpurea pitcher plant 4 0 Clethra alnifolia sweet pepperbush 3 0 Utricularia radiata little floating bladderwort 3 0 Eriocaulon septangulare pipewort 3 0 Potamogeton epihydrus ribbonleaf pondweed 2 1 Potamogeton pulcher spotted pondweed 2 0 Utricularia purpurea eastern purple bladderwort 2 0 Cladium mariscoides twig rush 2 0 Nymphoides cordata little floating-heart 2 0 Myriophyllum humile low watermilfoil 1 0 Drosera intermedia spatulate-leaved sundew 1 0 Peltandra virginica arrow arum 1 0 Juncus canadensis Canada rush 1 0 Eleocharis sp. spike rush 1 0 Polygonum pensylvanicum Pennsylvania smartweed 1 0 Lemna minor lesser duckweed 1 0 Scirpus cyperinus wool grass 1 0 # of species present Plant Density Rating Plant Biomass Rating Average Rating Density (% cover) Biomass 0 Plants Absent Plants Absent 1 Sparse: 1-25% Trace to sparse plant biomass 2 Moderate: 26-50% 3 Dense: 51-75% 4 Very Dense: % Less abundant growth, or in less than half of water column Substantial growth through majority of water column Abundant growth throughout water column to surface
65 Pine Meadow Pond Geosyntec conducted a vegetation survey of Pine Meadow Pond (34 acres) on September 10, The species observed during the survey are listed in the table to the right, in order of relative abundance as observed at the sampling stations presented on Figure 3.4. General observations from the Pine Meadow Pond vegetation survey are summarized below: 24 species were observed at Pine Meadow Pond, with a species richness index of Variable milfoil was the only invasive, nonnative species observed during the survey. This plant was observed in small amounts at 3 sampling stations, but was not a dominant plant at any station. Most of Pine Meadow Pond was comprised of a very dense assemblage of native floating-leaf and submerged species. Much of the pond surface was had dense cover of white water lily and/or watershield, two floating-leaf species that were the most dominant plants in the pond. The most abundant submerged species were coontail, common bladderwort, and stonewort. No other species were observed at more than 25% of the sampling stations. The southern end of the pond ranges from very dense growth at the shallow near-shore areas to sparse growth in the deeper central area. Plant growth was densest at the shallow northern end of the pond, where the pond gradually transitions from open water habitat to an emergent wetland (wet meadow/marsh) area. Pine Meadow Pond Plant Species, 09/10/2014 Scientific Name Common Name Nymphaea odorata white water lily Brasenia schreberi watershield Utricularia vulgaris common bladderwort Ceratophyllum demersum coontail Nitella sp. stonewort Typha latifolia broadleaf cattail Utricularia purpurea eastern purple bladderwort Najas flexilis bushy pondweed Wolffia sp. watermeal Myriophyllum heterophyllum* variable milfoil Sparganium americanum bur-reed Spirodela polyrhiza big duckweed Nuphar variegatum yellow water lily Polygonum pensylvanicum Pennsylvania smartweed Agalinis purpurea purple false foxglove Carex lurida lurid sedge Sagittaria latifolia arrowhead Bidens cernua nodding bur marigold Triadendum virginicum marsh St. Johnswort Eleocharis obtusa blunt spike rush Potamogeton pusillus small pondweed Potamogeton epihydrus ribbonleaf pondweed Elodea canadensis. waterweed Lemna minor lesser duckweed * non-native, invasive species A stand of common reed (Phragmites australis) is present at the northwest edge of the emergent wetland to the north of Pine Meadow Pond. Although Geosyntec s aquatic vegetation survey did not extend beyond the pond into the wetland area, the stand of common reed is visible from a nearby walking trail. 62


66 Pine Meadow Pond Representative Photos Photo 13: Most of Pine Meadow Pond was comprised of a very dense assemblage of native floating-leaf and submerged species. As shown in the photo, aquatic plant growth was densest at the shallow northern end of the pond, where the pond gradually transitions to wet meadow/emergent marsh community Photo 14: Common bladderwort, a carnivorous plant that captures its prey in sophisticated bladder-like traps, was a common species throughout most of Pine Meadow Pond. 63


67 Photo 15: Coontail, a free floating submerged species, was dominant plant at three sampling stations in the northern end of Pine Meadow Pond. Photo 16: The southern end of the pond ranges from very dense growth at the shallow near-shore areas to sparse growth in the deeper central area. 64
68 Legend Station Location Vegetation Density: Sparse: 0-25% Moderate: 26-50% Dense: 51-75% Very Dense: % Q:\GISProjects\BW0265-Ayer_ponds\vegetation_maps_nov14.mxd ACTON, MASSACHUSETTS Ayer Conservation Commission Ayer Pond Assessments Aquatic Vegetation Survey Date: 8/28/ Feet q PINE MEADOW POND AQUATIC VEGETATION DENSITY Figure 3.4
69 Table 3.6: Aquatic Vegetation Survey Tally Sheet - Pine Meadow Pond (Ayer, MA) Location: Pine Meadow Pond (Ayer, MA) species present at monitoring station Date: 9/10/2014 Surveyed by: Bob Hartzel species dominant at monitoring station Plant Species scientific name common name # stations present # stations dominant Monitoring Locations Nymphaea odorata white water lily Brasenia schreberi watershield 12 7 Utricularia vulgaris common bladderwort 11 0 Ceratophyllum demersum coontail 10 3 Nitella sp. stonewort 5 1 Typha latifolia broadleaf cattail 4 0 Utricularia purpurea eastern purple bladderwort 4 0 Najas flexilis bushy pondweed 4 0 Wolffia sp. watermeal 4 0 Myriophyllum heterophyllum* variable milfoil 3 0 Sparganium sp. bur-reed 3 0 Spirodela polyrhiza big duckweed 3 0 Nuphar variegatum yellow water lily 2 0 Polygonum pensylvanicum Pennsylvania smartweed 2 0 Agalanis purpurea purple false foxglove 1 0 Carex lurida lurid sedge 1 0 Sagittaria latifolia arrowhead 1 0 Bidens cernua nodding bur marigold 1 0 Triadendum virginicum marsh St. Johnswort 1 0 Eleocharis obtusa blunt spike rush 1 0 Potamogeton pusillus small pondweed 1 0 Potamogeton epihydrus ribbonleaf pondweed 1 0 Elodea canadensis. waterweed 1 0 Lemna minor lesser duckweed 1 0 # of species present Plant Density Rating Plant Biomass Rating Average * non-native, invasive species Rating Density (% cover) Biomass 0 Plants Absent Plants Absent Sparse: 1-25% Moderate: 26-50% Dense: 51-75% Very Dense: % Trace to sparse plant biomass Less abundant growth, or in less than half of water column Substantial growth through majority of water column Abundant growth throughout water column to surface
70 Sandy Pond Geosyntec conducted a vegetation survey of Sandy Pond (73 acres) on September 16, The species observed during the survey are listed in the table to the right, in order of relative abundance as observed at the sampling stations presented on Figure 3.5. General observations from the Sandy Pond vegetation survey are summarized below: 21 species were observed at Sandy Pond, with a species richness index of Overall plant growth was sparse (0-25% growth density) over most of the pond. Most of the pond perimeter was characterized by a relatively narrow band of moderate plant growth, with some areas transitioning from dense to moderate growth within the littoral zone. Very dense growth was observed only within two shallow cove areas, located at the eastern inlet and northwestern portion of the pond. These coves were also notable as the only sampling locations where invasive fanwort (Cabomba caroliniana) was a dominant species. Invasive variable milfoil (Myriophyllum heterophyllum) was also a dominant species in the northwestern cove. Sandy Pond Plant Species, 09/16/2014 Scientific Name Pontederia cordata Potamogeton robbinsii Nymphaea odorata Brasenia schreberi Potamogeton epihydrus Najas gracillima Cabomba caroliniana* Elatine minima Myriophyllum heterophyllum* Typha angustifolia Sparganium americanum Utricularia purpurea Sagittaria latifolia Potamogeton pusillus Ceratophyllum demersum Nuphar variegatum Utricularia vulgaris Eleocharis sp. Eriocaulon septangulare In the nearshore area, plant growth was typically comprised of an assemblage of native species. The most commonly observed species included pickerelweed (Pontederia cordata), Robbin s pondweed (Potamogeton robbinsii), Phragmites australis Lemna minor * non-native, invasive species white water lily (Nymphaea odorata), watershield (Brasenia schreberi), ribbonleaf pondweed (Potamogeton epihydrus) and slender waternymph (Najas gracillima). Common Name pickerelweed Robbin's pondweed white water lily watershield ribbonleaf pondweed slender waternymph fanwort waterwort variable milfoil narrowleaf cattail bur-reed eastern purple bladderwort arrowhead thin-leaf pondweed coontail yellow water lily common bladderwort spike rush pipewort common reed lesser duckweed In deeper potions of the littoral zone, vegetation growth was typically sparse, with low growth of slender waternymph often the most abundant plant. Small stands of common reed (Phragmites australis) were observed at several locations around the perimeter of sandy Pond. Although this species is considered invasive, it is a wetland plant rather than a true aquatic species, and prefers areas with water level fluctuations ranging between 15 cm above to 15 cm below the surface. 67


71 Sandy Pond Representative Photos Photo 17: Pickerelweed was a common emergent plant along Sandy Pond s southern near-shore area. Most of the Pond s open water area exhibited sparse growth of aquatic plants. Fanwort Photo 18: Very dense growth was observed at the Pond s eastern inlet cove, including surface growth of white water lily and dense submerged growth of invasive fanwort. 68


72 Photo 19: A small stand of Common Reed along the Pond s northern shoreline, near monitoring station #10. Photo 20: Watershield, an oval-shaped floating-leaf species, was most commonly observed along the northern perimeter of Sandy Pond 69
73 Legend Station Location Vegetation Density: Sparse: 0-25% Moderate: 26-50% Dense: 51-75% Very Dense: % Q:\GISProjects\BW0265-Ayer_ponds\vegetation_maps_nov14.mxd ACTON, MASSACHUSETTS Ayer Conservation Commission Ayer Pond Assessments Aquatic Vegetation Survey Date: 8/28/ Feet q SANDY POND AQUATIC VEGETATION DENSITY Figure 3.5
 Location: Sandy Pond (Ayer, MA) Date: 9/16/2014 Surveyed by: Bob Hartzel species present at monitoring station species dominant at")
74 Table 3.7: Aquatic Vegetation Survey Tally Sheet - Sandy Pond (Ayer, MA) Location: Sandy Pond (Ayer, MA) Date: 9/16/2014 Surveyed by: Bob Hartzel species present at monitoring station species dominant at monitoring station Plant Species scientific name common name Pontederia cordata pickerelweed 13 3 Potamogeton robbinsii Robbin's pondweed 13 2 Nymphaea odorata white water lily 8 3 Brasenia schreberi watershield 7 2 Potamogeton epihydrus ribbonleaf pondweed 7 1 Najas gracillima slender waternymph 7 1 Cabomba caroliniana * fanwort 6 3 Elatine minima waterwort 5 0 Myriophyllum heterophyllum* variable milfoil 3 2 Typha angustifolia narrowleaf cattail 3 2 Sparganium americanum bur-reed 3 0 Utricularia purpurea eastern purple bladderwort 3 0 Sagittaria latifolia arrowhead 3 0 Potamogeton pusillus thin-leaf pondweed 2 0 Ceratophyllum demersum coontail 2 0 Nuphar variegatum yellow water lily 2 0 Utricularia vulgaris common bladderwort 1 0 Eleocharis sp. spike rush 1 0 Eriocaulon septangulare pipewort 1 0 Phragmites australis* common reed 1 0 Lemna minor lesser duckweed 1 0 * non-native, invasive aquatic species # stations present # stations dominant # species present at sampling station Plant Density Rating Plant Biomass Rating Monitoring Locations Average
75 Flannagan Pond Geosyntec conducted a vegetation survey of Flannagan Pond (87 acres) on September 19, The species observed during the survey are listed in the table to the right, in order of relative abundance as observed at the sampling stations presented on Figure 3.6. General observations from the Flannagan Pond vegetation survey are summarized below: 24 species were observed at Flannagan Pond, with a species richness index of Plant growth was most abundant in the eastern end of the pond, where white water lily dominated the surface canopy and eastern purple bladderwort was the dominant submerged species. The easternmost sampling station (station #1), near the inlet from Sandy Pond, was the only station where invasive fanwort was observed. At the pond s southeastern perimeter, very dense aquatic vegetation transitions to an emergent scrubshrub community. Invasive variable milfoil was observed at five sampling locations, all in the eastern end of the pond. Variable milfoil was a dominant plant at one sampling station (#17). Invasive fanwort was observed and was a dominant plant at one sampling station (#1) at the eastern end of the pond, near the inlet from Sandy Pond. Flannagan Pond Plant Species, 09/19/2014 Scientific Name Common Name Nymphaea odorata white water lily Utricularia purpurea eastern purple bladderwort Brasenia schreberi watershield Potamogeton epihydrus ribbonleaf pondweed Utricularia gibba humped bladderwort Myriophyllum heterophyllum* variable milfoil Nuphar variegatum yellow water lily Potamogeton bicupulatus snail-seed pondweed Eleocharis sp. spike rush Lythrum salicaria* purple loosestrife Utricularia vulgaris common bladderwort Pontederia cordata pickerelweed Peltandra virginica arrow arum Potamogeton pusillus small pondweed Polygonum amphibium water smartweed Cabomba caroliniana* fanwort Sparganium sp. bur-reed Najas gracillima slender waternymph Nitella sp. stonewort Potamogeton crispus* curly-leaf pondweed Triadendum virginicum marsh St. Johnswort A small quantity of invasive curlyleaf pondweed was observed at one sampling station (#2) at the eastern end of the pond. Curlyleaf pondweed tends to reach its seasonal growth peak early in the summer, and is often in decline by mid-july. Cephalanthus occidentalis Decodon verticillatus Dulichium arundinaceum * non-native, invasive species common buttonbush water willow three-way sedge Very dense to moderate plant growth was observed along the western end on the pond. A cove area at the northwest corner of the pond had very dense growth dominated by watershield and yellow water lily. Most of the central portion of the pond and its exhibited moderate to sparse plant growth, often characterized by patchy bands of water lilies and a varied assemblage of native submerged species. Common species also included ribbonleaf pondweed and humped bladderwort. All other species were observed at less than 25% of the sampling stations. 72
 at the eastern end of")

76 Flannagan Pond Representative Photos Photo 21: Watershield and eastern purple bladderwort (in flower) at the eastern end of Flannagan Pond. Photo 22: At Flannagan Pond s southeastern perimeter, aquatic vegetation transitions to a shrub swamp community. 73


77 Photo 23: View to the east from sampling station #7, towards the narrow central portion of Flannagan Pond. Aquatic vegetation was typically sparse in this area, with some narrow bands of moderate growth near the shoreline. Photo 24: Dense growth of white water lily along the northwestern shore of Flannagan Pond. 74
78 18 Legend Station Location Vegetation Density: Sparse: 0-25% Moderate: 26-50% Dense: 51-75% Very Dense: % Q:\GISProjects\BW0265-Ayer_ponds\vegetation_maps_nov14.mxd ACTON, MASSACHUSETTS Ayer Conservation Commission Ayer Pond Assessments Aquatic Vegetation Survey Date: 8/28/ Feet q FLANNAGAN POND AQUATIC VEGETATION DENSITY Figure 3.6
 Date: 9/19/2014 Surveyed by: Bob Hartzel species present at monitoring station species dominant at monitoring station Plant")
79 Table 3.8: Aquatic Vegetation Survey Tally Sheet - Flannagan Pond (Ayer, MA) Date: 9/19/2014 Surveyed by: Bob Hartzel species present at monitoring station species dominant at monitoring station Plant Species scientific name common name # stations present # stations dominant Nymphaea odorata white water lily 18 8 Utricularia purpurea eastern purple bladderwort 15 4 Brasenia schreberi watershield 12 1 Potamogeton epihydrus ribbonleaf pondweed 9 0 Utricularia gibba humped bladderwort 7 0 Myriophyllum heterophyllum* variable milfoil 5 1 Nuphar variegatum yellow water lily 4 1 Potamogeton bicupulatus snail-seed pondweed 4 0 Eleocharis sp. spike rush 4 0 Lythrum salicaria* purple loosestrife 3 0 Utricularia vulgaris common bladderwort 3 0 Pontederia cordata pickerelweed 3 0 Peltandra virginica arrow arum 3 0 Potamogeton pusillus small pondweed 2 0 Polygonum amphibium water smartweed 2 0 Cabomba caroliniana* fanwort 1 1 Sparganium sp. bur-reed 1 0 Najas gracillima slender waternymph 1 0 Nitella sp. stonewort 1 0 Potamogeton crispus* curly-leaf pondweed 1 0 Triadendum virginicum marsh St. Johnswort 1 0 Cephalanthus occidentalis common buttonbush 1 0 Decodon verticillatus water willow 1 0 Dulichium arundinaceum three-way sedge 1 0 # of species present Plant Density Rating Plant Biomass Rating Monitoring Locations Average * non-native, invasive species
80 3.3 Aquatic Plant Management Recommendations When evaluating aquatic plant management strategies for the six Ayer ponds included in this study, it is important to consider the following: 1. The current condition of each pond with regard to plant abundance, species composition and distribution, morphology (depth, extent of littoral zone, etc.), and water quality; 2. The goals of the Town and lake homeowners with regard to maintenance of each pond s ecological and recreational values; 3. Each pond s aquatic plant management history, with attention to how current conditions may be influenced by past plant control actions. Summaries of each pond s plant management history include the period of based on review of the following reports provided by the Ayer Conservation Commission: Aquatic Control Technology, Inc. (ACT). January Project Completion Report for the 2013 Aquatic Management Program at Flannagan Pond. Lycott Environmental, Inc. Revision Date April Final Report for Management of Aquatic Vegetation, Flannagan Pond, Ayer Massachusetts. Aquatic Control Technology, Inc. (ACT). November Project Completion Report for the 2011 Aquatic Management Program at Pine Meadow Pond & Sandy Pond. Aquatic Control Technology, Inc. (ACT). November Results of October Inspection of the Ayer Ponds & 2009 Recommendations. Aquatic Control Technology, Inc. (ACT). October Baseline Biological Survey Report and Management Recommendations for the Ayer Ponds. Aquatic Control Technology, Inc. (ACT). March Final Report on the Water Quality Monitoring Program at Sandy Pond Town of Ayer Conservation Commission. Meeting Minutes for 5/17/ The location of the pond with regard to (1) potential sources of invasive species from upstream water bodies and (2) downstream water bodies potentially affected by existing invasive species. Non-native species can outcompete beneficial native species and grow to nuisance levels even in ponds with relatively low nutrient concentrations. 5. Costs, feasibility, longevity of treatment, and potential non-target impacts associated with the aquatic plant management alternatives. The optimal approach to plant management for each pond is likely to change over time. The best approach for one area of a pond may be inappropriate for another area, depending on plant growth density, species composition, and depth. It will be important to continually re-assess the effectiveness of and need for plant management as conditions change over time, particularly with regard to non-native, invasive species that have been repeatedly controlled in the past. In the absence of active management, recreational uses can also be impaired by dense growth of native species in some sections of the ponds included in this study. The challenge lies in implementing a plant management strategy that properly balances both ecological and recreational values for the long term. Geosyntec s aquatic vegetation management recommendations are provided on the following pages. These recommendations are based on Geosyntec s field investigations, review of each pond s aquatic plant management history, and consultation with the Ayer Conservation Commission regarding the goals for each pond. 77
.")
81 3.3.1 Balch Pond Key Plant Management Issues Pond Use/Access Upstream/Downstream Water Bodies Recent Aquatic Plant Management History Invasive fanwort observed in trace quantities at half of the sampling stations, with somewhat greater abundance at one station in the eastern part of the pond. Very limited public access (no formal boat access, swimming beach, etc.). Recreational use appears to be limited primarily to shoreline fishing and limited non-motorized boat access via private property. Balch Pond receives flow from Flannagan Pond and flows into Grove Pond. Both of these ponds already have fanwort. None Aquatic Plant Management Recommendations Given Balch Pond s small size, very limited public accessibility, and overall sparse-moderate growth of a predominantly native assemblage of aquatic plants, no plant management actions are recommended at this time. Despite receiving flow from Flannagan Pond, which has a well-documented history of efforts to control invasive fanwort and variable milfoil over the past two decades, it is notable that Balch Pond had a relatively minor presence of fanwort and no variable milfoil observed during the 2014 vegetation survey. It is possible that the abundance of Robbin s pondweed (the most abundant and well distributed species in the pond), is helping to suppress growth and prevent spread of these invasive species. Robbin s pondweed can grow in dense colonies, but generally does not interfere with recreational water uses because of its low growth which tends to blanket the pond bottom. Continued monitoring of Balch Pond s vegetation is recommended to determine if the modest population of fanwort is stable, or if increased future growth warrants re-evaluation of the need for management. Robbin s Pondweed (Potamogeton robbinsii) 78

82 3.3.2 Grove Pond Key Plant Management Issues Pond Use/Access Upstream/Downstream Water Bodies Recent Aquatic Plant Management History The invasive plant assemblage at Grove Pond includes significant areas of very dense fanwort and variable milfoil growth, with these species intermixed in most areas. Small to moderately-sized clusters of water chestnut scattered in eastern end of pond. Dense growth of native floating-leaf species makes boat passage very difficult in some areas, particularly in the eastern end of the pond and shallow near-shore areas. Limited public access (informal boat and shoreline access via Peroni Park). Not suitable for swimming. Boat use impeded by extremely dense plant growth, making which makes many areas impassable for motorized craft and difficult for paddling during the growing season. Grove Pond is downstream of all other ponds included in this study, and is also fed by Bowers Brook from the south. Grove Pond flows into Plow Shop Pond. None Aquatic Plant Management Recommendations: Management of the extensive fanwort and variable milfoil growth in Grove Pond would require aggressive and repeated measures. Given the extensive range and abundance of these species in Grove Pond, eradication is not feasible. Management options to provide short-term control (i.e., 1-2 seasons) include: 79 whole-pond chemical treatments using systemic herbicides (e.g., fluridone for fanwort) and/or contact herbicides (e.g., diquat for variable milfoil); spot chemical treatments for targeted areas; treatment of limited channel areas to improve accessibility for non-motorized boat access. Given the pond s shallow depths and the limited recreational use that is appropriate for this pond, aggressive and repeated efforts to control vegetation on a whole-pond basis are not recommended. Depending on the Town s goals for public access to Grove Pond, periodic spot treatments to maintain boating channels may be worth consideration. This approach could include use of glyphosate to target water lilies, particularly in the eastern portion of the pond that is nearly impassable during the growing season due to very dense floating-leaf vegetation. Clipper (flumioxazin) could be used in the broad areas dominated by fanwort. Clipper was registered for use in Massachusetts in This contact herbicide can effectively spot-treat for fanwort with a very short exposure time. Clipper can only be used to treat the same areas of a pond once every 4 years, unless the area is in the immediate vicinity of a high use area such as a beach or boat launch. The relatively modest infestation of water chestnut in the eastern end of the pond has the potential to spread rapidly if control actions are not taken. Immediately following the August 2014 vegetation survey, Geosyntec reported the water chestnut infestation to the Ayer Conservation Agent, and discussed the potential for volunteers to hand harvest this plant from canoes or
83 kayaks. Although water chestnut can spread rapidly, it is an annual plant that propagates primarily by seed. New, small-scale infestations can sometimes be controlled through aggressive and ongoing harvesting. The plant has a distinctive rosette of floating leaves (see Photo 8) that is relatively easy for volunteers to identify and remove, although care must be taken to remove the entire plant and its root structure rather than snap the stem and only remove the top part of the plant. Harvesting efforts are most effective if conducted before the plants nutlets are released in the fall. Once water chestnut has become wellestablished, eradication is difficult and requires multi-year harvesting efforts because its seeds can lie dormant for up to 12 years. 80
.")
84 3.3.3 Lower Long Pond Key Plant Management Issues Pond Use/Access Upstream/Downstream Water Bodies Recent Aquatic Plant Management History Protection of excellent biodiversity and assemblage of native species that are providing high quality aquatic habitat. Public Access via dock on Loon Hill Road (no apparent access for trailered/motorized boats). Lower Long Pond has a predominantly undeveloped watershed and no upstream surface water bodies that could act as sources of invasive species. Lower Long Pond flows to Sandy Pond. None Plant Management Recommendations: As discussed in Section 3.2, Lower Long Pond could be considered a regionally significant example of a healthy and diverse aquatic plant community. The pond provides valuable, high-quality habitat that includes both submersed and floating-leaf communities and a wide range of transitional wetland species. Healthy native aquatic plant communities help prevent the establishment of invasive non-native plants and provide the foundation for a healthy pond ecosystem. In most instances, control or active management of diverse and stable native aquatic plant communities should be discouraged or should be carefully limited to high-use recreational areas that are next to docks or within navigational channels. Based on Geosyntec s 2014 vegetation survey, no plant management actions are recommended for Lower Long Pond at this time. Ongoing vegetation monitoring is highly recommended to ensure rapid identification and response to any future non-native species infestations that may occur. This monitoring could be performed by a consultant, but could also be performed by properly trained volunteers. To aide volunteer aquatic plant monitoring efforts, the Massachusetts Department of Conservation and Recreation (DCR) provides training and educational materials for volunteers through the Weed Watcher Program. Information on this program and links to aquatic vegetation field guides and related information can be found at: In addition to the resources mentioned above, volunteer monitoring efforts would also be aided by development of an aquatic vegetation field guide that is specific to the species found in Ayer s ponds. This kind of field guide could include line drawings, photos and descriptions of the species identified during this study, plus other key non-native species that volunteers should be aware of. An example field guide, developed by Geosyntec for Mirror (Tuftonboro, NH) can be viewed at: 81

85 3.3.4 Pine Meadow Pond Key Plant Management Issues Pond Use/Access Upstream/Downstream Water Bodies History of repeated chemical treatment over the past two decades, primarily for control of native species vegetation survey reported that most of the pond was comprised of a very dense assemblage of native floating-leaf and submerged species. The only non-native species observed in 2014 was variable milfoil, found in small quantities at three locations. Public access to shoreline via town-owned land and trail off Groton- Harvard Road. Boats (canoes/kayaks) can be launched from this point, but must be carried a short distance down trail. Mostly undeveloped shoreline (few houses abut southern tip of the pond) Limited suitability for swimming, due to shallow depths, mucky bottom sediments, and dense vegetation Pine Meadow Pond receives flow from Rock Meadow Pond (not included in this study) and flows into Flannagan Pond. Recent Aquatic Plant Management History 1997 chemical treatment for submersed and floating-leaf species (herbicide not specified) 1998 chemical treatment for native floating-leaf species and emergent purple loosestrife (herbicides not specified) 2000 treatment to control submersed species (herbicide not specified) 2001 chemical treatment to control water lilies (herbicide not specified) 2007 spot treatment for milfoil and water lilies (herbicides not specified) 2011 chemical treatment with Reward (diquat, broad-spectrum contact herbicide) and AquaPro (glyphosate) for water lilies Plant Management Recommendations: Most of Pine Meadow Pond is very shallow and has conditions that are favorable for the growth of aquatic plants. As expected with such conditions, most of the pond is very densely vegetated with an assemblage of submersed and floating leaf plants, and includes a gradual transition to a wet meadow/marsh community at its northern end. Fortunately, this dense assemblage of aquatic and wetland species is predominantly native, with only a minor presence of one nonnative species (variable milfoil). Based on review of previous reports, it is unclear how the current low-level growth of variable milfoil compares to previous years. As noted above, Pine Meadow Pond does not appear to be well-suited for increased swimming access. The pond and its adjacent Town-owned land do provide good opportunities for. The Town s plant management strategy for Pine Meadow Pond should consider the actions that are required to maintain these uses and the pond s habitat values, including the following: 82
86 Periodic spot treatments to maintain boating channels are recommended, with a focus on use of glyphosate to target white water lilies and watershield. The pond s very shallow depths, especially in the northern end, would make mechanical control of lilies (e.g. harvesting, hydro-raking) difficult or infeasible in these areas. Very dense growth of water lilies tends to impede (non-motorized) boat access more than submersed species. Glyphosate treatments for water lilies tend to be most effective when conducted as a split treatment involving two applications over the course of a single growing season. Split treatments cost from $700-$1,100 per acre, with the lower end of the cost range for larger application areas. For a 5-acre treatment area (or larger), the cost is approximately $700-$800 per acre. Spot-treatment of native submersed species should be conducted only on an as-needed basis, based on updated plant survey information documenting broad boat access impairment specifically attributed to these species. Any efforts to control of submersed species should be approached with caution, as this could create an opportunity for variable milfoil or other invasive species to expand in range and dominance within the pond over time. Native aquatic plant communities help prevent the establishment of invasive non-native plants and provide the foundation for a healthy pond ecosystem. Ongoing monitoring is recommended to determine if the small population of variable milfoil is stable, or if increased future growth warrants re-evaluation of the need for management. If the population is found to be expanding, targeted spot treatments with diquat (Reward) are recommended. 83

87 3.3.5 Sandy Pond Key Plant Management Issues Pond Use/Access Upstream/Downstream Water Bodies Recent Aquatic Plant Management History Maintenance of safe and enjoyable swimming conditions at Town Beach. History of treatment for nuisance fanwort and variable milfoil, most recently only in vicinity of Town Beach. Swimming access at Town Beach. No formal public boat access, although many shoreline property owners have both motorized and non-motorized boats. Sandy Pond receives flow from Lower Long Pond and flows to Flannagan Pond chemical treatment (herbicide not specified) 2007 Sonar treatment for fanwort and variable milfoil 2008 limited chemical spot treatment 2011 chemical treatment with Reward (diquat) and AquaPro (glyphosate) for submersed and floating/emergent growth in vicinity of Town Beach Plant Management Recommendations: 84 With the exception of two cove areas, most of Sandy Pond is sparsely vegetated, with a narrow perimeter band of moderately dense and predominantly native vegetation. Based on the conditions observed during the 2014 survey, no immediate plant management actions are required. However, continued focus on the Town Beach area is recommended to maintain safe and enjoyable swimming conditions. Although herbicide treatments using broad-spectrum herbicides to target nuisance species are not recommended at this time, such herbicides should be a tool for future control in limited areas where recreational access is impaired and the other methods either do not provide relief or are impractical. In such cases, the correct herbicide will depend on target species (e.g., diquat for variable milfoil, glyphosate for floating leaf plants including water lilies and watershield). For new and relatively small areas of infestation that may emerge in the future, diver hand harvesting can be an effective control technique. Diver assisted suction harvesting (DASH) has also proven to be an effective technique for somewhat larger areas. Although labor intensive, when conducted properly these techniques remove the entire plant and can provide multi-year effectiveness. DASH costs can vary widely (typically $4,000 to 10,000 per acre), depending on plant density, sediment type, and the size of the harvested area. For new areas of infestation with moderate growth density, the lower end of this cost range ($4,000-$7,000 per acre) is expected. The risk of plant fragmentation associated with DASH boat operation can be reduced by incorporating the following controls: 1. Water and plants pumped to the collection boat should be filtered through a mesh with a maximum 1/8-inch opening size to separate plant material from water discharged off the boat. No plant fragments should be discharged back to the lake. 2. A moveable silt/fragment curtain suspended in the water column from the surface to the lake bottom could be used to prevent plant fragments from spreading beyond the locus of active plant removal areas.

88 3.3.6 Flannagan Pond Key Plant Management Issues Pond Use/Access Upstream/Downstream Water Bodies Recent Aquatic Plant Management History History of nuisance levels of fanwort, variable milfoil, and water lilies impeding recreational uses over the past two decades vegetation survey reported a limited presence of variable milfoil and fanwort in the eastern end of the pond. Dense to very dense growth floating-leaf plants dominated by white water lily, predominantly in the eastern end of the pond and other shallow coves. Informal boat launching (car-top, non-trailered) off Snake Hill Road, with limited road edge parking Potential for additional access via Central Ave. water pumping station Shoreline is well-developed with homes, significant recreational use by home owners Flannagan Pond receives flow from Sandy Pond and Pine Meadow Pond, and flows into Balch Pond chemical treatment with Sonar AS for fanwort 1999 chemical treatment Sonar AS for fanwort 2001 chemical treatment to control water lilies (herbicide not specified) 2002 Sonar AS treatment (fanwort) and Reward spot treatments (variable milfoil) 2007 Sonar treatment for fanwort and variable milfoil 2012 chemical treatments: Sonar AS (fanwort); Reward (variable milfoil) 2013 chemical treatments: Reward applied to western two-thirds of pond for variable milfoil; SonarOne applied to entire pond for fanwort (Sonar Genesis applied in eastern basin as a booster treatment). Plant Management Recommendations: During the 2014 plant survey, invasive variable milfoil and fanwort were observed only in the eastern end of the pond. Given the pond s history of nuisance conditions associated with these species and the pond s directional flow from east to west, recurrence of growth and spread from the observed locations is anticipated. Based on the multi-year (2-3 year) treatment longevity for fanwort control that fluridone products have been reported to provide at Flannagan Pond in the past, future applications are recommended on an as-needed basis. Given the relatively high flow rate through the pond, the pelletized formulation and slower release rate of SonarOne is likely to be the most cost-effective fluridone product for a pond-wide treatment. Periodic thinning of dense water lilies may also be necessary in some areas to allow for boat access and open water recreation. Given the pond s shallow depths and history with fanwort and variable milfoil (which can be spread by fragmentation), mechanical methods are not recommended for control of water lilies. Spot treatments with glyphosate are recommended when conditions prevent boat access to shoreline properties in these areas. 85
89 Section 4. Field Watershed Investigation Geosyntec conducted a field watershed investigation on November 11, 2014, which included the watersheds of Grove Pond, Balch Pond, Pine Meadow Pond, Flannagan Pond, Sandy Pond, and Lower Long Pond in the Town of Ayer, Massachusetts (collectively referred to as Ayer Ponds ). Geosyntec also met with Mr. Mark Wetzel, P.E., Superintendent of Town of Ayer Public Works Department and Chief Pedrazzi with the Town of Ayer Fire Department on May 13, 2015 to identify additional locations of known flooding and erosion in the Ayer Ponds watershed. Based on the results of this field investigation and assessment, the following pages present potential best management practices (BMPs) and restoration practices that relate to stormwater management and phosphorus load reduction for the six ponds. The sites discussed in this section are not intended to be an all-inclusive listing of potential stormwater improvements in the pond watersheds. Rather, these sites are representative examples of potential stormwater improvements and retrofits that could be implemented at numerous sites throughout the watersheds. It is also important to note that several of the ponds included in this study have very limited proximal watershed development and very limited existing stormwater infrastructure (e.g., Lower Long Pond and Pine Meadow Pond). As a result, these areas offer very limited opportunities for stormwater improvements that would offer the Town good cost/benefit. Figure 4.1 shows the location of each proposed BMP site. Table 4.1 presents cost estimates and phosphorus loading reduction estimate calculations for each proposed improvement. 4.1 Watershed BMP Recommendations The BMP improvement sites described on the following pages were identified during Geosyntec s field investigations. The design goal for all of the proposed BMPs would be to size the BMP to treat and infiltrate the water quality volume to the maximum extent practicable. The water quality volume is defined in the Massachusetts Stormwater Handbook as the volume equal to 0.5 inches runoff times the total impervious area within the drainage area of the BMP. However, each proposed BMP should be designed to get the most treatment that is practical given the size and logistical constraints of the respective site. Each BMP site description includes: A site summary that describes the current conditions and stormwater drainage patterns; A description of proposed improvements; Estimated costs that represent installed contractor construction costs and engineering design (estimated permitting costs were not included); Estimated annual phosphorus load reduction for the proposed BMP, assuming that the practice is properly installed, maintained and designed according to guidelines provided in the Massachusetts Stormwater Handbook; Typical annual operation and maintenance (O & M) costs for the proposed BMP practice; Anticipated permitting required under the Massachusetts Wetlands protection Act (WPA) for the proposed BMP practice; and Recommended priority for BMP implementation (low, medium or high). The priority level is based on factors including cost, phosphorus load reduction, constructability, location, ease of maintenance and best professional judgment. 86
90 q Long Pond Pine Meadow Pond A y e r Flannagan Pond 5A & 5B Sandy Pond 1 2 Balch Pond Q:\GISProjects\BW0265-Ayer_ponds\ayer_ponds-BMPconcepts-figure1.mxd Legend Concept BMP Locations Town Boundary ACTON, MASSACHUSETTS Ayer Conservation Commission Survey of Ayer's Ponds 2/6/2015 Grove Pond Source: Esri, DigitalGlobe, GeoEye, i-cubed, Earthstar Geographics, CNES/Airbus DS, USDA, USGS, AEX, Getmapping, Aerogrid, IGN, IGP, swisstopo, and the GIS User Community, Esri, HERE, DeLorme, TomTom, MapmyIndia, OpenStreetMap contributors, and the GIS user community 2,000 1, ,000 Feet AYER PONDS Potential BMP Improvement Sites Figure 4.1
.")
 adjacent to an 18-inch culvert; the inlet location of this culvert is unknown.")
. Grove Pond is approximately 350 feet from this area.")

91 Site 1: Pirone Park Grove Pond Watershed Site Summary: Parking lot runoff sheet flows towards a low point at the western side of the Pirone Park parking lot (Photo 1-1) and proceeds across a grassy area (Photo 1-2). It appears that water ponds in this area and ultimately discharges under the railroad ties (Photo 1-2) and through the chain link fence down a steep slope behind the chain link fence. This flow pattern has resulted in an eroded channel along the steep slope (Photo 1-3) adjacent to an 18-inch culvert; the inlet location of this culvert is unknown. Furthermore, water appears to pond adjacent to the break in the chain link fence and flows down a common access path to the baseball fields. This flow pattern has resulted in rilling and erosion along the path (Photo 1-4). Grove Pond is approximately 350 feet from this area. Photo 1-1 Photo 1-2 Proposed Improvement: Install an approximately 600 square foot bioretention cell to collect and treat stormwater runoff from the parking lot. The bioretention cell would allow stormwater to infiltrate into the underlying soil and reduce potential for erosion along the steep slopes. With further investigation, overflow from the bioretention cell may be routed into the existing 18-inch pipe. Photo 1-5 is a rendering of the proposed bioretention area. Image 1-6 is a cross section of a typical bioretention cell. Photo 1-3 Photo 1-4 Stabilize the existing eroded channels (Photo 1-3 and Photo 1-4) with soil, erosion control blanket and vegetation to reduce erosion. Install outlet protection at the 18-inch pipe. Estimated Costs: Engineering Design: $3,000 - $5,000 Construction: Bioretention Cell: $7,722 - $9,438 Slope Stabilization/Revegetation: $351 - $429 Outlet Protection: $468 - $572 88
.")
 bioretention cell overflow inlet Image 1-6 Image 1-6 is a cross section schematic of a typical bioretention cell.")
92 Site 1: Pirone Park (continued) Photo 1-5 Estimated Phosphorus Reduction: Bioretention Cell: lb/yr Estimated O & M Costs: $150 - $200/yr Remove accumulated sediment biannually and maintain vegetation as needed (similar to traditional landscaping). Wetland Permitting: No WPA permitting anticipated Priority: High (Note: The Ayer Department of Public Works has moved forward with development of final design schematics, details, and specifications for this site.) bioretention cell overflow inlet Image 1-6 Image 1-6 is a cross section schematic of a typical bioretention cell. Bioretention cells are shallow landscaped depressions that incorporate plantings and engineered soil with a high porosity and infiltration capacity. Bioretention cells control stormwater runoff volume by providing storage, reducing peak discharge, and removing pollutants through physical, chemical, and biological processes occurring in plants and soil. 89
, which discharges directly into Grove Pond approximately 200 feet away.")
93 Site 2: Maple Street Grove Pond Watershed Photo 2-1 Site Summary: An existing 24 x 24 catch basin at the end of Maple Street (between 23 and 28 Maple Street) (Photo 2-1) collects untreated runoff from the southern portion of Maple Street (Photo 2-2), which discharges directly into Grove Pond approximately 200 feet away. Proposed Improvement: Install a bioretention cell, approximately 150 square feet in size, in the area surrounding the catch basin (Photo 2-3). The existing catch basin would be used as an overflow device during larger storm events, which exceed the storage capacity of the bioretention cell. catch basin Photo 2-2 Estimated Cost: Engineering Design: $1,000 - $1,500 Construction: $1,931 $2,360 Estimated Phosphorus Reduction: lb/yr Estimated O & M Costs: $50 - $100/yr Remove accumulated sediment from bioretention cell annually and maintain/replace plants as needed every two years. Wetland Permitting: No WPA permitting anticipated Priority: Medium Photo 2-3 catch basin will receive overflow 90

94 Site 3: Groveland Street Flannagan Pond Watershed Site Summary: Untreated stormwater runoff from Groveland Street enters a manmade earthen channel at the end of Groveland Street (Photo 3-1), which flows into Flannagan Pond, approximately 150 feet away. The unstabilized channel is an additional source of erosion and pollutant loading to Flannagan Pond. Photo 3-1 Proposed Improvements: Install a level spreader and inlet protection at the end of Groveland Street to dissipate the concentrated runoff. Stabilize the channel between the end of Groveland Street and Flannagan Pond with erosion control blanket and vegetation to (1) reduce erosion and (2) improve pollutant attenuation through vegetative filtering and uptake. channel Estimated Cost: Engineering Design: $1,500 - $2,000 Construction: Inlet Protection and Level Spreader: $234 - $286 Slope Stabilization and Revegetation: $2,106 - $2,574 Estimated Phosphorus Reduction: lb/yr Estimated O & M Costs: $100 - $200/yr Repair and revegetate the channel as needed every two years. Wetland Permitting: No WPA permitting anticipated, although a wetland delineation should be conducted to confirm that project is not within the 100-feet Buffer Zone (BZ) to wetland resource areas or within Bordering Land Subject to Flooding (BSLF). If the project is within BZ or BLSF, WPA permitting could require submittal of an Abbreviated Notice of Intent (ANOI). Priority: Low 91
 and Eastern Drive and discharges directly to Flannagan Pond, which is located approximately 180 feet away.")

95 Site 4: Oak Ridge Drive Flannagan Pond Watershed Site Summary: A 24 x 24 catch basin is located along Oak Ridge Drive (perpendicular to Eastern Drive) (Photo 4-1). This catch basin collects untreated runoff from a portion of Oak Ridge Drive (Photo 4-2) and Eastern Drive and discharges directly to Flannagan Pond, which is located approximately 180 feet away. Photo 4-1 Proposed Improvement: Remove asphalt surrounding the existing catch basin and install a 100 square foot bioretention cell in the area surrounding the catch basin along the road shoulder. The existing catch basin would be used as an overflow during larger storm events, which exceed the storage capacity of the bioretention cell. 24 x24 catch basin Estimated Cost: Engineering Design: $1,000 - $1,500 Construction: $1,362 $1,664 Estimated Phosphorus Reduction: lb/yr Estimated O & M Costs: $50/yr-$100/yr Photo 4-2 Remove accumulated sediment from bioretention cell annually, and maintain/replace plants as needed every two years. Wetland Permitting: No WPA permitting anticipated Priority: Medium 92
.")


96 Site 5A: Oak Ridge Drive Flannagan Pond Watershed Photo 5-1 Site Summary: A catch basin located at a low point on Oak Ridge Drive (across from a pump station) collects untreated runoff from the western portion of Oak Ridge Drive (Photos 5-1 and 5-2). Stormwater collects along the curb line (Photo 5-2) which discharges to the catch basin and ultimately to Flannagan Pond, located approximately 80 feet away. Erosion was observed along the bank. Proposed Improvements: Install a water quality swale to collect stormwater along the west side of Oak Ridge Drive. Stormwater will be conveyed to the water quality swale through a curb cut. The proposed water quality swale is 4 ft wide x 60 ft long water quality swale with a curb cut overflow into the existing catch basin (Photo 5-3). Install hydrodynamic separator in the existing catch basin, to provide additional treatment of untreated runoff from the eastern portion of Oak Ridge Dr. Estimated Cost: Engineering Design: $2,000 - $2,500 Construction: Water Quality Swale: $3,218 - $3,933 Hydrodynamic Separator: $7,020-$8,580 Estimated Phosphorus Reduction: lb/yr Estimated O & M Costs: $100 - $150/yr Inspect the water quality swale and hydrodynamic separate seasonally and following large storm events. Remove accumulated sediment from the swale annually and maintain/replace plants as needed every two years. Remove accumulated trash and debris, along with sediment from hydrodynamic separator as needed. Wetland Permitting: As a project with minor buffer zone disturbance, WPA permitting is expected to require an Abbreviated Notice of Intent. Priority: High Catch Basin Catch Basin Hydrodynamic Separator Water Quality Swale Photo 5-2 Photo 5-3 Curb Cut 93

97 Site 5A: Oak Ridge Drive (Continued) Flannagan Pond Watershed Image 5-4 Image 5-4 is a schematic of a typical hydrodynamic separator. A hydrodynamic separator is a stormwater management technology that treats stormwater primarily by using gravity to remove Catch particles Basin and phase separation to remove materials such as oil and grease from the water matrix. (Image source: 94

 in the area surrounding the catch basin.")
98 Site 5B: Oak Ridge Drive Flannagan Pond Watershed Site Summary: A catch basin (Photo 5-5) is located on Oak Ridge Drive opposite from the Site 5A catch basin. This catch basin receives untreated runoff from Oak Ridge Drive and from an adjacent pasture area. This catch basin discharges to the Site 5A catch basin, which ultimately discharges into Flannagan Pond approximately 80 feet away. Photo 5-5 Proposed Improvement: Install an approximately 300 square foot bioretention cell (Photo 5-6) in the area surrounding the catch basin. The existing catch basin would be used as an overflow during larger storm events which exceed the storage capacity of the bioretention cell. Catch Basin Estimated Cost: Engineering Design: $1,500 - $2,000 Construction: $3,861 - $4,719 Estimated Phosphorus Reduction: lb/yr Estimated O & M Costs: $50 - $100/yr Remove accumulated sediment from bioretention cell annually. Maintain and replace plants as needed every 2 years. Wetland Permitting: As a project with minor buffer zone disturbance, WPA permitting is expected to require an Abbreviated Notice of Intent. Photo 5-6 Overflow Catch Basin Priority: Medium Curb Cut Curb Cut 95


99 Site 6: Lake Avenue Flannagan Pond Watershed Site Summary: Photo 6-1 Untreated runoff flows east to the end of Lake Avenue, which is bordered by a forested area (Photo 6-1 and 6-2). There is no existing stormwater infrastructure at this location. Runoff proceeds from this location towards Flannagan Pond, which is approximately 170 feet away. Proposed Improvements: Install a 250 square foot bioretention cell to collect and treat the runoff from Lake Avenue (Photo 6-2). Estimated Cost: Engineering Design: $1,000 - $1,500 Construction: $3,218 $3,933 Photo 6-2 Estimated Phosphorus Reduction: lb/yr Estimated O & M Costs: $50 - $100/yr Remove accumulated sediment from bioretention cell annually; maintain/replace plants as needed every two years. Bioretention Cell Wetland Permitting: No WPA permitting anticipated Priority: Medium 96
100 Site 7: Wright Way Sandy Pond Watershed Site Summary: Photo 7-1 Untreated runoff along Wright Way flows onto and along a 180 foot long dirt shoulder near 1 Wright Way (Photo 7-1). There is no stormwater infrastructure at this location, which is located approximately 320 feet from Sandy Pond. Proposed Improvements: Install an approximately 180 square ft bioretention cell to collect and treat runoff from Wright Way (Photo 7-2). Estimated Cost: Engineering Design: $1,000 - $1,500 Construction: $2,317 - $2,831 Estimated Phosphorus Reduction: lb/yr Estimated O & M Costs: $50-$100/yr Remove accumulated sediment from the bioretention cell annually, and maintain/replace plants as needed every 2 years. Wetland Permitting: No WPA permitting anticipated Priority: Medium Photo 7-2 Bioretention Cell 97

101 Site 8: Wachusett Avenue Sandy Pond Watershed Site Summary: Untreated runoff from Wachusett Avenue East flows along the edge of road in front of 4 Wachusett Avenue East (Photo 8-1). The area along the edge of road is unvegetated and unstabilized. This location is approximately 180 feet from Sandy Pond. Photo 8-1 Proposed Improvement: Install a small 36 square foot bioretention cell at this location, which will collect, infiltrate and treat stormwater runoff (Photo 8-1). Bioretention Cell Estimated Cost: Engineering Design: $500 - $1,000 Construction: $463-$566 Estimated Phosphorus Reduction: lb/yr Estimated O & M Costs: $50 -$100/yr Remove accumulated sediment from the bioretention cell annually, and maintain/replace plants as needed every 2 years. Wetland Permitting: No WPA permitting anticipated Priority: Low 98
. Proposed Improvement: Install a 100 square foot bioretention cell to treat stormwater runoff from Mountain View Avenue (Photo 9-1).")
102 Site 9: Mountain View Avenue Sandy Pond Watershed Site Summary: Untreated runoff from a portion of Mountain View Avenue flows southwest towards the street s dead end onto a grassy area approximately 60 feet from Sandy Pond (Photo 9-1). Proposed Improvement: Install a 100 square foot bioretention cell to treat stormwater runoff from Mountain View Avenue (Photo 9-1). Estimated Cost: Engineering Design: $500 - $1,000 Construction: $1,287 - $1,573 Estimated Phosphorus Reduction: lb/yr Estimated O & M Costs: $50-$100/yr Remove accumulated sediment from the bioretention cell annually, and maintain/replace plants as needed every 2 years. Wetland Permitting: As a project with minor buffer zone disturbance, WPA permitting is expected to require an Abbreviated Notice of Intent. Priority: High Sandy Pond Bioretention Cell Photo

103 Site 10: Mountain View Avenue Sandy Pond Watershed Site Summary: Untreated runoff flows from the eastern portion of Mountain View Avenue onto a 20 foot x 6 foot dirt patch (Photo 10-1). This area is unvegetated and unstabilized and is approximately 380 feet from Sandy Pond. Photo 10-1 Proposed Improvement: Install a 100 square foot bioretention cell in this location to collect, treat and infiltrate stormwater from Mountain View Avenue (Photo 10-1). Estimated Cost: Engineering Design: $500 - $1,000 Construction: $1,287 -$1,573 Bioretention Cell Estimated Phosphorus Reduction: lb/yr Estimated O & M Costs: $50-$100/yr Remove accumulated sediment from the bioretention cell annually, and maintain/replace plants as needed every 2 years. Wetland Permitting: No WPA permitting anticipated Priority: Low 100
. The area draining to this catch basin is 100% impervious.")
104 Site 11: Central Avenue Flannagan Pond Watershed Site Summary: Untreated runoff flows from the northern portion of Central Avenue into a curb inlet catch basin (Photo 11-1) which discharges directly into Flannagan Pond (pictured in the foreground of Photo 11-1). The area draining to this catch basin is 100% impervious. Photo 11-1 Proposed Improvement: Install a hydrodynamic separator (Image 5-4) in the existing catch basin, to provide treatment of Central Avenue runoff prior to discharge to Flannagan Pond. Curb inlet catch basin Estimated Cost: Engineering Design: $1,000 - $1,500 Construction: Hydrodynamic Separator: $7,020 - $8,580 Estimated Phosphorus Reduction: lb/yr Estimated O & M Costs: $50 - $100/yr Inspect the hydrodynamic separate seasonally and following large storm events. Remove accumulated trash and debris, along with sediment from hydrodynamic separator as needed. Wetland Permitting: As a replacement/upgrade of an existing stormwater structure, no WPA permitting is anticipated. Priority: High (Note: The Ayer Department of Public Works has moved forward with development of final design schematics, details, and specifications for this site.) 101


105 Site 12: Snake Hill Road #1 Sandy Pond Watershed Site Summary: Untreated runoff flows from Snake Hill Road enters a catch basin (Photo 12-1) which discharges directly into Sandy Pond (Photo 12-2). The area draining to this catch basin is mostly impervious area. Photo 12-1 Proposed Improvement: Install a hydrodynamic separator (Image 5-4) in the existing catch basin, to provide treatment of Snake Hill Road runoff prior to entering Sandy Pond. Estimated Cost: Catch basin Engineering Design: $1,000 - $1,500 Construction: Hydrodynamic Separator: $7,020 - $8,580 Estimated Phosphorus Reduction: lb/yr Photo 12-2 Estimated O & M Costs: $50 - $100/yr Inspect the hydrodynamic separate seasonally and following large storm events. Remove accumulated trash and debris, along with sediment from hydrodynamic separator as needed. Wetland Permitting: As a replacement/upgrade of an existing stormwater structure, no WPA permitting is anticipated. Priority: Low Catch Basin Discharge Pipe 102
 prior to discharging into Sandy Pond.")

106 Site 13: Snake Hill Road #2 Sandy Pond Watershed Site Summary: At the intersection of Pierce Avenue and Snake Hill Road, erosion was observed at the outlet of a storm drain pipe (Photo 13-1) The storm drain pipe collects road runoff from Snake Hill Road and Piece Avenue. It appeared that sheet flow from Snake Hill Road was eroding the channel (Photo 13-2) prior to discharging into Sandy Pond. The area draining to this catch basin is mostly impervious area. Proposed Improvement: Install outlet protection at the outlet of the storm drain pipe and extend to the pond s edge to prevent future erosion of sediment into Sandy Pond. Estimated Cost: Engineering Design: $500 - $1,000 Construction: Outlet Protection: $ $915 Estimated Phosphorus Reduction: lb/yr Estimated O & M Costs: $50 - $100/yr Inspect the outlet protection seasonally. Remove accumulated trash and debris and with sediment from outlet protection as needed. Wetland Permitting: This project involves minor activity within buffer zone to stabilize an existing outlet area, and could be permitted through a Negative Determination under a WPA Request for Determination of Applicability. Priority: High Discharge Pipe Channel Erosion Photo 13-1 Photo 13-2 Channel Erosion 103
 and drainage patterns consist of sheet flow along the edge or road to a forested wetland area at the end of the street, adjacent to Sandy Pond.")
 to collect and treat stormwater runoff from Sedgeway Street prior to discharging")
107 Site 14: Sedgeway Street Sandy Pond Watershed Photo 14-1 Site Summary: Sedgeway Road is a small dead end road with residential homes along the north side of Sandy Pond. Sedgeway Street contains no drainage infrastructure (i.e., catch basins or drain pipe) and drainage patterns consist of sheet flow along the edge or road to a forested wetland area at the end of the street, adjacent to Sandy Pond. Sediment and gravel was observed along Sedgeway Road, which discharges into the forested wetland area (Photo 14-2). Proposed Improvement: Remove selected trees and install a 500 square foot stormwater constructed wetland (Photos 14-2) to collect and treat stormwater runoff from Sedgeway Street prior to discharging into the forested wetland and ultimately Sandy Pond. Estimated Cost: Engineering Design: $3,000 - $4,000 Construction: Constructed Wetland: $17,550 $21,450 Estimated Phosphorus Reduction: lb/yr Estimated O & M Costs: $100 - $200/yr Inspect and maintain the constructed wetland including inlets and outlets annually for debris, sediment and erosion. Wetland Permitting: As a project with minor buffer zone disturbance, WPA permitting is expected to require an Abbreviated Notice of Intent. Priority: Low Constructed Wetland Photo
. The outlet pipe appears to be more than 50% full of sediment and requires cleaning.")
 at the outlet of the pipe to dissipate energy and prevent erosion.")
108 Site 15: Groton Harvard Road Flannagan Pond Watershed Site Summary: An outlet pipe from a catch basin along Groton-Harvard Road daylights between the properties at 43 and 45 Groton Harvard Road adjacent to Flannagan Pond (Photo 15-1). The outlet pipe appears to be more than 50% full of sediment and requires cleaning. The area downstream of the outlet pipe shows signs of erosion prior to entering into Flannagan Pond. Proposed Improvement: Clean and remove sediment from the outlet pipe to restore capacity. Install outlet protection (Photo 15-2) at the outlet of the pipe to dissipate energy and prevent erosion. Estimated Cost: Engineering Design: $500 - $1,000 Pipe Outlet Photo 15-1 Construction: Pipe cleaning & outlet protection: $2,855 - $3,489 Estimated Phosphorus Reduction: lb/yr Estimated O & M Costs: $0 - $50/yr Inspect outlet protection and remove accumulated sediment as needed. Wetland Permitting: This project involves minor activity within buffer zone to stabilize an existing outlet area, and could be permitted through a Negative Determination under a WPA Request for Determination of Applicability. Priority: High (Note: The Ayer Department of Public Works has moved forward with development of final design schematics, details, and specifications for this site.) Outlet protection area Photo 15-2 Photo


109 Rain Garden Demonstration Program Sandy Pond and Flannagan Pond Watersheds A raingarden demonstration program could be implemented to educate watershed residents about Low Impact Development (LID) stormwater management practices and to promote this approach throughout the pond watersheds. Due to the higher degree of shoreline and proximal watershed development around Sandy Pond and Flannagan Pond, these two watersheds appear to offer the best potential for a raingarden demonstration program. The soils in the majority of the nearshore areas around Sandy Pond and Flannagan Pond are generally favorable for implementation of raingardens and other infiltration practices (see Figure 4.2, Soils Map). Soils classified in hydrologic soils groups A and B have rates of infiltration conducive to practices such as raingardens. However, proper design can allow raingardens to function well in areas with less favorable native soils. As such, the raingarden demonstration program could be used to promote a broader, long-term effort to implement raingardens at numerous locations throughout the pond watersheds. Raingardens can vary in size depending on drainage area and property owner preference, and typically range between 50 to 200 square feet. These rain gardens would help improve water quality and provide pretreatment for stormwater that would otherwise runoff directly into the ponds. For the cost and load reduction estimates below, five (5) 100-square foot raingardens were assumed as part of the raingarden demonstration program. Estimated Cost: Engineering Design: $3,000 - $3,500 Construction: $6,453 - $7,865 Estimated Phosphorus Reduction: lb. P/yr Typical rain garden installation along road shoulder (Silver Lake watershed, Wilmington, MA) Lakeside rain garden providing storage during a rain storm (Lake Shirley, Lunenburg, MA). Estimated O & M Costs: $50-$100/yr Remove accumulated sediment from raingardens annually, and maintain/replace plants as needed. Permitting: Depends on locations of rain gardens, but expected to require no WPA permitting at site outside of the Buffer Zone (BZ) and potentially an Abbreviated Notice of Intent or Negative Determination of Applicability at sites located within the BZ. Newly planted rain garden with shrub planting scheme (Mirror Lake watershed, Tuftonboro, NH). Priority: Medium 106

110 q Long Pond Pine Meadow Pond A y e r Flannagan Pond Sandy Pond Balch Pond Legend Ayer Ponds Ayer Town Boundary Hydrologic Soil Group Unclassified Q:\GISProjects\BW0265-Ayer_ponds\ayer_ponds_SOILS.mxd ACTON, MASSACHUSETTS Ayer Conservation Commission Survey of Ayer's Ponds 2/26/2015 Grove Pond 2,000 1, ,000 Feet AYER PONDS HYDROLOGIC SOIL CLASSIFICATIONS A B C D Figure 4.2
. The Town of Ayer could develop a program to reduce pollution from fertilizer applications within the Ayer pond watersheds.")
111 Fertilizer Phosphorus Reduction Program All Watersheds Landscaping fertilizers can be a significant source of phosphorus from areas of residential development and other areas where grass lawns are maintained (e.g. office parks, schools, sports fields, etc.). The Town of Ayer could develop a program to reduce pollution from fertilizer applications within the Ayer pond watersheds. This program could be modeled after similar efforts that have been implemented successfully in other Massachusetts communities and include the following: No-Phosphorus Fertilizer Rebate: As an incentive to promote the use of phosphorus-free fertilizers, the Town could offer this type of fertilizer to homeowners at a reduced price. Fertilizer retailers (e.g. local hardware stores, etc.) could be selected to provide reduced-priced fertilizer for homeowners. The balance of the fertilizer cost would be paid by the town (or lake associations) for a pre-determined quantity of fertilizer. Homeowners using the fertilizer would be provided signage (optional) to post in their yard, which would educate neighbors about the phosphorus-free fertilizer and its role in protecting water quality. A follow up survey is recommended to evaluate the performance of the program. Public outreach materials (e.g., brochure, flyer) are also recommended to ensure that watershed residents are informed of the program, including a discussion of the benefits of and options for no-fertilizer landscaping. Fertilizer Bylaw: Develop a landscaping fertilizer bylaws to reduce the use of phosphorusbased fertilizer. There are numerous successful local ordinances regulating the use of phosphorus fertilizer on lawns. Examples include statewide programs in Maine and Minnesota, and county programs in Dane County (WI), Muskegon County (MI), and Ottawa County MI). An example Massachusetts bylaw (Town of Orleans, Fertilizer Nitrogen and Phosphorus Control Bylaw, adopted in 2013) can be reviewed at: Estimated Phosphorus Reduction: The phosphorus load reductions that can be achieved by a fertilizer reduction program will vary depending on how the program is structured and implemented. For purposes of developing a load reduction estimate for this report, we have assumed that the program would be targeted to the 400 residential homes located in closest proximity to the six ponds included in this study, and that 25% of these homes (100 homes) fertilize a 2,000 square foot lawn area twice per growing season using (N-P-K) formula fertilizer at a typical application rate of 3.5 lbs per 1000 square feet. If 25% to 50% of the homes using fertilizer are convinced to switch to phosphorus-free fertilizer, the amount of phosphorus applied to lawns within pond watersheds would be reduced by approximately 117 to 233 lbs. per year. If 10% of the applied fertilizer phosphorus washes into the ponds via storm water runoff, then the estimated annual phosphorus load reduction would range from 11.7 to 23.3 lbs. P/year. Estimated Cost: Costs for a one-year fertilizer reduction program as described above are anticipated to be in the range of $8,000 to $10,000. These costs include printed outreach materials (brochure, signage, homeowner survey), and costs associated with providing a rebate or subsidy for purchase of phosphorus free fertilizer. Assuming that 100 homes participated and purchased four bags of fertilizer, and assuming a rebate of $15 per bag, the annual cost of the rebate would be $6,

112 Public Information and Education All Watersheds Public information and education efforts can be used to enhance public understanding of pond and watershed management issues for Ayer s ponds, such as control/prevention of non-native species and phosphorus loading reduction projects. Public information and education about pond management efforts can be provided via Town and/or lake association websites, social media, print brochures, local newspaper articles, and other media. Brochure: An educational print or web-based brochure could be developed on homeowner practices that reduce loading of phosphorus and other pollutants to the ponds. Example text is provided on the following page. Field Guide to the Aquatic Plants of Ayer s Ponds: As recommended in Section 3.3.3, volunteer vegetation monitoring would be aided by development of an aquatic vegetation field guide that is specific to the species in Ayer s ponds. The field guide could include line drawings, photos and descriptions of the species identified during this study, plus non-native species that volunteers should be aware of. An example field guide, developed by Geosyntec for Mirror Lake (Tuftonboro, NH) can be viewed at: Field-Guide-Mirror-Lake_2011.pdf Public Education Workshops: In addition to presentations on the findings of this study, public education workshops could be provided on a series of topics, including: Low Impact Landscaping: This workshop could provide information on the siting, design and installation of Low Impact Development (LID) landscaping techniques for residential properties, including raingardens/bioretention, porous pavements, vegetated buffers, and other techniques focused on promoting infiltration and the use of native vegetation to reduce phosphorus loading in lake watersheds. For more information on LID, see: Other Resources: Homeowners in the Ayer pond watersheds are encouraged to review the following educational resources: Massachusetts Nonpoint Source Pollution Management Manual: Innovative Land Planning Techniques A Handbook for Sustainable Development: The Vermont Raingarden Manual: A Shoreland Homeowner s Guide to Stormwater Management 109

113 Example homeowner pollution prevention brochure text. Other content could include pond/watershed maps, information on aquatic plants and invasive species, and ongoing monitoring efforts. How YOU Can Help Protect Ayer s Ponds! Just say No to fertilizer. Lawn fertilizer is transported to Ayer s ponds by storm water runoff, fueling algae blooms that reduce water clarity and can lead to beach closures. Use natural alternatives to lawn and garden chemicals and establish lowmaintenance, native vegetation on your property. Build a raingarden to manage stormwater runoff from your property. Raingardens protect water quality while beautifying your home and neighborhood! For more information, see: Rain barrels are a great way to re-use rainwater from roofs for gardening and landscaping. A rain barrel will save most homeowners about 1,300 gallons of water during the peak summer months. Diverting this water from storm drains also decreases the impact of runoff to streams. Ran barrels can be purchased at many home and garden centers. Keep litter, leaves, and debris out of street gutters and storm drains. Dispose of used oil, antifreeze, paints, and other household chemicals properly. Do not dump these products in storm drains. These outlets drain directly to Ayer s ponds, local streams and wetlands. Don't feed waterfowl! Bread and snack food are harmful to waterfowl Feeding discourages winter migration and encourages large bird flocks that degrade pond the shorelines with droppings and can contribute to beach closures. Pick up after your pet! Use biodegradable doggie bags to collect pet waste. Don't dispose of pet waste in storm drains. Control soil erosion on your property by planting ground cover and stabilizing erosion-prone areas. 110
LIMNOLOGY, WATER QUALITY
 LIMNOLOGY, WATER QUALITY PA RANI ET E R S, AN D c 0 IV D IT I 0 N S AND ECOREGIONS Water Quality Parameters Nutrients are important parameters because phosphorous and nitrogen are major nutrients required
Welcome to the Understanding Dissolved Oxygen learning module. This section provides information on the following topics:
 Introduction Welcome to the learning module. This section provides information on the following topics: How dissolved oxygen is defined and measured in numbers Why dissolved oxygen is important Natural
Phosphorus. Phosphorus Lake Whatcom Cooperative Management. www.ecy.wa.gov/programs/wq/nonpoint/phosphorus/phosphorusban.html
 Phosphorus Phosphorus Brochure Lake Whatcom Cooperative Management Reducing Phosphorus Website Washington State Department of Ecology www.ecy.wa.gov/programs/wq/nonpoint/phosphorus/phosphorusban.html Nutrients
Ecosystems and Food Webs
 Ecosystems and Food Webs How do AIS affect our lakes? Background Information All things on the planet both living and nonliving interact. An Ecosystem is defined as the set of elements, living and nonliving,
Pond Ecosystem Field Study MOLS
 This multi-week lab involves field studies comparing ecosystem-level ecology between 2 freshwater ponds in Marshfield Outdoor Learning Sanctuary. We will be investigating a correlation between weather
Part B Integrated Monitoring Design for Comprehensive Assessment and Identification of Impaired Waters Contents
 Part B Integrated Monitoring Design for Comprehensive Assessment and Identification of Impaired Waters Contents Chapter 10. Selecting Metrics or Indicators of WQS Attainment... 10-2 Chapter 11. Monitoring
Lesson 4: What Makes Water Healthy?
 Lesson 4: What Makes Water Healthy? Activity: Students make observations and measurements of several water samples. This activity helps students think about different ways to determine water quality. Grade
Carbon Dioxide in Fish Ponds
 SRAC Publication No. 468 Southern Regional Aquaculture Center April 1996 PR VI Carbon Dioxide in Fish Ponds John Hargreaves and Martin Brunson* * Mississippi State University A pond breathes in and out
Pamela Birak, Jordan Lake State Park, Chatham County, NC
 Pamela Birak, Jordan Lake State Park, Chatham County, NC 3 Lakes, Reservoirs, and Ponds Forty-six states, Puerto Rico, and the District of Columbia (collectively referred to as states in the rest of this
Curt Kerns, M.S., R.P.Bio., C.F.S. WetlandsPacific Corp. 250-722-7117 www.wetlandspacific.com
 Curt Kerns, M.S., R.P.Bio., C.F.S. WetlandsPacific Corp. 250-722-7117 www.wetlandspacific.com Presentation Historical perspectives Present perspectives How wetlands function Examples of natural wetlands
Chesapeake Bay and Potomac Tidal Monitoring Programs Past, Present and Future
 Chesapeake Bay and Potomac Tidal Monitoring Programs Past, Present and Future Bruce Michael Resource Assessment Service Maryland Department of Natural Resources The Future of Water Quality Monitoring in
Algal Blooms, Circulators, Waterfowl and Eutrophic Greenfield Lake, NC. Michael A. Mallin, Matthew R. McIver, Ellen J. Wambach, and Anna R.
 Algal Blooms, Circulators, Waterfowl and Eutrophic Greenfield Lake, NC Michael A. Mallin, Matthew R. McIver, Ellen J. Wambach, and Anna R. Robuck Center for Marine Science University of North Carolina
How To Plan A Buffer Zone
 Backyard Buffers Protecting Habitat and Water Quality What is a buffer? A buffer (also called a riparian buffer area or zone) is the strip of natural vegetation along the bank of a stream, lake or other
KARUK TRIBE OF CALIFORNIA WATER YEAR 2002 WATER QUALITY MONITORING REPORT
 KARUK TRIBE OF CALIFORNIA DEPARTMENT OF NATURAL RESOURCES P.O. Box 282 * Orleans, California 95556 WATER YEAR 2002 WATER QUALITY MONITORING REPORT Klamath River at Iron Gate, Klamath River at Seiad Valley,
4. Environmental Impacts Assessment and Remediation Targets
 4. Environmental Impacts Assessment and Remediation Targets 4.1 Environmental Impacts Significant additional development in the Alder Creek watershed is not anticipated at this time; however, there are
The concepts developed in this standard include the following: Oceans cover about 70% of the surface of the Earth.
 Name Date Grade 5 SOL 5.6 Review Oceans Made by SOLpass - www.solpass.org solpass100@comcast.net Reproduction is permitted for SOLpass subscribers only. The concepts developed in this standard include
SUSTAINABLE URBAN DRAINAGE SYSTEMS
 overflow can lead into a permeable conveyance system to increase further the benefit and reduce the need for pipe systems. Pollutant removal rates have been shown to be high, with some pollutants being
LAKEWATCH Report for Dead in Gulf County Using Data Downloaded 10/6/2015
 LAKEWATCH Report for Dead in Gulf County Introduction Lakes In 2012 Florida LAKEWATCH staff published the following three papers describing 1) how the location of lakes in different geologic areas (Figure
Freshwater Resources and Water Pollution
 Visualizing Environmental Science Freshwater Resources and Water Pollution Chapter 10 Copyright The Importance of Water Life on Earth would be impossible without water All living organisms contain water
Broken Arrow Public Schools AP Environmental Science Objectives Revised 11-19-08
 1 st six weeks 1 Identify questions and problems that can be answered through scientific investigation. 2 Design and conduct scientific investigations to answer questions about the world by creating hypotheses;
3.4 DRAINAGE PLAN. 3.4.1 Characteristics of Existing Drainages. 3.4.2 Master Drainage System. Section 3: Development Plan BUTTERFIELD SPECIFIC PLAN
 3.4 DRAINAGE PLAN This section describes the existing onsite drainage characteristics and improvements proposed within this Specific Plan. Following this description, drainage plan development standards
Which of the following can be determined based on this model? The atmosphere is the only reservoir on Earth that can store carbon in any form. A.
 Earth s Cycles 1. Models are often used to explain scientific knowledge or experimental results. A model of the carbon cycle is shown below. Which of the following can be determined based on this model?
COMPREHENSIVE PLAN SECTION B, ELEMENT 4 WATER RESOURCES. April 20, 2010 EXHIBIT 1
 COMPREHENSIVE PLAN SECTION B, ELEMENT 4 WATER RESOURCES April 20, 2010 EXHIBIT 1 ELEMENT 4 WATER RESOURCES TABLE OF CONTENTS 4.1 INTRODUCTION 4.2 GOALS AND POLICIES 4.2.A General Goals and Policies 1 4.2.B
Ginger Paige and Nancy Mesner University of Wyoming Utah State University
 Effective Water Quality BMP Monitoring Tools Ginger Paige and Nancy Mesner University of Wyoming Utah State University Overview BMP Monitoring Guidance Document for Stream Systems Lessons learned CEAP
Clean Water Services. Ecosystems Services Case Study: Tualatin River, Washington
 Viewed broadly, the concept of ecosystem services describes the many resources and services provided by nature. Typically, traditional planning and development practices do not adequately represent the
Retention/Irrigation. Design Considerations. Soil for Infiltration Area Required Slope Environmental Side-effects
 Description Retention/irrigation refers to the capture of stormwater runoff in a holding pond and subsequent use of the captured volume for irrigation of landscape of natural pervious areas. This technology
LAKE WATER QUALITY, TROPHIC STATUS AND POTENTIAL LOADING SOURCES FOR CLEARWATER LAKES
 LAKE WATER QUALITY, TROPHIC STATUS AND POTENTIAL LOADING SOURCES FOR CLEARWATER LAKES Final Report, May 212 Prepared by Vicki Watson of the University of Montana for the Clearwater Resource Council INTRODUCTION
Scheduling Maintenance for Infiltration Basins and Trenches
 Visual Inspection for Infiltration Practices Visual inspection is a rapid assessment procedure for qualitatively evaluating the functionality of a stormwater best management practice (BMP). Visual inspections
TENNESSEE GAS PIPELINE COMPANY, L.L.C.
 TENNESSEE GAS PIPELINE COMPANY, L.L.C. HYDROLOGIC & HYDRAULIC CALCULATIONS FOR WATERBODIES CROSSED BY CONNECTICUT PIPELINE EXPANSION PROJECT CONNECTICUT LOOP Submitted by: Tennessee Gas Pipeline Company,
Maine Department of Environmental Protection Program Guidance On Combined Sewer Overflow Facility Plans
 Maine Department of Environmental Protection Program Guidance On Combined Sewer Overflow Facility Plans OVERVIEW The objective of a Combined Sewer Overflow (CSO) Facility Plan is to abate CSO discharges
Policy & Management Applications of Blue Carbon. fact SHEET
 Policy & Management Applications of Blue Carbon fact SHEET Policy & Management Applications of Blue Carbon Coastal Blue Carbon - An Important Wetland Ecosystem Service Coastal Blue Carbon refers to the
Dissolved Oxygen and Aquatic Primary Productivity1
 Dissolved Oxygen and Aquatic Primary Productivity1 INTRODUCTION 2 Oxygen is critical to the maintenance of the life processes of nearly all organisms. In the aquatic environment, oxygen must be in solution
Travel Time. Computation of travel time and time of concentration. Factors affecting time of concentration. Surface roughness
 3 Chapter 3 of Concentration and Travel Time Time of Concentration and Travel Time Travel time ( T t ) is the time it takes water to travel from one location to another in a watershed. T t is a component
How To Understand And Understand The Effects Of Pollution And Water Quality
 Lesson 2. Pollution and Water Quality Keywords: pollutants, water pollution, point source, non-point source, urban pollution, agricultural pollution, atmospheric pollution, smog, nutrient pollution, eutrophication,
SPA Annual Report for 2002 September, 2003 Montgomery County Department of Environmental Protection Page 125. Evaluation and Recommendations
 Montgomery County Department of Environmental Protection Page 125 Evaluation and Recommendations Monitoring efforts in the Special Protection Areas continue to provide the kind of information needed to
Presented by Paul Krauth Utah DEQ. Salt Lake Countywide Watershed Symposium October 28-29, 2008
 Basic Nutrient Removal from Water Beta Edition Presented by Paul Krauth Utah DEQ Salt Lake Countywide Watershed Symposium October 28-29, 2008 Presentation Outline Salt Lake County waters / 303(d) listings
Quantification of Reactive Phosphorus in Lake Mendota Sediments
 Quantification of Reactive Phosphorus in Lake Mendota Sediments By: Jeremy, Advisor Dr. Mike Penn Most of the phosphorus (P) that enters lakes from external inputs is attached to soil or sediment. This
SAMPLE CHAPTERS UNESCO EOLSS SURFACE WATER MONITORING. Masanori Ando Musashino University, Japan
 SURFACE WATER MONITORING Masanori Ando Musashino University, Japan Keywords: surface water, monitoring, sampling, monitoring program, monitoring location, sampling programs, flow measurement, sampling
GREEN ROOFS. Location. Design SMALL COMMERCIAL GUIDE CITY OF ATLANTA, GEORGIA DEPARTMENT OF WATERSHED MANAGEMENT
 SMALL COMMERCIAL GUIDE CITY OF ATLANTA, GEORGIA DEPARTMENT OF WATERSHED MANAGEMENT GREEN ROOFS A green roof is a system consisting of waterproofing material, growing medium, and vegetation, and is used
Lake Management Plan Guidance
 Lake Management Plan Guidance Release Date: January 2014 Abstract This technical document is intended to be used by planning and science professionals within a municipality to aid in the development of
Rocky EEP Preliminary Findings Report Summary February 2005
 This is a DRAFT summary of the NC Ecosystem Enhancement Upper Rocky River Local Watershed Plan Preliminary Findings Report. The original, 157 page document can be found here: www.ncsu.edu/weco/rocky. The
Standards: Human activity has consequences on living organisms and ecosystems. (94412, 94211 )
") Minnehaha Creek Restoration Project A Place- Based Environmental Water Study Course: 9 th grade Biology Adapted from Kent Piccott, Minneapolis Public Schools Background: This study was designed with the
Minnehaha Creek Restoration Project A Place- Based Environmental Water Study Course: 9 th grade Biology Adapted from Kent Piccott, Minneapolis Public Schools Background: This study was designed with the
Managing Systems for Tilapia Culture
 Auburn University and USDA-Natural Resources Conservation Service Alabama Aquaculture Best Management Practice (BMP) Managing Systems for Tilapia Culture BMP No. 17 Definition Tilapias (Oreochromis spp.)
In this lesson, students will identify a local plant community and make a variety of
 MAKING COMMUNITY MEASUREMENTS: ABIOTIC FACTORS Grades 3 6 I. Introduction In this lesson, students will identify a local plant community and make a variety of measurements, preferably during two different
Total Suspended Solids Total Dissolved Solids Hardness
 Total Suspended Solids (TSS) are solids in water that can be trapped by a filter. TSS can include a wide variety of material, such as silt, decaying plant and animal matter, industrial wastes, and sewage.
SOLOMON RIVER BASIN TOTAL MAXIMUM DAILY LOAD. Water Body: Webster Lake Water Quality Impairment: Eutrophication
 SOLOMON RIVER BASIN TOTAL MAXIMUM DAILY LOAD Water Body: Wster Lake Water Quality Impairment: Eutrophication Subbasin: Counties: Upper South Fork Solomon Graham, Rooks, Sheridan, Sherman, and Thomas HUC
Aquatic Biomes, Continued
 Aquatic Biomes, Continued Introduction Extent of Marine biomes Issues & challenges Factors influencing distribution Dynamics in time & space Depth Tour of marine biomes Issues (by biome) Freshwater biomes
Detention Ponds. Detention Ponds. Detention Ponds. Detention Ponds. Detention Ponds. Detention Ponds. CIVL 1112 Detention Ponds - Part 1 1/12
 CIVL 1112 - Part 1 1/12 The water cycle, also known as the hydrologic cycle, describes the continuous movement of water on, above and below the surface of the Earth. The water cycle, also known as the
WASTEWATER TREATMENT
 Freshwater WASTEWATER TREATMENT Water Quality 1. INDICATOR (a) Name: Wastewater treatment. (b) Brief Definition: Proportion of wastewater that is treated, in order to reduce pollutants before being discharged
HÄSSLEHOLM COMMUNITY MUNICIPAL OFFICE THE RESTORATION OF LAKE FINJASJÖN
 HÄSSLEHOLM COMMUNITY MUNICIPAL OFFICE THE RESTORATION OF LAKE FINJASJÖN Summary After having lowered the sea-level twice to gain farmland and heavy nutrient load mainly from sewage, Lake Finjasjön in 1950
CHAPTER 2 HYDRAULICS OF SEWERS
 CHAPTER 2 HYDRAULICS OF SEWERS SANITARY SEWERS The hydraulic design procedure for sewers requires: 1. Determination of Sewer System Type 2. Determination of Design Flow 3. Selection of Pipe Size 4. Determination
INFORMATION SHEET ORDER NO. R5-2011-XXXX TRIANGLE ROCK PRODUCTS, INC. FLORIN ROAD AGGREGATE PLANT SACRAMENTO COUNTY
 ORDER NO. R5-2011-XXXX INFORMATION SHEET Background Triangle Rock, Inc. (Discharger) submitted a Report of Waste Discharge (RWD) on 23 August 2010. The Discharger is expanding the mining operations at
Pond Recirculating Production Systems
 SRAC Publication No. 455 November 1997 PR VI Pond Recirculating Production Systems Andrew M. Lazur and Deborah C. Britt* Water conservation and reuse has become a major issue in aquaculture in recent years.
AQUATIC ECOSYSTEMS & BIOMES
 AQUATIC ECOSYSTEMS & BIOMES A) Name three general types of aquatic ecosystems and describe the salinity for each. Give an example for each. 1) 2) 3) B) MATCHING In the space provided, write the letter
Real-Time Monitoring Buoy in Mystic River Watershed
 Real-Time Monitoring Buoy in Mystic River Watershed Access to the data has been through a password protected site http://www.ysieconet.com/ Project Assistance: Liz McCarthy Laura Senefeld Matt Destino
Urban Ecology: Watersheds and Aquatic Ecology A BIOBUGS program
 NAME: Urban Ecology: Watersheds and Aquatic Ecology A BIOBUGS program Objective: To describe the health of the Muddy River in the Fens wetlands system of Boston by examining abiotic and biotic parameters.
Integrated Restoration Prioritization
 Integrated Restoration Prioritization Habitat Restoration and Environmental Monitoring Projects Section Restoration Services Division Definition Restoration Prioritization is a process of combining various
WASTEWATER TREATMENT OBJECTIVES
 WASTEWATER TREATMENT OBJECTIVES The student will do the following: 1. Define wastewater and list components of wastewater. 2. Describe the function of a wastewater treatment plant. 3. Create a wastewater
Computing Stormwater Runoff Rates and Volumes
 New Jersey Stormwater Best Management Practices Manual February 2004 C H A P T E R 5 Computing Stormwater Runoff Rates and Volumes This chapter discusses the fundamentals of computing stormwater runoff
Communities, Biomes, and Ecosystems
 Communities, Biomes, and Ecosystems Before You Read Before you read the chapter, respond to these statements. 1. Write an A if you agree with the statement. 2. Write a D if you disagree with the statement.
Henry Van Offelen Natural Resource Scientist MN Center for Environmental Advocacy hvanoffelen@mncenter.org
 Henry Van Offelen Natural Resource Scientist MN Center for Environmental Advocacy hvanoffelen@mncenter.org Wetland study slide Water Quality NRE goals in watershed plans Protect habitat that remains.
CITY UTILITIES DESIGN STANDARDS MANUAL
 CITY UTILITIES DESIGN STANDARDS MANUAL Book 2 (SW) SW9 June 2015 SW9.01 Purpose This Chapter provides information for the design of open channels for the conveyance of stormwater in the City of Fort Wayne.
Plants, like all other living organisms have basic needs: a source of nutrition (food),
,") LEARNING FROM LEAVES: A LOOK AT LEAF SIZE Grades 3 6 I. Introduction Plants, like all other living organisms have basic needs: a source of nutrition (food), water, space in which to live, air, and optimal
LEARNING FROM LEAVES: A LOOK AT LEAF SIZE Grades 3 6 I. Introduction Plants, like all other living organisms have basic needs: a source of nutrition (food), water, space in which to live, air, and optimal
STORMWATER MONITORING: POLLUTANTS, SOURCES, AND SOLUTIONS
 RICHLAND COUNTY STORMWATER MANAGEMENT DIVISION STORMWATER MONITORING: POLLUTANTS, SOURCES, AND SOLUTIONS As part of the federal government s National Pollutant Discharge Elimination System Permit (NPDES)
1.7.0 Floodplain Modification Criteria
 1.7.0 Floodplain Modification Criteria 1.7.1 Introduction These guidelines set out standards for evaluating and processing proposed modifications of the 100- year floodplain with the following objectives:
DEEP WATER MECHANICAL HARVESTING OF HYDRILLA IN WEST LAKE TOHOPEKALIGA, FLORIDA
 DEEP WATER MECHANICAL HARVESTING OF HYDRILLA IN WEST LAKE TOHOPEKALIGA, FLORIDA Dean Jones 1, 2, William Haller 2 and Mike Hulon 3 1 Osceola County 2 University of Florida 3 Texas Aquatic Harvesting, Inc.
Chapter 55: Ecosystems
 Name Period Overview: 1. What is an ecosystem? 2. Where does energy enter most ecosystems? How is it converted to chemical energy and then passed through the ecosystem? How is it lost? Remember this: energy
Don t spit in the well - you may need to drink from it! -- Unknown, Russia.
 Don t spit in the well - you may need to drink from it! -- Unknown, Russia. WATER POLLUTION Water is a unique substance, because it can naturally renew and cleanse itself, by allowing pollutants to settle
Briefing Paper on Lower Galveston Bay and Bayou Watersheds Lower Bay I: Armand Bayou to Moses Lake and Adjacent Bay Waters
 Briefing Paper on Lower Galveston Bay and Bayou Watersheds Lower Bay I: Armand Bayou to Moses Lake and Adjacent Bay Waters Jim Lester, PhD. and Lisa Gonzalez Houston Advanced Research Center Galveston
Nutrient Stewardship. Reducing the Loss of Crop Nutrients to Waterways
 ETS & PERFORMANCE FOOD ENVIRONMENT PEOPLE COMPANY Nutrient Stewardship Reducing the Loss of Crop Nutrients to Waterways Crop nutrients help plants grow and produce the food, fiber and fuel we all need.
RESTORATION AND ENHANCEMENT OF SOUTHERN CALIFORNIA LAGOONS
 RESTORATION AND ENHANCEMENT OF SOUTHERN CALIFORNIA LAGOONS by Hany Elwany, Ph.D. Scripps Institution of Oceanography Headwaters to Oceans Conference 25 October 2003 CE Ref #03-22 San Diego County Lagoons
Water Quality and Water Usage Surveys
 Appendix 1 Water Quality and Water Usage Surveys This appendix contains copies of the Water Quality Survey and the Lake Usage Survey that we used to complete the watershedbased community assessments. We
Climate Change: A Local Focus on a Global Issue Newfoundland and Labrador Curriculum Links 2010-2011
 Climate Change: A Local Focus on a Global Issue Newfoundland and Labrador Curriculum Links 2010-2011 HEALTH Kindergarten: Grade 1: Grade 2: Know that litter can spoil the environment. Grade 3: Grade 4:
WATER QUALITY MONITORING AND APPLICATION OF HYDROLOGICAL MODELING TOOLS AT A WASTEWATER IRRIGATION SITE IN NAM DINH, VIETNAM
 WATER QUALITY MONITORING AND APPLICATION OF HYDROLOGICAL MODELING TOOLS AT A WASTEWATER IRRIGATION SITE IN NAM DINH, VIETNAM LeifBasherg (1) OlujZejlllJul Jessen (1) INTRODUCTION The current paper is the
Chapter 2 Stormwater Pollution Prevention Plan (SWPPP) for Park Operations
 for Park Operations") SWPPP for Park Operations 2 Chapter 2 Stormwater Pollution Prevention Plan (SWPPP) for Park Operations Bordered by Lake Washington & Lake Sammamish, the City of Bellevue has more than 60 miles of streams,
SWPPP for Park Operations 2 Chapter 2 Stormwater Pollution Prevention Plan (SWPPP) for Park Operations Bordered by Lake Washington & Lake Sammamish, the City of Bellevue has more than 60 miles of streams,
Sustainability Brief: Water Quality and Watershed Integrity
 Sustainability Brief: and Watershed Integrity New Jersey depends on water resources for the health of our people, the strength of our economy, and the vitality of our ecosystems. The quality of our water
Executive Summary Minnesota Nutrient Reduction Strategy
 Executive Summary The (NRS) will guide the state in reducing excess nutrients in waters so that in-state and downstream water quality goals are ultimately met. Nutrient impacts are widespread. Excessive
3. The submittal shall include a proposed scope of work to confirm the provided project description;
 QIN Shoreline Master Program Project Summary The Shoreline Master Program (SMP) development process for the Quinault Indian Nation (QIN) includes the completion of inventory and analysis report with corresponding
Unit 12 Earth s Changing Climate
 Background Introduction Unit 12 Earth s Changing Climate Earth has been undergoing one of the most extensive experiments in the history of civilization. Today the planet is warmer than it has been for
Handbook for Developing Watershed Plans to Restore and Protect Our Waters
 This document is one chapter from the EPA Handbook for Developing Watershed Plans to Restore and Protect Our Waters, published in March 2008. The reference number is EPA 841-B-08-002. You can find the
PHOSPHORUS IN LAWNS, LANDSCAPES, AND LAKES
 PHOSPHORUS IN LAWNS, LANDSCAPES, AND LAKES An Informative Guide on Phosphorus August 1, 2004 Phosphorus in Lawns, Landscapes and Lakes Most professionals working in the lawn and landscape industry are
An Introduction to Algae Measurements Using In Vivo Fluorescence
 An Introduction to Algae Measurements Using In Vivo Fluorescence Submersible fluorescence sensors enable real-time field estimates of phytoplankton that can be directly correlated to standard laboratory
Chapter 3 Communities, Biomes, and Ecosystems
 Communities, Biomes, and Ecosystems Section 1: Community Ecology Section 2: Terrestrial Biomes Section 3: Aquatic Ecosystems Click on a lesson name to select. 3.1 Community Ecology Communities A biological
Restoration Planning and Development of a Restoration Bank
 Restoration Planning and Development of a Restoration Bank Black Creek Pioneer Village, South Theatre 8:30 a.m. to 3:30 p.m. Habitat Restoration and Environmental Monitoring Projects Section Restoration
Hardness Comparisons
 Hardness Comparisons Hardness Adapted from: An original Creek Connections activity. Creek Connections, Box 10, Allegheny College, Meadville, Pennsylvania 16335. Grade Level: all Duration: 50 minutes Setting:
1800 Washington Boulevard, Baltimore, MD 21230-1718 www.mde.maryland.gov 410-537-3000 800-633-6101 TTY Users 800-735-2258 Larry Hogan, Governor Boyd
 ENVIRONMENTAL SITE DESIGN (ESD) REDEVELOPMENT EXAMPLES OCTOBER 2010 1800 Washington Boulevard, Baltimore, MD 21230-1718 www.mde.maryland.gov 410-537-3000 800-633-6101 TTY Users 800-735-2258 Larry Hogan,
a. a population. c. an ecosystem. b. a community. d. a species.
 Name: practice test Score: 0 / 35 (0%) [12 subjective questions not graded] The Biosphere Practice Test Multiple Choice Identify the letter of the choice that best completes the statement or answers the
Greater Los Angeles County Region
 Attachment 6 Greater Los Angeles County Region IRWM Implementation Grant Proposal Monitoring, Assessment, and Attachment 6 consists of the following items: Monitoring, Assessment, and. The purpose of this
Biology Keystone (PA Core) Quiz Ecology - (BIO.B.4.1.1 ) Ecological Organization, (BIO.B.4.1.2 ) Ecosystem Characteristics, (BIO.B.4.2.
 Quiz Ecology - (BIO.B.4.1.1 ) Ecological Organization, (BIO.B.4.1.2 ) Ecosystem Characteristics, (BIO.B.4.2.") Biology Keystone (PA Core) Quiz Ecology - (BIO.B.4.1.1 ) Ecological Organization, (BIO.B.4.1.2 ) Ecosystem Characteristics, (BIO.B.4.2.1 ) Energy Flow 1) Student Name: Teacher Name: Jared George Date:
Biology Keystone (PA Core) Quiz Ecology - (BIO.B.4.1.1 ) Ecological Organization, (BIO.B.4.1.2 ) Ecosystem Characteristics, (BIO.B.4.2.1 ) Energy Flow 1) Student Name: Teacher Name: Jared George Date:
Field to Faucet: What Determines Water Quality
 4-H 365.29 OHIO STATE UNIVERSITY EXTENSION PROJECT IDEA STARTER Field to Faucet: What Determines Water Quality By Jacqueline Krieger, Extension Educator, 4-H Youth Development, and Greg LaBarge, MS, Field
What Is Humic Acid? Where Does It Come From?
 What Is Humic Acid? Humic and Fulvic acids are the final break-down constituents of the natural decay of plant and animal materials. These organic acids are found in pre-historic deposits. Humic matter
DESCRIPTION OF STORMWATER STRUCTURAL CONTROLS IN MS4 PERMITS
 DESCRIPTION OF STORMWATER STRUCTURAL CONTROLS IN MS4 PERMITS Phase I MS4 permits require continuous updating of the stormwater system inventory owned and operated by the MS4. They also include inspection
Comments on: Middlesex School East Fields Athletics Drainage Calculations Samiotes Consultants, Inc., 16 November 2004
 Comments on: Middlesex School East Fields Athletics Drainage Calculations Samiotes Consultants, Inc., 16 November 2004 submitted to Massachusetts Department of Environmental Protection by William W. Walker,
4.2 Buena Vista Creek Watershed
 Buena Vista Creek Watershed 4.2 Buena Vista Creek Watershed Watershed Overview The Buena Vista Creek Watershed is the fourth-largest system within the Carlsbad Hydrologic Unit. The watershed extends approximately
Ecosystems. The two main ecosystem processes: Energy flow and Chemical cycling
 Ecosystems THE REALM OF ECOLOGY Biosphere An island ecosystem A desert spring ecosystem Biosphere Ecosystem Ecology: Interactions between the species in a given habitat and their physical environment.
General Permit for Activities Promoting Waterway - Floodplain Connectivity [working title]
![General Permit for Activities Promoting Waterway - Floodplain Connectivity [working title]](/thumbs/39/18645965.jpg "General Permit for Activities Promoting Waterway - Floodplain Connectivity [working title]") General Permit for Activities Promoting Waterway - Floodplain Connectivity [working title] Purpose These rules set forth the conditions under which a person may, without an individual removal-fill permit
General Permit for Activities Promoting Waterway - Floodplain Connectivity [working title] Purpose These rules set forth the conditions under which a person may, without an individual removal-fill permit
BLACK/HARMONY/FAREWELL CREEK WATERSHED EXISTING CONDITIONS REPORT CHAPTER 12 - STORMWATER MANAGEMENT
 Harmony Creek subwatershed Harmony Creek subwatershed BLACK/HARMONY/FAREWELL CREEK WATERSHED EXISTING CONDITIONS REPORT CHAPTER 12 - STORMWATER MANAGEMENT April 2011 TABLE OF CONTENTS 1.0 INTRODUCTION...
WATER QUALITY MODELING TO SUPPORT THE ROUGE RIVER RESTORATION
 WATER QUALITY MODELING TO SUPPORT THE ROUGE RIVER RESTORATION Edward H. Kluitenberg, P.E., Applied Science, Inc. Gary W. Mercer, P.E., Camp, Dresser and McKee Vyto Kaunelis, Wayne County Department of
I. Determining the Trophic State of Your Lake by Ted Brown and Jon Simpson
 Managing Phosphorus Inputs to Urban Lakes I. Determining the Trophic State of Your Lake by Ted Brown and Jon Simpson Trophic State Classification Lakes are commonly classified according to their trophic
Kissimmee River Basin Lakes, Rivers, Streams, and Aquifers
 Kissimmee River Basin Lakes, Rivers, Streams, and Aquifers Florida Department of Environmental Protection Division of Environmental Assessment and Restoration Bureau of Assessment and Restoration Support,