Power for Professionals
|
|
|
- Leon Powell
- 7 years ago
- Views:
Transcription
1 Power for Professionals When we examined the confidence interval we saw that it told us where the parameter would lie in repeated sampling. The smaller the margin of error the tighter or more sensitive the interval. A fixed level α test (two sided) can be carried out with a confidence interval (see notes). We want our test to detect H 0 (null hypothesis) that are false. This is measured by the probability the test will reject H 0 when the alternative (H A ) is true - the higher the probability the better. Power The probability that a fixed level alpha-α significance test will reject H 0 when a particular alternative value of the parameter is true is called the power of the test against the alternative. Along with 95% confidence interval, 5% significance tests, 80% power is very popular. Many granting agencies and industries require the sample size be sufficient to detect results 80% of the time using a 5% test of significance. Boost the Power Say you perform a power calculation (see SPSS notes) and find the power too small, what can you do to increase it? 1) Increase alpha-α. A 10% test will have a greater chance of rejecting the alternative than a 5% test because the strength of evidence required for rejection is less. 2) Increase the sample size. As n increases our standard error decreases (see notes). 3) Consider an alternative H A parameter that is further away from the value under H 0. Values that are close to one another are harder to detect (low power). Power is important for planning. Using a test with low power makes it unlikely you will find a significant effect. Suppose the H 0 is in fact false, it can be widely believed to be true if repeated attempts fail because of low power. Error Types for Decision Making If we reject H 0 (accept H A ) when in fact H 0 is true, call this Type I error. If we accept H 0 (reject H A ) when in fact H A is true, call this Type II error.
2 Truth about Population Decision Based on Sample H 0 true H A true Reject H 0 Type I error Correct decision Accept H 0 Correct decision Type II error Significance tests with a fixed α give us a way of understanding the above table because the test either rejects H 0 or fails to reject H 0. Failing to reject H 0 means deciding H 0 is true. So now we can describe our test using Type I and Type II error. Significance and Type I error The significance level α of any fixed level test is the probability of a Type I error. Alpha-α is the probability the test will reject H 0 when H 0 is true. Power and Type II error The power of a fixed level test against a particular alternative is 1 minus the probability of a Type II error for that alternative. Suppose we calculate the power of a test to be.87. The probability of a Type II error is =.13. Significance Tests In the research setting H A is the research hypothesis asserting an effect is present. The null hypothesis says there is no difference. Low p-values present evidence that H A is true. If H 0 is something that everyone in the profession believes then strong evidence (small p-value) will be needed to reject it. The level of evidence needed will depend on the consequences. If rejecting H 0 means changes are expensive, strong evidence will be needed. A.05 test is very common, but there is no dividing line that is absolute, one must realize that evidence increases as the p-value decreases. Note that when large samples are present then tiny deviations will be declared significant, they may not be practically important. Remember; plan to have an adequate sample size to detect an effect that exists POWER.
3 Two Sample t-test Example Probability of Type I error Probability of Type II error Probability of rejecting H 0 : µ = 1 when in fact µ = 1. Probability of accepting H 0 when in fact µ = 3.
4 One Way ANOVA Remember that the power of the test is the probability of rejecting H 0 when in fact H A is true. We measure power with respect to a specific alternative. We do a power calculation to make sure the sample sizes are adequate to detect important differences in means. We may find that the power is low against the alternative and there is little chance of detecting a difference (significant F). Power helps us interpret results where H 0 was not rejected. Power calculations for the ANOVA are similar to the two sample t- test since the ANOVA is a generalization of the t-test (see notes). We have to calculate the probability of rejecting H 0 when H A is true, the probability that the observed F is greater than F-critical for the test α. We calculate the non-central F distribution. To do this we calculate a noncentrality parameter (λ). If all the means are equal λ=0. The larger the differences in means, the larger λ (it tells us how unequal the means are) and consequently we expect high power. We usually repeat the power calculation for different sample sizes to find acceptable levels of power (usually.8 or better). Summary In a test of significance we focus on H 0 and a single probability (p-value). The purpose is to measure the evidence against H 0. Calculations of power are made to check the sensitivity of the test. If we don t reject H 0 we conclude there is not enough evidence against H 0 (not that H 0 is true). If the same problem is thought of as a decision that must be made we focus on both H A and H 0. We focus on both probabilities and errors. We must choose H 0 or H A and cannot claim there is insufficient evidence. We commonly mix the reasoning of significance tests and decision rules. Sample Power Software When you first open the sample power program you will click on File, then new analysis and you will see the following screen. Remember that you can always use help to guide you through the analysis (see yellow box) for interactive guide. Means: In order to test the power for a 2 sample t-test: 1) Click the Means tab 2) Click the t-test for 2 (independent) groups with common variance (enter means) 3) Click OK.
5

6 The Following screen will then appear:
7 Next, enter the information from our t-test example (taken from Dr. Gebotys, Chapter 7, PS 292 notes): 1) Population Mean 1 = ) Population Mean 2 = ) Standard Deviation 1 = ) Standard Deviation 2 = ) N per Group 1 = 23 6) N per Group 2 = 21
8
9 You will now notice that the blue power bar in the bottom right corner indicates that the power for this example is 60%. In order to see what number of participants would be required in order to increase the power we have two options. We can click the binocular icon in the top tool bar in order to see what number of participants we would need to reach a power of 80% (this tells us that we would need 35 participants in each group). Or, alternatively we can click the graph icon in the top tool bar (the one with bars) in order to create a chart of the power for our example. We also have the option of clicking the table icon in order to obtain a table of the power for our example.

10 Our Table will look like the following:
11 Our chart will look like the following:
12 ANOVA: In order to conduct an analysis for a one-way ANOVA 1) Click the ANOVA tab. 2) Select Oneway analysis of variance. 3) Click OK.
13
 we can run a power analysis for the example")
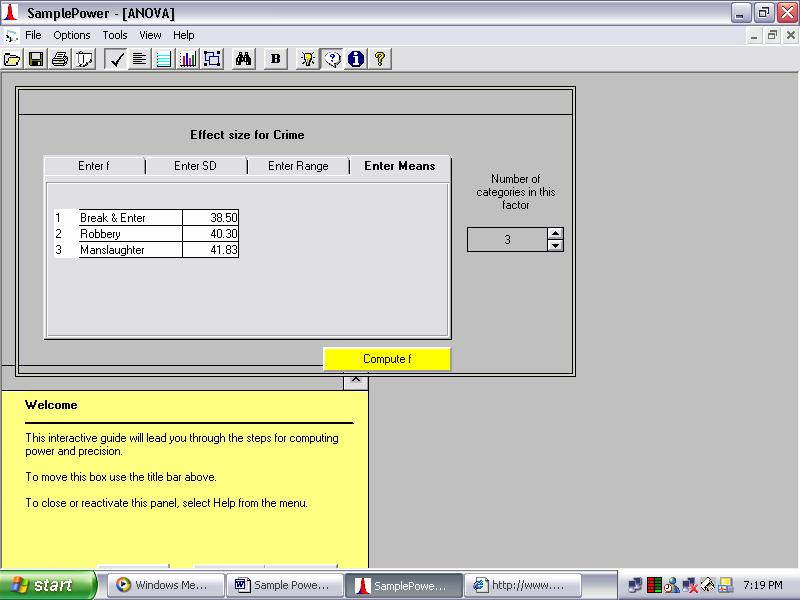
14 Using the information from Dr. Gebotys One Way ANOVA handout (Chapter 14 of notes) we can run a power analysis for the example with three levels of crime, with three observations per treatment.
15 1) First enter the variance within cell on the left hand side, 1.81 or MSE. 2) Next change the N of cases per cell to 3. 3) Change the Label for Factor A to Crime. 4) Now you will notice that the number of levels needs to be changed. You can fix this by clicking on the number shown under the number of levels column. This will bring up the following screen.
16
17 5) The first thing you will do is change the number of categories in this factor to 3. 6) Then you are able to choose one of 4 ways to calculate the effect size: enter f, SD, Range, or Means. Here we will enter the means, which are 38.5, 40.3, and ) Now, click the yellow compute f button. 8) Click the blue register f button. 9) You will now be back out at the main screen. Here you can use the binocular icon in the top toolbar to calculate the number of participants needed per group to reach a power of.8 (happens to be 4 people per group). Or you can use the graph icon to create the following graph of power. Or click the table icon for a table of values.
18 The table for this example will look like the following:

19 The chart for this example will look like the following:

20 You can also create a report by clicking the Make Report icon:
21 Two-Way ANOVA: Now if we run through the example from the two-way ANOVA handout (Chapter 16 notes) we will do the following. 1) Click on the ANOVA tab and select Factorial analysis of variance (2 factors).
22 2) Click OK. 3) Change the N cases per cell to 2. 4) Enter the variance within cell, assume = MSE. 5) Change the name of factor A to Crime. 6) Click on the number of cases factor A. 7) Change the number to 3. 8) Enter the necessary information. Means, 46.87, 59.25, and ) Click the yellow compute f button. Click the blue register f button. 10) Now back at the main screen change the name of factor B to Age and click on the number of cases factor B. 11) Change the number to 4. 12) Enter information into the means tab. Means, 53, 67.83, 51.16, and ) Click the yellow compute f button. Click the blue register f button. 14) Lastly, for the interaction click the medium effect size,.25.

23 Now if we click the table icon on the top toolbar we will get the following table.

24 Our chart will look like the following:
25 If we run the report function we get the following:
26 Correlation: In order to conduct a correlation analysis click on the correlation tab and select one sample test that correlation = 0.
27 Click Ok. Now we will pretend that we are interested in the correlation between the number of hours spent watching television and the number of violent behaviours exhibited by children. We will assume based on the previous literature that the population correlation is moderate at.30. We will also assume that we will be able to recruit 50 children to take part in our study. Below we can see that with a sample of 50 children our power would only be 59%. If we click on the binocular icon in the top toolbar we can see that in order to reach a power of 80% we would need 82 children to take part in our study.

28
29 Our table would look like the following.
30 Our chart would look like this:

31 Regression: In order to conduct a regression analysis click on the regression tab and select the appropriate option, in this case we will be using Set A, Set B, and interaction.
32 Click Ok. Now, using the small social work data set as our example we will enter our first set as age and age squared (so 2 variables in the set) and we will assume that this accounts for 10% of the variance. Our second set will be years of experience (so only 1 variable) and we will assume that it accounts for 5% of the variance. Our interaction set will consist of gender X managerial status (so 2 variables in the set) and we will assume that it accounts for 15% of the variance. Finally, we will need to adjust the number of cases to 250 and set the box in the bottom right hand corner of the screen to start with set 1 and end with set 3.

33
34 Our chart will look like the following:
Main Effects and Interactions
 Main Effects & Interactions page 1 Main Effects and Interactions So far, we ve talked about studies in which there is just one independent variable, such as violence of television program. You might randomly
SPSS Tests for Versions 9 to 13
 SPSS Tests for Versions 9 to 13 Chapter 2 Descriptive Statistic (including median) Choose Analyze Descriptive statistics Frequencies... Click on variable(s) then press to move to into Variable(s): list
Chapter 5 Analysis of variance SPSS Analysis of variance
 Chapter 5 Analysis of variance SPSS Analysis of variance Data file used: gss.sav How to get there: Analyze Compare Means One-way ANOVA To test the null hypothesis that several population means are equal,
Projects Involving Statistics (& SPSS)
") Projects Involving Statistics (& SPSS) Academic Skills Advice Starting a project which involves using statistics can feel confusing as there seems to be many different things you can do (charts, graphs,
Projects Involving Statistics (& SPSS) Academic Skills Advice Starting a project which involves using statistics can feel confusing as there seems to be many different things you can do (charts, graphs,
How To Run Statistical Tests in Excel
 How To Run Statistical Tests in Excel Microsoft Excel is your best tool for storing and manipulating data, calculating basic descriptive statistics such as means and standard deviations, and conducting
KSTAT MINI-MANUAL. Decision Sciences 434 Kellogg Graduate School of Management
 KSTAT MINI-MANUAL Decision Sciences 434 Kellogg Graduate School of Management Kstat is a set of macros added to Excel and it will enable you to do the statistics required for this course very easily. To
Class 19: Two Way Tables, Conditional Distributions, Chi-Square (Text: Sections 2.5; 9.1)
") Spring 204 Class 9: Two Way Tables, Conditional Distributions, Chi-Square (Text: Sections 2.5; 9.) Big Picture: More than Two Samples In Chapter 7: We looked at quantitative variables and compared the
Spring 204 Class 9: Two Way Tables, Conditional Distributions, Chi-Square (Text: Sections 2.5; 9.) Big Picture: More than Two Samples In Chapter 7: We looked at quantitative variables and compared the
PERSONAL LEARNING PLAN- STUDENT GUIDE
 PERSONAL LEARNING PLAN- STUDENT GUIDE TABLE OF CONTENTS SECTION 1: GETTING STARTED WITH PERSONAL LEARNING STEP 1: REGISTERING FOR CONNECT P.2 STEP 2: LOCATING AND ACCESSING YOUR PERSONAL LEARNING ASSIGNMENT
One-Way ANOVA using SPSS 11.0. SPSS ANOVA procedures found in the Compare Means analyses. Specifically, we demonstrate
 1 One-Way ANOVA using SPSS 11.0 This section covers steps for testing the difference between three or more group means using the SPSS ANOVA procedures found in the Compare Means analyses. Specifically,
SPSS Explore procedure
 SPSS Explore procedure One useful function in SPSS is the Explore procedure, which will produce histograms, boxplots, stem-and-leaf plots and extensive descriptive statistics. To run the Explore procedure,
SCHOOL OF HEALTH AND HUMAN SCIENCES DON T FORGET TO RECODE YOUR MISSING VALUES
 SCHOOL OF HEALTH AND HUMAN SCIENCES Using SPSS Topics addressed today: 1. Differences between groups 2. Graphing Use the s4data.sav file for the first part of this session. DON T FORGET TO RECODE YOUR
DDBA 8438: Introduction to Hypothesis Testing Video Podcast Transcript
 DDBA 8438: Introduction to Hypothesis Testing Video Podcast Transcript JENNIFER ANN MORROW: Welcome to "Introduction to Hypothesis Testing." My name is Dr. Jennifer Ann Morrow. In today's demonstration,
In this example, Mrs. Smith is looking to create graphs that represent the ethnic diversity of the 24 students in her 4 th grade class.
 Creating a Pie Graph Step-by-step directions In this example, Mrs. Smith is looking to create graphs that represent the ethnic diversity of the 24 students in her 4 th grade class. 1. Enter Data A. Open
INTERPRETING THE ONE-WAY ANALYSIS OF VARIANCE (ANOVA)
") INTERPRETING THE ONE-WAY ANALYSIS OF VARIANCE (ANOVA) As with other parametric statistics, we begin the one-way ANOVA with a test of the underlying assumptions. Our first assumption is the assumption of
INTERPRETING THE ONE-WAY ANALYSIS OF VARIANCE (ANOVA) As with other parametric statistics, we begin the one-way ANOVA with a test of the underlying assumptions. Our first assumption is the assumption of
Scatter Plots with Error Bars
 Chapter 165 Scatter Plots with Error Bars Introduction The procedure extends the capability of the basic scatter plot by allowing you to plot the variability in Y and X corresponding to each point. Each
Using Microsoft Excel to Analyze Data
 Entering and Formatting Data Using Microsoft Excel to Analyze Data Open Excel. Set up the spreadsheet page (Sheet 1) so that anyone who reads it will understand the page. For the comparison of pipets:
Linear Models in STATA and ANOVA
 Session 4 Linear Models in STATA and ANOVA Page Strengths of Linear Relationships 4-2 A Note on Non-Linear Relationships 4-4 Multiple Linear Regression 4-5 Removal of Variables 4-8 Independent Samples
We are often interested in the relationship between two variables. Do people with more years of full-time education earn higher salaries?
 Statistics: Correlation Richard Buxton. 2008. 1 Introduction We are often interested in the relationship between two variables. Do people with more years of full-time education earn higher salaries? Do
HYPOTHESIS TESTING: CONFIDENCE INTERVALS, T-TESTS, ANOVAS, AND REGRESSION
 HYPOTHESIS TESTING: CONFIDENCE INTERVALS, T-TESTS, ANOVAS, AND REGRESSION HOD 2990 10 November 2010 Lecture Background This is a lightning speed summary of introductory statistical methods for senior undergraduate
Directions for using SPSS
 Directions for using SPSS Table of Contents Connecting and Working with Files 1. Accessing SPSS... 2 2. Transferring Files to N:\drive or your computer... 3 3. Importing Data from Another File Format...
SPSS Guide: Regression Analysis
 SPSS Guide: Regression Analysis I put this together to give you a step-by-step guide for replicating what we did in the computer lab. It should help you run the tests we covered. The best way to get familiar
Computer Skills Microsoft Excel Creating Pie & Column Charts
 Computer Skills Microsoft Excel Creating Pie & Column Charts In this exercise, we will learn how to display data using a pie chart and a column chart, color-code the charts, and label the charts. Part
UNDERSTANDING THE TWO-WAY ANOVA
 UNDERSTANDING THE e have seen how the one-way ANOVA can be used to compare two or more sample means in studies involving a single independent variable. This can be extended to two independent variables
Introduction to Quantitative Methods
 Introduction to Quantitative Methods October 15, 2009 Contents 1 Definition of Key Terms 2 2 Descriptive Statistics 3 2.1 Frequency Tables......................... 4 2.2 Measures of Central Tendencies.................
Statistiek II. John Nerbonne. October 1, 2010. Dept of Information Science j.nerbonne@rug.nl
 Dept of Information Science j.nerbonne@rug.nl October 1, 2010 Course outline 1 One-way ANOVA. 2 Factorial ANOVA. 3 Repeated measures ANOVA. 4 Correlation and regression. 5 Multiple regression. 6 Logistic
Doing Multiple Regression with SPSS. In this case, we are interested in the Analyze options so we choose that menu. If gives us a number of choices:
 Doing Multiple Regression with SPSS Multiple Regression for Data Already in Data Editor Next we want to specify a multiple regression analysis for these data. The menu bar for SPSS offers several options:
The Dummy s Guide to Data Analysis Using SPSS
 The Dummy s Guide to Data Analysis Using SPSS Mathematics 57 Scripps College Amy Gamble April, 2001 Amy Gamble 4/30/01 All Rights Rerserved TABLE OF CONTENTS PAGE Helpful Hints for All Tests...1 Tests
THE FIRST SET OF EXAMPLES USE SUMMARY DATA... EXAMPLE 7.2, PAGE 227 DESCRIBES A PROBLEM AND A HYPOTHESIS TEST IS PERFORMED IN EXAMPLE 7.
 THERE ARE TWO WAYS TO DO HYPOTHESIS TESTING WITH STATCRUNCH: WITH SUMMARY DATA (AS IN EXAMPLE 7.17, PAGE 236, IN ROSNER); WITH THE ORIGINAL DATA (AS IN EXAMPLE 8.5, PAGE 301 IN ROSNER THAT USES DATA FROM
Dealing with Data in Excel 2010
 Dealing with Data in Excel 2010 Excel provides the ability to do computations and graphing of data. Here we provide the basics and some advanced capabilities available in Excel that are useful for dealing
individualdifferences
 1 Simple ANalysis Of Variance (ANOVA) Oftentimes we have more than two groups that we want to compare. The purpose of ANOVA is to allow us to compare group means from several independent samples. In general,
This activity will show you how to draw graphs of algebraic functions in Excel.
 This activity will show you how to draw graphs of algebraic functions in Excel. Open a new Excel workbook. This is Excel in Office 2007. You may not have used this version before but it is very much the
Mixed 2 x 3 ANOVA. Notes
 Mixed 2 x 3 ANOVA This section explains how to perform an ANOVA when one of the variables takes the form of repeated measures and the other variable is between-subjects that is, independent groups of participants
Pearson's Correlation Tests
 Chapter 800 Pearson's Correlation Tests Introduction The correlation coefficient, ρ (rho), is a popular statistic for describing the strength of the relationship between two variables. The correlation
Bill Burton Albert Einstein College of Medicine william.burton@einstein.yu.edu April 28, 2014 EERS: Managing the Tension Between Rigor and Resources 1
 Bill Burton Albert Einstein College of Medicine william.burton@einstein.yu.edu April 28, 2014 EERS: Managing the Tension Between Rigor and Resources 1 Calculate counts, means, and standard deviations Produce
Excel Tutorial. Bio 150B Excel Tutorial 1
 Bio 15B Excel Tutorial 1 Excel Tutorial As part of your laboratory write-ups and reports during this semester you will be required to collect and present data in an appropriate format. To organize and
January 26, 2009 The Faculty Center for Teaching and Learning
 THE BASICS OF DATA MANAGEMENT AND ANALYSIS A USER GUIDE January 26, 2009 The Faculty Center for Teaching and Learning THE BASICS OF DATA MANAGEMENT AND ANALYSIS Table of Contents Table of Contents... i
Analysis of Variance ANOVA
 Analysis of Variance ANOVA Overview We ve used the t -test to compare the means from two independent groups. Now we ve come to the final topic of the course: how to compare means from more than two populations.
3. Locate the different selections of Styles from the Home Tab, Styles Group
 Outlining in MS Word 2007 Microsoft Word 2007 provides users with an Outline View and Outlining toolbar, which allows us to create outlines. Outlines in Word are based on Styles. For instance if a line
Using Excel in Research. Hui Bian Office for Faculty Excellence
 Using Excel in Research Hui Bian Office for Faculty Excellence Data entry in Excel Directly type information into the cells Enter data using Form Command: File > Options 2 Data entry in Excel Tool bar:
How to make a line graph using Excel 2007
 How to make a line graph using Excel 2007 Format your data sheet Make sure you have a title and each column of data has a title. If you are entering data by hand, use time or the independent variable in
ABSORBENCY OF PAPER TOWELS
 ABSORBENCY OF PAPER TOWELS 15. Brief Version of the Case Study 15.1 Problem Formulation 15.2 Selection of Factors 15.3 Obtaining Random Samples of Paper Towels 15.4 How will the Absorbency be measured?
Two Related Samples t Test
 Two Related Samples t Test In this example 1 students saw five pictures of attractive people and five pictures of unattractive people. For each picture, the students rated the friendliness of the person
Microsoft Excel: Exercise 5
 Microsoft Excel: Exercise 5 In this exercise: Using AutoSum Using the fill handle to copy formulas Using AutoFormat Using the Chart Wizard to create a pie and bar graph This is a case study exercise. In
How To Check For Differences In The One Way Anova
 MINITAB ASSISTANT WHITE PAPER This paper explains the research conducted by Minitab statisticians to develop the methods and data checks used in the Assistant in Minitab 17 Statistical Software. One-Way
1. What is the critical value for this 95% confidence interval? CV = z.025 = invnorm(0.025) = 1.96
 = 1.96") 1 Final Review 2 Review 2.1 CI 1-propZint Scenario 1 A TV manufacturer claims in its warranty brochure that in the past not more than 10 percent of its TV sets needed any repair during the first two years
1 Final Review 2 Review 2.1 CI 1-propZint Scenario 1 A TV manufacturer claims in its warranty brochure that in the past not more than 10 percent of its TV sets needed any repair during the first two years
Describing Populations Statistically: The Mean, Variance, and Standard Deviation
 Describing Populations Statistically: The Mean, Variance, and Standard Deviation BIOLOGICAL VARIATION One aspect of biology that holds true for almost all species is that not every individual is exactly
Point Biserial Correlation Tests
 Chapter 807 Point Biserial Correlation Tests Introduction The point biserial correlation coefficient (ρ in this chapter) is the product-moment correlation calculated between a continuous random variable
t Tests in Excel The Excel Statistical Master By Mark Harmon Copyright 2011 Mark Harmon
 t-tests in Excel By Mark Harmon Copyright 2011 Mark Harmon No part of this publication may be reproduced or distributed without the express permission of the author. mark@excelmasterseries.com www.excelmasterseries.com
Simple Linear Regression, Scatterplots, and Bivariate Correlation
 1 Simple Linear Regression, Scatterplots, and Bivariate Correlation This section covers procedures for testing the association between two continuous variables using the SPSS Regression and Correlate analyses.
1. Go to your programs menu and click on Microsoft Excel.
 Elementary Statistics Computer Assignment 1 Using Microsoft EXCEL 2003, follow the steps below. For Microsoft EXCEL 2007 instructions, go to the next page. For Microsoft 2010 and 2007 instructions with
Two-Way ANOVA with Post Tests 1
 Version 4.0 Step-by-Step Examples Two-Way ANOVA with Post Tests 1 Two-way analysis of variance may be used to examine the effects of two variables (factors), both individually and together, on an experimental
An analysis method for a quantitative outcome and two categorical explanatory variables.
 Chapter 11 Two-Way ANOVA An analysis method for a quantitative outcome and two categorical explanatory variables. If an experiment has a quantitative outcome and two categorical explanatory variables that
Chapter 8 Hypothesis Testing Chapter 8 Hypothesis Testing 8-1 Overview 8-2 Basics of Hypothesis Testing
 Chapter 8 Hypothesis Testing 1 Chapter 8 Hypothesis Testing 8-1 Overview 8-2 Basics of Hypothesis Testing 8-3 Testing a Claim About a Proportion 8-5 Testing a Claim About a Mean: s Not Known 8-6 Testing
Crosstabulation & Chi Square
 Crosstabulation & Chi Square Robert S Michael Chi-square as an Index of Association After examining the distribution of each of the variables, the researcher s next task is to look for relationships among
SPSS Manual for Introductory Applied Statistics: A Variable Approach
 SPSS Manual for Introductory Applied Statistics: A Variable Approach John Gabrosek Department of Statistics Grand Valley State University Allendale, MI USA August 2013 2 Copyright 2013 John Gabrosek. All
II. DISTRIBUTIONS distribution normal distribution. standard scores
 Appendix D Basic Measurement And Statistics The following information was developed by Steven Rothke, PhD, Department of Psychology, Rehabilitation Institute of Chicago (RIC) and expanded by Mary F. Schmidt,
Using SPSS, Chapter 2: Descriptive Statistics
 1 Using SPSS, Chapter 2: Descriptive Statistics Chapters 2.1 & 2.2 Descriptive Statistics 2 Mean, Standard Deviation, Variance, Range, Minimum, Maximum 2 Mean, Median, Mode, Standard Deviation, Variance,
EXCEL Tutorial: How to use EXCEL for Graphs and Calculations.
 EXCEL Tutorial: How to use EXCEL for Graphs and Calculations. Excel is powerful tool and can make your life easier if you are proficient in using it. You will need to use Excel to complete most of your
Additional sources Compilation of sources: http://lrs.ed.uiuc.edu/tseportal/datacollectionmethodologies/jin-tselink/tselink.htm
 Mgt 540 Research Methods Data Analysis 1 Additional sources Compilation of sources: http://lrs.ed.uiuc.edu/tseportal/datacollectionmethodologies/jin-tselink/tselink.htm http://web.utk.edu/~dap/random/order/start.htm
Nonparametric Tests. Chi-Square Test for Independence
 DDBA 8438: Nonparametric Statistics: The Chi-Square Test Video Podcast Transcript JENNIFER ANN MORROW: Welcome to "Nonparametric Statistics: The Chi-Square Test." My name is Dr. Jennifer Ann Morrow. In
Using Microsoft Excel to Analyze Data from the Disk Diffusion Assay
 Using Microsoft Excel to Analyze Data from the Disk Diffusion Assay Entering and Formatting Data Open Excel. Set up the spreadsheet page (Sheet 1) so that anyone who reads it will understand the page (Figure
MEASURES OF VARIATION
 NORMAL DISTRIBTIONS MEASURES OF VARIATION In statistics, it is important to measure the spread of data. A simple way to measure spread is to find the range. But statisticians want to know if the data are
Coins, Presidents, and Justices: Normal Distributions and z-scores
 activity 17.1 Coins, Presidents, and Justices: Normal Distributions and z-scores In the first part of this activity, you will generate some data that should have an approximately normal (or bell-shaped)
The Chi-Square Test. STAT E-50 Introduction to Statistics
 STAT -50 Introduction to Statistics The Chi-Square Test The Chi-square test is a nonparametric test that is used to compare experimental results with theoretical models. That is, we will be comparing observed
One-Way Analysis of Variance (ANOVA) Example Problem
 Example Problem") One-Way Analysis of Variance (ANOVA) Example Problem Introduction Analysis of Variance (ANOVA) is a hypothesis-testing technique used to test the equality of two or more population (or treatment) means
One-Way Analysis of Variance (ANOVA) Example Problem Introduction Analysis of Variance (ANOVA) is a hypothesis-testing technique used to test the equality of two or more population (or treatment) means
Intermediate PowerPoint
 Intermediate PowerPoint Charts and Templates By: Jim Waddell Last modified: January 2002 Topics to be covered: Creating Charts 2 Creating the chart. 2 Line Charts and Scatter Plots 4 Making a Line Chart.
Multiple-Comparison Procedures
 Multiple-Comparison Procedures References A good review of many methods for both parametric and nonparametric multiple comparisons, planned and unplanned, and with some discussion of the philosophical
Having a coin come up heads or tails is a variable on a nominal scale. Heads is a different category from tails.
 Chi-square Goodness of Fit Test The chi-square test is designed to test differences whether one frequency is different from another frequency. The chi-square test is designed for use with data on a nominal
Presentations and PowerPoint
 V-1.1 PART V Presentations and PowerPoint V-1.2 Computer Fundamentals V-1.3 LESSON 1 Creating a Presentation After completing this lesson, you will be able to: Start Microsoft PowerPoint. Explore the PowerPoint
12: Analysis of Variance. Introduction
 1: Analysis of Variance Introduction EDA Hypothesis Test Introduction In Chapter 8 and again in Chapter 11 we compared means from two independent groups. In this chapter we extend the procedure to consider
Create a Poster Using Publisher
 Contents 1. Introduction 1. Starting Publisher 2. Create a Poster Template 5. Aligning your images and text 7. Apply a background 12. Add text to your poster 14. Add pictures to your poster 17. Add graphs
IBM SPSS Statistics 20 Part 4: Chi-Square and ANOVA
 CALIFORNIA STATE UNIVERSITY, LOS ANGELES INFORMATION TECHNOLOGY SERVICES IBM SPSS Statistics 20 Part 4: Chi-Square and ANOVA Summer 2013, Version 2.0 Table of Contents Introduction...2 Downloading the
Simple Regression Theory II 2010 Samuel L. Baker
 SIMPLE REGRESSION THEORY II 1 Simple Regression Theory II 2010 Samuel L. Baker Assessing how good the regression equation is likely to be Assignment 1A gets into drawing inferences about how close the
Briefing document: How to create a Gantt chart using a spreadsheet
 Briefing document: How to create a Gantt chart using a spreadsheet A Gantt chart is a popular way of using a bar-type chart to show the schedule for a project. It is named after Henry Gantt who created
Data Analysis Tools. Tools for Summarizing Data
 Data Analysis Tools This section of the notes is meant to introduce you to many of the tools that are provided by Excel under the Tools/Data Analysis menu item. If your computer does not have that tool
CHAPTER 15 NOMINAL MEASURES OF CORRELATION: PHI, THE CONTINGENCY COEFFICIENT, AND CRAMER'S V
 CHAPTER 15 NOMINAL MEASURES OF CORRELATION: PHI, THE CONTINGENCY COEFFICIENT, AND CRAMER'S V Chapters 13 and 14 introduced and explained the use of a set of statistical tools that researchers use to measure
Unit 31 A Hypothesis Test about Correlation and Slope in a Simple Linear Regression
 Unit 31 A Hypothesis Test about Correlation and Slope in a Simple Linear Regression Objectives: To perform a hypothesis test concerning the slope of a least squares line To recognize that testing for a
Introduction to Hypothesis Testing. Hypothesis Testing. Step 1: State the Hypotheses
 Introduction to Hypothesis Testing 1 Hypothesis Testing A hypothesis test is a statistical procedure that uses sample data to evaluate a hypothesis about a population Hypothesis is stated in terms of the
Examining Differences (Comparing Groups) using SPSS Inferential statistics (Part I) Dwayne Devonish
 using SPSS Inferential statistics (Part I) Dwayne Devonish") Examining Differences (Comparing Groups) using SPSS Inferential statistics (Part I) Dwayne Devonish Statistics Statistics are quantitative methods of describing, analysing, and drawing inferences (conclusions)
Examining Differences (Comparing Groups) using SPSS Inferential statistics (Part I) Dwayne Devonish Statistics Statistics are quantitative methods of describing, analysing, and drawing inferences (conclusions)
Chapter 2 Probability Topics SPSS T tests
 Chapter 2 Probability Topics SPSS T tests Data file used: gss.sav In the lecture about chapter 2, only the One-Sample T test has been explained. In this handout, we also give the SPSS methods to perform
Lesson 3 - Processing a Multi-Layer Yield History. Exercise 3-4
 Lesson 3 - Processing a Multi-Layer Yield History Exercise 3-4 Objective: Develop yield-based management zones. 1. File-Open Project_3-3.map. 2. Double click the Average Yield surface component in the
Working with sections in Word
 Working with sections in Word Have you have ever wanted to create a Microsoft Word document with some pages numbered in Roman numerals and the rest in Arabic, or include a landscape page to accommodate
Sample Size and Power in Clinical Trials
 Sample Size and Power in Clinical Trials Version 1.0 May 011 1. Power of a Test. Factors affecting Power 3. Required Sample Size RELATED ISSUES 1. Effect Size. Test Statistics 3. Variation 4. Significance
Chapter 7. Comparing Means in SPSS (t-tests) Compare Means analyses. Specifically, we demonstrate procedures for running Dependent-Sample (or
 Compare Means analyses. Specifically, we demonstrate procedures for running Dependent-Sample (or") 1 Chapter 7 Comparing Means in SPSS (t-tests) This section covers procedures for testing the differences between two means using the SPSS Compare Means analyses. Specifically, we demonstrate procedures
1 Chapter 7 Comparing Means in SPSS (t-tests) This section covers procedures for testing the differences between two means using the SPSS Compare Means analyses. Specifically, we demonstrate procedures
IBM SPSS Statistics for Beginners for Windows
 ISS, NEWCASTLE UNIVERSITY IBM SPSS Statistics for Beginners for Windows A Training Manual for Beginners Dr. S. T. Kometa A Training Manual for Beginners Contents 1 Aims and Objectives... 3 1.1 Learning
Randomized Block Analysis of Variance
 Chapter 565 Randomized Block Analysis of Variance Introduction This module analyzes a randomized block analysis of variance with up to two treatment factors and their interaction. It provides tables of
Odds ratio, Odds ratio test for independence, chi-squared statistic.
 Odds ratio, Odds ratio test for independence, chi-squared statistic. Announcements: Assignment 5 is live on webpage. Due Wed Aug 1 at 4:30pm. (9 days, 1 hour, 58.5 minutes ) Final exam is Aug 9. Review
Pivot Tables & Pivot Charts
 Pivot Tables & Pivot Charts Pivot tables... 2 Creating pivot table using the wizard...2 The pivot table toolbar...5 Analysing data in a pivot table...5 Pivot Charts... 6 Creating a pivot chart using the
Step 2: Headings and Subheadings
 Step 2: Headings and Subheadings This PDF explains Step 2 of the step-by-step instructions that will help you correctly format your ETD to meet UCF formatting requirements. Step 2 shows you how to set
1.5 Oneway Analysis of Variance
 Statistics: Rosie Cornish. 200. 1.5 Oneway Analysis of Variance 1 Introduction Oneway analysis of variance (ANOVA) is used to compare several means. This method is often used in scientific or medical experiments
Estimation of σ 2, the variance of ɛ
 Estimation of σ 2, the variance of ɛ The variance of the errors σ 2 indicates how much observations deviate from the fitted surface. If σ 2 is small, parameters β 0, β 1,..., β k will be reliably estimated
Module 4 (Effect of Alcohol on Worms): Data Analysis
: Data Analysis") Module 4 (Effect of Alcohol on Worms): Data Analysis Michael Dunn Capuchino High School Introduction In this exercise, you will first process the timelapse data you collected. Then, you will cull (remove)
Module 4 (Effect of Alcohol on Worms): Data Analysis Michael Dunn Capuchino High School Introduction In this exercise, you will first process the timelapse data you collected. Then, you will cull (remove)
Experimental Design. Power and Sample Size Determination. Proportions. Proportions. Confidence Interval for p. The Binomial Test
 Experimental Design Power and Sample Size Determination Bret Hanlon and Bret Larget Department of Statistics University of Wisconsin Madison November 3 8, 2011 To this point in the semester, we have largely
ibank Quick Start Guide
 ibank Quick Start Guide An introductory tutorial for ibank 3, a personal financial management application. 2008 IGG Software, LLC Overview This tutorial will cover these basic program concepts: 1 2 3 4
PowerPoint 2013 Basics of Creating a PowerPoint Presentation
 Revision 4 (01-31-2014) PowerPoint 2013 Basics of Creating a PowerPoint Presentation MICROSOFT POWERPOINT PowerPoint is software that lets you create visual presentations. PowerPoint presentations are
To Begin Customize Office
 To Begin Customize Office Each of us needs to set up a work environment that is comfortable and meets our individual needs. As you work with Office 2007, you may choose to modify the options that are available.
Two-Sample T-Tests Allowing Unequal Variance (Enter Difference)
") Chapter 45 Two-Sample T-Tests Allowing Unequal Variance (Enter Difference) Introduction This procedure provides sample size and power calculations for one- or two-sided two-sample t-tests when no assumption
Chapter 45 Two-Sample T-Tests Allowing Unequal Variance (Enter Difference) Introduction This procedure provides sample size and power calculations for one- or two-sided two-sample t-tests when no assumption
Medical Student Training on Electronic Notes Documentation. For Third and Fourth year Medical Students
 Medical Student Training on Electronic Notes Documentation For Third and Fourth year Medical Students Medical Student Training To review training for; Fourth Year Medical Student Orders and other training
This chapter will demonstrate how to perform multiple linear regression with IBM SPSS
 CHAPTER 7B Multiple Regression: Statistical Methods Using IBM SPSS This chapter will demonstrate how to perform multiple linear regression with IBM SPSS first using the standard method and then using the
Probability Distributions
 CHAPTER 5 Probability Distributions CHAPTER OUTLINE 5.1 Probability Distribution of a Discrete Random Variable 5.2 Mean and Standard Deviation of a Probability Distribution 5.3 The Binomial Distribution