Supplemental Financial & Operating Information for the Quarter Ended December 31, 2016
|
|
|
- Gordon O’Brien’
- 7 years ago
- Views:
Transcription

1 1 Supplemental Financial & Operating Information for the Quarter Ended December 31, 2016
2 2 Legal disclaimer Forward-Looking Statements: This presentation may include forward-looking statements within the meaning of the Securities Act of 1933 or the Securities Exchange Act of These forward-looking statements include comments with respect to our objectives and strategies, and the future results of our operations and our business. By their nature, these forward-looking statements involve numerous assumptions, uncertainties and descriptions of opportunities, both general and specific. The risk exists that these statements may not be fulfilled. We caution readers of this presentation not to place undue reliance on these forward-looking statements as a number of factors could cause our future results to differ materially from these statements. Any results or performance implied by forward-looking statements may be influenced in particular by factors such as fluctuations in interest rates and stock indices, the effects of competition in the areas in which we operate, and changes in economic, political, regulatory and technological conditions as well as those factors delineated under the caption Risk Factors in our Forms 10-Q and Form 10-K, as filed with the SEC. Therefore, we caution that the foregoing list is not exhaustive. When relying on forward-looking statements to make decisions, investors should carefully consider the aforementioned factors as well as other uncertainties and events. Past or Present Performance Disclaimer: This presentation includes information regarding past or present performance of the Company. Please note, past or present performance is not a guarantee of future performance or future results.
3 3 Table of contents About Gladstone Corporate overview Portfolio and financial overview Fourth Quarter 2016 highlights Financial overview Condensed consolidated statement of operations Funds from Operations (FFO) Condensed balance sheets Capital structure Liquidity and debt overview Portfolio Overview Portfolio update 15-19

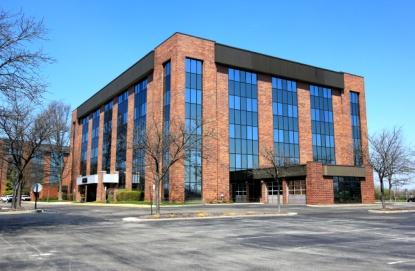
4 Corporate overview About Gladstone Commercial Gladstone Commercial (NASDAQ: GOOD) is a leading real estate investment trust (REIT) that invests in single tenant and anchored multi-tenant net leased assets. Gladstone Commercial owns 11 million square feet of primarily office and industrial real estate nationwide. We partner with a variety of tenants from middle market private businesses to investment grade rated companies. Gladstone Commercial acquires properties through third party purchases, sale lease back transactions, and by partnering with developers in build-to-suit transactions. As of December 31, 2016, total assets were approximately $852 million, representing investments in 96 properties. Our properties are leased to 89 tenants who represent 19 diverse industries across 24 states. 15 Year Sale Leaseback, Acquired in 2016 Corporate Headquarters Investor Relations 1521 Westbranch Drive Suite 100 commercial@gladstonecompanies.com McLean, VA At December 31, 2016, our leases had an average remaining term of 7.8 years. In addition, approximately 64% of our tenants have an investment grade or investment grade equivalent credit rating.
5 Portfolio and financial overview Portfolio data Total assets ($mm) $852 Properties 96 Tenants 89 Industries 19 States 24 Average remaining lease term (years) 7.8 Occupancy 97.9% Square footage owned (mm) 11.1 Capitalization ($mm) Equity market capitalization 1 $516 Preferred equity $130 Total debt $509 Total capitalization $1,155 Less: Cash and cash equivalents $(5) Total enterprise value $1,150 Top 5 tenants % of rent % of SF 6% 3% 4% 9% 3% 1% 3% 1% 3% 5% Top 5 Tenants total 19% 19% Top 5 Tenants average remaining lease term 6.4 years Portfolio average remaining lease term 7.8 years Corporate liquidity ($mm) Cash and Cash Equivalents $4.7 Availability Under Revolving Credit Facility 2 $37.9 Total $42.6 Net total debt / enterprise value 43.9% Net total debt + preferred / enterprise value 55.2% ¹ Based on closing stock price on December 31, 2016 of $ Includes convertible senior common shares. 2 As of February 15, 2017 availability under revolving credit facility is approximately $30.8 million. 5
6 6 Q highlights (unaudited) FFO 1 and Core FFO 2 : Generated FFO and Core FFO of $9.4 million or $0.38 per diluted common share. Dividends: Paid quarterly common stock dividends of $0.375 per common share, or an annualized $1.50 per common share. Acquisitions: Acquired 1 property for a total purchase price of $25.7 million. 8.7% annualized straight-line cap rate 103,000 square feet 15 years of remaining lease term Equity Issuances: Executed a direct placement of common stock with net proceeds totaling $13.9 million. Issued $12.9 million of aggregate common and preferred equity through our ATM programs. 1 FFO is calculated as net income excluding gains from sales of property and impairment losses on property, plus depreciation and amortization. 2 Core FFO is FFO adjusted for acquisition related expenses, gains from early extinguishment of debt and any other non-recurring expense adjustments.


7 Financial Overview 7
8 8 Condensed consolidated statements of operations ($ in thousands, except per share amounts) For the three months ended (unaudited) For the twelve months ended 12/31/2016 9/30/ /31/ /31/ /31/2015 Operating revenues Rental revenue $ 21,746 $ 21,205 $ 20,938 $ 84,498 $ 80,892 Tenant recovery revenue ,489 1,753 Interest income from mortgage note receivable ,121 Total operating revenues 22,009 21,589 21,823 86,372 83,766 Operating expenses Depreciation and amortization 9,720 9,459 9,128 37,517 35,288 Property operating expenses 1,435 1,410 1,544 5,889 5,296 Acquisition related expenses (14) Base management fee 1,141 1, ,930 3,474 Incentive fee ,381 4,650 Administration fee ,474 1,419 General and administrative ,127 2,094 Impairment charge 1,786 2, Total operating expenses before credit to incentive fee 13,733 15,172 12,970 55,595 53,465 Credit to incentive fee (2,500) Total operating expenses 13,733 15,172 12,970 55,595 50,965 Other (expense) income Interest expense (6,254) (6,338) (7,101) (25,902) (28,014) Distributions attributable to Series C mandatorily redeemable preferred stock 1 (131) (686) (1,502) (2,743) Gain on sale of real estate 266 (24) 1, ,538 Other income 6 3 (37) Total other expense, net (5,981) (6,490) (6,286) (26,819) (29,205) Net income (loss) 2,295 (73) 2,567 3,958 3,596 Distributions attributable to Series A, B and D preferred stock (2,353) (2,002) (1,025) (6,645) (4,094) Distributions attributable to senior common stock (254) (254) (259) (1,011) (1,007) Net income (loss) available (attributable) to common stockholders $ (312) $ (2,329) $ 1,283 $ (3,698) $ (1,505) Weighted average shares of common stock outstanding Basic 24,024,280 23,509,054 22,165,654 23,193,962 21,159,597 Diluted 24,024,280 23,509,054 22,976,182 23,193,962 21,159,597
9 Funds From Operations (FFO) ($ in thousands except per share amounts) For the three months ended (unaudited) For the twelve months ended 12/31/2016 9/30/ /31/ /31/ /31/2015 Net income (loss) $ 2,295 $ (73) $ 2,567 $ 3,958 $ 3,596 Less: Distributions attributable to preferred and senior common stock (2,607) (2,256) (1,284) (7,656) (5,101) Net (loss) income (attributable) available to common stockholders $ (312) $ (2,329) $ 1,283 $ (3,698) $ (1,505) Adjustments: Add: Real estate depreciation and amortization $ 9,720 $ 9,459 $ 9,128 $ 37,517 $ 35,288 Add: Impairment charge 1,786 2, Add: Loss on sale of real estate, net $ $ 24 $ $ $ Less: Gain on sale of real estate, net $ (266) $ $ (1,538) $ (242) $ (1,538) FFO available to common stockholders - basic $ 9,142 $ 8,940 $ 8,873 $ 35,593 $ 32,867 Add: Convertible senior common distributions ,011 1,007 FFO available to common stockholders - diluted (1) $ 9,396 $ 9,194 $ 9,132 $ 36,604 $ 33,874 FFO available to common stockholders - basic $ 9,142 $ 8,940 $ 8,873 $ 35,593 $ 32,867 Add: Acquisition related expenses (14) Add: Write-off of terminated offering costs Core FFO available to common stockholders - basic $ 9,128 $ 9,147 $ 9,005 $ 36,117 $ 33,695 Add: Convertible senior common distributions ,011 1,007 Core FFO available to common stockholders - diluted (1) $ 9,382 $ 9,401 $ 9,264 $ 37,128 $ 34,702 Weighted average common shares outstanding - basic 24,024,280 23,509,054 22,165,654 23,193,962 21,159,597 Weighted average common shares outstanding - diluted 24,824,397 24,309,170 22,976,182 23,994,078 21,942,554 FFO per weighted average share of common stock - basic $ 0.38 $ 0.38 $ 0.40 $ 1.53 $ 1.55 FFO per weighted average share of common stock - diluted (1) $ 0.38 $ 0.38 $ 0.40 $ 1.53 $ 1.54 Core FFO per weighted average share of common stock - basic $ 0.38 $ 0.39 $ 0.41 $ 1.56 $ 1.59 Core FFO per weighted average share of common stock - diluted (1) $ 0.38 $ 0.39 $ 0.40 $ 1.55 $ 1.58 Distributions declared per share of common stock $ $ $ $ $ Diluted FFO available to common stockholders was not previously adjusted for the income impact of the assumed conversion of senior common stock for the three months and year ended December 31, 2015 but has subsequently been adjusted, in accordance with ASC 260 ("Earnings per Share"). 9
10 Condensed balance sheets ($ in thousands) 12/31/ /31/2015 ASSETS Real estate, at cost $ 821,749 $ 780,377 Less: accumulated depreciation 131, ,243 Total real estate, net 690, ,134 Lease intangibles, net 105, ,914 Real estate and related assets held for sale, net 9,562 1,077 Mortgage note receivable 5,900 Cash and cash equivalents 4,658 5,152 Restricted cash 3,030 4,205 Funds held in escrow 6,806 7,534 Deferred rent receivable, net 29,725 27,443 Other assets 2,320 2,825 TOTAL ASSETS $ 851,742 $ 827,184 LIABILITIES AND STOCKHOLDERS EQUITY LIABILITIES Mortgage notes payable, net $ 445,278 $ 455,863 Borrowings under line of credit and term loan, net 64,117 69,469 Series C mandatorily redeemable preferred stock, net 38,100 Deferred rent liability, asset retirement obligation and other liabilities, net 31,727 29,881 TOTAL LIABILITIES $ 541,122 $ 593,313 MEZZANINE EQUITY Series D redeemable preferred stock $ 70,743 $ TOTAL MEZZANINE EQUITY $ 70,743 $ STOCKHOLDERS EQUITY Series A and B redeemable preferred stock $ 2 $ 2 Senior common stock 1 1 Common stock Additional paid in capital 463, ,897 Distributions in excess of accumulated earnings (223,587) (185,051) TOTAL STOCKHOLDERS' EQUITY $ 239,877 $ 233,871 TOTAL LIABILITIES, MEZZANINE EQUITY AND STOCKHOLDERS EQUITY $ 851,742 $ 827,184 10
11 11 Capital structure Current capital structure as of 12/31/2016 ($000) Capital Structure Details $1,200,000 $1,000,000 $800,000 Common Equity, 44.8% Dollars in $000s, except stock price Wtd. Average Rate 12/31/2016 Mortgage Notes Payable, Net 4.69% $ 445,278 Less: Cash & Cash Equivalents (4,658) Net Mortgage Debt $ 440,620 Line of Credit L+2.25% $ 39,225 Term Note L+2.20% 24,892 Line of Credit and Term Loan $ 64,117 Total Debt, Net $ 504,737 $600,000 $400,000 Line of Credit & Term Loan, 5.6% Preferred Equity, 11.3% Series A - Preferred 7.75% $ 25,000 Series B - Preferred 7.50% 31,600 Series D - Preferred 7.00% 72,936 Total Preferred Equity $ 129,536 $200,000 Net Mortgage $479,000 Debt, 38.3% 48% Diluted Common Shares Outstanding 25,682,874 Stock Price¹ $ Implied Common Equity Market Capitalization $ 516,226 $0 Total = $1,150mm Enterprise Value $ 1,150,499 Note: Common Equity uses closing price as of December 31, 2016 and includes effect of convertible securities
12 12 Liquidity and debt overview Liquidity Fixed vs. Floating Debt $110mm credit facility comprised of $85mm line of credit and $25mm term loan $160mm common equity ATM program and $90mm in preferred equity ATM programs Minimal interest rate exposure because the vast majority of debt is either fixed rate or floating rate with an interest rate cap Reduced leverage 1 to 43.9% from 66.7% in 2009 Debt maturity schedule ($000) Floating Rate: 12.6% Hedged Floating Rate: 13.9% Fixed Rate: 73.5% 2 Mortgage Maturities Line of Credit Maturity Term Loan Maturity $140, % $120,000 $100, % 18.7% $80,000 $60,000 $40, % 9.0% 7.3% 6.2% $20,000 $ Leverage calculation is based on enterprise value. 2 Subject to loan compliance, we have the option to extend the maturity of the line of credit one year through August 2019.
13 13 Debt summary ($ in thousands) Principal Maturity Date Weighted Average Interest Rate as of Principal Balance Outstanding as of 12/31/ /31/ % 49, % 38, % 39, % 3, % 14, % 105, % 71, % 15, % 35, % 34, % 31, % 1, % 10,835 Contractual Mortgage Notes Payable: 4.69% $ 450,184 Premiums (Discounts), net: 217 Total Mortgage Notes Payable: $ 450,401 Variable-Rate Line of Credit: 2018 LIBOR +2.25% $ 39,700 Variable-Rate Term Loan Facility: 2020 LIBOR +2.20% $ 25,000 Total Mortgage Notes Payable and Line of Credit 4.48% $ 515,101
14 Portfolio Overview 14


15 15 Portfolio overview Geographic diversity 96 properties across the U.S. located in 24 states Focus on secondary growth markets with higher yields Tenant and property diversity Diverse base of 19 different industries and primarily office and industrial property types Focus on mid-size tenants occupying properties ranging from K SF (office) and K SF (industrial) Occupancy has never fallen below 96% High occupancy Current occupancy 97.9% 4.4% of projected rents expiring from Only one credit loss in Company s entire history Periodic capital recycling Sell non-core assets Re-deploy proceeds in growth markets Note: As of 12/31/2016
16 Diversified portfolio 96 properties spread across 24 states Geographic diversification (by rent) Northeast 14% Midwest 31% Southwest 27% Southeast 28% Property type diversification (by rent) Medical Office 3% Retail 4% «GOOD Properties Target Markets Industrial 36% Office 57% Note: As of 12/31/
17 17 Diversified portfolio (cont d) Publicly-traded vs. privately-held tenants (as % of total rent) Tenant credit ratings (as % of total rent) Not Rated, Non-Investment Grade Equivalent 24% Rated, Investment Grade 23% Private 50% Public 50% Rated, Non- Investment Grade 12% Rated Investment Grade and Non-Rated Equivalent 64% Not Rated, Investment Grade Equivalent 41% Note: As of 12/31/2016
18 18 High quality, diversified portfolio Top 5 tenants % of rent % of SF Industry diversification (based on rent) 6% 3% 4% 9% Telecommunications 17% All 13 Others 35% 3% 1% Healthcare 16% 3% 1% 3% 5% All other tenants 81% 81% Electronics 5% Diversified/Conglomerate Manufacturing 6% Automobile 12% Diversified/Conglomerate Services 9% Portfolio is diversified across industries Note: As of 12/31/2016
19 Smooth lease rollover Existing portfolio Year of Lease Expiration SF of Leases Expiring Number of Expiring Leases Base Rental Revenue (in thousands) % of Base Revenue ,260 2 $ % , % , % ,067, , % , , % , , % ,680, , % Sold/Terminated Leases N/A N/A % Total 10,869, $ 21, % Rent expiring 100.0% 80.0% 60.0% 60.1% 40.0% 20.0% 0.0% 13.9% 9.8% 10.3% 0.5% 0.5% 1.3% 1.1% 3.8% 2.8% GAAP Rents (Existing Portfolio) Projected Rents through 2019 Note: As of 12/31/
20 #
Government Properties Income Trust Announces Third Quarter 2015 Results
 FOR IMMEDIATE RELEASE Contact: Olivia Snyder, Investor Relations Analyst (617) 219-1410 Government Properties Income Trust Announces Third Quarter 2015 Results Normalized FFO of $0.59 Per Share for the
EQUITY OFFICE ANNOUNCES FIRST QUARTER 2004 RESULTS
 Two North Riverside Plaza, Suite 2100 Chicago, Illinois 60606 phone 312.466.3300 fax 312.454.0332 www.equityoffice.com Equity Office (Investors/Analysts): Diane Morefield 312.466.3286 Equity Office (Media):
GGP REPORTS FULL YEAR 2015 RESULTS AND DECLARES FIRST QUARTER DIVIDEND
 GGP REPORTS FULL YEAR 2015 RESULTS AND DECLARES FIRST QUARTER DIVIDEND Chicago, Illinois, February 1, 2016 - General Growth Properties, Inc. (the Company or GGP ) (NYSE: GGP) today reported results for
EQUINIX, INC. CONDENSED CONSOLIDATED STATEMENTS OF OPERATIONS - GAAP PRESENTATION (in thousands, except per share data) (unaudited)
 (unaudited)") CONDENSED CONSOLIDATED STATEMENTS OF OPERATIONS - GAAP PRESENTATION (in thousands, except per share data) Recurring revenues $ 314,727 $ 282,117 $ 216,517 $ 834,080 $ 610,384 Non-recurring revenues 15,620
CONDENSED CONSOLIDATED STATEMENTS OF OPERATIONS - GAAP PRESENTATION (in thousands, except per share data) Recurring revenues $ 314,727 $ 282,117 $ 216,517 $ 834,080 $ 610,384 Non-recurring revenues 15,620
Kimco Realty Announces First Quarter 2016 Operating Results
 Listed on the New York Stock Exchange (KIM) NEWS RELEASE Kimco Realty Announces First Quarter 2016 Operating Results Company Remains Focused on 2020 Vision: Sustaining High Occupancy, Reducing Joint Venture
1Q 2014 Stockholder Supplement. May 7, 2014
 1Q 2014 Stockholder Supplement May 7, 2014 Safe Harbor Notice This presentation, other written or oral communications and our public documents to which we refer contain or incorporate by reference certain
GENERAL GROWTH PROPERTIES REPORTS THIRD QUARTER RESULTS Mall NOI Increases 4.0%
 GENERAL GROWTH PROPERTIES REPORTS THIRD QUARTER RESULTS Mall NOI Increases 4.0% Chicago, Illinois, October 31, 2012 General Growth Properties, Inc. (the Company ) (NYSE: GGP) today reported results for
Highwoods Reports Fourth Quarter and Full Year 2015 Results. $0.82 FFO per Share for Fourth Quarter 2015 (Including $0.01 of Land Sale Gains)
") FOR IMMEDIATE RELEASE Ref: 16-05 Contact: Mark Mulhern Senior Vice President and Chief Financial Officer 919-875-6682 Reports Fourth Quarter and Full Year 2015 Results $0.82 FFO per Share for Fourth Quarter
FOR IMMEDIATE RELEASE Ref: 16-05 Contact: Mark Mulhern Senior Vice President and Chief Financial Officer 919-875-6682 Reports Fourth Quarter and Full Year 2015 Results $0.82 FFO per Share for Fourth Quarter
Griffin-American Healthcare REIT III Reports Fourth Quarter and Year-End 2015 Results
 Media Contact: Damon Elder delder@ahinvestors.com (949) 270-9207 Griffin-American Healthcare REIT III Reports Fourth Quarter and Year-End 2015 Results IRVINE, Calif. (April 4, 2016) - Griffin-American
First Quarter 2016 Earnings Release and Supplemental Information
 First Quarter 2016 Earnings Release and Supplemental Information CH2 Data Center Elk Grove Village, IL DuPont Fabros Technology, Inc. 1212 New York Avenue, NW Suite 900 Washington, D.C. 20005 (202) 728-0044
Consolidated Statement of Profit or Loss (in million Euro)
") Consolidated Statement of Profit or Loss (in million Euro) Q3 2014 Q3 2015 % change 9m 2014 9m 2015 % change Revenue 636 661 3.9% 1,909 1,974 3.4% Cost of sales (440) (453) 3.0% (1,324) (1,340) 1.2% Gross
Consolidated Statement of Profit or Loss (in million Euro) Q3 2014 Q3 2015 % change 9m 2014 9m 2015 % change Revenue 636 661 3.9% 1,909 1,974 3.4% Cost of sales (440) (453) 3.0% (1,324) (1,340) 1.2% Gross
CNL LIFESTYLE PROPERTIES ANNOUNCES FIRST QUARTER 2015 RESULTS -- Total revenues decreased 0.5 percent year-over-year to $72.
 News Release For information contact: Sherry Magee Senior Vice President Communications CNL Financial Group 407-650-1223 CNL LIFESTYLE PROPERTIES ANNOUNCES FIRST QUARTER 2015 RESULTS -- Total revenues
Prologis Announces Fourth Quarter and Full Year 2013 Earnings Results
 January 30, 2014 Prologis Announces Fourth Quarter and Full Year 2013 Earnings Results - Leased record 43.7 million square feet in Q4 and 152 million square feet in 2013 - - Occupancy increased to 95.1
FOR IMMEDIATE RELEASE MAY 5, 2016 ARTIS RELEASES FIRST QUARTER RESULTS: FFO PAYOUT RATIO IMPROVES TO 71.1%
 FOR IMMEDIATE RELEASE MAY 5, 2016 ARTIS RELEASES FIRST QUARTER RESULTS: FFO PAYOUT RATIO IMPROVES TO 71.1% Today Artis Real Estate Investment Trust ( Artis or the "REIT") issued its financial results and
FIRST CAPITAL REALTY ANNOUNCES STRONG 2008 YEAR END RESULTS Strong portfolio fundamentals and substantial liquidity.
 Press Release FIRST CAPITAL REALTY ANNOUNCES STRONG 2008 YEAR END RESULTS Strong portfolio fundamentals and substantial liquidity. Toronto, Ontario (March 5, 2009) First Capital Realty Inc. ( First Capital
TIME WARNER CABLE INC. CONSOLIDATED BALANCE SHEET (Unaudited)
") CONSOLIDATED BALANCE SHEET June 30, December 31, 2011 2010 (in millions) ASSETS Current assets: Cash and equivalents...$ 3,510 $ 3,047 Receivables, less allowances of $86 million and $74 million as of
CONSOLIDATED BALANCE SHEET June 30, December 31, 2011 2010 (in millions) ASSETS Current assets: Cash and equivalents...$ 3,510 $ 3,047 Receivables, less allowances of $86 million and $74 million as of
N E W S R E L E A S E
 N E W S R E L E A S E FOR IMMEDIATE RELEASE Contact: Steven E. Nielsen, President and CEO H. Andrew DeFerrari, Senior Vice President and CFO (561) 627-7171 DYCOM INDUSTRIES, INC. ANNOUNCES FISCAL 2016
SECURITIES AND EXCHANGE COMMISSION. Washington, D.C. 20549 FORM 8-K CURRENT REPORT
 ˆ200FBJ2CQ3eg&rmwzŠ 200FBJ2CQ3eg&rmw NERPRFRS9 10.8.16 NER pf_rend 29-Jul-2011 06:56 EST 214712 TX 1 4* SECURITIES AND EXCHANGE COMMISSION Washington, D.C. 20549 CURRENT REPORT PURSUANT TO SECTION 13 OR
EASTGROUP PROPERTIES ANNOUNCES THIRD QUARTER 2015 RESULTS
 FOR MORE INFORMATION, CONTACT: David H. Hoster II, Chief Executive Officer Marshall Loeb, President and Chief Operating Officer N. Keith McKey, Chief Financial Officer (601) 354-3555 EASTGROUP PROPERTIES
Consolidated Statement of Profit or Loss (in million Euro)
") Consolidated Statement of Profit or Loss (in million Euro) Q3 2013 Q3 2014 % change 9m 2013 9m 2014 % change Revenue 689 636-7.7% 2,126 1,909-10.2% Cost of sales (497) (440) -11.5% (1,520) (1,324) -12.9%
Consolidated Statement of Profit or Loss (in million Euro) Q3 2013 Q3 2014 % change 9m 2013 9m 2014 % change Revenue 689 636-7.7% 2,126 1,909-10.2% Cost of sales (497) (440) -11.5% (1,520) (1,324) -12.9%
Crown Castle International Corp. Consolidating Income Statement Unaudited Consolidated Statement of Operations (in millions of dollars)
") Consolidating Income Statement Unaudited Consolidated Statement of Operations CCIC Consolidated Revenues Site Rental 406.9 409.6 437.1 447.2 1,700.8 456.2 457.1 468.9 Network Services and Other 37.5 46.5
Consolidating Income Statement Unaudited Consolidated Statement of Operations CCIC Consolidated Revenues Site Rental 406.9 409.6 437.1 447.2 1,700.8 456.2 457.1 468.9 Network Services and Other 37.5 46.5
WESTFIELD REAL ESTATE INVESTMENT TRUST
 Unaudited Financial Statements of WESTFIELD REAL ESTATE INVESTMENT TRUST Period from January 1, 2005 to March 31, 2005 BALANCE SHEET Assets March 31 2005 (unaudited) December 31 2004 (audited) Income-producing
Global Telecom & Technology Reports Fourth Quarter and Full Year 2010 Results
 Global Telecom & Technology Reports Fourth Quarter and Full Year 2010 Results MCLEAN, Va. (BUSINESS WIRE Global Telecom & Technology, Inc. ( GTT, (OTCBB: GTLT, a global telecommunications carrier and leading
Yosemite Farm Credit. Quarterly Financial Report
 Yosemite Farm Credit Quarterly Financial Report June 2015 TABLE OF CONTENTS Message to Members 1 Statements of Condition 2 Statements of Comprehensive Income 3 Statements of Changes in Shareholders Equity
HSBC FINANCE CORPORATION
 UNITED STATES SECURITIES AND EXCHANGE COMMISSION Washington, D.C. 20549 FORM 10-Q (Mark One) QUARTERLY REPORT PURSUANT TO SECTION 13 OR 15(d) OF THE SECURITIES EXCHANGE ACT OF 1934 For the quarterly period
Third Quarter 2015 Earnings Release and Supplemental Information
 Third Quarter 2015 Earnings Release and Supplemental Information ACC2 Data Center Ashburn, VA DuPont Fabros Technology, Inc. 1212 New York Avenue, NW Suite 900 Washington, D.C. 20005 (202) 728-0044 www.dft.com
EdR ANNOUNCES FIRST QUARTER 2015 RESULTS - Same-Community NOI Growth of 5.8% -
 EdR ANNOUNCES FIRST QUARTER 2015 RESULTS - Same-Community NOI Growth of 5.8% - MEMPHIS, TN, April 29, 2015 - EdR (NYSE:EDR), one of the nation s largest developers, owners and managers of high-quality
VIVINT SOLAR ANNOUNCES FIRST QUARTER 2015 FINANCIAL RESULTS
 VIVINT SOLAR ANNOUNCES FIRST QUARTER 2015 FINANCIAL RESULTS Megawatts Installed Increased 131% Year-over-Year Retained Value Increased 138% Year-over-Year Revenue Increased 172% Year-over-Year LEHI, Utah,
JER INVESTORS TRUST INC. PROVIDES COMPANY UPDATE AND 2009 ANNUAL STATEMENT OF AFFAIRS
 JER INVESTORS TRUST INC. PROVIDES COMPANY UPDATE AND ANNUAL STATEMENT OF AFFAIRS McLean, VA June 4, 2010: JER Investors Trust Inc. (Pink Sheets: JERT.PK, JERT or the Company ) released its annual Statement
As of December 31, 2014. As of December 31, 2015. Assets Current assets:
 Assets Current assets: Alphabet Inc. CONSOLIDATED BALANCE SHEETS (In millions, except share and par value amounts which are reflected in thousands, and par value per share amounts) As of December 31, 2014
Zayo Group Holdings, Inc. Reports Financial Results for the Third Fiscal Quarter Ended March 31, 2016
 Zayo Group Holdings, Inc. Reports Financial Results for the Third Fiscal Quarter Ended March 31, 2016 Third Fiscal Quarter 2016 Financial Highlights $478.0 million of consolidated revenue, including $96.1
Contacts: Investor Relations Evan Black & Kristina Carbonneau 800.493.8219 InvestorRelations@santanderconsumerusa.com
 Contacts: Investor Relations Evan Black & Kristina Carbonneau 800.493.8219 InvestorRelations@santanderconsumerusa.com Media Relations Laurie Kight 214.801.6455 LKight@santanderconsumerusa.com Santander
SanDisk Corporation Preliminary Condensed Consolidated Statements of Operations (in thousands, except per share amounts, unaudited)
") Preliminary Condensed Consolidated Statements of Operations (in thousands, except per share amounts, unaudited) Revenue $ 1,634,011 $ 1,476,263 $ 3,145,956 $ 2,816,992 Cost of revenue 854,640 789,614 1,595,679
Preliminary Condensed Consolidated Statements of Operations (in thousands, except per share amounts, unaudited) Revenue $ 1,634,011 $ 1,476,263 $ 3,145,956 $ 2,816,992 Cost of revenue 854,640 789,614 1,595,679
EMERSON AND SUBSIDIARIES CONSOLIDATED OPERATING RESULTS (AMOUNTS IN MILLIONS EXCEPT PER SHARE, UNAUDITED)
") CONSOLIDATED OPERATING RESULTS (AMOUNTS IN MILLIONS EXCEPT PER SHARE, UNAUDITED) TABLE 1 Quarter Ended March 31, Percent Change Net Sales $ 5,854 $ 5,919 1% Costs and expenses: Cost of sales 3,548 3,583
CONSOLIDATED OPERATING RESULTS (AMOUNTS IN MILLIONS EXCEPT PER SHARE, UNAUDITED) TABLE 1 Quarter Ended March 31, Percent Change Net Sales $ 5,854 $ 5,919 1% Costs and expenses: Cost of sales 3,548 3,583
(Formerly CVTech Group Inc.)
") (Formerly CVTech Group Inc.) Condensed Interim Consolidated Financial Statements For the three months ended, 2014 Consolidated Statement of Financial Position (in thousands of Canadian dollars) December
(Formerly CVTech Group Inc.) Condensed Interim Consolidated Financial Statements For the three months ended, 2014 Consolidated Statement of Financial Position (in thousands of Canadian dollars) December
Carbonite Reports Record Revenue for Second Quarter of 2014
 Carbonite Reports Record Revenue for Second Quarter of 2014 BOSTON, MA July 29, 2014 - Carbonite, Inc. (NASDAQ: CARB), a leading provider of hybrid backup and recovery solutions for businesses, today announced
October 21, 2015 MEDIA & INVESTOR CONTACT Heather Worley, 214.932.6646 heather.worley@texascapitalbank.com
 October 21, 2015 MEDIA & INVESTOR CONTACT Heather Worley, 214.932.6646 heather.worley@texascapitalbank.com TEXAS CAPITAL BANCSHARES, INC. ANNOUNCES OPERATING RESULTS FOR Q3 2015 DALLAS - October 21, 2015
How To Make Money From A Bank Loan
 NEWS RELEASE FOR FURTHER INFORMATION: WEBSITE: www.bnccorp.com TIMOTHY J. FRANZ, CEO TELEPHONE: (612) 305-2213 DANIEL COLLINS, CFO TELEPHONE: (612) 305-2210 BNCCORP, INC. REPORTS THIRD QUARTER NET INCOME
State Bank Financial Corporation Reports Fourth Quarter and Full Year 2015 Financial Results
 Investor Relations Contact: Jeremy Lucas 404.239.8626 / jeremy.lucas@statebt.com Fourth Quarter 2015 Highlights State Bank Financial Corporation Reports Fourth Quarter and Full Year 2015 Financial Results
EASTGROUP PROPERTIES ANNOUNCES FOURTH QUARTER AND YEAR 2015 RESULTS
 FOR MORE INFORMATION, CONTACT: Marshall Loeb, President and Chief Executive Officer N. Keith McKey, Chief Financial Officer (601) 354-3555 EASTGROUP PROPERTIES ANNOUNCES FOURTH QUARTER AND YEAR 2015 RESULTS
Jones Lang LaSalle Income Property Trust, Inc.
 UNITED STATES SECURITIES AND EXCHANGE COMMISSION Washington, D.C. 20549 FORM 8-K CURRENT REPORT Pursuant to Section 13 or 15(d) of the Securities Exchange Act of 1934 Date of report (Date of earliest event
Riverview Bancorp Earns $1.6 Million In First Fiscal Quarter Highlighted by Continued Credit Quality Improvements
 Contacts: Pat Sheaffer or Ron Wysaske, Riverview Bancorp, Inc. 360-693-6650 Riverview Bancorp Earns $1.6 Million In First Fiscal Quarter Highlighted by Continued Credit Quality Improvements Vancouver,
Third Quarter 2015 Financial Highlights:
 DISCOVERY COMMUNICATIONS REPORTS THIRD QUARTER 2015 RESULTS, INCREASES BUYBACK AUTHORIZATION BY $2 BILLION AND ANNOUNCES RESUMPTION OF SHARE REPURCHASES BEGINNING IN FOURTH QUARTER 2015 Third Quarter 2015
Capmark Financial Group Inc. Announces Stand Alone Third Quarter 2014 Earnings Results for its Wholly Owned Subsidiary, Bluestem Brands, Inc.
 Capmark Financial Group Inc. Announces Stand Alone Third Quarter 2014 Earnings Results for its Wholly Owned Subsidiary, Bluestem Brands, Inc. Horsham, PA December 23, 2014 Capmark Financial Group Inc.
KBW Mortgage Finance Conference. June 2, 2015
 KBW Mortgage Finance Conference June 2, 2015 Forward Looking Statements This presentation contains forward looking statements within the meaning of the safe harbor provisions of the Private Securities
APX GROUP HOLDINGS, INC. REPORTS FIRST QUARTER 2014 FINANCIAL RESULTS
 APX GROUP HOLDINGS, INC. REPORTS FIRST QUARTER 2014 FINANCIAL RESULTS 1st Quarter Financial Highlights Total revenues of $130.2 million for the first quarter 2014, an increase of 21.8%, compared to $106.9
5N PLUS INC. Condensed Interim Consolidated Financial Statements (Unaudited) For the three month periods ended March 31, 2016 and 2015 (in thousands
 For the three month periods ended March 31, 2016 and 2015 (in thousands") Condensed Interim Consolidated Financial Statements (Unaudited) (in thousands of United States dollars) Condensed Interim Consolidated Statements of Financial Position (in thousands of United States dollars)
Condensed Interim Consolidated Financial Statements (Unaudited) (in thousands of United States dollars) Condensed Interim Consolidated Statements of Financial Position (in thousands of United States dollars)
UNITED STATES SECURITIES AND EXCHANGE COMMISSION Washington D.C. 20549 FORM 8-K
 UNITED STATES SECURITIES AND EXCHANGE COMMISSION Washington D.C. 20549 FORM 8-K Current report pursuant to Section 13 or 15(d) of the Securities Exchange Act of 1934 Date of Report (Date of earliest event
Net Income From Kansas Life Insurance Company
 Kansas City 4Life Insurance Company 2012 Fourth Quarter Report Includes our subsidiaries: Sunset Life Insurance Company of America Old American Insurance Company Sunset Financial Services, Inc. Post Office
RE/MAX HOLDINGS REPORTS THIRD QUARTER 2013 RESULTS Increased Agent Count 4% Grew Revenue 5% and Adjusted EBITDA 13% Completed IPO in October 2013
 RE/MAX HOLDINGS REPORTS THIRD QUARTER 2013 RESULTS Increased Agent Count 4% Grew Revenue 5% and Adjusted EBITDA 13% Completed IPO in October 2013 Denver, Colorado, November 13, 2013. RE/MAX Holdings, Inc.
HP INC. AND SUBSIDIARIES CONSOLIDATED CONDENSED STATEMENTS OF EARNINGS (Unaudited) (In millions, except per share amounts)
 (In millions, except per share amounts)") CONSOLIDATED CONDENSED STATEMENTS OF EARNINGS (In millions, except per share amounts) 2015 Three months ended July 31, 2015 2014 Net revenue $ 25,714 $ 25,349 $ 28,406 Costs and expenses: Cost of sales
CONSOLIDATED CONDENSED STATEMENTS OF EARNINGS (In millions, except per share amounts) 2015 Three months ended July 31, 2015 2014 Net revenue $ 25,714 $ 25,349 $ 28,406 Costs and expenses: Cost of sales
BTB Real Estate Investment Trust Management Discussion and Analysis. Quarter ended June 30, 2014. Space for. growth
 BTB Real Estate Investment Trust Management Discussion and Analysis Quarter ended June 30, 2014 Space for growth Table of Contents 11 Introduction 11 Forward-Looking Statements Caveat 12 Non-IFRS Financial
News Release INVESTOR AND MEDIA CONTACT: George R. Kirkland Senior Vice President and Treasurer Phone: (229) 873-3830 gkirkland@sgfc.
 873-3830 gkirkland@sgfc.") Southwest Georgia Financial Corporation 201 First Street S.E. Moultrie, GA 31768 PH: (229) 985-1120 FX: (229) 985-0251 News Release INVESTOR AND MEDIA CONTACT: George R. Kirkland Senior Vice President
Southwest Georgia Financial Corporation 201 First Street S.E. Moultrie, GA 31768 PH: (229) 985-1120 FX: (229) 985-0251 News Release INVESTOR AND MEDIA CONTACT: George R. Kirkland Senior Vice President
Forward-Looking Statements
 MANAGEMENT S DISCUSSION AND ANALYSIS For the three months ended March 31, 2010 Dated May 21, 2010 Management's Discussion and Analysis ( MD&A ) is intended to help shareholders, analysts and other readers
Zebra Technologies Announces Record Sales for Second Quarter of 2006
 FOR IMMEDIATE RELEASE Zebra Technologies Announces Record Sales for Second Quarter of 2006 Vernon Hills, IL, July 26, 2006 Zebra Technologies Corporation (NASDAQ: ZBRA) today announced that net income
For Immediate Release Toronto Stock Exchange Symbol: RC
 For Immediate Release Toronto Stock Exchange Symbol: RC RDM Corporation Reports Third Quarter Financial Results Payment Processing Services Revenue grows 15% year over year WATERLOO, ON, July 26, 2012
Burlington Stores, Inc. Announces Operating Results for the Fourth Quarter and Fiscal Year Ended February 1, 2014
 FOR IMMEDIATE RELEASE Burlington Stores, Inc. Announces Operating Results for the Fourth Quarter and Fiscal Year Ended February 1, 2014 Comparable store sales increased 4.0% and 4.7%, for the fourth quarter
For the three months ended March 31, 2001 2000. Net sales $ 1,921 $ 1,351 Cost of sales 1,112 788. Gross margin 809 563
 Pro Forma Consolidated Statements of Income Excluding Amortization of Purchased Intangibles and Goodwill, Purchased In-Process Research and Development, Acquisition-Related Costs and Non-Recurring Items
FINANCIAL SUPPLEMENT December 31, 2015
 FINANCIAL SUPPLEMENT December 31, 2015 Monster Worldwide, Inc. (together with its consolidated subsidiaries, the Company, Monster, we, our or us ) provides this supplement to assist investors in evaluating
News Release For Immediate Release
 News Release For Immediate Release Contact: Thomas Duryea, President and CEO, Summit State Bank (707) 568-4920 Summit State Bank Reports a 25% increase in Earnings for 2013 and Declaration of Dividend
American International Group, Inc.
 Financial Supplement Fourth Quarter 2013 All financial information in this document is unaudited. This report should be read in conjunction with AIG s Annual Report on Form 10-K for the year ended December
Alphabet Announces Fourth Quarter and Fiscal Year 2015 Results
 Exhibit 99.1 Alphabet Announces Fourth Quarter and Fiscal Year 2015 Results MOUNTAIN VIEW, Calif. February 1, 2016 Alphabet Inc. (NASDAQ: GOOG, GOOGL) today announced financial results for the quarter
Three Months Ended March 31, 2015 Revenues $ 15,420 $ 17,258 Increase in revenues year over year 19% 12%
 Exhibit 99.1 Google Inc. Announces First Quarter 2015 Results MOUNTAIN VIEW, Calif. April 23, 2015 - Google Inc. (NASDAQ: GOOG, GOOGL) today announced financial results for the quarter ended. Google s
REPUBLIC SERVICES, INC. REPORTS THIRD QUARTER RESULTS
 REPUBLIC CONTACTS Media Inquiries: Darcie Brossart (480) 718-6565 Investor Inquiries: Ed Lang (480) 627-7128 REPUBLIC SERVICES, INC. REPORTS THIRD QUARTER RESULTS Reports third quarter earnings of $0.42
NEWS RELEASE NASDAQ Symbol: STRS Stratus Properties Inc. 98 San Jacinto Blvd. Suite 220 William H. Armstrong III Austin, Texas 78701 (512) 478-5788
 478-5788") NEWS RELEASE NASDAQ Symbol: STRS Stratus Properties Inc. 98 San Jacinto Blvd. Suite 220 William H. Armstrong III Austin, Texas 78701 (512) 478-5788 Financial and Media Contact: STRATUS PROPERTIES INC.
NEWS RELEASE NASDAQ Symbol: STRS Stratus Properties Inc. 98 San Jacinto Blvd. Suite 220 William H. Armstrong III Austin, Texas 78701 (512) 478-5788 Financial and Media Contact: STRATUS PROPERTIES INC.
REVEN HOUSING REIT, INC.
 REVEN HOUSING REIT, INC. FORM 10-Q (Quarterly Report) Filed 08/12/15 for the Period Ending 06/30/15 Address 875 PROSPECT STREET SUITE 304 LA JOLLA, CA 92037 Telephone 858-459-4000 CIK 0001487782 Symbol
Brookfield financial Review q2 2010
 Brookfield financial Review q2 2010 Overview Operating cash flow and gains totalled $327 million in the second quarter or $0.53 per share compared to $294 million in the prior year. This brings operating
Salesforce Announces Fiscal 2016 First Quarter Results Becomes First Enterprise Cloud Computing Company to Reach $6 Billion Revenue Run Rate
 John Cummings Salesforce Investor Relations 415-778-4188 jcummings@salesforce.com Chi Hea Cho Salesforce Public Relations 415-281-5304 chcho@salesforce.com Salesforce Announces Fiscal 2016 First Quarter
INDEX TO FINANCIAL STATEMENTS. Balance Sheets as of June 30, 2015 and December 31, 2014 (Unaudited) F-2
 F-2") INDEX TO FINANCIAL STATEMENTS Page Financial Statements Balance Sheets as of and December 31, 2014 (Unaudited) F-2 Statements of Operations for the three months ended and 2014 (Unaudited) F-3 Statements
INDEX TO FINANCIAL STATEMENTS Page Financial Statements Balance Sheets as of and December 31, 2014 (Unaudited) F-2 Statements of Operations for the three months ended and 2014 (Unaudited) F-3 Statements
Territorial Bancorp Inc. Announces 2015 Results
 PRESS RELEASE FOR IMMEDIATE RELEASE Contact: Walter Ida (808) 946-1400 Territorial Bancorp Inc. Announces 2015 Results Fully diluted earnings per share for the three months ended December 31, 2015 rose
Kansas City 4Life Insurance Company
 Kansas City 4Life Insurance Company 2009 Fourth Quarter Report Includes our subsidiaries: Sunset Life Insurance Company of America Old American Insurance Company Sunset Financial Services, Inc. Post Office
Salesforce delivered the following results for its fiscal fourth quarter and full fiscal year 2015:
 John Cummings Salesforce Investor Relations 415-778-4188 jcummings@salesforce.com Chi Hea Cho Salesforce Public Relations 415-281-5304 chcho@salesforce.com Salesforce Announces Fiscal 2015 Fourth Quarter
Territorial Bancorp Inc. Announces Second Quarter 2015 Results
 PRESS RELEASE FOR IMMEDIATE RELEASE Contact: Walter Ida (808) 946-1400 Territorial Bancorp Inc. Announces Second Quarter 2015 Results Earnings per share for the three months ended June 30, 2015 rose to
Oppenheimer Holdings Inc. Second Quarter 2012 Earnings and Dividend Announcement
 Oppenheimer Holdings Inc. NYSE OPY July 27, 2012 New York, NY Second Quarter 2012 Earnings and Dividend Announcement Expressed in thousands of dollars, except per share amounts (unaudited) Three Months
REAL ESTATE INVESTMENT TRUSTS (REITs)
") UNDERSTANDING REAL ESTATE INVESTMENT TRUSTS (REITs) www.griffincapital.com KEY TERMS for ASSESSING REITS NET LEASE TRIPLE NET LEASE ABSOLUTE NET LEASE GAAP STRAIGHT-LINING FUNDS FROM OPERATIONS (FFO) MODIFIED
UNDERSTANDING REAL ESTATE INVESTMENT TRUSTS (REITs) www.griffincapital.com KEY TERMS for ASSESSING REITS NET LEASE TRIPLE NET LEASE ABSOLUTE NET LEASE GAAP STRAIGHT-LINING FUNDS FROM OPERATIONS (FFO) MODIFIED
Important Information about Real Estate Investment Trusts (REITs)
") Robert W. Baird & Co. Incorporated Important Information about Real Estate Investment Trusts (REITs) Baird has prepared this document to help you understand the characteristics and risks associated with
Robert W. Baird & Co. Incorporated Important Information about Real Estate Investment Trusts (REITs) Baird has prepared this document to help you understand the characteristics and risks associated with
Scott s Real Estate Investment Trust. Interim Consolidated Financial Statements (Unaudited) March 31, 2009 and 2008
 March 31, 2009 and 2008") Interim Consolidated Financial Statements March 31, and Interim Consolidated Balance Sheets (in thousands of dollars) Assets March 31, December 31, Income-producing properties (note 3) 172,404 174,135
Interim Consolidated Financial Statements March 31, and Interim Consolidated Balance Sheets (in thousands of dollars) Assets March 31, December 31, Income-producing properties (note 3) 172,404 174,135
CATAMARAN CORPORATION ANNOUNCES RECORD FINANCIAL RESULTS FOR 2014 CATAMARAN TO ACQUIRE HEALTHCARE SOLUTIONS, INC.
 CATAMARAN CORPORATION ANNOUNCES RECORD FINANCIAL RESULTS FOR 2014 CATAMARAN TO ACQUIRE HEALTHCARE SOLUTIONS, INC. Schaumburg, Illinois, February 26, 2015 - Catamaran Corporation ( Catamaran or the Company
Consolidated Balance Sheets
 Consolidated Balance Sheets March 31 2015 2014 2015 Assets: Current assets Cash and cash equivalents 726,888 604,571 $ 6,057,400 Marketable securities 19,033 16,635 158,608 Notes and accounts receivable:
UNITED STATES SECURITIES AND EXCHANGE COMMISSION Washington, D.C. 20549 FORM 8-K
 UNITED STATES SECURITIES AND EXCHANGE COMMISSION Washington, D.C. 20549 FORM 8-K CURRENT REPORT PURSUANT TO SECTION 13 OR 15(d) OF THE SECURITIES EXCHANGE ACT OF 1934 May 8, 2014 Date of Report (Date of
617-444-3913 617-274-7130 AKAMAI REPORTS SECOND QUARTER 2015 FINANCIAL RESULTS
 FOR IMMEDIATE RELEASE Contacts: Jeff Young Tom Barth Media Relations Investor Relations Akamai Technologies Akamai Technologies 617-444-3913 617-274-7130 jyoung@akamai.com tbarth@akamai.com AKAMAI REPORTS
Consolidated Statement of Profit or Loss (in million Euro)
") Consolidated Statement of Profit or Loss (in million Euro) Q2 2012 Q2 2013 % H1 2012 H1 2013 % Restated * change Restated * change Revenue 779 732-6.0% 1,513 1,437-5.0% Cost of sales (553) (521) -5.8%
Consolidated Statement of Profit or Loss (in million Euro) Q2 2012 Q2 2013 % H1 2012 H1 2013 % Restated * change Restated * change Revenue 779 732-6.0% 1,513 1,437-5.0% Cost of sales (553) (521) -5.8%
Tower International Reports Solid Third Quarter And Raises Full Year Outlook
 FOR IMMEDIATE RELEASE Tower International Reports Solid Third Quarter And Raises Full Year Outlook LIVONIA, Mich., November 3, 2011 Tower International, Inc. [NYSE: TOWR], a leading integrated global manufacturer
The Depository Trust Company
 The Depository Trust Company Unaudited Condensed Consolidated Financial Statements as of March 31, 2016 and December 31, 2015 and for the three months ended March 31, 2016 and 2015 THE DEPOSITORY TRUST
PRESS RELEASE VALLEY COMMERCE BANCORP REPORTS RECORD EARNINGS FOR 2015
 PRESS RELEASE Contact: Roy Estridge, EVP/COO/CFO Valley Commerce Bancorp (559) 622-9000 VALLEY COMMERCE BANCORP REPORTS RECORD EARNINGS FOR 2015 VISALIA, California, January 15, 2016 Valley Commerce Bancorp,
! "#$ %&!& "& ' - 3+4 &*!&-.,,5///2!(.//+ & $!- )!* & % +, -).//0)& 7+00///2 *&&.4 &*!&- 7.00///2 )!*.//+ 8 -!% %& "#$ ) &!&.
!* & % +, -).//0)& 7+00///2 *&&.4 &*!&- 7.00///2 )!*.//+ 8 -!% %& #$ ) &!&.") ! "#!""#$%$#$#$"& $'"()*+,$-).,/ 012! "#$ %&!& "& '!(&)!*&%+,-).//0 -#$#3-4' &,'1$1# $!-!(.//0)& +01+///2 *&& - 3+4 &*!&-.,,5///2!(.//+ &!(!-6%(!(.//.$(!(.//0)& 01,///2 //+2% &*!&- 5,0///2 //32%!(.//+
! "#!""#$%$#$#$"& $'"()*+,$-).,/ 012! "#$ %&!& "& '!(&)!*&%+,-).//0 -#$#3-4' &,'1$1# $!-!(.//0)& +01+///2 *&& - 3+4 &*!&-.,,5///2!(.//+ &!(!-6%(!(.//.$(!(.//0)& 01,///2 //+2% &*!&- 5,0///2 //32%!(.//+
Investor Presentation. Date September 2014
 Investor Presentation Date September 2014 The forward-looking statements contained in this presentation are subject to various risks and uncertainties. Although the Company believes the expectations reflected
INDUSTRIAL-ALLIANCE LIFE INSURANCE COMPANY. FIRST QUARTER 2000 Consolidated Financial Statements (Non audited)
") INDUSTRIAL-ALLIANCE LIFE INSURANCE COMPANY FIRST QUARTER 2000 Consolidated Financial Statements (Non audited) March 31,2000 TABLE OF CONTENTS CONSOLIDATED INCOME 2 CONSOLIDATED CONTINUITY OF EQUITY 3 CONSOLIDATED
INDUSTRIAL-ALLIANCE LIFE INSURANCE COMPANY FIRST QUARTER 2000 Consolidated Financial Statements (Non audited) March 31,2000 TABLE OF CONTENTS CONSOLIDATED INCOME 2 CONSOLIDATED CONTINUITY OF EQUITY 3 CONSOLIDATED
PANHANDLE OIL AND GAS INC. REPORTS SECOND QUARTER AND SIX MONTHS 2009 RESULTS. Second Quarter Production Increases 38%
 FOR IMMEDIATE RELEASE PLEASE CONTACT: Michael C. Coffman 405.948.1560 Website: www.panhandleoilandgas.com May 8, 2009 PANHANDLE OIL AND GAS INC. REPORTS SECOND QUARTER AND SIX MONTHS 2009 RESULTS Second
APX GROUP HOLDINGS, INC. REPORTS FIRST QUARTER 2015 RESULTS
 APX GROUP HOLDINGS, INC. REPORTS FIRST QUARTER 2015 RESULTS First Quarter 2015 Financial and Portfolio Highlights APX Group Reports Total Revenue of $149.9 Million, up 14.9% Year over Year Adjusted EBITDA
Monster Worldwide Reports Third Quarter 2015 Results
 Monster Worldwide Reports Third Quarter 2015 Results Third Quarter Financial Highlights: o Company Exceeds Expectations on All Profitability Metrics For the 5th Consecutive Quarter Adjusted EBITDA Including
Asta Funding, Inc. Announces Financial Results for Second Quarter and First Six Months of Fiscal 2014
 May 8, 2014 Asta Funding, Inc. Announces Financial Results for Second Quarter and First Six Months of Fiscal 2014 Net Income of $3.8 million, or $0.29 Per Diluted Share for Six Months. An Improvement of
Sapiens results in the first quarter represent a solid start to achieving our financial targets for the full year.
 Sapiens Reports 12% Year-Over-Year Increase in Quarterly Revenue to $41 Million Non-GAAP Quarterly Operating Profit Increased by 58.5% Year-Over-Year Holon, Israel, May 6, 2015 Sapiens International Corporation,
INTERACTIVE BROKERS GROUP ANNOUNCES 2015 RESULTS
 INTERACTIVE BROKERS GROUP ANNOUNCES 2015 RESULTS REPORTS COMPREHENSIVE EARNINGS PER SHARE OF $0.62, INCOME BEFORE TAXES OF $458 MILLION ON $1,189 MILLION IN NET REVENUES, AND EARNINGS PER SHARE ON NET
First Quarter 2016 Earnings Call. May 5, 2016
 First Quarter 2016 Earnings Call May 5, 2016 Safe Harbor Statement F O R W A R D - L O O K I N G S T A T E M ENTS This presentation includes forward-looking statements within the meaning of the safe harbor
Burke Annual Report. iscal Year and Accomplishments
 Burke Annual Report F iscal Year and Accomplishments This fiscal year was truly a foundation-building year for Burke Properties, Inc. Fueled by a continued strong economy and robust commercial real estate
PAYCHEX, INC. REPORTS SECOND QUARTER RESULTS
 PAYCHEX, INC. REPORTS SECOND QUARTER RESULTS December 19, 2014 SECOND QUARTER FISCAL 2015 HIGHLIGHTS Total service revenue increased 10% to $665.9 million. Payroll service revenue increased 4% to $411.2
INTERIM REPORT TO SHAREHOLDERS JUNE 30, 2002
 Q2.qxd 8/20/2002 4:22 PM Page 1 INTERIM REPORT TO SHAREHOLDERS JUNE 30, 2002 FINANCIAL HIGHLIGHTS Three months ended June 30 Six months ended June 30 (Millions, except per share amounts) 2002 2001 2002
CORNING INCORPORATED AND SUBSIDIARY COMPANIES CONSOLIDATED STATEMENTS OF INCOME (Unaudited; in millions, except per share amounts)
") CONSOLIDATED STATEMENTS OF INCOME (Unaudited; in millions, except per share amounts) Three months ended Nine months ended 2013 2012 2013 2012 sales $ 2,067 $ 2,038 $ 5,863 $ 5,866 Cost of sales 1,166 1,149
CONSOLIDATED STATEMENTS OF INCOME (Unaudited; in millions, except per share amounts) Three months ended Nine months ended 2013 2012 2013 2012 sales $ 2,067 $ 2,038 $ 5,863 $ 5,866 Cost of sales 1,166 1,149
summarize of Inter- Period Stock & Stocks - Part II
 This ( MD&A ) update is current as of September 7, 2010. This report should be read in conjunction with Hart Stores Inc. ( the Company ) unaudited interim consolidated financial statements for the six