110a. Algorithm Animation Using 3D Interactive Graphics
|
|
|
- Ethelbert Wiggins
- 8 years ago
- Views:
Transcription
1 110a Algorithm Animation Using 3D Interactive Graphics Marc H. Brown and Marc A. Najork September 15, 1993 d i g i t a l Systems Research Center 130 Lytton Avenue Palo Alto, California 94301

2 Systems Research Center The charter of SRC is to advance both the state of knowledge and the state of the art in computer systems. From our establishment in 1984, we have performed basic and applied research to support Digital s business objectives. Our current work includes exploring distributed personal computing on multiple platforms, networking, programming technology, system modelling and management techniques, and selected applications. Our strategy is to test the technical and practical value of our ideas by building hardware and software prototypes and using them as daily tools. Interesting systems are too complex to be evaluated solely in the abstract; extended use allows us to investigate their properties in depth. This experience is useful in the short term in refining our designs, and invaluable in the long term in advancing our knowledge. Most of the major advances in information systems have come through this strategy, including personal computing, distributed systems, and the Internet. We also perform complementary work of a more mathematical flavor. Some of it is in established fields of theoretical computer science, such as the analysis of algorithms, computational geometry, and logics of programming. Other work explores new ground motivated by problems that arise in our systems research. We have a strong commitment to communicating our results; exposing and testing our ideas in the research and development communities leads to improved understanding. Our research report series supplements publication in professional journals and conferences. We seek users for our prototype systems among those with whom we have common interests, and we encourage collaboration with university researchers. Robert W. Taylor, Director

3 Algorithm Animation Using 3D Interactive Graphics Marc H. Brown and Marc A. Najork September 15, 1993

4 Publication History This report will appear in the Proceedings of the ACM Sixth Annual Symposium on User Interface Software and Technology, November, cdigital Equipment Corporation 1993 This work may not be copied or reproduced in whole or in part for any commercial purpose. Permission to copy in whole or in part without payment of fee is granted for nonprofit educational and research purposes provided that all such whole or partial copies include the following: a notice that such copying is by permission of the Systems Research Center of Digital Equipment Corporation in Palo Alto, California; an acknowledgment of the authors and individual contributors to the work; and all applicable portions of the copyright notice. Copying, reproducing, or republishing for any other purpose shall require a license with payment of fee to the Systems Research Center. All rights reserved.

5 Abstract This report describes a variety of 3D interactive graphics techniques for visualizing programs. The third dimension provides an extra degree of freedom for conveying information, much as color adds to black-and-white images, animation adds to static images, and sound adds to silent animations. The examples in this report illustrate three fundamental uses of 3D: for providing additional information about objects that are intrinsically two-dimensional, for uniting multiple views, and for capturing a history of execution. The application of dynamic three-dimensional graphics to program visualization is largely unexplored. A videotape of these animations is available.

6

7 Overview Algorithm animation is concerned with illustrating the behavior of a program by visualizing the fundamental operations of the program as it runs. Such displays have proven to be quite useful both for education and for research in the design and analysis of algorithms. The first general-purpose algorithm animation systems in the early 1980 s used monochrome displays. Systems such as BALSA [3] were constrained by a lack of computational power for real-time two-dimensional graphics. As computational power has increased, so has the sophistication of the graphics techniques used for animating algorithms. In the mid-1980 s, Animus [6] showed the utility of smooth transformations of 2D images, especially for looking at small examples. TANGO [11] in the late 1980 s provided an elegant framework for specifying 2D animations. Color was an integral part of Zeus [1]. The Zeus system also pioneered algorithm auralization using non-speech sound to convey the workings of algorithms [2]. Not surprisingly, each new advance in technology has enabled an extra level of expressiveness to be added to the visualizations. This report describes our use of 3D interactive graphics for algorithm animation. Three-dimensional interactive graphics provides another level of expressiveness to the animations, akin to the way that smooth transitions, color, and sound have increased the level of expressiveness in the past. We are not proposing to use 3D for showing objects that are intrinsically threedimensional, such as the convex hull of points in 3-space. We are also not advocating the use of 3D for enhancing the beauty of a picture that is easily shown in 2D. Rather, we are using 3D to increase the quality and quantity of information conveyed in a graphical display. Specifically, we have explored three distinct uses of 3D: Expressing fundamental information about structures that are inherently two-dimensional. Consider how one might display the values of an N-by-M, two-dimensional matrix of positive numbers. An obvious 3D display is to draw sticks at each cell of an N-by-M grid, where the height of each stick is proportional to the value of the corresponding element. Of course there are other techniques for displaying the matrix without using 3D graphics,such as displaying a number in each cell or modifying the color, shape, or size of each cell according to the value of the corresponding element of the matrix. However, showing sticks of varying heights seems to be an extremely effective technique, perhaps because it allows direct visual comparison of the elements. 1

8 Uniting multiple views of an object. Finding a single view of an object that reveals all of its features can be difficult, if not impossible. Therefore, presenting multiple views of that object is a helpful visualization technique. However, it can be difficult for the user to understand the relationship between the multiple views. A carefully crafted 3D view can incorporate multiple 2D views into a single image, thereby helping the user to see how the views are related. Capturing a history of a two-dimensional view. Often, a visualization of a program s entire execution history can be just as helpful for understanding a program s behavior as an animation of the current state of the program. When running programs on small amounts of data, a history often gives the user a context of how the algorithm has progressed each time the state has changed. When running programs on large amounts of data, a history often exposes patterns that are not otherwise observable. In any event, identifying and quantifying the advantages and drawbacks of visualization techniques is beyond the scope of this report. This report presents six example animations that exemplify our three distinct uses of 3D interactive graphics. The first two examples, Shortest Path and Closest Pair, use 3D for showing additional information on a structure that is inherently two-dimensional. The next three examples, Heapsort, k-d Trees, and Balanced Trees, use 3D for uniting multiple views. The final example, Elementary Sorting, uses 3D for augmenting a view with a history of how it has changed over time. The techniques used in the Closest Pair and Elementary Sorting examples are particularly noteworthy because they can be applied to many arbitrary 2D views. We shall return to this point when describing those two examples. The images in this report are screen dumps of views we developed using the Zeus algorithm animation system [1]. In the Zeus framework, strategically important points of an algorithm are annotated with procedure calls that generate interesting events. These events are reported to the Zeus event manager, which in turn forwards them to all interested views. Each view consists of two windows that are installed on the user s desktop. One window displays the actual 3D image and the other window contains a control panel (see the Balanced Trees example). The control panel allows the user to change generic rendering parameters (e.g., lighting), as well as view-specific parameters (e.g., in the case of Balanced Trees, the distance between the two trees). The rendered scene can be moved, rotated, and scaled through mouse controls. In addition, one can use the mouse to specify a momentum, which will cause the scene to rotate continuously. 2

9 It is important for readers to realize that the figures in this report cannot do justice to the animations: Not only is the reader unable to manipulate the 3D scenes, but the scenes themselves are not static! They are constantly changing as the algorithm runs. (The accompanying videotape is helpful, but a viewer of a videotape cannot manipulate the 3D scene, change the speed of the animation, vary the input data, and so on.) 3

10 Example 1: Shortest Path Single-source shortest-path algorithms are a family of algorithms which, given a directed graph with weighted edges, find the shortest path from a designated vertex, called the source, to all other vertices. The length of a path is defined to be the sum of the weights of the edges along the path. All single-source shortest-path algorithms have certain common features: First, they assign a cost to each vertex, indicating the length of the shortest path found so far from the source to this vertex. Initially, the cost will be infinite. Then they repeatedly choose an edge e from vertex u to vertex v, test if it can lower the cost associated with v, that is, if COST(v) > COST(u) + WEIGHT(e), and if so, indeed lower v s cost. Algorithms differ in their choice of which edge to examine next. A 3D view of one such algorithm is shown in Fig. 1. The graph is drawn in the xy plane, with a green column above the node in the z dimension. The column represents the cost of each node. An edge from u to v with weight w leaves the column above u at height 0, and goes into thecolumn above v at height w. Figs.1a and 1b show the initial state of the algorithm, from above (Fig. 1a) and from an oblique viewing perspective (Fig. 1b). Edges are drawn in gray; a shadow of the edges is projected into the xy plane and drawn in black, along with the vertices. Whenever an edge e from u to v is examined, a highlighted, red copy of it is lifted to the top of u s green column, hence its tip will hover over v at height proportional to COST(u) + WEIGHT(e). If v s column is taller, the edge can indeed lower v s cost, so v s column is shortened, otherwise, the highlightededge disappears. The set of highlighted lifted edges forms the shortest-path tree when the algorithm terminates. Fig. 1c shows the algorithm about halfway complete; Fig. 1d shows the algorithm upon completion, with the initial edges not drawn. This view uses the third dimension to provide state information (namely, cost of vertices and weight of edges) about an algorithm as it operates on a data structure that uses two dimensions for placing objects. The view uses animation effects to show the fundamental operations of the algorithm: lifting an edge represents addition, lowering a highlighted edge indicates the outcome of a comparison, shortening a column shows assignment. 4

11 1a 1b 1c 5 1d

12 Example 2: Closest Pair The closest-pair problem is to find the two points in a collection of n ponts that are closest to each other. An algorithm that does a pairwise comparison of all points takes O(n 2 ) time; however, a recursive, divide-and-conquer algorithm can improve this time bound to O(n log n). The algorithm (for points in the plane) is as follows: First we divide the plane by a line parallel to the y-axis such that each half contains the same number of points. Next, we recursively find the closest pair of points in each half. And finally, we merge the two halves, checking if there is a new pair of points (saddling the dividing line) that are closer to each other than the closest pairs in each half. The crux of the algorithm is that we need to consider only those points in each half that are fairly close to the dividing line (in x) and fairly close to the other endpoint (in y). The 3D view of this algorithm, shown in Fig. 2, draws each half-plane in the xy plane and uses the z axis to show the division process and the induced recursion structure. In each divide step, the half-plane is lifted, split in the middle, and the two halves are moved apart. In the merge step, the halves are moved back together, the eligible points are compared pairwise, and then the merged plane is lowered. The region of interest around the dividing line is highlighted. The globally best pair found so far is also highlighted. In Fig. 2, the user has specified that the half-planes should not be moved apart, and that the half-planes should be displayed almost completely opaque. Fig. 2a shows the initial splitting, Fig. 2b shows the merge of the two half-planes split by the initial left half-plane, and Fig. 2c shows the algorithm deep in recursion as it processing the initial right half-plane. As in the Shortest Path example, the third dimension is used to display additional information (in this case, the recursion structure) about an algorithm that operates on two-dimensional data, and animation effects are used to show operations crucial to the algorithm. The visualization technique here is an example of a general-purpose way to integrate a visualization of a program s calling structure with the contents of its data structures. We believe that it can be applied to other views, although we have not explored this yet. 6

13 2a 2b 7 2c

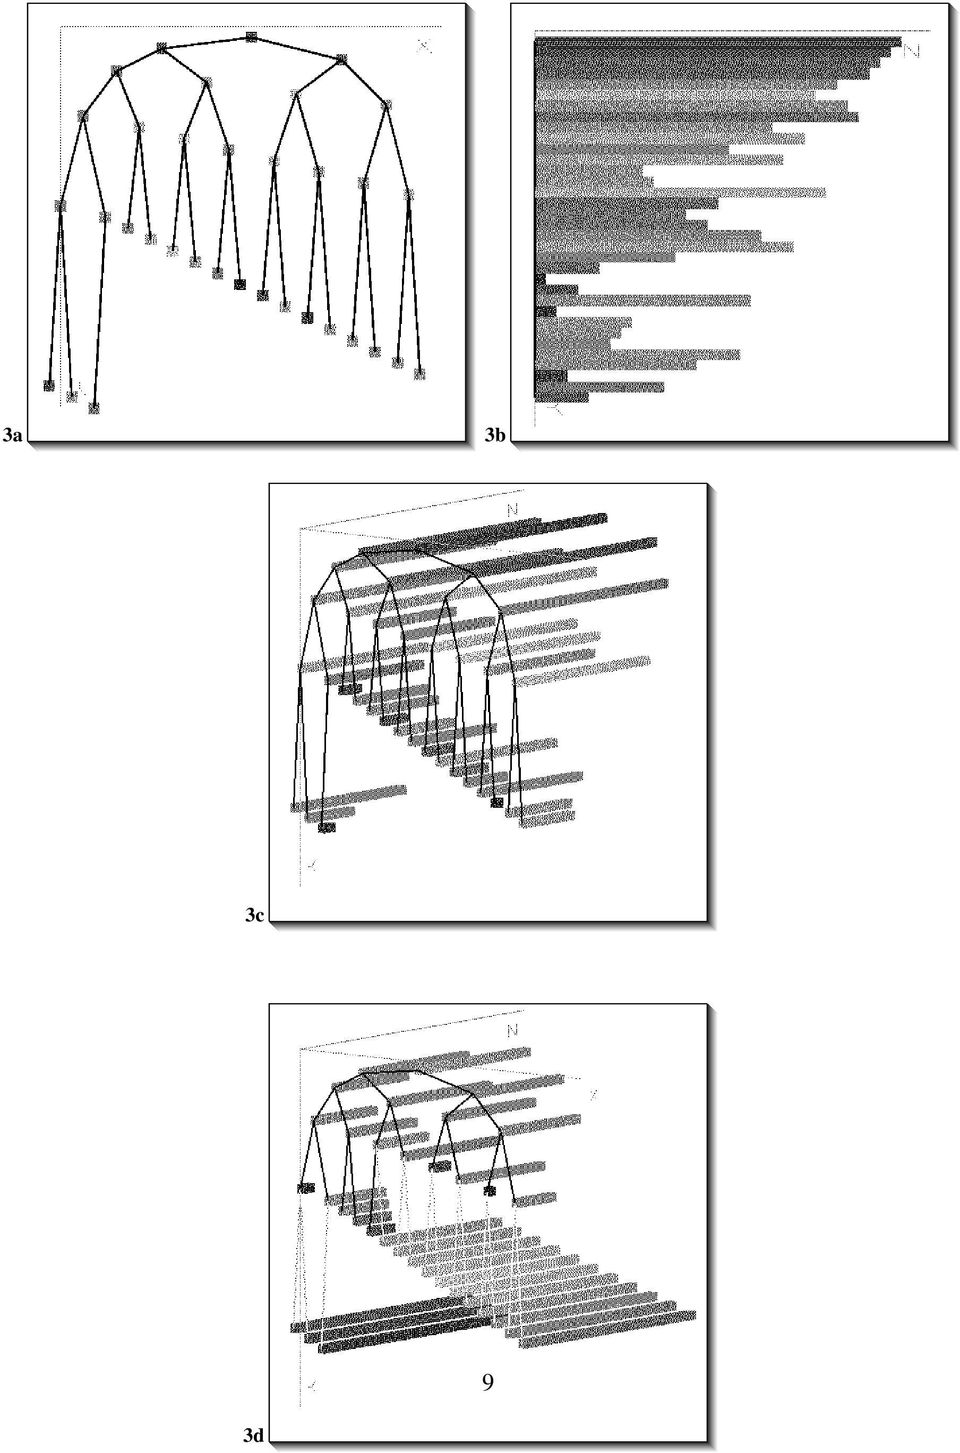
14 Example 3: Heapsort Heapsort works in two phases. First, it arranges the elements being sorted into a heap, a complete binary tree in which the value of each node is larger than the values of each of its children. Second, it repeatedly removes the root (i.e., the largest value among the elements) from the heap, sets it aside, and reestablishes the heap property, doing so until the heap is empty. Heaps can be implemented as arrays by placing the root node at position 1, and for each node at position i, placing its left child at position 2i, and its right child at position 2i + 1. The 3D view in Fig. 3 exposes both of these properties. When viewed from the front as in Fig. 3a, we see the heap configured as a traditional tree (drawn in the xy plane). Each node in the tree is an element of the array being sorted, and has depth (in the z dimension) proportional to its value. Thus, nodes at the top of the tree are longer (or deeper) than those near the leaves. When the tree is viewed from the side as in Fig. 3b, we see a classical sticks view of sorting algorithms (cf. Fig. 6). Fig. 3c shows the same structure from an oblique viewing angle. Notice the relationship between the two representations. Fig. 3d shows the algorithm when it s almost completed. The value of elements are also encoded by colors along the spectrum: large elements are displayed in red and small elements in blue. Color is not crucial in the sticks representation, because the value of a stick is encoded by its length, but it is quite helpful in the tree view. Of course, it is possible to show the two perspectives the tree and the array as separate views, each in its own window, without using 3D graphics. However, the viewer must mentally integrate the different views in order to understand them as a whole. The 3D view alleviates this problem. 8

15 3a 3b 3c 9 3d
16 Example 4: k-d Trees k-d trees are a special kind of search tree, useful for answering range queries about a set of points in k-space. The algorithm for the two-dimensional case (i.e., k = 2) with points in the xy plane is as follows: The algorithm selects any point and draws a line through it parallel to the y axis. This line partitions the plane vertically into two half-planes. Another point is selected and is used to horizontally partition the half-plane in which it lies. In general, a point that falls in a region created by a horizontal partition will divide this region vertically, and vice versa. This division process induces a binary tree structure: The first point becomes the root, and each point falling into the left half-plane is inserted into the left subtree, and each point falling into the right half-plane is inserted into the right subtree. For points that divide regions horizontally, the points in the upper half-plane are inserted into the left subtree whereas points in the lower half-plane are inserted into the right subtree. Thus, nodes at even levels in the tree divide the set of points into left and right half-regions, and nodes at odd levels divide a region into upper and lower half-regions. There are two obvious views of this algorithm: a view of the partitioning of the plane, and a view of the binary tree that is induced. The 3D view shown in Fig. 4 merges and unites these two views. The points in the plane are drawn as circles in the xy plane, and the partitionings caused by them are drawn as transparent walls extended in the z dimension. On top of each wall and above each point is a sphere, representing the corresponding node in the 2-d tree. Therefore, the height (as well as color) of each wall reflects the node s level in the tree. The tree edges are represented as lines connecting related nodes. When viewed from the top and with the tree edges hidden, as in Figs. 4a, 4c, and 4e, we see the traditional view of the partitioning of the plane. Exposing the tree edges would show the 2-d tree in a representation that a graph-theorist would be comfortable with: as a connected, acyclic graph. However, when viewed from the side (and with the walls mostly transluscent), as in Figs. 4c, 4d, and 4f, we see a tree more familiar to the computer scientist: each node is below its parent. Figs. 4a and 4b show the state of the algorithm after it has processed the first two points. Figs. 4c and 4d show the state after the algorithm has processed the third and fourth points, and Figs. 4e and 4f, after the algorithm has processed the fifth and sixth points. Finally, Fig. 4g shows the state of the algorithm after all points have been processed, with opaque partitioning walls. Notice how the 3D view merges the traditional plane-partitioning view and the induced 2-d tree view. It is disconcerting to see edges of the tree overlapping. (Moreover, the left and right children are not necessarily drawn to the left and right of their parent!) Fortunately, when the tree is rotated in real-time about the z axis, it appears to have depth. The real-time animation provides the viewer with the visual clues needed to understand the overlaps. 10

17 4a 4c 4e 4b 4d 4f 4g 11

18 Example 5: Balanced Trees A tree is a balanced search tree in which nodes can contain 1, 2, or 3 keys and can have 2, 3, or 4 children. Inserting keys into a node might eventually cause it to overflow, which results in the node being split into multiple nodes. Performing the split operation judiciously will keep the tree balanced. Unfortunately, trees are cumbersome to implement, mainly due to their irregular structure. Therefore, it is common to implement trees as Red-Black trees. These are ordinary binary search trees with an extra bit (the color ) attached to each node. The 3D view shown in Figs. 5a, 5b, and 5c illustrates the mapping between a tree and a Red-Black tree. The two trees are drawn with one in front of the other. More precisely, each tree is drawn in the xy plane, and the trees have different values of z. Each node in the tree is associated with its corresponding nodes in the Red-Black tree by enclosing the nodes in both trees into a horizontal transparent envelope, and thus grouping them together. This view, like the others, is somewhat hard to appreciate fully as a static image. Spinning the scene very slowly helps the viewer to see the mapping. The controls for manipulating this 3D view are as follows: 12
 attached to each node. The 3D view shown in Figs.")
19 5a 5b 5c 13

20 Example 6: Elementary Sorting Perhaps the most famous algorithm animation is the sticks view of sorting algorithms, shown in Fig. 6a. This view, introduced in Baecker s seminal 1981 film Sorting Out Sorting, shows the array of elements as a row of sticks. The height of each stick is proportional to the corresponding element in the array, so when the sort is completed, the sticks are arranged from short to tall, from left to right. This view is superb for understanding the dynamics of many sorting algorithms, especially when the algorithm runs on small amounts of data. However, this view does not provide any history of the execution. We see the current state only. However, if we consider the sticks as being drawn in the xy plane, we can see an execution history by drawing the sticks at increasing values of z as the algorithm progresses. That is, we stack the new row of sticks in front of the old ones. This results in a 3D solid. In order to emphasize the importance of the current row of sticks, we chose to flatten all previous sticks and to encode by color the value of the corresponding array element. In addition, we keep the current row fixed at z = 0, and move the stack of flattened sticks forward at each step. This results in a horizontal plane of paint chips giving a complete history of the algorithm. (Another way to think of the chips view is as the sticks stamping their color onto the chips plane, which is pulled forward as execution progresses.) Fig. 6b shows the same scene as in Fig. 6a, but viewed from above. Fig. 6c shows the same scene again, but viewed from an oblique viewing perspective. Notice how we can see both the current contents of the array and the history of the algorithm s execution in the 3D view. Fig. 6d uses the same view and viewing angle to display Shakersort. In the BALSA system, the chips view was a separate view of sorting algorithms, one among a dozen or so views. The chips view of Shakersort was instrumental in providing the insight that led to Janet Incerpi s Ph.D. thesis on the worst-case analysis of Shellsort (Brown University, 1985). The insight suggested by the picture of Shakersort is the zipper effect: in one left-to-right pass, many elements are moved one position to the left, only to be moved back to their previous position on the subsequent right-to-left pass. This digression is important because the 3D visualization technique of stacking a 2D view along thez axis as the algorithm progresses is general purpose, and can be applied to many 2D views. It is reasonable to imagine that other hidden properties of algorithms will be exposed by examining 3D history of 2D views. 14

21 6a 6b 6c 15 6d
22 Related Work The scientific visualization community routinely uses 3D interactive graphics. Systems like AVS [12] support 3D visualizations of domain-independent data. The Information Visualization project at Xerox PARC [4] has stimulated a flurry of interest in developing 3D views that show classical types of data organization (e.g., a tree) traditionally shown in 2D. Both scientific visualization and information visualization typically concentrate on a given set of numeric or relational data. We are concerned with visualizing the behavior of programs, which typically operate in subtle ways on abstract and complex combinatorial structures. There are a few recent examples of using 3D in program visualization. Lieberman [8] describes a 3D view of the execution of Lisp programs. The view shows the code for an expression in the xy plane on a block with some depth in the z dimension. As the program executes, each subexpression causes a new block to be displayed in front of the caller s block. When an expression is evaluated, its block (the frontmost) is removed. Koike s VOGUE system [7] provides a 3D visualization of class libraries: A conventional class hierarchy tree is drawn in the xy plane. Behind each node (in the z axis) are floating nodes for methods. Finally, Reiss has developed a 3D variation of a program call graph [9], where the z coordinate (and the actual contents) of each node reflects some attribute of the corresponding procedure. In algorithm animation per se, Cox and Roman [5] recently showed a view of a shortest-path algorithm similar to that shown in Fig. 1. Their work was developed independently of ours. Also, in an unpublished videotape, Stasko at Georgia Tech shows a clever 3D animation of Quicksort using Polka [10]. The front view is a traditional dots view (i.e., just the tips of the sticks in Fig. 6); as elements are exchanged, a trail is maintained whose depth is proportional to the number of exchanges that have happened so far. Viewing the scene from the side provides a history. Summary The potential use of 3D graphics for program visualization is significant and mostly unexplored. The examples in this report use 3D graphics for expressing additional information geometrically about a two-dimensionalstructure, integrating two nominally 2D views, and capturing a history of execution. Our use of 3D graphics is not to enhance the beauty of a program visualization; it provides additional, fundamental information. 16
23 Two of the examples stand out as being instances of general-purpose visualization techniques: In the Closest Pair example, we discussed using 3D for combining program control information with arbitrary 2D views of program data structures. In the Elementary Sorting example, we discussed using 3D for capturing a history of an arbitrary 2D view. A great deal of experimentation is needed to better understand the strengths and weaknesses of using 3D interactive graphics for animating algorithms, and to develop a collection of 3D visualization techniques and metaphors to augment those that have been developed for using 2D, color, and sound. 17
24
25 References [1] Marc H. Brown. Zeus: A System for Algorithm Animation and Multi-View Editing IEEE Workshop on Visual Languages (October 1991), 4 9. [2] Marc H. Brown and John Hershberger. Color and Sound in Algorithm Animation.Computer, 25(12):52 63, December [3] Marc H. Brown and Robert Sedgewick. A System for Algorithm Animation. Computer Graphics, 18(3): , July [4] George G. Robertson, Stuart K. Card, and Jock D. Mackinlay. Information Visualization Using 3D Interactive Animation. Communications of the ACM, 36(4):56 71, April [5] Kenneth C. Cox and Gruia-Catalin Roman. Abstraction in Algorithm Animation IEEE Workshop on Visual Languages (September 1992), [6] Robert A. Duisberg. Animated Graphical Interfaces Using Temporal Constraints. ACM CHI 86 Conf. on Human Factors in Computing (April 1986), [7] Hideki Koike. An Application of Three-Dimensional Visualization to Object- Oriented Programming. Advanced Visual Interface 92, Rome, Italy. [8] Henry Lieberman. A Three-Dimensional Representation for Program Execution IEEE Workshop on Visual Languages (October 1989), [9] Steven P. Reiss. A Framework for Abstract 3-D Visualization IEEE Symposium on Visual Languages (August 1993), [10] John T. Stasko and Joseph F. Wehrli. Three-Dimensional Computation Visualization IEEE Symposium on Visual Languages (August 1993), [11] John T. Stasko. TANGO: A Framework and System for Algorithm Animation. Computer, 23(9):27 39, September [12] Craig Upson, et. al. The Application Visualization System: A Computational Environment for Scientific Visualization. IEEE Computer Graphics and Applications, 9(4):30 42, July
Computational Geometry. Lecture 1: Introduction and Convex Hulls
 Lecture 1: Introduction and convex hulls 1 Geometry: points, lines,... Plane (two-dimensional), R 2 Space (three-dimensional), R 3 Space (higher-dimensional), R d A point in the plane, 3-dimensional space,
A Short Introduction to Computer Graphics
 A Short Introduction to Computer Graphics Frédo Durand MIT Laboratory for Computer Science 1 Introduction Chapter I: Basics Although computer graphics is a vast field that encompasses almost any graphical
Arrangements And Duality
 Arrangements And Duality 3.1 Introduction 3 Point configurations are tbe most basic structure we study in computational geometry. But what about configurations of more complicated shapes? For example,
Freehand Sketching. Sections
 3 Freehand Sketching Sections 3.1 Why Freehand Sketches? 3.2 Freehand Sketching Fundamentals 3.3 Basic Freehand Sketching 3.4 Advanced Freehand Sketching Key Terms Objectives Explain why freehand sketching
Graphic Design. Background: The part of an artwork that appears to be farthest from the viewer, or in the distance of the scene.
 Graphic Design Active Layer- When you create multi layers for your images the active layer, or the only one that will be affected by your actions, is the one with a blue background in your layers palette.
Solving Simultaneous Equations and Matrices
 Solving Simultaneous Equations and Matrices The following represents a systematic investigation for the steps used to solve two simultaneous linear equations in two unknowns. The motivation for considering
Solving Geometric Problems with the Rotating Calipers *
 Solving Geometric Problems with the Rotating Calipers * Godfried Toussaint School of Computer Science McGill University Montreal, Quebec, Canada ABSTRACT Shamos [1] recently showed that the diameter of
Understand the Sketcher workbench of CATIA V5.
 Chapter 1 Drawing Sketches in Learning Objectives the Sketcher Workbench-I After completing this chapter you will be able to: Understand the Sketcher workbench of CATIA V5. Start a new file in the Part
Persistent Data Structures
 6.854 Advanced Algorithms Lecture 2: September 9, 2005 Scribes: Sommer Gentry, Eddie Kohler Lecturer: David Karger Persistent Data Structures 2.1 Introduction and motivation So far, we ve seen only ephemeral
Grade 5 Math Content 1
 Grade 5 Math Content 1 Number and Operations: Whole Numbers Multiplication and Division In Grade 5, students consolidate their understanding of the computational strategies they use for multiplication.
28 Closest-Point Problems -------------------------------------------------------------------
 28 Closest-Point Problems ------------------------------------------------------------------- Geometric problems involving points on the plane usually involve implicit or explicit treatment of distances
Bachelor of Games and Virtual Worlds (Programming) Subject and Course Summaries
 Subject and Course Summaries") First Semester Development 1A On completion of this subject students will be able to apply basic programming and problem solving skills in a 3 rd generation object-oriented programming language (such as
First Semester Development 1A On completion of this subject students will be able to apply basic programming and problem solving skills in a 3 rd generation object-oriented programming language (such as
Map-like Wikipedia Visualization. Pang Cheong Iao. Master of Science in Software Engineering
 Map-like Wikipedia Visualization by Pang Cheong Iao Master of Science in Software Engineering 2011 Faculty of Science and Technology University of Macau Map-like Wikipedia Visualization by Pang Cheong
Such As Statements, Kindergarten Grade 8
 Such As Statements, Kindergarten Grade 8 This document contains the such as statements that were included in the review committees final recommendations for revisions to the mathematics Texas Essential
Visualizing Multidimensional Data Through Time Stephen Few July 2005
 Visualizing Multidimensional Data Through Time Stephen Few July 2005 This is the first of three columns that will feature the winners of DM Review's 2005 data visualization competition. I want to extend
TEXT-FILLED STACKED AREA GRAPHS Martin Kraus
 Martin Kraus Text can add a significant amount of detail and value to an information visualization. In particular, it can integrate more of the data that a visualization is based on, and it can also integrate
Visualization methods for patent data
 Visualization methods for patent data Treparel 2013 Dr. Anton Heijs (CTO & Founder) Delft, The Netherlands Introduction Treparel can provide advanced visualizations for patent data. This document describes
Blender Notes. Introduction to Digital Modelling and Animation in Design Blender Tutorial - week 9 The Game Engine
 Blender Notes Introduction to Digital Modelling and Animation in Design Blender Tutorial - week 9 The Game Engine The Blender Game Engine This week we will have an introduction to the Game Engine build
Big Data: Rethinking Text Visualization
 Big Data: Rethinking Text Visualization Dr. Anton Heijs anton.heijs@treparel.com Treparel April 8, 2013 Abstract In this white paper we discuss text visualization approaches and how these are important
For example, estimate the population of the United States as 3 times 10⁸ and the
 CCSS: Mathematics The Number System CCSS: Grade 8 8.NS.A. Know that there are numbers that are not rational, and approximate them by rational numbers. 8.NS.A.1. Understand informally that every number
The Graphical Method: An Example
 The Graphical Method: An Example Consider the following linear program: Maximize 4x 1 +3x 2 Subject to: 2x 1 +3x 2 6 (1) 3x 1 +2x 2 3 (2) 2x 2 5 (3) 2x 1 +x 2 4 (4) x 1, x 2 0, where, for ease of reference,
Data Visualization Techniques
 Data Visualization Techniques From Basics to Big Data with SAS Visual Analytics WHITE PAPER SAS White Paper Table of Contents Introduction.... 1 Generating the Best Visualizations for Your Data... 2 The
Anamorphic Projection Photographic Techniques for setting up 3D Chalk Paintings
 Anamorphic Projection Photographic Techniques for setting up 3D Chalk Paintings By Wayne and Cheryl Renshaw. Although it is centuries old, the art of street painting has been going through a resurgence.
Technical Drawing Specifications Resource A guide to support VCE Visual Communication Design study design 2013-17
 A guide to support VCE Visual Communication Design study design 2013-17 1 Contents INTRODUCTION The Australian Standards (AS) Key knowledge and skills THREE-DIMENSIONAL DRAWING PARALINE DRAWING Isometric
E XPLORING QUADRILATERALS
 E XPLORING QUADRILATERALS E 1 Geometry State Goal 9: Use geometric methods to analyze, categorize and draw conclusions about points, lines, planes and space. Statement of Purpose: The activities in this
Off-line Model Simplification for Interactive Rigid Body Dynamics Simulations Satyandra K. Gupta University of Maryland, College Park
 NSF GRANT # 0727380 NSF PROGRAM NAME: Engineering Design Off-line Model Simplification for Interactive Rigid Body Dynamics Simulations Satyandra K. Gupta University of Maryland, College Park Atul Thakur
Excel -- Creating Charts
 Excel -- Creating Charts The saying goes, A picture is worth a thousand words, and so true. Professional looking charts give visual enhancement to your statistics, fiscal reports or presentation. Excel
International Journal of Software and Web Sciences (IJSWS) www.iasir.net
 www.iasir.net") International Association of Scientific Innovation and Research (IASIR) (An Association Unifying the Sciences, Engineering, and Applied Research) ISSN (Print): 2279-0063 ISSN (Online): 2279-0071 International
International Association of Scientific Innovation and Research (IASIR) (An Association Unifying the Sciences, Engineering, and Applied Research) ISSN (Print): 2279-0063 ISSN (Online): 2279-0071 International
Data Warehousing und Data Mining
 Data Warehousing und Data Mining Multidimensionale Indexstrukturen Ulf Leser Wissensmanagement in der Bioinformatik Content of this Lecture Multidimensional Indexing Grid-Files Kd-trees Ulf Leser: Data
TABLE OF CONTENTS. INTRODUCTION... 5 Advance Concrete... 5 Where to find information?... 6 INSTALLATION... 7 STARTING ADVANCE CONCRETE...
 Starting Guide TABLE OF CONTENTS INTRODUCTION... 5 Advance Concrete... 5 Where to find information?... 6 INSTALLATION... 7 STARTING ADVANCE CONCRETE... 7 ADVANCE CONCRETE USER INTERFACE... 7 Other important
SpaceClaim Introduction Training Session. A SpaceClaim Support Document
 SpaceClaim Introduction Training Session A SpaceClaim Support Document In this class we will walk through the basic tools used to create and modify models in SpaceClaim. Introduction We will focus on:
Animating Programs and Students in the Laboratory
 Animating Programs and Students in the Laboratory James F. Korsh Paul S. LaFollette, Jr. Department of Computer and Information Sciences Temple University Philadelphia, PA 19122 Raghvinder Sangwan Department
Triangulation by Ear Clipping
 Triangulation by Ear Clipping David Eberly Geometric Tools, LLC http://www.geometrictools.com/ Copyright c 1998-2016. All Rights Reserved. Created: November 18, 2002 Last Modified: August 16, 2015 Contents
What is Visualization? Information Visualization An Overview. Information Visualization. Definitions
 What is Visualization? Information Visualization An Overview Jonathan I. Maletic, Ph.D. Computer Science Kent State University Visualize/Visualization: To form a mental image or vision of [some
Volumes of Revolution
 Mathematics Volumes of Revolution About this Lesson This lesson provides students with a physical method to visualize -dimensional solids and a specific procedure to sketch a solid of revolution. Students
Picture Maze Generation by Successive Insertion of Path Segment
 1 2 3 Picture Maze Generation by Successive Insertion of Path Segment 4 5 6 7 8 9 10 11 12 13 14 15 16 17 18 19 20 21 22 23 24 25 26 27 28 29 30 31 32. ABSTRACT Tomio Kurokawa 1* 1 Aichi Institute of Technology,
Chapter 4: The Concept of Area
 Chapter 4: The Concept of Area Defining Area The area of a shape or object can be defined in everyday words as the amount of stuff needed to cover the shape. Common uses of the concept of area are finding
Load balancing Static Load Balancing
 Chapter 7 Load Balancing and Termination Detection Load balancing used to distribute computations fairly across processors in order to obtain the highest possible execution speed. Termination detection
Load Balancing and Termination Detection
 Chapter 7 Load Balancing and Termination Detection 1 Load balancing used to distribute computations fairly across processors in order to obtain the highest possible execution speed. Termination detection
Fast Multipole Method for particle interactions: an open source parallel library component
 Fast Multipole Method for particle interactions: an open source parallel library component F. A. Cruz 1,M.G.Knepley 2,andL.A.Barba 1 1 Department of Mathematics, University of Bristol, University Walk,
Sorting revisited. Build the binary search tree: O(n^2) Traverse the binary tree: O(n) Total: O(n^2) + O(n) = O(n^2)
 Traverse the binary tree: O(n) Total: O(n^2) + O(n) = O(n^2)") Sorting revisited How did we use a binary search tree to sort an array of elements? Tree Sort Algorithm Given: An array of elements to sort 1. Build a binary search tree out of the elements 2. Traverse
Sorting revisited How did we use a binary search tree to sort an array of elements? Tree Sort Algorithm Given: An array of elements to sort 1. Build a binary search tree out of the elements 2. Traverse
CATIA Drafting TABLE OF CONTENTS
 TABLE OF CONTENTS Introduction...1 Drafting...2 Drawing Screen...3 Pull-down Menus...4 File...4 Edit...5 View...6 Insert...7 Tools...8 Drafting Workbench...9 Views and Sheets...9 Dimensions and Annotations...10
Principles of Data Visualization for Exploratory Data Analysis. Renee M. P. Teate. SYS 6023 Cognitive Systems Engineering April 28, 2015
 Principles of Data Visualization for Exploratory Data Analysis Renee M. P. Teate SYS 6023 Cognitive Systems Engineering April 28, 2015 Introduction Exploratory Data Analysis (EDA) is the phase of analysis
Choosing a successful structure for your visualization
 IBM Software Business Analytics Visualization Choosing a successful structure for your visualization By Noah Iliinsky, IBM Visualization Expert 2 Choosing a successful structure for your visualization
Introduction to Autodesk Inventor for F1 in Schools
 Introduction to Autodesk Inventor for F1 in Schools F1 in Schools Race Car In this course you will be introduced to Autodesk Inventor, which is the centerpiece of Autodesk s digital prototyping strategy
Optical Illusions Essay Angela Wall EMAT 6690
 Optical Illusions Essay Angela Wall EMAT 6690! Optical illusions are images that are visually perceived differently than how they actually appear in reality. These images can be very entertaining, but
Binary Heaps * * * * * * * / / \ / \ / \ / \ / \ * * * * * * * * * * * / / \ / \ / / \ / \ * * * * * * * * * *
 Binary Heaps A binary heap is another data structure. It implements a priority queue. Priority Queue has the following operations: isempty add (with priority) remove (highest priority) peek (at highest
CS 4204 Computer Graphics
 CS 4204 Computer Graphics 3D views and projection Adapted from notes by Yong Cao 1 Overview of 3D rendering Modeling: *Define object in local coordinates *Place object in world coordinates (modeling transformation)
Fast Sequential Summation Algorithms Using Augmented Data Structures
 Fast Sequential Summation Algorithms Using Augmented Data Structures Vadim Stadnik vadim.stadnik@gmail.com Abstract This paper provides an introduction to the design of augmented data structures that offer
Everyday Mathematics. Grade 4 Grade-Level Goals. 3rd Edition. Content Strand: Number and Numeration. Program Goal Content Thread Grade-Level Goals
 Content Strand: Number and Numeration Understand the Meanings, Uses, and Representations of Numbers Understand Equivalent Names for Numbers Understand Common Numerical Relations Place value and notation
Expanding the CASEsim Framework to Facilitate Load Balancing of Social Network Simulations
 Expanding the CASEsim Framework to Facilitate Load Balancing of Social Network Simulations Amara Keller, Martin Kelly, Aaron Todd 4 June 2010 Abstract This research has two components, both involving the
CSU, Fresno - Institutional Research, Assessment and Planning - Dmitri Rogulkin
 My presentation is about data visualization. How to use visual graphs and charts in order to explore data, discover meaning and report findings. The goal is to show that visual displays can be very effective
Graph Theory Problems and Solutions
 raph Theory Problems and Solutions Tom Davis tomrdavis@earthlink.net http://www.geometer.org/mathcircles November, 005 Problems. Prove that the sum of the degrees of the vertices of any finite graph is
Plotting: Customizing the Graph
 Plotting: Customizing the Graph Data Plots: General Tips Making a Data Plot Active Within a graph layer, only one data plot can be active. A data plot must be set active before you can use the Data Selector
A STATISTICS COURSE FOR ELEMENTARY AND MIDDLE SCHOOL TEACHERS. Gary Kader and Mike Perry Appalachian State University USA
 A STATISTICS COURSE FOR ELEMENTARY AND MIDDLE SCHOOL TEACHERS Gary Kader and Mike Perry Appalachian State University USA This paper will describe a content-pedagogy course designed to prepare elementary
Visualization of 2D Domains
 Visualization of 2D Domains This part of the visualization package is intended to supply a simple graphical interface for 2- dimensional finite element data structures. Furthermore, it is used as the low
Atomic Force Microscope and Magnetic Force Microscope Background Information
 Atomic Force Microscope and Magnetic Force Microscope Background Information Lego Building Instructions There are several places to find the building instructions for building the Lego models of atomic
Clustering & Visualization
 Chapter 5 Clustering & Visualization Clustering in high-dimensional databases is an important problem and there are a number of different clustering paradigms which are applicable to high-dimensional data.
Introduction to CATIA V5
 Introduction to CATIA V5 Release 16 (A Hands-On Tutorial Approach) Kirstie Plantenberg University of Detroit Mercy SDC PUBLICATIONS Schroff Development Corporation www.schroff.com www.schroff-europe.com
3D Interactive Information Visualization: Guidelines from experience and analysis of applications
 3D Interactive Information Visualization: Guidelines from experience and analysis of applications Richard Brath Visible Decisions Inc., 200 Front St. W. #2203, Toronto, Canada, rbrath@vdi.com 1. EXPERT
Math vocabulary can be taught with what Montessorians call the Three Period Lesson.
 Full Transcript of: Montessori Mathematics Materials Presentations Introduction to Montessori Math Demonstrations ( Disclaimer) This program is intended to give the viewers a general understanding of the
Formulas, Functions and Charts
 Formulas, Functions and Charts :: 167 8 Formulas, Functions and Charts 8.1 INTRODUCTION In this leson you can enter formula and functions and perform mathematical calcualtions. You will also be able to
Outline BST Operations Worst case Average case Balancing AVL Red-black B-trees. Binary Search Trees. Lecturer: Georgy Gimel farb
 Binary Search Trees Lecturer: Georgy Gimel farb COMPSCI 220 Algorithms and Data Structures 1 / 27 1 Properties of Binary Search Trees 2 Basic BST operations The worst-case time complexity of BST operations
Analysis of Algorithms, I
 Analysis of Algorithms, I CSOR W4231.002 Eleni Drinea Computer Science Department Columbia University Thursday, February 26, 2015 Outline 1 Recap 2 Representing graphs 3 Breadth-first search (BFS) 4 Applications
Chapter 4 Creating Charts and Graphs
 Calc Guide Chapter 4 OpenOffice.org Copyright This document is Copyright 2006 by its contributors as listed in the section titled Authors. You can distribute it and/or modify it under the terms of either
Visualization Quick Guide
 Visualization Quick Guide A best practice guide to help you find the right visualization for your data WHAT IS DOMO? Domo is a new form of business intelligence (BI) unlike anything before an executive
Persistent Binary Search Trees
 Persistent Binary Search Trees Datastructures, UvA. May 30, 2008 0440949, Andreas van Cranenburgh Abstract A persistent binary tree allows access to all previous versions of the tree. This paper presents
SPECIALIZED VISUALIZATION SYSTEMS FOR DIFFERENTIAL GAMES
 SPECIALIZED VISUALIZATION SYSTEMS FOR DIFFERENTIAL GAMES V.L. Averbukh, S.S. Kumkov, V.S. Patsko, O.A. Pykhteev, D.A.Yurtaev Institute of Mathematics and Mechanics, Ural Branch of Russian Academy of Sciences,
Classroom Tips and Techniques: The Student Precalculus Package - Commands and Tutors. Content of the Precalculus Subpackage
 Classroom Tips and Techniques: The Student Precalculus Package - Commands and Tutors Robert J. Lopez Emeritus Professor of Mathematics and Maple Fellow Maplesoft This article provides a systematic exposition
Factoring Patterns in the Gaussian Plane
 Factoring Patterns in the Gaussian Plane Steve Phelps Introduction This paper describes discoveries made at the Park City Mathematics Institute, 00, as well as some proofs. Before the summer I understood
Hierarchy and Tree Visualization
 Hierarchy and Tree Visualization Definition Hierarchies An ordering of groups in which larger groups encompass sets of smaller groups. Data repository in which cases are related to subcases Hierarchical
Creating Your Own 3D Models
 14 Creating Your Own 3D Models DAZ 3D has an extensive growing library of 3D models, but there are times that you may not find what you want or you may just want to create your own model. In either case
Getting Started in Tinkercad
 Getting Started in Tinkercad By Bonnie Roskes, 3DVinci Tinkercad is a fun, easy to use, web-based 3D design application. You don t need any design experience - Tinkercad can be used by anyone. In fact,
VISUAL ALGEBRA FOR COLLEGE STUDENTS. Laurie J. Burton Western Oregon University
 VISUAL ALGEBRA FOR COLLEGE STUDENTS Laurie J. Burton Western Oregon University VISUAL ALGEBRA FOR COLLEGE STUDENTS TABLE OF CONTENTS Welcome and Introduction 1 Chapter 1: INTEGERS AND INTEGER OPERATIONS
Activity Set 4. Trainer Guide
 Geometry and Measurement of Solid Figures Activity Set 4 Trainer Guide Mid_SGe_04_TG Copyright by the McGraw-Hill Companies McGraw-Hill Professional Development GEOMETRY AND MEASUREMENT OF SOLID FIGURES
Scan-Line Fill. Scan-Line Algorithm. Sort by scan line Fill each span vertex order generated by vertex list
 Scan-Line Fill Can also fill by maintaining a data structure of all intersections of polygons with scan lines Sort by scan line Fill each span vertex order generated by vertex list desired order Scan-Line
The Olympus stereology system. The Computer Assisted Stereological Toolbox
 The Olympus stereology system The Computer Assisted Stereological Toolbox CAST is a Computer Assisted Stereological Toolbox for PCs running Microsoft Windows TM. CAST is an interactive, user-friendly,
Topic Maps Visualization
 Topic Maps Visualization Bénédicte Le Grand, Laboratoire d'informatique de Paris 6 Introduction Topic maps provide a bridge between the domains of knowledge representation and information management. Topics
Parametric modeling in AutoCAD By Neil C. Katz Skidmore, Owings & Merrill LLP October 11, 2008
 Parametric modeling in AutoCAD By Neil C. Katz Skidmore, Owings & Merrill LLP October 11, 2008 A version of this article appeared in AECbytes in 2007. Building information modeling and parametric modeling
MicroStrategy Desktop
 MicroStrategy Desktop Quick Start Guide MicroStrategy Desktop is designed to enable business professionals like you to explore data, simply and without needing direct support from IT. 1 Import data from
Support Materials for Core Content for Assessment. Mathematics
 Support Materials for Core Content for Assessment Version 4.1 Mathematics August 2007 Kentucky Department of Education Introduction to Depth of Knowledge (DOK) - Based on Norman Webb s Model (Karin Hess,
Instructions for Creating a Poster for Arts and Humanities Research Day Using PowerPoint
 Instructions for Creating a Poster for Arts and Humanities Research Day Using PowerPoint While it is, of course, possible to create a Research Day poster using a graphics editing programme such as Adobe
COMP175: Computer Graphics. Lecture 1 Introduction and Display Technologies
 COMP175: Computer Graphics Lecture 1 Introduction and Display Technologies Course mechanics Number: COMP 175-01, Fall 2009 Meetings: TR 1:30-2:45pm Instructor: Sara Su (sarasu@cs.tufts.edu) TA: Matt Menke
GRAFICA - A COMPUTER GRAPHICS TEACHING ASSISTANT. Andreas Savva, George Ioannou, Vasso Stylianou, and George Portides, University of Nicosia Cyprus
 ICICTE 2014 Proceedings 1 GRAFICA - A COMPUTER GRAPHICS TEACHING ASSISTANT Andreas Savva, George Ioannou, Vasso Stylianou, and George Portides, University of Nicosia Cyprus Abstract This paper presents
Information Visualization of Attributed Relational Data
 Information Visualization of Attributed Relational Data Mao Lin Huang Department of Computer Systems Faculty of Information Technology University of Technology, Sydney PO Box 123 Broadway, NSW 2007 Australia
Science and teaching students about
 Teaching The Science Process Skills What Are the Science Process Skills? Science and teaching students about science means more than scientific knowledge. There are three dimensions of science that are
VRSPATIAL: DESIGNING SPATIAL MECHANISMS USING VIRTUAL REALITY
 Proceedings of DETC 02 ASME 2002 Design Technical Conferences and Computers and Information in Conference Montreal, Canada, September 29-October 2, 2002 DETC2002/ MECH-34377 VRSPATIAL: DESIGNING SPATIAL
Virtual CRASH 3.0 Staging a Car Crash
 Virtual CRASH 3.0 Staging a Car Crash Virtual CRASH Virtual CRASH 3.0 Staging a Car Crash Changes are periodically made to the information herein; these changes will be incorporated in new editions of
Everyday Mathematics. Grade 4 Grade-Level Goals CCSS EDITION. Content Strand: Number and Numeration. Program Goal Content Thread Grade-Level Goal
 Content Strand: Number and Numeration Understand the Meanings, Uses, and Representations of Numbers Understand Equivalent Names for Numbers Understand Common Numerical Relations Place value and notation
Voronoi Treemaps in D3
 Voronoi Treemaps in D3 Peter Henry University of Washington phenry@gmail.com Paul Vines University of Washington paul.l.vines@gmail.com ABSTRACT Voronoi treemaps are an alternative to traditional rectangular
Plotting Data with Microsoft Excel
 Plotting Data with Microsoft Excel Here is an example of an attempt to plot parametric data in a scientifically meaningful way, using Microsoft Excel. This example describes an experience using the Office
Binary Space Partitions
 Title: Binary Space Partitions Name: Adrian Dumitrescu 1, Csaba D. Tóth 2,3 Affil./Addr. 1: Computer Science, Univ. of Wisconsin Milwaukee, Milwaukee, WI, USA Affil./Addr. 2: Mathematics, California State
Tracking Project Progress
 L E S S O N 2 Tracking Project Progress Suggested lesson time 45-55 minutes Lesson objectives To begin tracking an active project, you will: a b c Modify the environment for tracking. You will use the
Working With Animation: Introduction to Flash
 Working With Animation: Introduction to Flash With Adobe Flash, you can create artwork and animations that add motion and visual interest to your Web pages. Flash movies can be interactive users can click
11.1. Objectives. Component Form of a Vector. Component Form of a Vector. Component Form of a Vector. Vectors and the Geometry of Space
 11 Vectors and the Geometry of Space 11.1 Vectors in the Plane Copyright Cengage Learning. All rights reserved. Copyright Cengage Learning. All rights reserved. 2 Objectives! Write the component form of
Data Visualization Techniques
 Data Visualization Techniques From Basics to Big Data with SAS Visual Analytics WHITE PAPER SAS White Paper Table of Contents Introduction.... 1 Generating the Best Visualizations for Your Data... 2 The
Home Page. Data Structures. Title Page. Page 1 of 24. Go Back. Full Screen. Close. Quit
 Data Structures Page 1 of 24 A.1. Arrays (Vectors) n-element vector start address + ielementsize 0 +1 +2 +3 +4... +n-1 start address continuous memory block static, if size is known at compile time dynamic,
Chapter 1. Creating Sketches in. the Sketch Mode-I. Evaluation chapter. Logon to www.cadcim.com for more details. Learning Objectives
 Chapter 1 Creating Sketches in Learning Objectives the Sketch Mode-I After completing this chapter you will be able to: Use various tools to create a geometry. Dimension a sketch. Apply constraints to
12-1 Representations of Three-Dimensional Figures
 Connect the dots on the isometric dot paper to represent the edges of the solid. Shade the tops of 12-1 Representations of Three-Dimensional Figures Use isometric dot paper to sketch each prism. 1. triangular
Section 1.1. Introduction to R n
 The Calculus of Functions of Several Variables Section. Introduction to R n Calculus is the study of functional relationships and how related quantities change with each other. In your first exposure to