Application of Precast Decks and Other Elements to Bridge Structures
|
|
|
- Anastasia Williams
- 7 years ago
- Views:
Transcription

1 Final Report Application of Precast Decks and Other Elements to Bridge Structures
2 1. Report No Recipients Accession No. MN/RC Title and Subtitle 5. Report Date Application of Precast Decks and other Elements to Bridge Structures Technical Report Documentation Page September Author(s) 8. Performing Organization Report No. Charles M. Bell II Catherine E. French Carol K. Shield 9. Performing Organization Name and Address 10. Project/Task/Work Unit No. University of Minnesota Department of Civil Engineering 11. Contract (C) or Grant (G) No. 500 Pillsbury Drive, S.E. (c) (wo) 146 Minneapolis, MN Sponsoring Organization Name and Address 13. Type of Report and Period Covered Minnesota Department of Transportation Research Services Section 395 John Ireland Boulevard Mail Stop 330 St. Paul, Minnesota Supplementary Notes Abstract (Limit: 200 words) Final Report 14. Sponsoring Agency Code A number of countries have incorporated precast components in bridge superstructures and substructures. Precast components include deck, abutment, and wall elements. Benefits of using precast elements in bridge construction include the high level of quality control that can be achieved in plant cast production compared to field cast operations and speed of construction afforded by the assembly of precast elements at the site rather than the time consuming on site forming and casting required in cast-in-place construction. Key components in the application of precast concrete to bridge structures are the connection elements. Connection details include the use of posttensioning systems, and various connection details such as weld plates, studs in grout pockets, and shear keys. The Minnesota Department of Transportation (Mn/DOT) constructed a bridge incorporating precast elements to enable rapid construction. The objective of this study was to develop an instrumentation plan to enable investigation of the performance of this bridge. Researchers developed an instrumentation plan based on information provided by the Mn/DOT bridge office regarding the specific bridge details and behaviors to be investigated. The instrumentation plan included the types and locations of the instruments. 17. Document Analysis/Descriptors 18. Availability Statement Rapid construction Pourte Dalle Slab span Precast deck No restrictions. Document available from: National Technical Information Services, Springfield, Virginia Security Class (this report) 20. Security Class (this page) 21. No. of Pages 22. Price Unclassified Unclassified 271
3 Application of Precast Decks and Other Elements to Bridge Structures Final Report Prepared by: Charles Bell III Carol K. Shield Catherine French Department of Civil Engineering University of Minnesota September 2006 Published by: Minnesota Department of Transportation Research Services Section 395 John Ireland Boulevard, MS 330 St. Paul, Minnesota This report represents the results of research conducted by the authors and does not necessarily represent the views or policies of the Minnesota Department of Transportation and/or the Center for Transportation Studies. This report does not contain a standard or specified technique. The authors and the Minnesota Department of Transportation and/or Center for Transportation Studies do not endorse products or manufacturers. Trade or manufacturers names appear herein solely because they are considered essential to this report
4 Acknowledgements The work chronicled within this thesis was largely a team effort. A special thank you is also extended to Matthew Smith for his assistance throughout the project, specifically with the installation of instrumentation and set up of the data acquisition system. The following people are also greatly appreciated for the assistance they provided during the installation of instrumentation: Paul Bergson, Scott Nesvold, Justin Ocel, and Brian Runzel. I would also like to thank the Minnesota Department of Transportation (Mn/DOT) and Lunda Construction for their contributions during this project. Mn/DOT provided all of the funding for this project. In addition, several Mn/DOT engineers and site inspectors provided assistance during the installation of instrumentation and preparation of the final report. The construction crew from Lunda Construction, the general contractor for the construction of Mn/DOT Bridge No , was very accommodating and cooperative during the entire installation of instrumentation process. Their patience and hospitality was crucial for the success of this project and therefore was greatly appreciated.
5 Table of Contents Chapter 1: Introduction` Background of Prefabricated Bridge Construction Advantages of Prefabricated Bridge Construction Scanning Tour Implementation of Technology Purpose of this Study Organization...3 Chapter 2: Literature Review Introduction Precast Panel Systems with Transverse Joints Prefabricated Bridge Systems with Longitudinal Joints Prefabricated Concrete Bridge Superstructure Connection Systems Post-tensioning Systems Shear Key Systems Cast-in-place (CIP) Concrete Topping Continuity for Live Loads over Interior Piers Case Studies Performed on Full-Span Form Panel Bridge Systems Hays, Jr. et al. Study Buckner and Turner Study Peterman and Ramirez Study Additional Full-Span Prefabricated Bridge Systems The Inverted Tee (IT) Shallow Bridge System for Rural Areas Precast Pretensioned Trapezoidal Box Beam for Short Span Bridges Summary of Literature Review...18 Chapter 3: Development and Implementation of the Mn/DOT Inverted-T Precast Slab System Design of the Mn/DOT Inverted-T Precast Slab System Design of the Precast Section Transverse Reinforcement over the Longitudinal Joints Detailing for Continuous Behavior over the Piers Design of Mn/DOT Bridge No Materials Design Calculations Details of the Precast Section used for Mn/DOT Bridge No Details of the Bridge Deck Details of the Precast Substructure 25 Chapter 4: Instrumentation of Mn/DOT Bridge No Objectives of Instrumentation Longitudinal Reflective Cracking of the CIP Concrete Deck above the Precast Longitudinal Joints...26
6 4.2.1 Instrumentation for Longitudinal Reflective Cracking above the Precast Longitudinal Joints Longitudinal Reflective Cracking of the CIP Concrete Deck above the Precast Section Web Corners Instrumentation for Longitudinal Reflective Cracking above the Precast Section Web Corners Continuous Behavior for Live Load over the Piers Instrumentation for Continuous Behavior for Live Load over the Piers Effectiveness of the Transverse Hooks Instrumentation to Determine Effectiveness of Transverse Hooks Installation of Instrumentation...31 Chapter 5: Data Acquisition System Design of the Data Acquisition System Conduit System Long-term Data Collection...33 Chapter 6: Summary and Future Work Summary Benefits of the Mn/DOT Inverted-T Precast Slab System Preliminary Conclusions Future Work...36 References 37 Tables 39 Figures 63 Appendix A: Bridge Plans Appendix B: Design Calculations Appendix C: Instrumentation and Data Acquisition System Components Appendix D: Installation Log Appendix E: Datalogger Programs
7 List of Tables Table 2.1 Cross sections of different precast sections (Kamel and Tadros, 1996)...40 Table 2.2 Dimensions of form panels and CIP concrete for the bridges visited in Florida during the study performed by Hays, Jr. et al. (1980)...40 Table 2.3 Reinforcement details and dimensions of the laboratory specimen used in the study performed by Buckner and Turner (1981)...41 Table 3.1 Compressive concrete strength of concrete used for precast sections in the superstructure of Stage 1 of Mn/DOT Bridge No Table 3.2 Compressive concrete strength of CIP concrete used in Stage 1 of the superstructure for Mn/DOT Bridge No Table 4.1 Coordinates of the VW embedment strain gages installed directly above the precast longitudinal joints...42 Table 4.2 Coordinates of the VW embedment strain gages installed directly above the precast section web corners...43 Table 4.3 Coordinates of the VW spot-weldable strain gages installed on longitudinal reinforcement...44 Table 4.4 Coordinates of the VW spot-weldable strain gages installed on the transverse hooks of the precast sections...45 Table 5.1 Channel assignments for Multiplexer # Table 5.2 Channel assignments for Multiplexer # Table 5.3 Channel assignments for Multiplexer # Table 5.4 Channel assignments for Multiplexer # Table 5.5 Channel assignments for Multiplexer # Table 5.6 Channel assignments for Multiplexer # Table 5.7 Locations of the cables in the conduit relative to the precast longitudinal joints...49 Table 5.8 Instrumentation connected to Cable Table 5.9 Instrumentation connected to Cable Table 5.10 Instrumentation connected to Cable Table 5.11 Instrumentation connected to Cable Table 5.12 Instrumentation connected to Cable Table 5.13 Instrumentation connected to Cable Table 5.14 Instrumentation connected to Cable Table 5.15 Instrumentation connected to Cable Table 5.16 Instrumentation connected to Cable Table 5.17 Instrumentation connected to Cable Table 5.18 Instrumentation connected to Cable Table 5.19 Instrumentation connected to Cable Table 5.20 Instrumentation connected to Cable Table 5.21 Instrumentation connected to Cable Table 5.22 Instrumentation connected to Cable Table 6.1 Superstructure cost comparison of bridges built with the Mn/DOT Inverted-T Precast Slab System to traditional slab-span bridges...62
8 List of Figures Figure 1.1 Partial-depth concrete decks prefabricated on steel or concrete beams...64 Figure 1.2 Cross section of Poutre Dalle System...64 Figure 1.3 Photograph of precast section used in Poutre Dalle System...65 Figure 2.1 Full-Depth Precast Prestressed Bridge Deck System...65 Figure 2.2 Cross section of a partial-depth precast concrete panel system...66 Figure 2.3 Cross section of a box girder bridge system with transverse post-tensioning...66 Figure 2.4 Elevation view of longitudinal post-tensioning in a Full-Depth Precast Prestressed Bridge Deck System...67 Figure 2.5 Typical geometry of a shear key used in a box girder system...67 Figure 2.6 Typical geometry of a shear key used in a Full-Depth Precast Prestressed Panel System...68 Figure 2.7 Interior joint detail of a precast concrete bridge girder made continuous using the Conventional Reinforcement Method...68 Figure 2.8 Elevation view of a bridge made continuous over the pier through the use of longitudinal post-tensioning...69 Figure 2.9 Elevation view of the lab specimen used in the study performed by Hays, Jr. et al...69 Figure 2.10 Cross-sectional view of the standard span of the lab specimen used in the study performed by Hays, Jr. et al...70 Figure 2.11 Cross-sectional view of the alternative span of the lab specimen used in the study performed by Hays, Jr. et al Figure 2.12 Cross section of the panel detail recommended by Hays, Jr. et al Figure 2.13 Cross section of the flat panel laboratory specimen used in study performed by Buckner and Turner...71 Figure 2.14 Cross section of the beveled-edge laboratory specimen used in study performed by Buckner and Turner...72 Figure 2.15 Cross-sectional view of the loading apparatus used in the study performed by Buckner and Turner...72 Figure 2.16 Cross section of the laboratory specimen used in study performed by Peterman and Ramirez...73 Figure 2.17 Cross section and reinforcement details for a tee beam used in the IT System...73 Figure 2.18 Cross section of the IT System...74 Figure 2.19 Cross section of the closed trapezoidal box beam...74 Figure 2.20 Cross section of the open trapezoidal box beam...75 Figure 3.1 Cross-sectional view of interior inverted-t precast section concept...75 Figure 3.2 Cross-sectional view of exterior inverted-t precast section concept...76 Figure 3.3 Photograph of the transverse hooks of the precast sections...76 Figure 3.4 Cross-sectional view of the precast longitudinal joint detail...77 Figure 3.5 Photograph of formwork with indented inner surface...77 Figure 3.6 Cross-sectional view of an interior inverted-t precast section detailing transverse reinforcement within the precast sections...78 Figure 3.7 Plan view of precast section layout showing blocked-out portions of the precast section flanges...78 Figure 3.8 Photograph of the reinforcement cage installed above the precast longitudinal joint...79
9 Figure 3.9 Elevation view of Mn/DOT Bridge No Figure 3.10 Plan view of Mn/DOT Bridge No with construction stages and construction joint highlighted...80 Figure 3.11 Cross-sectional view and reinforcement details for an interior inverted-t precast section used in Mn/DOT Bridge No Figure 3.12 Connection detail at abutment, bridge deck, and approach panel...82 Figure 3.13 Connection detail at pier cap...82 Figure 4.1 Plan view of Mn/DOT Bridge No with instrumented portion highlighted...83 Figure 4.2 Cross-sectional view of precast longitudinal joint...83 Figure 4.4 Photograph of Geokon Model VCE-4200 VW Embedment Strain Gage...84 Figure 4.5 Plan view of instrumentation detail for VW embedment strain gages located directly above precast longitudinal joints...85 Figure 4.6 Photograph of VW embedment strain gage tied to uncoated rebar...85 Figure 4.7 Photograph of VW embedment strain gages installed above precast longitudinal joints...86 Figure 4.8 Plan view of instrumentation detail for VW embedment strain gages located directly above the precast section web corners...87 Figure 4.9 Cross-sectional view of instrumentation detail for VW embedment strain gages at each instrumented joint...88 Figure 4.10 Photograph of VW embedment strain gages installed above precast section web corners and above precast longitudinal joint...88 Figure 4.11 Photograph of Geokon Model VK-4150 VW Spot-weldable Strain Gage...89 Figure 4.12 Elevation view of Mn/DOT Bridge No showing locations of instrumentation along the length of the bridge for continuous behavior over the piers...89 Figure 4.13 Plan view of Stage 1 of the bridge construction of Mn/DOT Bridge No showing locations of instrumentation for continuous behavior over the piers...90 Figure 4.14 Cross-sectional view of instrumentation detail for locations with 3 VW spotweldable strain gages ( in Figure 4.13)...90 Figure 4.15 Cross-sectional view of instrumentation detail for locations with 2 VW spotweldable strain gages ( in Figure 4.13)...91 Figure 4.16 Photograph of VW spot-weldable strain gage welded to longitudinal reinforcement...91 Figure 4.17 Photograph of VW spot-weldable strain gage with waterproofing and steel cover..92 Figure 4.18 Photograph of 3 VW spot-weldable stain gages installed on the longitudinal reinforcement at east end of east span...92 Figure 4.19 Photograph of 2 VW spot-weldable strain gages on longitudinal reinforcement located at the centerline of the pier cap...93 Figure 4.20 Photograph of transverse hooks of adjacent precast sections...93 Figure 4.21 Plan view of instrumentation detail for VW spot-weldable strain gages on transverse hooks...94 Figure 4.22 Photograph of VW spot-weldable strain gages on transverse hooks...94 Figure 4.23 Labeling scheme used for gages installed in Mn/DOT Bridge No Figure 5.1 Schematic of the data acquisition system used to monitor instrumentation installed in Mn/DOT Bridge No Figure 5.2 Plan view of the conduit system...97 Figure 5.3 Plan view of cables within conduit system...97
10 Figure 5.4 Photograph of embedded wiring junction box located above precast longitudinal joint...98 Figure 5.5 Photograph of multiplexer boxes located on the east face of the east pier cap...98 Figure 5.6 Locations of the multiplexers within the boxes on the east face of the east pier cap.99 Figure 5.7 Photograph of temporary data acquisition system cabinet...99 Figure 5.8 Photograph of permanent data acquisition system cabinet...100
11 Executive Summary Prefabricated bridge construction presents many advantages over conventional construction methods. In prefabricated construction, elements are cast off-site and then brought to the site ready to be erected in-place. This eliminates major-time consuming tasks from the project timeline, such as erection and removal of formwork, placement of steel reinforcement and concrete, and curing of the concrete. The result is shorter construction time and a reduction in traffic disruption. Many existing prefabricated bridge systems used in the United States have durability issues, such as longitudinal reflective cracking, which result in significant maintenance or replacement costs. This takes away from the advantages that would otherwise be associated with these types of systems. This has led to numerous research programs for the development of more durable prefabricated bridge systems. In April of 2004, the Federal Highway Administration (FHWA) and the American Association of State Highway and Transportation Officials (AASHTO) initiated a scanning tour to explore the state-of-the-art technologies for rapid construction already being implemented in other industrial countries. During this scanning tour, a team of eleven members visited Japan, the Netherlands, Belgium, Germany, and France to identify international uses of prefabricated bridge elements. The Minnesota Department of Transportation (Mn/DOT) developed a prefabricated superstructure system based on the Poutre Dalle system that was observed in France during the scanning tour. The Poutre Dalle system consisted of inverted-t precast members placed adjacent to one another and then topped with cast-in-place (CIP) concrete. The shape of these sections eliminates the need for formwork for the CIP concrete and provides a working surface for the placement of steel reinforcement and pouring of the CIP concrete. The precast members of the Poutre Dalle system have transverse hooks that extend out of the vertical sides of the webs. Once in place, the hooks from adjacent sections extend over the longitudinal joints that exist between the adjacent precast sections and overlap with the hooks from the adjacent sections. Thus once the CIP concrete has cured these hooks tie the adjacent sections together. The system that Mn/DOT developed, the Mn/DOT Inverted-T Precast Slab System, utilized two main design features of the Poutre Dalle system. These two features include the inverted-t precast section shape and the transverse hooks that extend from the vertical sides of the web of the precast sections. Mn/DOT used these features as the basis of their design; however modifications were made to increase the durability, performance, and constructibility of the design. The largest concern affecting the durability of the system was the potential development of longitudinal reflective cracking above the longitudinal joints between adjacent precast sections. Thus, in addition to the transverse hooks crossing the precast longitudinal joint, a reinforcement cage was added to the CIP concrete directly above the joint. This increased the amount of reinforcement above this joint and therefore increased the load sharing capabilities of the CIP concrete at this location. The intent was to reduce the stresses in the CIP concrete and thus reduce the potential for the development of reflective cracking at these locations. The corners of the flanges and webs of the precast sections were also chamfered to reduce the stress concentrations at those locations and again reduce the potential for the development of reflective cracking.
12 Another issue of concern was the continuity of the superstructure system. The system was designed to be continuous for live load over the interior piers after the CIP concrete had cured, thus modifications were made to ensure that the system would provide adequate continuity. Continuity was achieved through the use of conventional deck reinforcement and concrete between adjacent precast sections above the piers. Additional reinforcement over the piers was added directly above the flanges of the precast sections to provide a positive moment connection in case a positive restraint moment was to develop above the piers over time. The design of the Mn/DOT inverted-t Precast Slab System was tailored to the needs of two projects with different span arrangements with the idea that the precast section would be developed for short span ranges of 20 ft. minimum and 65 ft. maximum. One of the bridges (Mn/DOT Bridge No ) was located in Center City, Minnesota about 40 miles northeast of Minneapolis. Instrumentation was installed in this bridge to monitor the behavior of the bridge over time. The main goal of the instrumentation plan was to investigate for the development of longitudinal reflective cracking of the CIP concrete above the precast longitudinal joints and above the precast section web corners. Several vibrating wire (VW) embedment strain gages oriented in the transverse direction were installed above the precast longitudinal joints and precast section web corners at three different locations within the bridge deck. These gages were used to monitor the development and propagation of cracks as would be evident by reading large local increases in strain. If a crack were to develop these gages could then be used to monitor the behavior of the crack over time. The instrumentation plan also included several vibrating wire (VW) spot-weldable strain gages on the longitudinal reinforcement at different locations within the bridge deck to investigate the continuous behavior of the bridge over the interior piers for live load. At most of these locations, either two or three of these gages were installed so that the curvature of the bridge deck at that location could be determined. The majority of the information provided from these gages was to be obtained during a truck load test to be performed sometime during the twoyear monitoring period of this bridge. The results of this investigation will be used to verify some of the design assumptions and to determine if further modifications need to be made to the design of the Mn/DOT Inverted- T Precast Slab System to improve the performance of the system for future projects.
13 Chapter 1 Introduction 1.1 Background of Prefabricated Bridge Construction Prefabricated bridge construction typically consists of fabricating bridge elements off-site and delivering them to the project location ready to be erected. This can include entire superstructure or substructure systems, or elements of each system. There are many prefabricated superstructure systems that consist of both prefabricated and cast-in-place (CIP) elements. Prefabricated bridge construction has been developed because it presents many advantages over conventional bridge construction including speed of erection and improved quality control due to plant fabrication. However, many current systems have durability issues, such as the development of cracking, which reduce the benefits of this type of system. Thus, new systems are constantly being developed to produce systems with improved durability. 1.2 Advantages of Prefabricated Bridge Construction Prefabricated bridge construction presents many advantages over conventional bridge construction. First, major time-consuming tasks such as the erection and removal of formwork, placement of steel reinforcement and concrete, and concrete curing need not be accomplished in the work zone. The elements can be prefabricated off-site or adjacent to the site, concurrently with the on-site construction, then brought to the site and quickly erected into place. This can significantly compress the construction project timeline and reduce traffic disruption (Ralls et al., 2002). This is especially important in colder climate states, like Minnesota, which must concentrate a large number of projects into the few months available for construction (Hagen et al., 2005). At construction sites, workers are often exposed to dangerous situations such as working close to traffic, near power lines, or over water. Fabricating the elements off-site, in a safe environment reduces the amount of time workers are exposed to these potentially dangerous situations (Ralls et al., 2002). The erection and removal of formwork for placement of steel reinforcement and concrete in conventional bridge construction requires significant access to the underside of the bridge for workers and equipment. This can have a negative impact on the environment adjacent to the bridge. The use of prefabricated elements gives contractors more options and can often reduce the impact bridge construction has on its surroundings (Ralls et al., 2002). The use of prefabricated elements also increases the overall quality of the product. By fabricating the elements off-site, work can be done ahead of time, using as much time as necessary, and often in a much more controlled environment. Plant operations are often standardized therefore ensuring quality control (Ralls et al., 2002). This results in a more durable product resulting in lower life cycle costs. Also, many times the same elements can be used for different projects and this repeatability often results in large economic benefits as well (Ralls et al., 2002). 1.3 Scanning Tour The highway bridges of the United States are being subjected to an ever increasing volume of traffic. Many new bridges need to be built and many existing bridges are in need of replacement. Thus, new systems need to be developed that realize the many advantages 1
14 associated with prefabricated construction. The Federal Highway Administration (FHWA) and the American Association of State Highway and Transportation Officials (AASHTO) initiated a scanning tour in April of 2004 to explore the state-of-the-art technologies for rapid construction already being implemented in other industrial countries (FHWA, 2004). A team of eleven members (three representatives from FHWA, four representatives from state departments of transportation, one representative from county engineers, one university representative, and two representatives from industry) visited Japan, the Netherlands, Belgium, Germany, and France with the overall objectives to identify international uses of prefabricated bridge elements and systems and to identify decision processes, design methodologies, construction techniques, costs, and maintenance and inspection issues associated with use of the technology (FHWA, 2004). The team was interested in all aspects of design, construction, and maintenance of bridge systems composed of multiple elements that are fabricated and assembled off-site (FHWA, 2004). Of the many systemes observed, two of the systems had a similar methodology of handling the joint between the precast components by utilizing a joint with a liberal amount of reinforcement tied from the precast element into the joint area. Those superstructure systems also eliminated the need to place and remove formwork, thus accelerating construction and improving work-zone safety. The first system, which consisted of partial-depth concrete decks prefabricated on steel or concrete beams, was found in Germany and is shown in Figure 1.1. This system involved casting small concrete decks on steel or concrete beams prior to erection of the beams. After the beams are erected, the edges of each deck unit abut the adjacent member and there is no need to place additional formwork for the CIP concrete. This process speeds construction and reduces the potential danger of equipment falling onto the roadway below because a safe working surface is available immediately after beam erection (FHWA, 2004). The second superstructure system, the Poutre Dalle system, was observed in France and is shown conceptually in Figure 1.2. In this system, inverted-t precast sections are placed adjacent to each other and then made composite with CIP concrete placed between the webs of the tees and over the tops of the stems to form a solid member. This system also eliminates the need to place and remove formwork and also provides a safe working surface (FHWA, 2004). 1.4 Implementation of Technology The Minnesota Department of Transportation (Mn/DOT) developed an Inverted-T Precast Slab system based on the French Poutre Dalle system that was observed during the scanning tour. Two main features of the Poutre Dalle system were incorporated into the design of the Mn/DOT Inverted-T Precast Slab system; the section shape and the use of transverse reinforcement protruding out of the vertical sides of the precast section web. Both of these features can be seen in Figure 1.3 which shows a typical precast section used in the Poutre Dalle system in France. It was felt that both of these features could be utilized to produce a durable bridge superstructure system that was easy to construct. The Mn/DOT Inverted-T Precast Slab system was developed by Mn/DOT engineers with input from fabricators, contractors, and faculty from the University of Minnesota. Conversations were held with local precasters to ensure constructibility by local fabricators and contractors with the idea that the inverted-t precast section would be developed for various short spans, ranging from 20 ft. to a maximum of 65 ft. After the design of the system was developed, this system was implemented in two bridge projects. Project No.1 was a bridge built over Center Lake Channel in Center City, Minnesota (Mn/DOT Bridge No ), located about 40 miles 2
15 northeast of Minneapolis, Minnesota. Project No. 2 was a deck replacement for a bridge over the Tamarac River in Beltrami County in Waskish Township in northern Minnesota (Mn/DOT Bridge 04002). 1.5 Purpose of this Study The objective of this study was to monitor the bridge built for Project No. 1 in Center City, MN (Mn/DOT Bridge No ) for a period of two years to evaluate the durability and performance of the new system. The bridge was instrumented to monitor for the potential development of longitudinal reflective cracking in the CIP concrete portion of the bridge and to investigate the continuous behavior of the bridge deck for live load. This report describes the design of the Mn/DOT Inverted-T Precast Slab system and the test bridge, as well as the instrumentation and data collection system used to monitor the bridge. 1.6 Organization Chapter Two of this report is a summary of the literature on existing prefabricated bridge superstructure systems, primarily focused on problems associated with these existing systems. Chapter Three summarizes the design of the Mn/DOT Inverted-T Precast Slab system and the implementation of this system in the test bridge (Mn/DOT Bridge No ) used for this study. Chapters Four and Five present the instrumentation and the data collection system used in the test bridge, respectively. Chapter Six presents a summary and plans for future work. 3
16 Chapter 2 Literature Review 2.1 Introduction Prefabricated concrete bridge superstructure systems have many variations. These systems are typically made of precast concrete elements oriented in either the longitudinal or transverse direction. Elements that are oriented in the transverse direction are typically decks supported by steel or prestressed concrete girders and either span from one girder to the next or the entire width of the bridge. Elements oriented in the longitudinal direction typically cross the entire span from pier cap to pier cap or abutment. The remainder of Section 2.1 presents some typical prefabricated bridge superstructure systems found in the United States. Section 2.2 presents details on connection systems used to create continuity among the different elements of the bridge deck, including the advantages and disadvantages associated with each type of system. Section 2.3 explains the methods used for achieving continuous behavior over the piers and problems associated with achieving continuity. Sections 2.4 and 2.5 present summaries of studies performed on prefabricated bridge systems similar to the Mn/DOT Inverted-T Precast Slab System Precast Panel Systems with Transverse Joints There are two systems commonly found in the U.S. that consist of precast panels oriented in the transverse direction The first system consists of full-depth non-prestressed concrete panels supported by either steel or prestressed concrete girders. Because of the many advantages associated with prestressed concrete, a Full-Depth Precast Prestressed Panel System has recently been developed (Yamane et al., 1998). Figure 2.1 shows a schematic of the Full-Depth Precast Prestressed Panel System. This system does not require any additional wearing course, however in many instances a non-structural bituminous pavement is used to provide a smooth driving surface (Hieber et al., 2004). The other system commonly found in the U.S. that utilizes precast panels oriented in the transverse direction is known as a partial-depth precast panel system. This system consists of relatively thin prestressed panels that span between either steel or prestressed concrete girders and are topped with a CIP concrete topping. These panels are typically only 2.5 to 4 in. thick and span up to 6 ft. between adjacent girders. The tops of these precast panels are roughened to help achieve composite action with the CIP concrete topping. Figure 2.2 shows a cross-sectional view of a typical partial-depth precast panel system. This figure shows this type of system supported on both a steel girder and a prestressed concrete girder Prefabricated Bridge Systems with Longitudinal Joints Prefabricated concrete bridge superstructure systems that consist of full-span precast elements exist in numerous different variations. Some of the precast elements commonly used in these systems include precast panels, box girders, T-beams, and inverted T-beams. Table 2.1 lists details of several examples of precast sections typically used in prefabricated concrete bridge superstructure systems built within the U.S. and other countries. These elements are constructed using prestressed concrete because it allows them to have longer spans along with shallower cross-sectional depths. The prestressing also provides better crack control within each element (Yamane et al., 1998). The precast elements of these full-span systems are usually 4
17 topped with a CIP concrete topping or a non-structural bituminous pavement to produce a smooth driving surface. 2.2 Prefabricated Concrete Bridge Superstructure Connection Systems In prefabricated concrete bridge superstructures the precast sections are connected to one another in order to produce continuity within the bridge deck system and provide load sharing in each direction. The connection is typically achieved with either a longitudinal or transverse post-tensioning system, a shear key system, a CIP concrete topping, or some combination of these components. This section briefly explains each type of connection system along with associated advantages and disadvantages Post-tensioning Systems Post-tensioning is typically added to systems to connect adjacent precast sections to achieve continuity within the deck system. Systems that utilize post-tensioning typically have post-tensioning tendons oriented perpendicular to the prestressing strands that exist within the precast elements. Figure 2.3 shows the cross section of a box-girder bridge system that utilizes transverse post-tensioning. In this system, the transverse post-tensioning allows for adequate load transfer from one element to the other in the transverse direction (El-R y et al., 1996). Figure 2.4 shows the elevation view of a Full-Depth Precast Prestressed Bridge Deck System. The longitudinal post-tensioning in this system allows for adequate load sharing from one element to the other in the longitudinal direction (Yamane et al., 1998). Often times cracking is a concern in full-depth panel systems, however, the two-way stressing created by the combination of prestressing and post-tensioning in this system ensures continued compression of the deck cross section during its service life providing good crack control and producing a very durable deck system (Fallaha et al., 2004). The use of post-tensioning, however, has disadvantages. First, the large amount of posttensioning required in these systems is typically very costly and additional time is required to install post-tensioning in the field which greatly diminishes the economic benefits otherwise associated with prefabricated construction (Badie et al., 1999). The use of post-tensioning also often requires the mobilization of a specialty contractor and increased construction monitoring to assure post-tensioning operations are performed in accordance with their special requirements which further increase the initial construction costs Shear Key Systems Shear key systems serve two important functions. These systems effectively connect adjacent precast sections, providing adequate load transfer, while also serving to waterproof the joint. A shear key system consists of small voids between adjacent precast sections, extending along the entire length of each section. Once the precast sections are in place, the void is filled with rapid-set non-shrink grout (Yamane et al., 1998). Figures 2.5 and 2.6 show examples of different geometries used for typical shear keys found in box girder and full-depth precast panel systems, respectively. The problem with shear key systems is that the failure of shear keys sometime during their service life is a fairly common phenomenon, especially for shear keys located in joints that are adjacent to the normal-driving-lane wheel tracks (Huckelbridge, Jr. et al., 1995). The failure of these shear keys has an effect on both the strength and serviceability of the bridge. It compromises the lateral load distribution of the bridge, which results in individual girders being 5
18 exposed to greater live loads than those for which they were designed (Huckelbridge, Jr. et al., 1995). Failure of the shear keys also results in excessive relative displacements between adjacent girders which typically leads to failure of the deck waterproofing system, resulting in the infiltration of water and waterborne contaminants through the inter-girder joints (Huckelbridge, Jr. et al., 1995). This exposure to deicing chemicals results in corrosion of the conventional reinforcement and, more importantly, of the prestressing strands adjacent to the joint. This can eventually compromise the structural integrity of the entire bridge deck system (Huckelbridge, Jr. et al., 1995) Cast-in-place (CIP) Concrete Topping CIP concrete can be placed on top of precast sections to produce a smooth riding surface. However, the use of a CIP concrete topping also serves other functions. First, the CIP concrete topping serves to connect adjacent girders creating continuity within the deck system and providing a means for transverse load sharing. In addition, this topping can be used compositely with the precast sections to improve the structural performance of the system (Hays, Jr. et al., 1980). However, in order to achieve composite action, the CIP concrete must be effectively tied to the precast sections. An effective connection is typically achieved through shear reinforcement protruding from the precast sections and/or roughened contact surfaces on the precast sections (Hays, Jr. et al., 1980). General drawbacks to the use of a CIP concrete topping include a relatively low speed of construction, the need for strict field quality control, and the possibility of cracking due to the differential shrinkage between the CIP concrete topping and the precast sections (Fallaha et al., 1996). In addition, longitudinal reflective cracking often develops in the CIP concrete topping above the joints formed between adjacent sections (Badie et al., 1999). These cracks develop because sections that are not rigidly connected in an effective manner (i.e., no post-tensioning, ineffective shear keys or shear key failure) relegate load sharing in the transverse direction to occur through the CIP concrete. This can produce tensile stresses in the CIP concrete above the joints which can then lead to the development of longitudinal reflective cracking (Badie et al., 1999). The development of reflective cracking is a major concern because once this cracking develops water and deicing chemicals are able to penetrate through the cracks which can then lead to concrete staining and spalling along with reinforcement corrosion (Badie et al., 1999). This can lead to the need for repair or even replacement which would create more traffic delays and increased costs, taking away from the advantages associated with using prefabricated construction. 2.3 Continuity for Live Loads over Interior Piers Many prefabricated bridge superstructures are designed to behave continuously for live loads because continuity allows the bridge deck to consist of longer spans or fewer lines of girders, either of which result in lower overall costs compared to a simple-span design (McDonagh and Hinkley, 2003). Use of continuity in precast superstructure systems also reduces the number of longitudinal joints where durability is a concern. However, if a bridge is designed to behave continuously but the design does not provide adequate means to achieve the desired continuity, the bridge could fail at much smaller loads than it was designed to handle. In practice, there are two different methods that are commonly used to create continuity in concrete bridge decks. The most common method involves the use of CIP concrete 6
19 diaphragms and conventional reinforcement in the CIP concrete deck. The girder ends are embedded in the diaphragms, therefore under loading, the diaphragms provide compressive resistance and the conventional reinforcement in the deck provides tensile resistance, thus combining to create negative moment resistance at this location (Saleh et al., 1995). Figure 2.7 shows a detail of an interior joint in a precast concrete girder bridge made continuous through the use of conventional deck reinforcement. The girders act as a simple-span under their own weight, the deck weight, and the construction loads, but behave continuously after the CIP concrete cures, under the effects of a relatively small superimposed dead load and live load (Saleh et al., 1995). The other method commonly used in practice to create continuity consists of full-length post-tensioning. In this system, post-tensioning tendons are stressed after the CIP concrete deck and diaphragms have cured. Figure 2.8 shows an elevation view of a typical bridge deck with longitudinal post-tensioning. The post-tensioning provides resistance to the superimposed dead load and the live load (Saleh et al., 1995). This method for achieving continuity provides greater resistance to stresses and allows longer spans for a given girder size than the conventional deck reinforcement continuity method (Saleh et al., 1995). However, as explained in Section there are some drawbacks to the use of post-tensioning systems within the bridge deck. Regardless of the method used to achieve continuity, the amount of continuity within the system is affected by long-term effects such as creep and shrinkage. The concrete of the girder creeps as a result of the prestressing force which over time could cause the girder to camber further upwards (McDonagh and Hinkley, 2003). If there is no positive moment reinforcement over the piers, this movement can cause a gap to open at the bottom of the girder ends. Then, as loads are imposed, the girders act as simple spans until the load is large enough to close the gaps (McDonagh and Hinkley, 2003). However, if there is a positive moment connection between the girders at the piers, the upward creep will cause positive restraint moments to develop in the girders. These positive restraint moments combined with the superimposed moments of the continuous span result in a lower negative moment over the piers and a higher positive moment at the midspans (McDonagh and Hinkley, 2003). Therefore regardless of the positive moment connection at the pier, girder creep effectively reduces the amount of continuity within the system resulting in higher positive moments in the girders at the midspans (McDonagh and Hinkley, 2003). Differential shrinkage between the CIP concrete deck and the girder concrete has the opposite effect on the amount of continuity within the system. By the time the deck concrete is poured, the girders have already had time to undergo some shrinkage. Therefore the shrinkage of the deck concrete exceeds the remaining shrinkage of the girder concrete resulting in a downward deflection of the composite bridge deck system (McDonagh and Hinkley, 2003). This results in the development of a negative restraint moment above the piers. Depending on the positive moment connection, this will either help to close the gaps at the girder ends or offset the positive restraint moments caused by the previously discussed creep effects, therefore effectively increasing the amount of continuity within the system (McDonagh and Hinkley, 2003). The age of the girder at the time continuity is established has a large influence on the effect that creep and shrinkage have on the effective continuity within the system. The amount of creep and shrinkage remaining to develop within the girder decreases as the girder gets older. The less amount of creep remaining results in smaller gaps at the girder ends or smaller positive restraint moments, depending on the positive moment connection at the piers (McDonagh and Hinkley, 2003). The less shrinkage left to develop within the girder results in a larger shrinkage 7
20 differential between the CIP concrete deck and girder concrete which works to counter-act the effect of girder creep and shrinkage, further reducing the gaps at the girder ends or positive restraint moments. Therefore, as the girder gets older prior to the time continuity is established, it leads to smaller gaps at the girder ends or smaller positive restraint moments, which ultimately increases the amount of effective continuity within the deck system (McDonagh and Hinkley, 2003). 2.4 Case Studies Performed on Full-Span Form Panel Bridge Systems The Mn/DOT Inverted-T Precast Slab System closely resembles a system commonly referred to as the Full-Span Form Panel Bridge System. This system consists of precast prestressed concrete form panels oriented in the longitudinal direction that cross the entire span between supporting piers, covered with a CIP concrete topping. The panels in this system are typically flat but sometimes have beveled edges adjacent to the longitudinal joints. Three studies performed on this system over the years are summarized in this section. These summaries include the objectives of the studies, testing procedures, and results and conclusions made as a result of the studies Hays, Jr. et al. Study Hays, Jr. et al. (1980) performed a study on Full-Span Form Panel Bridge systems during the late 1970s to develop details that would reduce the development of reflective cracking that were almost always observed within the CIP concrete topping above the longitudinal joints of existing full-span form panel bridges at the time. They hoped to accomplish this through a research program that consisted of four phases: a field survey on the condition of existing bridges, analytical modeling, laboratory testing, and field testing on an existing bridge. Field Survey The field investigation included visits to a total of nine bridges that had been constructed using the Full-Span Form Panel System. The dimensions of the panels and CIP concrete for each bridge are provided in Table 2.2. Although there were variations in intensity and frequency, each of these bridges exhibited extensive reflective cracking in the CIP concrete topping above the longitudinal joints. Negative moment cracking was also observed above some of the piers. The longitudinal reflective cracking was observed above every longitudinal joint and extended for virtually the full length of the bridge. One bridge, the Sampson River Bridge, was visited prior to being opened to traffic and it already exhibited several major longitudinal cracks. Therefore it appeared that shrinkage had an influence on the development of the longitudinal cracking in those bridges. Note Table 2.2 includes a comment column that notes variations in these general observations. In addition to the nine full-span form panel bridges visited, other bridges constructed using more conventional techniques such as a flat slab bridge with a CIP concrete deck slab or girders with either a CIP concrete deck or composite deck panels oriented in the transverse direction were visited. All of these bridges also exhibited cracking. The cracking in these bridges appeared to be less extensive and their pattern appeared to be much more random, whereas in the case of the full-span form panel bridges the excessive cracking always occurred directly above the longitudinal joints formed by the adjacent panels. 8
21 Finite Element Analyses Two types of analytical modeling were performed. Linear elastic finite element models were used to approximate stress and displacement distributions from working loads and concrete shrinkage strains. In addition, nonlinear discrete element models were used to investigate structural behavior over a range of load levels up to ultimate strength. Two plane stress finite element models were used to analyze stress distributions due to shrinkage throughout typical transverse bridge deck cross sections. The first model consisted of one form panel and the corresponding CIP concrete topping and the second model consisted of five form panels and the corresponding CIP concrete topping. A shrinkage strain was induced by specifying a coefficient of thermal expansion of in./in./ F for the finite elements of the CIP concrete topping along with a uniform decrease in temperature of 40 F. Both models were given constant values of 4000 ksi for the elastic modulus and 0.15 for the Poisson s Ratio and it was assumed that a no-slip condition existed between the CIP concrete topping and the form panel. The finite element solutions obtained using these two models revealed that the top fiber stress increased towards the center of each form panel, however the maximum tensile stress occurred at the top fiber directly above the longitudinal joints where there was an abrupt increase in tension. This maximum top fiber stress exceeded the modulus of rupture. Because these models supported the observations of cracking, even within bridges that had not yet been open to traffic, it became evident that shrinkage must be considered as a major source of the stresses which cause longitudinal cracking over the longitudinal joints. Three finite element models of the three full-span form panel laboratory specimen were used to analyze the effects of concentrated working loads. The longitudinal joint between form panels was represented in the finite element model by a decreased thickness of the specimen over an exaggerated width at the location of the longitudinal joint. The thickness of the specimen in the finite element model at this location was equal to the thickness of the CIP concrete topping. The joint width was exaggerated to approximately the size of the bridge deck thickness because preliminary finite element solutions suggested that this would provide the most accurate results from the finite element method. Laboratory Testing combined with Finite Element Analyses As mentioned previously, three separate specimens were constructed and tested for the laboratory phase of this project. Each specimen had two spans with two precast prestressed panels in each span for a total of four panels per specimen. An elevation view of the laboratory specimen is shown in Figure 2.9. The two cross sections considered in the test are shown in Figures 2.10 and Specimen #1 used the standard cross section of constant thickness precast panels for both spans. Specimens #2 and #3 used the standard cross section for one span and the alternative cross section for the other span. A minimum 2.25 CIP concrete topping was added on top of the precast sections to provide a constant total thickness for the two spans of each specimen. A cold joint was constructed over the longitudinal joint of Specimen #3 to represent a worst-case condition. It was felt that this would provide a potential cracking plane. The joint was artificially roughened to increase the shear friction force transmitted through the joint. Once the concrete of the CIP concrete deck was poured, an attempt was made to measure creep and shrinkage deflections during the curing time. However, no appreciable deflections occurred due to the short spans and relatively stable curing conditions. Also, there were no signs 9
22 of shrinkage cracking in any of the specimens. The deflection of each specimen was measured from the top of the CIP concrete topping on three lines along the length of the specimens. Loading was applied nominally symmetric about the center support, 6 ft. from the support centerline. Hydraulic jacks were used to apply concentrated forces over the center of one of the precast panels in each span. The jacks were connected in parallel to provide an equal load in each span. For the first two load increments near the design load either no cracking or minor hairline cracking was observed over the supports due to negative moment. Prior to failure, extensive negative moment cracking was observed over the full width of the specimen. Positive moment cracks were observed under the loaded panel and in some cases under the unloaded panel. Even after extensive cracking, the specimen had continued load capacity and exhibited good ductility. Failure occurred via a punching shear failure. No longitudinal cracking was observed except in Specimen #3, which was built with a cold joint over the longitudinal joint between form panels. No problems were found with the bond between the CIP concrete topping and the precast panels. The data from the laboratory tests were used to obtain the chord displacement for each specimen. These chord displacements were compared to finite element solutions obtained using plate bending models of the three full-span form panel laboratory specimens and one plate bending model that did not include a longitudinal joint. This comparison showed that there was good correlation between the experimental data and the finite element solutions for the models of the three full-span form panel laboratory specimens. The comparison of the experimental data with the finite element solution for the model that did not include a longitudinal joint showed that the presence of a longitudinal joint greatly decreases the overall stiffness of the section due to the loss of two-way action. Since there was good correlation, the finite element models of the lab specimens were used to explore moment distributions. The results of these analyses showed that the presence of the longitudinal joint increased the positive and negative moment in each panel, again due to the loss of two-way action, and greatly affected the magnitude and distribution of the transverse moment. The transverse moment went from positive on the panel being loaded to negative on the unloaded panel. In addition, the presence of the longitudinal joint largely increased the torsional moment within the unloaded panel in both the positive and negative moment regions of the laboratory specimen. The load-displacement response obtained from the experimental results was compared to the finite element solution obtained by performing a non-linear elastic analysis with a model that utilized discrete elements. This comparison showed that the non-linear analysis predicted much less ductile behavior and generally predicted failure at a smaller loading. However, the predicted failure loads from the analysis were still much higher than the design loads. The researchers concluded from these analyses that in spite of the large torsional moments, the laboratory specimens were able to transfer a sufficient amount of load across the longitudinal joint to develop more than the limit design strength based on the entire width of the specimen cross section at both the positive and negative moment sections. They felt that the major source of conservatism in the limit design values was in the approximate equation for the ultimate positive moment of the prestressed section. Field Testing One of the bridges visited during the field survey, the Lloyd Creek Bridge, was used for the field testing portion of this project. This bridge contained eight spans and each span had a length of 23 ft. The precast panels had a thickness of 7 in. with a CIP concrete topping thickness 10
23 of 5.5 in. The loading was applied by jacking against the bottom of a large tank trailer that had its wheels positioned over the piers. The load was applied at the midspan of Span 8 at three different transverse locations of one of the interior panels. These locations included the center of the panel and 1 ft. from each edge. The load was applied in 8 kip increments until a maximum load of 32 kips was applied which was approximately 1.5 times the design wheel load. The load-deflection results showed that the load was indeed transferred across the longitudinal joints. Differential deflections across a longitudinal joint were in no case more than 6% of the total joint deflection under the applied load. These deflections were compared to the finite element solution obtained using a plate bending finite element model of spans 7 and 8 of the bridge. It was found these deflections showed good correlation to the finite element solution. Therefore this model was used to estimate moment distributions across the bridge. The maximum longitudinal moments from the finite element solutions compared well with computations based on the effective width formula from AASHTO (2004). Examination of the transverse moment distribution using the finite element solutions revealed that the stresses at the joint were high and indicated tension on the interface between the panels and the CIP concrete topping. Therefore the researchers concluded that steel reinforcement was needed in both the top and bottom of the CIP concrete topping. Conclusions After finishing the field survey, analytical modeling, and laboratory and field tests, the researchers observed that loss of bond between the CIP concrete topping and the precast panels did not occur. They attributed this to the roughness of the surface, however, they recommended that a minimum amount of shear reinforcement be used between the precast and CIP concrete to provide a factor of safety. The researchers concluded, based on field observations and finite element testing, that stresses sufficiently high to cause shrinkage cracking in the CIP concrete can be expected. Based on laboratory and field tests, the researchers recommended a minimum amount of transverse steel reinforcement of #4 bars at 12 in. spacing and a minimum CIP concrete topping thickness of 4.5 in. They felt that this detail would provide adequate load transfer between adjacent panels and help to alleviate some of the shrinkage cracking. In addition, they felt that the panels with the alternative section design would give improved performance with regards to longitudinal cracking and load transfer. The recommended detail for this alternative section is shown in Figure The researchers also felt that an improved detail over the piers and end abutments with more positive transfer of shear from the panels to the supports would decrease deformations and cracking in these areas and increase the stiffness of the bridge. This could be accomplished by providing some direct bearing of the panels on the CIP concrete over the piers. They also recommended that positive moment reinforcement over the piers be provided Buckner and Turner Study Buckner and Turner (1981) performed a study shortly after the study performed by Hays, Jr. et al. (1980) to investigate the effect of repetitive loading on the serviceability and strength of Full-Span Form Panel Bridge Systems. This study consisted of an experimental program in which six single-span simply-supported bridge decks were loaded repetitively with 2,000,000 cycles of design load followed by a test to failure. The performance was evaluated primarily based on flexural rigidity, differential deflection between panels, and the strength and ductility of 11
24 the composite system. Also considered in evaluating the specimens were visible cracks in the concrete, prestressing strand slip, and strains in the transverse steel. The objectives of this study were to develop recommendations for minimum CIP concrete topping thickness, a minimum quantity of transverse reinforcement, and a preferred type of joint (flat or beveled) between panels. The laboratory specimens used in this experimental program had a total thickness of 13 in., overall width of 125 in., and a span length of 20 ft. Each specimen was constructed of three precast panels, with each having a width of 3 ft.-5.5 in. The thicknesses of the precast panels and CIP concrete topping were varied among different laboratory specimen while maintaining a constant overall thickness of 13 in. Three sets of specimens were cast with panel thicknesses of 5.5, 8, and 10 in. for each set. One specimen of each set with a particular panel thickness was constructed using flat precast panels and the other specimen was constructed using panels with beveled edges as shown in Figures 2.13 and 2.14, respectively. The panel thickness of 5.5 in. was chosen as the lower bound for an unshored panel form on a 20 ft. simple span, and 10 in. was chosen as the upper bound because it would minimize the CIP concrete topping thickness to 3 in. which was adequate to provide a minimum concrete cover of 2 in. It was felt that the satisfactory behavior of the lower and upper bound thicknesses would indicate satisfactory behavior for similarly designed specimens of intermediate thickness. The 8 in. panel thickness was chosen for the third set of specimens to study the effect of reflective cracking in the CIP concrete topping on the behavior of composite decks. This was done by inducing a longitudinal crack above one of the longitudinal joints and monitoring the behavior of the crack under loading. One of the longitudinal joints between panels in each specimen had a ½ in. gap that was filled with fiberboard to minimize shear transfer by friction and to allow more freedom for transverse shrinkage. The other longitudinal joint in each specimen had no gap between adjacent panels, which was the usual construction practice. The transverse reinforcement for the specimens varied for each half of the specimen. The transverse reinforcement used in each specimen is summarized in Table 2.3. The test specimens were designed assuming complete composite action between the precast panels and the CIP concrete topping. The design was based on normal weight concrete having specified compressive strengths of 5000 psi for the precast concrete and 4200 psi for the CIP concrete. During construction of the test specimen, four of the specimens were cured under plastic for seven days and then exposed to air. None of these specimens developed visible shrinkage cracks on the top surface. The other two specimens, the specimens with 8 in. thick precast panels, were cured under plastic for only 48 hours and then exposed to air. This shorter curing time was intended to simulate the relatively poor curing conditions likely to occur in field bridges. As mentioned previously, a longitudinal crack was induced above the longitudinal joint that had a ½-in. fiberboard in both of the specimens with 8 in. thick precast panels to measure the behavior of the crack under loading. Six locations along the crack at approximately 3 ft. intervals were selected to monitor for crack width growth. The crack width was measured using a direct-reading measuring microscope graduated to 0.01 mm. A single concentrated load was applied at the midspan because the primary consideration in the study was the shear transfer across the joint between panels. The load was spread into two wheel loads and applied to the slab through 1 in. thick neoprene bearing pads which were sized and positioned to simulate tire prints. By applying the load through the spreader beam, 12
25 approximately 1/3 of a wheel load was transferred across each longitudinal joint into the middle panel. According to the researchers, in a full-width bridge, the maximum shear transfer would occur with a wheel adjacent to a longitudinal joint, with the resultant load approximately 1 ft. from the joint. Thus, the use of a spreader beam to apply loads adjacent to the longitudinal joints yielded a reasonable approximation of the maximum shear transfer which would occur in a bridge. A cross-sectional view of the loading apparatus used in this study is provided in Figure The vertical deflections were measured using linear variable differential transformers (LVDTs) installed at transverse sections 2 ft. from the span centerline. Strain gages were mounted on two transverse reinforcing bars in the CIP concrete topping of each laboratory specimen. The instrumented bars were located in the proximity directly above the location of the LVDTs. Strand slip was measured using a caliper with a dial gage. Testing started after the concrete of the CIP concrete topping had reached an age of 32 days. After 2,000,000 cycles of repetitive loading was complete the specimen was brought to failure. The load was applied in 10 kip increments and then reduced to 5 kip increments as the load neared ultimate. During this loading, the midspan deflection was measured using a dumpy level. Elevations were measured at midspan and at the supports so that rigid body movement caused by compression of the supports could be eliminated. All six specimens exhibited satisfactory structural performance. Overall, there was no evidence of fatigue in either the CIP concrete or reinforcement, or deterioration of composite action, shear transfer strength or bond during the cyclic loading. The computed flexural rigidities of the composite specimens were from 2.06 to 3.80 times larger than for the CIP concrete topping and precast panels acting non-compositely. The deflection was essentially the same after 2,000,000 cycles of loading as it was at the beginning for each specimen. The researchers felt that this was an indication that there was no significant loss of composite action. Differential deflection was used as a measure of shear transfer across the longitudinal joint. Initially there was very little differential deflection observed between adjacent panels for all specimens and there were no significant increases after loading therefore indicating no deterioration of shear transfer. Failure occurred in most specimens in the form of concrete crushing at midspan. These specimens showed adequate ductility and failed at loads that exceeded the ultimate design load. One of the specimens with a 3 in. CIP concrete topping failed due to sudden shear transfer failure. Inspection revealed that a vertical crack had formed over the longitudinal joint. However, the failure load for this specimen was 5.25 times the design load, thus an uncracked 3 in. CIP concrete topping would have adequate shear transfer strength. Cracking, after the 2,000,000 cycles of the design load, other than the induced cracking, was only observed in the two specimens that were covered with plastic for only 48 hours. This transverse cracking located near the midspan was believed to be caused by shrinkage of the CIP concrete attributed to the relatively poor curing conditions of the two specimens. These cracks caused an increase in the measured service load deflection of approximately 25% compared to the uncracked specimens, but did not appear to affect the behavior near ultimate. The induced cracks in these specimens were measured periodically during the curing period and during the loading cycles. The crack widths increased about in. during the curing period however there were no significant increases in crack widths observed during the loading cycles. These specimens failed at loads that were higher than the ultimate design load, thus indicating that 13
26 when reinforced transversely with No. 4 bars at 12-in. spacing, there was adequate shear transfer strength even across a preexisting crack. There was no strand slip observed in any specimen at any stage of the loading indicating that bond and development of the prestressing strands within the specimens was not a problem. The strain gages on the transverse reinforcement, however, did not provide a reliable basis for evaluating the performance of the transverse reinforcement. Several of the gages were damaged during the curing period and the readings obtained varied erratically. The strain gages did, however, provide some qualitative information. The measured strains in the transverse reinforcement were relatively small during application of the live loads therefore indicating the stress range due to live load was likely to be so small that fatigue of this reinforcement should not be a problem. As a result of this experimental program, the researchers were able to conclude that the composite section formed by the CIP concrete topping and precast panel could withstand 2,000,000 cycles of design load without any significant loss in serviceability or strength. Adequate composite action was obtained by roughening the interface surface of the precast panels. The researchers also concluded that adequate serviceability and strength could be obtained using flat precast panels rather than the more expensive beveled-edge panels. There was no indication that the relative thickness of the CIP concrete topping to the total thickness of the composite section had any effect on the fatigue strength of the section. The researchers final recommendation was a minimum CIP concrete thickness of 5 in. with reinforcement of #4 bars spaced at 12 in. to provide adequate shear transfer strength Peterman and Ramirez Study Peterman and Ramirez (1998) performed a study on Full-Span Form Panel Bridge Systems in the mid 90 s to further investigate the strength and behavior of bridges built with this type of system. With the advent of high-performance concrete, better construction practices, and increased quality control, this type of construction had become attractive therefore requiring testing to investigate the behavior of these systems under these conditions. This study involved a laboratory experiment during which two full-scale specimens were fabricated and subjected to 5,000,000 cycles of service loading and then tested to failure. The objectives of this study were to investigate the effects of repeated loading on the continuity at the interior piers and to evaluate the ultimate strength of multi-span bridges constructed using this system. Each laboratory specimen consisted of two spans with two precast prestressed panels in each span. These panels were 21 ft. long, 4 ft. wide, and 6 in. thick and were topped with a 6 in. thick CIP concrete topping, as shown in Figure The panels were supported at the center pier by a pin connection and at the ends by rollers. A raked finish was applied to the top surface of the precast form panels to attain composite action, as recommended by Buckner and Turner (1981). The differences between the two laboratory specimens were variations in prestressing steel and reinforcement in the CIP concrete topping. Specimen #1 used eight ½-in. uncoated low-relaxation strands which provided an average value of prestressing that would be expected in a precast form panel, while Specimen #2 contained only four such strands which represented a minimum expected amount of prestressing. In the CIP concrete topping, Specimen #1 had sixteen No. 4 bars over the pier while Specimen #2 had six No. 6 bars over the pier. The transverse reinforcement in the CIP concrete topping consisted of No. 4 bars spaced at 12 in. as recommended by Buckner and Turner (1981). 14
27 The instrumentation of these laboratory specimens consisted of load cells, electrical resistance strain gages, LVDTs, and dial gages. Load cells were placed underneath spreader beams at the discontinuous ends of the laboratory specimens. This enabled the researchers to determine the internal moments for this statically indeterminant structure. These cells were monitored throughout the curing period of the CIP concrete topping to monitor the combined effects of creep and shrinkage. They were also monitored throughout the cyclic loading period and during loading to failure. Electrical resistance strain gages were used to measure strains in the concrete and steel of both laboratory specimens. These gages were installed on both the prestressing steel and the mild longitudinal reinforcement of the CIP concrete topping at the center pier. Surface strain gages were installed at the midspan on the top and bottom of the precast panels prior to casting of the CIP concrete topping and also on the CIP concrete topping prior to cyclic loading. LVDTs were used to measure midspan deflections both during the cyclic loading and during loading to failure. Prestressing strand slip was also measured throughout cyclic loading and loading to failure by attaching dial gages to the strands that extended out of the panels at the discontinuous ends. Specimen #1 was allowed to cure for 50 days and Specimen #2 was allowed to cure for 44 days. During this time the load cells at the unrestrained ends of both laboratory specimens revealed that the end reactions decreased over time in both specimens. This indicated that negative restraint moments had developed over the center piers. After this cure time, each specimen was subjected to 5,000,000 cycles of service loading by two hydraulic actuators. This was done to evaluate the effects of repeated loading on the degree of continuity at interior piers. The actuators were centered over the precast panel joints at a distance of 8 ft.-3 in. from the center of the middle pier because this location produced the maximum negative moment over the middle pier. The load levels for cyclic loading of each bridge were chosen so that the maximum stress in the longitudinal steel over the pier ranged from 26 to 44 ksi. The upper limit of 44 ksi was equal to 120% of the maximum allowable design reinforcement stress range, according to AASHTO Specifications (2004). Thus, it was felt that this stress range was believed to represent a worst case scenario of repeated loadings in excess of the design service load. After Specimen #1 was subjected to 2,000,000 cycles of loading, the loading was halted and the surface of the specimen near the middle pier was subjected to 48 days of southern exposure cycling. This weekly cycling consisted of 4 days of exposure to a 15% sodium chloride solution followed by a 3-day drying period. After the exposure cycling was concluded, the specimen was subjected to the remaining 3,000,000 cycles of loading. The stiffness of the specimen increased after the exposure cycling by approximately 67%. This increase in stiffness was attributed to the change in restraint moment at the pier. As a result of the exposure cycling, the restraint moment at the pier changed from -55 k-ft to +20 k-ft. The researchers believed that the re-wetting of the surface reduced the shrinkage of the CIP concrete topping therefore allowing the creep within the precast panels to develop a positive restraint moment. The positive restraint moment then closed any negative bending cracks that had developed over the middle pier providing a much stiffer section. Specimen #2 was subjected to 5,000,000 cycles of loading continuously without any southern exposure cycling. The stiffness of the section remained unchanged throughout the loading cycle and deterioration of continuity between spans did not occur. Each specimen was brought to failure using the same two actuators that were used in the cyclic loading. Flexural failure occurred in each specimen due to concrete crushing in the 15
28 positive moment region. These failures occurred close to the predicted capacities for each specimen using strain compatibility, however, these capacities were much higher than the AASHTO design nominal moment capacities. Strand slip was observed in these panels, but not until very high loading was reached. However, the strand slip did not prevent the section from reaching the design capacity. The results of this study showed that the continuity between adjacent spans was not affected by 5,000,000 cycles of repeated service loading in which the calculated reinforcement stress range at the pier exceeded the AASHTO allowable design stress range by 20%. The experimentally determined positive and negative moments in both laboratory specimens at failure exceeded the AASHTO design nominal moment capacities for the composite sections by factors of 1.7 and 1.6 for Specimens #1 and #2, respectively. This was primarily due to strain hardening of the mild steel reinforcement. In addition, the researchers concluded that full composite action was attained by applying a raked finish to the surface of the precast panels and the ultimate load carrying capacity of the test bridges was not affected by time-dependent effects. 2.5 Additional Full-Span Prefabricated Bridge Systems In this section, two recently developed prefabricated bridge systems which share similarities to the Mn/DOT Inverted-T Precast Slab System are presented. The presentation of these systems includes the objectives for developing the new system, details of the new system, details on testing that may have been performed, and any results or conclusions made as a result of the studies The Inverted Tee (IT) Shallow Bridge System for Rural Areas Kamel and Tadros (1996) performed a study during the mid 90 s to develop a new fullspan precast concrete composite bridge superstructure system. The objective of this study was to develop a superstructure system that is simple to construct and takes advantage of the benefits associated with prefabricated construction while maintaining a low span-to-depth ratio. Of all the bridges built between 1950 and 1990, 95% of them had span lengths of less than 100 ft. Many of these bridges were built over railroads or waterways where clearance was limited. This new system was called the Inverted Tee (IT) System and it consisted of precast, prestressed inverted tee beams with a 6 in. CIP concrete topping. A cross section of the inverted tee beam used in the IT System is shown in Figure This new section shape enabled the use of only one set of forms for a variety of beam depths. Also, the beams were reinforced with straight prestressing strands and welded wire fabric. Therefore these beams were simple to construct and relatively light to handle. The system had a span-to-depth ratio of 35 making it shallower than other available precast concrete products. The IT System was developed after an extensive literature review and a national survey of fabricators and bridge designers. Initially five different shapes were considered in this survey, but the results of the survey revealed that the new IT system would be a good precast concrete system for bridges with shallow superstructure depth requirements and with spans less than 100 ft. A full scale test was performed on the new system to validate the design of the new system, investigate the applicability of the AASHTO Specifications (2004) for its design, and determine if the AASHTO allowable concrete compressive stresses at prestress transfer and at service due to full loading could be exceeded. For the test, two 60 ft. long IT beams with a height of in. were fabricated with 22 prestressing strands in the bottom flange. This was 16
29 the maximum number of strands that would geometrically fit in the bottom flange at a spacing of 2 in. The strands were not debonded or draped in order to investigate the impact of high compressive stresses at transfer of prestress. Two prestressing strands were added to the top of the web to keep the tensile stresses in the concrete below the AASHTO limits. Once the beams were fabricated they were positioned side by side and polystyrene foam blocks were used to fill the voids between the two beams. A CIP concrete deck was then cast on top to complete the specimen. Figure 2.18 shows a cross-sectional view of the IT System. Once fabrication of the specimen was complete, it was tested as a 60 ft. long simple span beam subjected to two concentrated loads that were located 18.5 ft. from each end of the specimen. The testing revealed that the ultimate strength of the IT System exceeded the AASHTO Specifications (2004) for design. However, the compressive stresses in the bottom fibers of the test beams a transfer length away from the ends of the member were equal to 0.81f ci at prestress transfer which exceeded the limit of 0.6f ci in the AASHTO Specifications (2004). The compressive stress at service in the top fibers of the test specimen was calculated by standard elastic analysis to be about 33 % higher than the 0.6f ci AASHTO allowance. However, there was no negative impact detected during testing as a result of exceeding the allowable AASHTO concrete compressive stress either at transfer or due to service loading. Therefore the researchers felt that these limits were too conservative and increasing this allowable limit from 0.6f ci to 0.8f ci would not result in negative impact and would allow producers to reduce the amount of draped or debonded strands at the ends, or relieve compressive strength requirements. The result of this study was a new inverted tee prestressed concrete beam system that has many advantages over other systems. This system is lightweight, simple to construct, and is cost competitive with other systems because it requires no temporary field forming, spans farther and is constructed quicker than other systems. It also has a high span-to-depth ratio making it ideal for projects where clearance is an important design factor Precast Pretensioned Trapezoidal Box Beam for Short Span Bridges Badie et al. (1999) also performed a study in the mid 90 s to develop a new precast prestressed trapezoidal box beam system. The new beam was developed in two different shapes: a closed totally precast concrete shape and an open-top shape requiring a CIP concrete topping. Figures 2.19 and 2.20 provide a cross-sectional view of closed- and open-top shapes, respectively. Box girders can span long distances and maintain a high span-to-depth ratio, eliminate the need for formwork, and produce an aesthetically pleasing superstructure. However, there were some problems associated with existing box girder systems, including longitudinal reflective cracking. Due to the large torsional stiffness of the box girders, the amount of transverse post-tensioning that would be required in this system to mitigate the reflective cracking would have significantly increased the cost of the structure. The objective of this study was to produce a new box girder that would perform better than existing box girders without the requirement of transverse post-tensioning, as well as provide additional economic benefits. The new system was developed by first conducting a survey that was sent to bridge owners, general contractors, precast concrete fabricators, and consultants across the U.S. The results of the survey indicated that using a box beam with sloped sides was preferred because they are easy to construct and possess aesthetic appeal. A parametric study conducted on bridge girders showed that concentrating the area of the cross section in the two flanges as far apart as possible, along with having a thin web, together produced the most efficient cross section. The 17
30 sides of the flanges were shaped to create a continuous shear key that would be filled with nonshrink grout. The shape of this shear key is shown in detail B of Figure Additional transverse connections were provided within blockouts of the precast concrete at an interval of approximately 23 in. These transverse connections were made of large voids that included transverse reinforcing dowels, and once they were filled with non-shrink grout would serve to form an additional connection between adjacent precast sections. There were no laboratory or field tests conducted on this system. However, it was believed that these new beams would provide additional benefits over existing box girders. First, the large width of these new beams lowered the total number of pieces needed to complete the deck which resulted in higher construction speed and lower erection costs. Also, the design of the cross section had relatively flexible flanges and used shear keys and transverse connections to make them continuous, therefore potentially eliminating the development of longitudinal reflective cracking above the joints without the use of transverse post-tensioning. This helped to minimize maintenance costs and increase the expected life of the bridge. 2.6 Summary of Literature Review Review of the literature on prefabricated bridge superstructure systems revealed significant information about these systems. Examination of the different types of connection systems used in prefabricated bridge superstructure systems suggested the use of a CIP concrete topping to be the most advantageous, especially in a cold climate state such as Minnesota. However, it also revealed some problems that exist with the use of a CIP concrete topping specifically the development of longitudinal reflective cracking above the longitudinal joints between adjacent precast sections. In addition, the complexity of continuous behavior revealed the importance of proper design practices and reinforcement detailing to achieve continuity. Some conclusions made as a result of the studies performed on Full-span Form Panel Bridges were considered during the design process of the Mn/DOT Inverted-T Precast Slab System and the development of the instrumentation plan for this research project. Some of these conclusions include being able to achieve composite action through the use of raked or roughened surfaces, and the use of transverse reinforcement over the longitudinal joints as well as thinner precast section flanges near the longitudinal joints to reduce the probability for the development of longitudinal reflective cracking in the CIP concrete topping. Some aspects of the designs for the other two recently developed prefabricated bridge superstructure systems were also considered during the design process as well as the development of the instrumentation plan. 18
31 Chapter 3 Development and Implementation of the Mn/DOT Inverted-T Precast Slab System 3.1 Design Objectives of the Mn/DOT Inverted-T Precast Slab System The objective of the design of the Mn/DOT Inverted-T Precast Slab System was to develop a durable bridge superstructure alternative to the traditional CIP slab-span bridge system that takes advantage of the benefits associated with prefabricated construction. The CIP slabspan bridge system is a superstructure of relatively short span ranges commonly used in Minnesota over streams. The construction of this system requires the use of shoring to pour the bridge deck which increases construction times and often has a negative impact on the environment adjacent to the bridge. The design of the Mn/DOT Inverted-T Precast Slab System possesses the advantages of a shallow depth slab-span, but eliminates the need for shoring by utilizing the inverted-t precast sections as stay-in-place forms that become integral with the CIP slab. The use of the new system reduces construction time at the site and ultimately reduces the impact on the traveling public. The system concept was developed in a collaborative process between Mn/DOT engineers, the University of Minnesota, and local fabricators for spans ranging between 20 and 65 feet. The fabricator input was sought to ensure constructability and economy of the precast sections. Ultimately, Bridge No was designed by Mn/DOT engineers using the AASHTO Load and Resistance Factor Design (LRFD) Bridge Design Specifications, Third Edition (2004). The remainder of this chapter will discuss the features of the bridge system common to all Mn/DOT inverted-t precast slab bridges and then discuss the design details for Bridge No Common Features of the Mn/DOT Inverted-T Precast Bridge System This section discusses design considerations and details that are general to any bridge designed with the Mn/DOT inverted-t precast section. The common features and design assumptions of the precast section are discussed in Section Section discuses the general system to tie the precast sections together. Section discusses the system for making the spans continuous over the piers for live load Design of the Precast Section A cross-sectional view of an interior section of the Mn/DOT Inverted-T Precast Slab System concept is shown in Figure 3.1. This shape was based on the precast section used in the French Poutre Dalle system (Figure 1.1). The precast sections of the new system were designed to have a standard width of 6 ft. which was the maximum width that local fabricators could readily accommodate. This maximum width was chosen to minimize the number of sections required to span the width of the bridge. It was believed that this would result in economic benefits by reducing the amount of time required to fabricate the sections as well as the time required to place the sections during bridge construction. Using wider precast sections also results in fewer longitudinal joints between precast sections in the finished structure which require special reinforcement and time to construct. The exterior inverted-t precast section concept used in this system had a web, a flange on only one side, and reinforcement to 19
32 accommodate a barrier, as shown in Figure 3.2. These sections did not have a standard width. The variable width of these sections allows a bridge to have any desired width. The inverted-t precast sections were designed with transverse hooks protruding out of the vertical sides of the web, as shown in Figure 3.1. These hooks were #6 bars spaced at 12 in. along the length of each precast section. The 12-inch spacing was chosen conservatively to ensure that an adequate amount of steel traversed the longitudinal joint. For this system, 90º hooks were used rather than 180º hooks which were used in the Poutre Dalle system because it was felt that this would simplify formwork during the precasting process as well as the placement of reinforcement in the field. Figure 3.3 shows a photograph of these transverse hooks. Because this system is similar to slab-span bridges, the web height of the inverted-t section for each bridge project was to be determined using AASHTO LRFD Table (2004), which specifies for slab-span bridges with continuous spans: Total Structure Depth = [S+10]/30, (1) where S is the clear length (feet) of the longest span. The minimum thickness of the CIP concrete above the precast section webs was set at 6 in. to provide 3 in. of cover above the longitudinal deck reinforcement, therefore the height of the precast section web would be 6 in. less than the value obtained from Eqn. (1). The longitudinal reinforcement at the top of the webs consisted of seven #8 bars spaced at 7 in. This reinforcement was used to provide resistance for tensile stresses that could develop during handling and transportation of the panels prior to placement. The required prestressing force was a function of the span length and the dead load. The precast sections were designed to be simply supported under dead loads and continuous over the piers for live loads. The maximum span length of the precast sections was to be 65 ft. The flanges were designed with a 1:24 slope to increase the constructibility of the section. It was felt that eliminating the flat surface on top of the flanges would simplify removal of the formwork, as well as simplify the casting of both the precast and CIP concrete by facilitating the flow of concrete. The thickness of the flanges along the exterior of each section was 5.25 in. because this was the minimum flange thickness that provided enough clearance within the flange for the #4 bar with a 180º hook around the longitudinal reinforcement and 1.5 in. of concrete cover along the bottom surface of the section. There was no concrete cover requirement at the top surface of the flanges because the flanges were covered with CIP concrete in the field, however a minimal amount of concrete was needed between the steel and the top surface of concrete in order for the steel to bond with the precast concrete. Minimizing the thickness of the flanges increased the thickness of the CIP concrete at these locations and lowered the depth of the transverse hooks that traversed the longitudinal joints, both of which increased the ability of the section to distribute loads in the transverse direction. The web and flange corners of the precast inverted-t sections had a ¾-inch chamfer, as shown in Figure 3.1. Chamfering the corners reduced the stress concentrations at these locations to lessen the probability for the development of longitudinal reflective cracking. Caulk was used to seal the joint as well as to increase the surface area of the discontinuity and reduce the stress concentration directly above the longitudinal joints, as shown in Figure 3.4. The contact surfaces of the precast sections (those surfaces in direct contact with the CIP concrete) were intentionally roughened to enhance the bond between the precast sections and the CIP concrete. The surfaces were roughened to have a minimum amplitude of ¼-inch. Formwork was fabricated with a form liner to create roughened surfaces, as shown in Figure
33 This formwork was used to create roughened surfaces on the tops of the flanges and the vertical sides of the web. A rake was used to roughen the top of the web. The intent of these roughened surfaces was to help achieve composite action between the precast and CIP concrete and therefore help prevent the development of reflective cracking in the CIP concrete. Transverse reinforcement was included within the precast sections to satisfy three different reinforcement requirements: horizontal shear reinforcement, anchorage zone reinforcement, and confinement reinforcement. The transverse reinforcement that was included to satisfy these requirements is highlighted in Figure 3.6. Horizontal shear reinforcement was required to ensure that composite action was achieved. The size and spacing of the horizontal shear reinforcement required for each bridge was to be a function of the surface area and roughness of the concrete interface (AASHTO LRFD 5.8.4). This reinforcement was required along the entire length of each precast section. The amount of reinforcement included for anchorage zone reinforcement and confinement reinforcement was standardized to provide a standard reinforcement detail that could be used for precast sections with a prestressing force of up to 1,000,000 lbs., which was the maximum prestressing force proposed by local fabricators. This reinforcement was only included within 18 in. of the end of each precast section. The standard anchorage zone reinforcement consisted of three #5 ties (Figure 3.6) at 2-in. spacing at the end of each section followed by two #5 ties at 6-in. spacing (AASHTO LRFD ). The standard confinement reinforcement consisted of three #4 ties (Figure 3.6) at 2-in. spacing at the end of each section followed by two #4 ties at 6-in. spacing (AASHTO LRFD ). During the casting process for the inverted-t sections, styrofoam blocks were used to block out the final 10 in. of each flange at both ends of the member. After the precast sections were set in place, these block-outs formed large voids above the pier caps, as shown in Figure 3.7. These block-outs were filled with CIP concrete which served, along with reinforcement, to tie the precast sections to the pier caps Transverse Reinforcement over the Longitudinal Joints Once the precast sections were in place, a reinforcement cage was placed over the longitudinal joint. The reinforcement detail over the joint, including the transverse hooks, is shown in Figure 3.4. The use of 90º hooks with this system enabled the reinforcement cage to be prefabricated and dropped into place above the longitudinal joints rather than tying each bar inplace individually. Figure 3.8 shows a photograph of the reinforcement cage after it was set in position above the longitudinal joints. The transverse hooks and reinforcement cage were included in the system to provide a means for transverse load distribution. Once the sections and reinforcement were in place and the CIP concrete had cured, the transverse hooks and the reinforcement cage would serve to effectively connect adjacent sections. Thus, it was felt that this large amount of reinforcement placed in each longitudinal joint would reduce the tensile stresses that would otherwise develop within the CIP concrete topping as a result of transverse load sharing. This would therefore arrest the development of reflective cracking above the longitudinal joints Detailing for Continuous Behavior over the Piers The Mn/DOT Inverted-T Precast Slab System was designed to behave continuously for live load by adding negative moment reinforcement at the top of the CIP concrete above the pier caps. This method for achieving continuity was much more practical than the use of longitudinal post-tensioning. Longitudinal deck reinforcement was included within the CIP concrete topping 21
34 to provide tensile resistance. This longitudinal reinforcement was designed similar to the reinforcement in the top of traditional CIP slab-span bridges. The CIP concrete that filled the large voids created by the block-outs of the precast sections at the piers (Figure 3.3), along with the concrete between the ends of the precast sections acted similar to a concrete diaphragm, and also provided potential compressive resistance for negative continuity moments. It was felt that the combination of this compressive resistance with the tensile resistance of the longitudinal deck reinforcement would provide adequate negative moment resistance to achieve continuous behavior for live load over the piers. As explained in Section 2.3, long-term behaviors such as creep and shrinkage can lead to the development of positive restraint moments at the pier caps. A positive moment connection must be provided to prevent the development of a gap between the CIP concrete and the precast sections above the pier caps. This positive moment connection was provided by adding additional reinforcement consisting of four #8 bars over the piers at a lower depth in the cross section. These #8 bars extended 10 ft. in each direction on each side of the pier. This reinforcement is shown in Figure 3.4. The reinforcement cages that were placed above the joints were not continuous over the piers. 3.3 Design of Mn/DOT Bridge No The bridge instrumented for this study was Mn/DOT Bridge No , located in Center City, Minnesota. This bridge was oriented in the east-west direction on U.S. Trunk Highway 8 near the junction of Chisago County Road 9. The bridge spanned the newly created Center Lake Channel that connected North Center Lake and South Center Lake. The channel was built to enable boat travel between the two lakes. Originally a box culvert existed at this location that was not designed for boat travel. An elevation view of this bridge is shown in Figure 3.9. Complete bridge plans for this bridge are provided in Appendix A of this report. The superstructure of the bridge was constructed using the Mn/DOT Inverted-T Precast Slab System. The thickness of the CIP concrete above the web of the precast sections was 6 in. to provide adequate concrete cover of 3 in. above the longitudinal deck steel. This produced a deck with a constant cross section thickness of 18 in. The abutments, wingwalls, and pier caps were constructed of precast concrete and were supported by CIP concrete piles (The abutments of Stage 2 were CIP rather than precast because the large weight of the precast abutments presented problems during construction). The substructure had a crown towards the center to allow for proper drainage of the bridge deck and to allow the deck to have a constant deck thickness. The wingwalls extended back from the abutments at a 90º angle. The bridge had three spans measuring 22 ft., 27 ft., and 22 ft. There was no skew between the roadway and the channel. The general contractor for construction of the bridge was Lunda Construction. The inverted-t precast sections were fabricated by County Materials Corporation at their fabricating plant in Roberts, Wisconsin. The bridge was constructed in two stages to allow continuous flow of traffic. In Stage 1, the abutments and pier caps were precast in two separate pieces and connected using construction joints. Reinforcement dowels were placed within the construction joints and the joints were filled with grout to tie the sections together. In Stage 2, the abutments and piercaps were cast-in-place. The CIP concrete deck was also cast in two stages therefore there was a longitudinal construction joint located along the entire length of the CIP portion of the bridge deck adjacent to the centerline of U.S. Trunk Highway 8. The construction stages and construction joint within the CIP concrete deck are shown in Figure The superstructure 22
35 was constructed integrally with the pier caps and abutments therefore there were no expansion joints installed in the bridge. There were however expansion joints installed between the approach panels and the roadway paving to allow for movement of the approach panels to accommodate the bridge expansion and contraction. The bridge was designed to accommodate one lane in each direction, a full-width shoulder on each side, and a left-turn lane located in the center of the bridge for eastbound traffic. A bike path was located along the north side of the bridge, bordered on the north by an ornamental metal railing and on the south by a guardrail which served to separate the bike trail from the highway traffic. There was also a guardrail on the south side of the bridge. Instrumentation was installed at several locations within the CIP portion of the deck to monitor for the development of reflective cracking and to investigate continuous behavior over the interior piers. A conduit system was constructed within the CIP portion of the deck to house the wiring for this instrumentation. The conduit traveled from the CIP concrete down through the flanges of three of the precast sections to boxes that were mounted on the pier cap. The conduit proceeded along the underside of the bridge and then underground towards a cabinet that housed the data collection system. A complete description of the conduit system is located in Chapter 5 of this report Materials The inverted-t precast sections were constructed using concrete with a specified minimum compressive strength of 6500 psi. The other precast elements as well as the CIP portions of the bridge were constructed using concrete with a specified minimum compressive strength of 4000 psi. The results of the compressive strength tests for both the precast and CIP concrete are provided in Tables 3.1 and 3.2, respectively. The prestressing strands used in the precast sections were ½-inch diameter 7-wire lowrelaxation strands conforming to ASTM A416 with a minimum ultimate tensile strength of 270 ksi. The mild reinforcement located in all elements of the structure was epoxy-coated rebar with a minimum tensile yield strength of 60 ksi. The backfill material used during the construction of this bridge was a granular backfill that met Mn/DOT standard specification D (2000). At the time of construction, this specification called for pit-run or crusher-run mineral to pass a 75 mm (3 inch) sieve, graded from coarse to fine such that the ratio of the portion passing the 75 µm (#200) sieve divided by the portion passing the 25 mm (1 inch) sieve may not exceed 20 percent by mass Design Calculations Mn/DOT Bridge was designed according to the AASHTO LRFD Bridge Design Specifications, Third Edition (2004) and interim specifications current at the time of design (Fall 2004). An HL93 Live Load was considered for design along with an additional uniform load of 20 psf for allowance of future wearing course modifications as well as 450 plf for traffic barriers and 200 plf for a pedestrian barrier, both distributed equally to all of the precast sections. The design speed for the bridge was 45 mph. Calculations performed by engineers at the Mn/DOT Bridge Office for an interior composite section are provided in Appendix B of this report. The precast sections acted simply-supported for their self weight but once the concrete had cured the composite section behaved continuous over the pier. Therefore the continuous composite section was designed to support the live load and superimposed dead loads. Live loads were considered to be distributed to the superstructure based on the equivalent beam 23
36 widths for slab-span type bridges (AASHTO LRFD ). This distribution factor was used because once constructed the bridge most closely resembled a slab-span bridge making this live load distribution factor most appropriate. The restraint moment was estimated using the Portland Cement Associated (PCA) Method (Freyermuth, 1969). In this method, a formula was used to calculate the moment caused by differential shrinkage in a composite concrete section. The restraint moments were then calculated using a formula that combined the shrinkage moment, the moment caused by the prestressing force about the centroid of the composite section, and the midspan moment caused by dead load to obtain the restraint moment at the piers. The restraint moments estimated using this method were combined with the dead and live load moments to check the capacity of the composite section. The maximum total factored negative moment demand over the pier, including the estimated restraint moment and live load was conservatively calculated to be -97 ft-kips per foot of width. The longitudinal reinforcement over the piers consisted of #8 bars at 12-inch spacing and #7 bars at 4-inch spacing between the #8 bars. This detail is shown in Figure 3.3. The factored nominal negative moment capacity of this reinforcement along with the concrete above the piers was calculated to be 117 ft-kips per foot of width. Conservatism was used with these calculations because it is difficult to accurately predict restraint moments for this new system. The transverse deck reinforcement consisted of #5 bars spaced at 12 in. to satisfy shrinkage and temperature requirements (AASHTO LRFD ) Details of the Precast Section used for Mn/DOT Bridge No The height of the web for the precast sections of Bridge was 12 in. This height was used to produce a deck cross section that had a constant thickness of 18 in. This bridge had initially been designed as a slab-span bridge with an 18 in. deck and by using the same thickness no changes had to be made to the grade of the roadway. Figure 3.11 shows the cross section of the interior precast sections for this bridge, including complete details of the reinforcement. The prestressing pattern within the precast sections consisted of two layers of prestressing strands with 8 strands in each layer. The two layers had a center-to-center vertical spacing of 2 in. and each strand had a horizontal spacing of 6 in. Each of these strands were stressed to ksi (0.75f pu ) to produce a total prestressing force per section of 496 kips. The longitudinal reinforcement within the flange tips was originally planned to consist of mild steel. However, this was changed to prestressing strands tensioned to a nominal stress of 5000 psi. The fabricators suggested this be done because it significantly simplified the placement of this reinforcement. The transverse reinforcement within the flanges consisted of #4 bars with a 180º hook around the longitudinal reinforcement within the flange, as shown in Figure 3.1. This reinforcement was used to increase the durability of the flanges during transport. The maximum total factored positive moment demand at midspan of the center span, including the estimated restraint moment and live load, was calculated to be ft-kips for an interior composite section. The positive design moment capacity was calculated to be ftkips for an interior composite section. The excess ultimate capacity was a result of satisfying serviceability requirements. The maximum factored vertical shear demand at the critical section was calculated to be 90 kips. This was less than half of the design concrete shear capacity for the composite section therefore there was no requirement for stirrups due to vertical shear demand. The maximum factored horizontal shear demand at the interface of the precast and CIP concrete was estimated 24
37 to be ksi near the ends of the precast sections. This slightly exceeded the ksi maximum design horizontal shear capacity of the concrete with a roughened surface, therefore transverse reinforcement was needed near the ends of the section for horizontal shear (AASHTO LRFD ). The rest of the section required only the minimum amount of reinforcement at 24-in. spacing (AASTHTO LRFD ). However, due to the unique design of this system and the importance of composite action, these sections were conservatively designed with #5 ties at 12 in. along the entire length. The relatively short length of the precast sections in this bridge allowed this conservative amount of reinforcement to be used without large economical impact Details of the Bridge Deck The entire deck of the bridge was 72 ft. 2 in. long and 76 ft. 5 in. wide. The roadway was 62 ft. 3 in. wide and the bike trail was 10 ft. wide. Holes were prefabricated into the flanges of three of the interior-end span sections to provide a means for the conduit to travel from the CIP portion of the deck to the underside of the bridge. The approach panels extended out 20 ft. from the bridge and ran the whole width of the roadway. The thickness of the approach panels was 12 in. The approach panels were reinforced with a top and bottom mat of steel consisting of #4, #5, and #6 bars. The far end of the approach panel rested on a concrete sill and had an expansion joint between the panel and the roadway Details of the Precast Substructure The substructure was designed to be constructed entirely out of precast concrete. However, due to problems handling the abutment sections (mostly due to weight) during Stage 1 of bridge construction, the abutments of Stage 2 were constructed using CIP concrete. In Stage 1, reinforcing dowels were used to tie adjacent precast elements together. This was done by inserting reinforcing dowels from one of the elements into prefabricated holes in another element and then filling the holes with grout. The precast sections of the superstructure were placed on elastomeric bearing pads located on top of the pier caps and/or abutments. The superstructure of the bridge was tied to the wingwalls, abutments, and pier caps by reinforcing dowels that extended out of the precast elements and into CIP portions of the bridge deck or approach panels. Figures 3.12 and 3.13 show the connection detail of the abutment to the CIP concrete of the bridge deck and approach panels and the connection detail of the pier caps to the CIP concrete of the bridge deck, respectively. The reinforcing dowels were only located within the center 50% of the bridge width to allow the outer portions of the bridge to expand and contract laterally under thermal loading. In Stage 1, the abutments, wingwalls and pier caps were constructed of precast concrete. The abutments were 76 ft. 5 in. long, 7 ft. tall and 3 ft. thick. The wingwalls extended back approximately 10 ft. 6 in. from the face of the abutments. The reinforcement of the abutments and wingwalls consisted entirely of #5 and #6 bars. The pier caps were 76 ft. 5 in. long, 3 ft. 6 in. tall and 3 ft. 6 in. thick. The reinforcement for the pier caps consisted of #5, #7 and #9 bars. The precast substructure was supported by CIP concrete piles. The piles consisted of steel pipes driven into the ground, closed-ended, to the depth required to reach bearing capacity. The piles used to support the abutments were 55 ft. long and had a 12 in. nominal diameter. The piles used to support the pier caps were 80 ft. long and had a 16 in. nominal diameter. Once the piles were driven to the proper depth, they were filled with high slump concrete and reinforcement was added to the top portion of the pile. This reinforcement was used in conjunction with grout to tie the CIP concrete piles to the precast substructure. 25
38 Chapter 4 Instrumentation of Mn/DOT Bridge No Objectives of Instrumentation The instrumentation plan for Mn/DOT Bridge No was developed with the objective of evaluating the performance of the newly developed Mn/DOT Inverted-T Precast Slab System. The behaviors to be investigated were established after an extensive literature review on other precast deck systems along with several meetings with Mn/DOT engineers. Behaviors of interest included potential development of longitudinal reflective cracking in the CIP concrete, continuity for live loading over the piers, and effectiveness of the transverse hooks in transverse load sharing. All instrumentation for Mn/DOT Bridge was installed during Stage 1 of bridge construction, which consisted of the north half of the bridge. This Stage was selected for instrumentation for two reasons. First, after completion of Stage 1, all traffic was rerouted to that portion of the bridge while construction began on Stage 2. This subjected the north half of the bridge to potentially larger traffic volume at an early age, promoting the potential development of reflective cracking. Second, this section of the bridge was closest to the cabinet used to house the dataloggers which was stationed adjacent to the available power source. Because of symmetry, only the east half of Stage 1 was instrumented. Figure 4.1 shows a plan view of the bridge with the instrumented portion of the bridge highlighted. The remainder of this chapter explains the behaviors that were investigated, the instrumentation that was used to investigate each behavior, and the locations of the installed instrumentation. 4.2 Longitudinal Reflective Cracking of the CIP Concrete Deck above the Precast Longitudinal Joints The development of longitudinal reflective cracking in the CIP concrete deck was a major concern due to the implications that such cracking would have on the durability of the system, as explained in Section The main area of concern for the development of cracking was the area directly above the longitudinal joints between adjacent precast sections because it was thought that this presented the most probable area for the development of cracking. Figure 4.2 shows a cross-sectional view of the deck system with the longitudinal joints highlighted. The vertical sides of the flanges on adjacent precast sections were not connected therefore the load sharing in the transverse direction across these joints had to occur within the CIP concrete. This had the potential to create tensile stresses in the CIP concrete in the transverse direction which could lead to the development of cracking. In addition, loading, such as wheel loads, could cause adjacent flanges to slightly separate from one another. The contact surfaces of the precast sections were roughened to create a bond with the CIP concrete and help to achieve composite action, however the bonding of the CIP concrete to the top of the flanges could also potentially increase the tensile stresses in the CIP concrete resulting from slight separation of the adjacent flanges due to transverse load sharing and consequently create a driving force for the development of reflective cracking. As mentioned in Chapter 3, transverse hooks protruded out of the webs of the precast sections in addition to reinforcement cages placed between the webs to arrest the development of longitudinal reflective cracks. Figure 3.4 shows these transverse hooks along with the additional 26
39 reinforcement cages located above the longitudinal joints between the precast webs. The top corners of adjacent flanges were chamfered to reduce local stress concentrations at these locations. A single bead of caulk was applied to the top of the longitudinal joints to weatherproof the joint and to reduce stress concentrations at this location by blunting and increasing the area of the discontinuity Instrumentation for Longitudinal Reflective Cracking above the Precast Longitudinal Joints Slight separation between adjacent flanges, which would act as a driving force for the development of reflective cracking, would most likely occur at the location of maximum downward deflection. Thus, it was felt that reflective cracking would most likely develop above the longitudinal joints of the longest span. Therefore instrumentation was installed above the longitudinal joints at the midspan of the center span at three different locations in the transverse direction. These transverse locations were chosen to be as close as possible to the nominal wheel load locations as shown in Figure 4.3. The center span had a total of 12 longitudinal joints formed by adjacent precast sections; therefore, it would be difficult to evaluate the overall performance of these joints by instrumenting a single joint however it was not feasible to instrument every single joint. As a compromise, three joints were instrumented, to obtain a sufficient amount of information that would allow for proper evaluation of the overall performance of the longitudinal joints. The instrumentation at each location consisted of five vibrating wire (VW) embedment strain gages oriented in the transverse direction. The VW embedment strain gages used for this instrumentation were Geokon Model VCE-4200 VW Strain Gages as shown in Figure 4.4. Details and specifications for this strain gage are provided in Appendix C. Once installed, each gage overlapped the adjacent gage by approximately 2 in. as shown in the instrumentation detail given in Figure 4.5. The gage length for the gages used was 6 in. Therefore each gage had approximately 2 in. where it was not overlapped by any of the adjacent gages, and 2 in. at each end that was overlapped by the adjacent gages. The gages were overlapped to ensure that the crack would not propagate around them which would allow the crack to avoid being detected. If a crack were to develop and open, it would cause any strain gage that spanned the crack to have a larger relative strain reading than adjacent strain gages. Therefore in addition to ensuring that the crack was detected, overlapping the gages would allow for determination of the crack location to within 2 in. The five VW embedment strain gages at each transverse location were installed by tying each gage between two pieces of uncoated rebar using coated tie wire as shown in Figure 4.6. Once all the gages were tied to the rebar, this assembly was placed on top of the bottom longitudinal reinforcement steel of the reinforcement cage, positioning the gages approximately 3 in. above the top of the flanges, as shown in Figure 4.7. Once the assembly was tied in place, the final position of each gage was secured by using a zip tie to secure the gage to the coated tie wire. This prevented the gage from sliding in the transverse direction and changing position during pouring of the CIP concrete deck. The lead wire for each gage was temporarily placed in a plastic bag to protect it from the elements. 27
40 4.3 Longitudinal Reflective Cracking of the CIP Concrete Deck above the Precast Section Web Corners A secondary area of concern for the development of longitudinal reflective cracking of the CIP concrete deck was directly above the web corners of the precast sections. Figure 4.2 shows a cross-sectional view of the deck system with the precast web corners highlighted. This area was a concern because the corner of the web of the precast section might produce high stress concentrations in the relatively thin CIP concrete. These corners were chamfered to reduce stress concentrations at this location. The contact surfaces of the precast sections were also roughened to achieve better bond with the CIP concrete to lessen the effect of the discontinuity between the precast concrete and the CIP concrete at this location Instrumentation for Longitudinal Reflective Cracking above the Precast Section Web Corners The instrumentation above the web corners at each location consisted of ten Geokon Model VCE-4200 VW Strain Gages oriented in the transverse direction. Details and specifications for this strain gage are provided in Appendix C. Again, these gages were placed such that each gage overlapped the adjacent gage. The gage length for the gages used was 6 in. and the overlap used for these gages was about 1.5 in. therefore each gage had approximately 3 in. where it was not overlapped by any adjacent gages. Figure 4.8 shows the plan view of the instrumentation detail for the instruments located above the web corners. This detail existed at the same locations as the instrumentation above the joints but at a higher depth in the cross section. Figure 4.9 shows a cross-sectional view that includes all the VW embedment gages located at each instrumented transverse location. This detail was used because it would provide more information in the case that cracking would develop. More specifically it would reveal if the cracking had propagated to a higher depth in the cross section and would give an approximation of the path by which the cracking had propagated. The ten VW embedment strain gages located above the web corners were installed by tying each gage to two pieces of coated rebar using coated tie wire. In this case, epoxy-coated rebar was used due to the close proximity of these gages to the exterior surface of the CIP concrete deck. Once all the gages were tied to the rebar, the assembly was slid into position underneath the longitudinal deck steel and tied in place as shown in Figure Again, the final position of each gage was secured by using a zip tie to secure the gage to the coated tie wire. 4.4 Continuous Behavior for Live Load over the Piers The Mn/DOT Inverted-T Precast Slab System was designed to behave continuously over the piers for live load because continuous behavior presents many advantages, as explained in Section 2.3. Md/DOT practice for typical preacast concrete beam bridges is to design the spans as simply supported for both dead and live load; however the design of the Bridge spans included reinforcement in the CIP deck for the purpose of producing continuous behavior for live loads. It was difficult to accurately calculate or predict the restraint moment that would develop at the piers because the methods used to predict restraint moments are based on typical bridge deck systems which have much thicker cross sections than this system. Thus, a large amount of reinforcement was chosen conservatively. The reinforcement in the negative regions of the CIP concrete deck consisted of #8 bars spaced at 12 in. with #7 bars spaced at 4 in. between the #8 bars. As mentioned in Chapter 3, additional reinforcement was added over the piers at a lower 28
41 depth in the cross section to provide a positive moment connection in case a positive restraint moment were to develop due to long-term behaviors such as creep and shrinkage. This additional reinforcement consisted of four # 8 bars above the joint as shown in Figure 3.4. Since it was difficult to calculate the size of the potential positive restraint moment, it was uncertain how effective this additional reinforcement would be. However, if this reinforcement was not added and large positive restraint moments had developed this could cause a gap to open between the precast sections and the girder ends. Once the precast sections were placed on top of the pier caps and/or abutments, the blocked-out portions of the flanges (Figure 3.3) created large voids above the pier caps which were filled with the CIP concrete of the deck. Once the CIP concrete cured, the concrete that filled these voids along with the space between the ends of the precast sections acted as a concrete diaphragm and provided some compressive negative moment resistance. However, due to the irregular geometry of the CIP concrete and precast sections, it was difficult to analytically determine how effective this negative moment resistance would be in helping to achieve continuous behavior for live load Instrumentation for Continuous Behavior for Live Load over the Piers The bridge superstructure for the Mn/DOT Inverted-T Precast Slab System was designed to behave continuously for live loads only. To determine the effective continuity of the bridge superstructure a live load (known test load) must be applied to the bridge. This will be done by moving a loaded sand truck to several different positions along the length of the bridge. While the sand truck is at each position, the curvature at several different locations along the length of the bridge will be determined using the installed instrumentation. The effective continuity of the bridge can be determined by comparing the curvatures obtained using instrumentation to the curvatures calculated using the known live load and assuming fully continuous behavior. The truck test had not yet been executed at the time of this report. The instrumentation used for monitoring the continuity were Geokon Model VK-4150 Vibrating Wire Strain Gages as shown in Figure Details and specifications for this strain gage are provided in Appendix C. These gages were welded to the longitudinal steel reinforcement at different depths of the bridge cross section. Each gage provided a strain reading for that depth of the cross section which could be used to determine the curvature of the bridge at that location. Due to symmetry, it was only necessary to determine the continuous behavior over one of the piers, thus six locations along only half the length of the bridge were instrumented. These locations of instrumentation are shown in Figure At each of these locations, instrumentation was installed at several locations in the transverse direction. This was done partly to provide redundancy but also to provide information on transverse load distribution. Figure 4.13 is a plan view of Stage 1 of the bridge deck, showing the locations of all the instrumentation installed on the longitudinal steel reinforcement. In the transverse direction, instrumentation was installed at the midspan of the center span adjacent to both Joint 1 and Joint 2 and near the pier on the center span side, adjacent to Joints 1, 2, and 3. Gages were also installed on the longitudinal deck steel at several locations above Webs 1 and 2 of the precast sections on the center pier side of the east pier. These gages were used to determine if the strains in the deck steel over the pier differed between the areas above the flanges and the areas above the webs. This would provide insight on the effect that the precast section shape has on the continuous behavior of the bridge. 29
42 The s in Figure 4.13 represent locations of instrumentation where three strain gages were installed. At these locations, two strain gages were installed on the longitudinal steel of the reinforcement cage above the longitudinal joint and one strain gage was installed on the longitudinal deck steel that was closest to the other two gages, as shown in Figure The s in Figure 4.13 represent locations of instrumentation where two strain gages were installed. The instrumentation detail was different at these locations because the reinforcement cages were not continuous over the pier. At these locations, one strain gage was installed on one of the #8 bars above the pier and one strain gage was installed on the longitudinal deck steel directly above the other strain gage, as shown in Figure The s in Figure 4.13 represent locations of instrumentation where only one strain gage was installed. At these locations the strain gage was installed on the longitudinal deck steel. The VW spot-weldable strain gages were installed by first grinding the epoxy coating off of the longitudinal reinforcing steel at the location where the gage was to be installed. The steel was then ground flat at this location to provide a smooth surface for spot-welding the strain gage. Figure 4.16 shows a picture of a VW spot-weldable strain gage welded to longitudinal reinforcement. After the strain gage was welded to the steel, cyano-acrylate adhesive was applied to the mounting tabs to seal any gaps between the steel and the mounting tabs. The tabs were then completely covered with a water-proofing compound to protect against future corrosion. To provide mechanical protection, the entire gage was then covered with a steel cover that was secured in place using three zip ties as shown in Figure The edges of the cover were covered with mastic tape to prevent concrete from getting inside the cover. After all of the gages were installed, the steel reinforcement that had gages attached were rotated so that the gages were located on the bottom of the steel. This was done to reduce the chances of damaging the gages during pouring of the CIP concrete deck. Figure 4.18 shows a photograph of three VW spot-weldable strain gages on the longitudinal steel near midspan and Figure 4.19 shows a photograph of two VW spot-weldable strain gages installed on the longitudinal steel above the pier. 4.5 Effectiveness of the Transverse Hooks The transverse hooks extending out of the webs of the precast sections were intended to help with transverse load sharing and to reduce the probability for the development and propagation of longitudinal reflective cracking in the CIP concrete above the longitudinal joint. These hooks were spaced at 12 in. on center in each member. The locations of the hooks within each section were staggered slightly so that the hooks from adjacent sections would not line up directly, which would otherwise prevent proper placement of adjacent precast sections. Figure 4.20 shows a photograph of the hooks from adjacent sections lined up once the sections were in place. The spacing of 12 in. was chosen arbitrarily because it was difficult to accurately predict the effectiveness of these hooks. Therefore to determine if this spacing was adequate to provide effective transverse load sharing, it was necessary to monitor the behavior of these hooks under applied loading. Also, if a longitudinal reflective crack were to develop in the CIP concrete it would be important to determine whether or not the steel of the transverse hooks had yielded across the crack. 30
43 4.5.1 Instrumentation to Determine Effectiveness of Transverse Hooks The same three joints that were instrumented for longitudinal reflective cracking were also instrumented to investigate the effectiveness of the transverse hooks (Figure 4.3). At each location, two transverse hooks were instrumented above each joint directly adjacent to the VW embedment strain gages that were used to detect the development of longitudinal reflective cracking. These locations were chosen to facilitate the detection and location of reflective cracking. Also, the transverse hooks at midspan would likely experience the largest strains therefore instrumenting these hooks would likely provide the most information on their effectiveness. Each pair of hooks that was instrumented consisted of hooks protruding from adjacent precast sections located directly adjacent to one another in the longitudinal direction. Each pair was instrumented with a total of seven Geokon Model VK-4150 Vibrating Wire Strain Gages. Four gages were placed on one hook while three gages were placed on the adjacent hook. The gages were placed so that the gage on one hook slightly overlapped the adjacent gages on the other hook. Together, the seven gages spanned most of the distance between the webs of the adjacent precast sections. This was done to ensure that the gages would cross a crack if one were to develop. Figure 4.21 shows a plan view of the instrumentation detail for the transverse hooks. These gages were installed in the same manner as the gages used for monitoring continuous behavior over the piers as explained in Section Figure 4.22 shows a photograph of these strain gages installed on the transverse hooks. 4.6 Installation of Instrumentation The coordinates of all the gages installed in the bridge are provided in Tables 4.1 through 4.4. These coordinates are in inches and were measured from the northeast corner of the roadway (inside the north guardrail, see Figure 4.1), using a positive coordinate system with x- being positive in the west direction along the length of the bridge, y- positive in the south direction, and z- positive in upwards direction starting from the bottom surface of the bridge superstructure. The x-direction coordinates given for the VW embedment gages is for the center of that group of gages. The gages overlap the adjacent gages, but they are not all in the same line. They have a spacing of approximately 1.5 in. between overlapping gages (see Figure 4.7). The gages were labeled according to the type of gage and the approximate location of the gage within the bridge. This labeling scheme is explained in Figure The installation of instrumentation took place in September of The process started on September 2 and lasted until September 28 at which point all instrumentation was connected to the data acquisition system, which is described in Chapter 5. Data was recorded intermittently throughout the installation process using a Geokon GK-403 read-out box. A complete log of the installation process is provided in Appendix D of this report. 31
44 Chapter 5 Data Acquisition System 5.1 Design of the Data Acquisition System A data acquisition (DAQ) system was created to facilitate long-term recording of strain and temperature readings from the VW strain gages installed within the CIP concrete portion of the bridge deck. This system consisted of two dataloggers, two VW interfaces, six multiplexers, two storage modules, and two batteries. A schematic of this system is provided in Figure 5.1. All of the components used in this system were supplied by Campbell Scientific, Inc. A general description along with some of the specifications for each component are provided in Appendix C. The multiplexers installed in this system were AM16/32 Relay Multiplexers and were numbered 1 through 6 (from south to north). Each strain gage was connected to one of the six multiplexers used in this system. The multiplexers each had the capacity to monitor 16 differential sensors that require excitation, i.e., 16 VW strain gages, along with the differential thermistor of each gage. Thus, the use of six multiplexers enabled monitoring of 96 instruments with this DAQ system. A total of 98 instruments were installed in the bridge, however two of these instruments are not being measured. These extra gages were installed in case some of the gages were damaged during casting of the CIP concrete deck. The initial channel assignment for each strain gage is provided in Tables 5.1 though 5.6. The signal cable from each multiplexer was connected to one of the two AVW4 VW Interfaces used in this system. The VW Interfaces are needed to convert the differential strain and temperature measurements obtained from the VW strain gage to single-ended measurements that can be read by a datalogger. Up to four multiplexers can be connected to each VW Interface. These VW interfaces were numbered 1 and 2. Multiplexers 1 through 3 were connected to VW interface 1 and Multiplexers 4 through 6 were connected to VW interface 2. Each VW interface was connected to one CR-10X datalogger. These dataloggers were programmed using the PC400 Software to measure the strain gages connected to the multiplexers. The initial programs that were downloaded into the dataloggers are provided in Appendix E of this report. The data received from the strain gages was stored in the SM16M Storage Module that was connected to each datalogger. Each datalogger was powered by a PS100 12V Rechargeable Battery. These batteries were originally only intended to provide the dataloggers with DC power and provide a reserve power source in the case of a power outage. However, AC power was not immediately provided at the site, therefore for a period of time these batteries were the only source of power. During this time, both dataloggers were connected to one of the batteries while the other battery was charged. After a period of approximately two weeks the fully charged battery was brought to the bridge and swapped with the other battery. This process was to continue until the site was supplied with AC power at which point each battery would again be connected to one datalogger and would continually supply the datalogger with DC power, however, as of June 2006 the site had not been supplied with AC power. 5.2 Conduit System The cables used in the DAQ system were housed within a galvanized steel conduit system that was installed by the contractor. A plan view of the conduit is provided in Figure
45 Complete plans for this conduit system are shown on page 26 of the Bridge Plans provided in Appendix A. This conduit system was completely sealed prior to pouring the CIP concrete to prevent corrosive or mechanical damage to the cables or system components. The individual wires for each of the instruments were typically spliced to a larger cable that traveled through the conduit to the multiplexers. This was less expensive and more practical than running each individual wire through the conduit. 17-pair and 6-pair shielded cables were used as necessary to accommodate the total number of instruments at each instrumented location. The cables above Joint #1 were labeled 6-#, the cables above Joint #2 were labeled 5-#, and the cables above Joint #3 were labeled 4-#. Tables 5.8 through 5.22 identify the instruments connected to each cable. Figure 5.3 shows a plan view of the cables within the bridge deck. Table 5.7 summarizes the location of each cable relative to the longitudinal joints and the multiplexer box to which each cable traveled. The spliced portions of the cables were housed within relatively large steel boxes, as shown in Figure 5.4. The conduit traveled from the instrumented locations adjacent to the precast member joints to the eastern side of the east pier cap at which point the conduit then traveled down through the precast sections to steel boxes mounted on the eastern face of the pier cap, as shown in Figure 5.5. The portion of the conduit located within the CIP concrete had an inside diameter of 1.5 inches. Each of the large boxes mounted on the eastern pier cap was used to house two multiplexers. These boxes were 10 in. wide, 12 in. tall, and 5 in. deep which provided adequate room for two multiplexers located side by side. The boxes were numbered 1 through 3 from south to north (from left to right in Figure 5.5). The locations of the multiplexers within these boxes are shown in Figure 5.6. The multiplexers were mounted on plywood that was secured in place against the back of the boxes using Liquid Nail all-purpose adhesive. A 3-inch inside diameter conduit traveled from the multiplexer boxes along the underside of the bridge to the abutment. From there the conduit originally traveled through the abutment underground to a cabinet that was intended to house the remainder of the DAQ system, however, this portion of the conduit was damaged during construction, preventing its use. A temporary cabinet was set up next to the abutment, as shown in Figure 5.7, to house the DAQ system until new conduit was installed. A new conduit was planned to travel north around the front of the abutment and underground to the cabinet that was to be used to permanently house the remainder of the DAQ system, however, as of June 2006 this new portion of the conduit had not yet been installed. The proposed new conduit is included in the plan view of the conduit provided in Figure 5.2. A photograph of the permanent DAQ cabinet is shown in Figure Long-term Data Collection The dataloggers were programmed to take strain and temperature readings from all 96 VW strain gages starting at midnight of each day and again every two hours. This provided information on the influence of temperature and solar radiation, which vary throughout the day, on the behavior of the bridge. The recorded data was stored in the SM16M Storage Modules that were attached to each datalogger. For this application, it was not necessary to connect the two dataloggers to each other because there was no need for communication between them. However it was important that the clocks within each datalogger were synchronized so that both dataloggers took measurements at the same time. The bridge was located within relatively close proximity to the U of MN campus therefore the data was downloaded about once a month. This was done by driving to the site and 33
46 swapping the two storage modules that were connected to the dataloggers with two empty storage modules. The storage modules containing the data were then brought to the U of MN where the data was downloaded onto a computer. During the period of time when the site was without power, the data was downloaded every time the batteries were swapped, which was approximately every two weeks. 34
47 Chapter 6 Summary and Future Work 6.1 Summary The use of prefabricated bridge superstructure systems has many advantages over conventional bridge construction. These systems generally reduce the duration of construction time, which minimizes traffic disruption and increases work-zone safety. This has inspired numerous research programs to develop new superstructure systems or improve existing systems to enable them to achieve the benefits associated with prefabricated construction. One system that has recently been developed is the Mn/DOT Inverted-T Precast Slab System. This system was inspired by the French Poutre Dalle System that was observed during a scanning tour of prefabricated technologies in foreign countries. Several features of the design for this system were incorporated into the design of the Mn/DOT Inverted-T Precast Slab System. In addition, consultation from faculty at the University of Minnesota, as well as input from fabricators and contractors, led to several modifications to the design that would enhance the durability, performance, and constructibility of this new system. A major concern affecting the durability of precast bridge superstructure systems was the development longitudinal reflective cracking of the CIP concrete deck. The Mn/DOT Inverted-T Precast Slab System was designed to be less susceptible to the development of reflective cracking, however, additional modifications were made to further reduce the potential for the development of these cracks. The corners of the precast sections were chamfered to reduce stress concentrations within the CIP concrete. In addition, the thickness of the flanges was reduced to increase the thickness of the CIP concrete above the longitudinal joint. This increased the sections ability to share loads in the transverse direction. It was hoped that these modifications would further reduce the potential for the development of longitudinal reflective and therefore increase the durability of this system. The Mn/DOT Inverted-T Precast Slab System was initially implemented in two bridge projects. The first project was a bridge constructed in Center City, Minnesota (Mn/DOT Bridge No ), which was about 40 miles northeast of Minneapolis, Minnesota. The second project was a deck replacement for a bridge located in Beltrami County near Waskish Township in northern Minnesota (Mn/DOT Bridge No ). Instrumentation was installed in the bridge located in Center City (Mn/DOT Bridge No ) to monitor several behaviors that would allow the durability of the system to be evaluated. These behaviors included the development of longitudinal reflective cracking of the CIP concrete and continuous behavior over the piers for live load. 6.2 Benefits of the Mn/DOT Inverted-T Precast Slab System The precast sections of the Mn/DOT Inverted-T Precast Slab System eliminated the need for formwork to cast the CIP concrete deck and provided a working surface for placement of the deck reinforcement and CIP concrete. During the deck replacement of the Waskish Bridge (Mn/DOT Bridge No ), this improved constructibility reduced the impact of the bridge construction on the environment below the bridge. This improved constructibility also resulted in a reduction in overall construction time. The second stage of the Center City Bridge (Mn/DOT Bridge No ) was completed in 18 working days (23 total days). The first stage took longer because of delays caused by the installation of instrumentation in this portion of the 35
48 bridge. If the second stage of the bridge had been constructed using a traditional CIP slab-span type bridge system, it would have taken 20 working days (28 total days). Thus, if there were not delays caused by the installation of instrumentation, the Mn/DOT Inverted-T Precast Slab System would have shortened the construction time by 4 working days and 10 total days. This shorter construction time reduced traffic disruption and improved work-zone safety by shortening the amount of time that construction workers were exposed to this dangerous environment. It was hoped that the Mn/DOT Inverted-T Precast Slab System would provide a faster bridge construction process for a small premium over conventional bridge superstructure systems. The estimated costs for the two bridges built using the new superstructure system were compared to those of a traditional slab-span bridge to determine if the economic impact of this new system. This comparison is provided in Table 6.1. This table shows that the costs of the Waskish Bridge (Mn/DOT Bridge No ) and Center City Bridge (Mn/DOT Bridge No ) compared well with the cost of a traditional CIP slab-span bridge. There was an expectation that the rapid construction associated with this system, as well as the start-up costs for the precaster, would cause this system to be more expensive than a traditional slab-span bridge; however, the start-up costs should not recur as additional bridges of this type are built and future comparisons between costs should be made. 6.3 Preliminary Conclusions The Center City Bridge (Mn/DOT Bridge No ) was built during September of As of June 2006, analysis of the collected data and visual inspection of the bridge deck had indicated that no cracking had developed within the CIP concrete topping. No significant information about the continuous behavior of the bridge had been obtained during this period. It was expected that the majority of the information about the continuous behavior of the bridge would be obtained after the truck load test was performed. 6.4 Future Work The instrumentation in Mn/DOT Bridge No was to be monitored for a period of two years. A truck load test was planned to be performed on the bridge during this time period to obtain more information on the continuous behavior of the bridge. In addition to the field testing, a laboratory test and finite element analysis were to be conducted. The objective of the laboratory test was to investigate the effect of several design modifications on the behavior of the bridge. The modifications were made to further increase the durability and constructibility of the system. In addition, the test provided a means to investigate behaviors that could not be investigated with the instrumented bridge in the field such as composite action and loss of prestressing force. The laboratory experiment was to include a full-scale specimen with two spans and two precast sections in each span. Reinforcement details and other aspects of the design were to be varied within each precast section and each span to allow for a more thorough investigation of variations of several parameters including precast section flange thickness, roughened surfaces, continuity steel, horizontal shear reinforcement, and anchorage zone and confinement reinforcement. It was hoped that after complete analysis of the field data, along with completion of the laboratory tests and finite element analysis, final design recommendations could be made for the Mn/DOT Inverted-T Precast Slab System to be implemented in future projects to enhance the performance, constructibility, and durability of this bridge superstructure system. 36
49 References American Association of State Highway Transportation Officials (AASHTO). AASHTO LRFD Bridge Design Specifications, Third Edition. Washington, D.C.: Badie, Sameh S., Mounir R. Kamel, and Maher K. Tadros. "Precast Pretensioned Trapezoidal Box Beam for Short Span Bridges." PCI Journal, vol. 44, no.1 (January-February 1999): Buckner, C. Dale, and H. T. Turner. Performance Tests of Full Span Panel Form Bridges (Final Report 80-1c). (Baton Rouge, LA: Louisiana State University, Research and Development Section Louisiana Department of Transportation and Development, 1981). El-R y, Ahmed, et al. "Transverse Design of Adjacent Precast Prestressed Concrete Box Girder Bridges." PCI Journal, vol. 41, no.4 (July-August 1996): Fallaha, Sam, et al. "High Performance Precast Concrete NUDECK Panel System for Nebraska's Skyline Bridge." PCI Journal, vol. 49, no. 5, (September-October 2004): Freyermuth, C. "Design of Continuous Highway Bridges with Precast, Prestressed Concrete Girders." PCI Journal, vol. 14, no. 2 (March-April 1969): Hagen, Kevin, et al. "Development and Construction of a Precast Inverted T System for Expediting Minnesota Slab Span Bridge Projects." 2005 Concrete Bridge Conference. Hagen, Kevin. Development of Mn/DOT Precast Slab System. Presentation ed. Mn/DOT & FHWA Precast Slab System Workshop, September 8, Hays, C. O. Jr., R. L. Cox, Jr., and G. O. Obranic, Jr. Full Span Form Panels for Short Span Highway Bridges (Final Report U17F). (Gainesville, FL: Department of Civil Engineering, University of Florida, 1980) Hieber, David G., et al. State-of-the-Art Report on Precast Concrete Systems for Rapid Construction of Bridges (Draft Interim Report). (Seattle, WA: Department of Civil Engineering and Environmental Engineering, University of Washington, August 2004.) Huckelbridge, Arthur A. Jr., Hassan El-Esnawi, and Fred Moses. "Shear Key Performance in Multibeam Box Girder Bridges." Journal of Performance of Constructed Facilities, vol. 9, no. 4 (April 1995): Kamel, Mounir R., and Maher K. Tadros. "The Inverted Tee Shallow Bridge System for Rural Areas." PCI Journal, vol. 41, no. 5 (September-October 1996):
50 McDonagh, Michael D., and Kevin B. Hinkley. "Resolving Restraint Moments: Designing for Continuity in Precast Prestressed Concrete Girder Bridges." PCI Journal, vol. 48, no. 4 (April 2003): Minnesota Department of Transportation. Standard Specifications for Construction, 2000 Edition. Peterman, Robert J., and Julio A. Ramirez. "Behavior and Strength of Bridges with Full-Span Prestressed Concrete Form Panels." PCI Journal, vol. 43, no. 2 (March- April 1998): Peterman, Robert J., and Julio A. Ramirez. "Restraint Moments in Bridges with Full-Span Prestressed Concrete Form Panels." PCI Journal, vol. 43, no.1 (January-February 1998): "Prefabricated Bridge Elements and Systems in Japan and Europe- Summary Report." FHWA International Technology Exchange Programs. May Ralls, Mary Lou, Ronald D. Medlock and Sharon Slagle. "Prefabricated Bridge National Implementation Initiative." 2002 Concrete Bridge Conference. Saleh, Mohsen A., Amin Einea, and Maher K. Tadros. "Creating Continuity in Precast Girder Bridges." Concrete International, vol. 17, no. 8 (August 1995): Tadros, M.K. and Baishya, M.C., Rapid Replacement for Bridge Decks, NCHRP Report 407, National Cooperative Highway Research Program, Washington D.C., Yamane, Takashi, et al. "Full Depth Precast, Prestressed Concrete Bridge Deck System." PCI Journal, vol. 43, no. 3 (May-June 1998):
51 Tables 39
52 Table 2.1 Cross sections of different precast sections (Kamel and Tadros, 1996) Typical Section Width (in.) Depth (in.) Span range (ft.) Solid Slab 36 to to 18 up to 30 Voided Slab 36 to to to 60 Multi-stem to to 60 Double Stem 60 to to to 60 Single Stem 48 to to to 80 Box Girder 36 to to to 100 Deck Bulb Tee 48 to to to 110 I-Girder 18 to to to 80 Table 2.2 Dimensions of form panels and CIP concrete for the bridges visited in Florida during the study performed by Hays, Jr. et al. (1980) (variables t 1, t 2, and t 3 are shown in Figures 2.10 and 2.11) Thickness Panel Span (in.) Width Bridge (ft.) t 1 t 2 t 3 (in.) Year/Comments Lloyd Creek Bridge / Neg. Mom Cracks SR 59, Jefferson County Less extensive Hurricane Creek Bridge SR2A, Holmes County Sanders Creek Bridge / Long. Cracks SR 20, Okalossa County Less extensive Fort Gasden Creek SR 65, Liberty County Black Creek Bridge SR 65, Liberty County Sampson River Bridge / Neg. Mom. Cracks SR 18, Bradford County less extensive Harney Canal Bridge - C / Exstensive random surface cracking US 301, Hillsborough County Widest longitudinal cracks Cypress Creek Bridge / Extensive random cracking Kings Point Boulevard No longitudinal cracking Hillsborough County Very light traffic Shingle Creek Bridge / Less long. cracking when joint SR 528A, Orange County near center of traffic lane 40
53 Table 2.3 Reinforcement details and dimensions of the laboratory specimen used in the study performed by Buckner and Turner (1981) ( S = flat panel, B = beveled panel) (variables t d and t p are shown in Figures 2.13 and 2.14) Specimen Mark t d (in.) t p (in.) Transverse Reinforcement Left Half Right Half No. of Strands Per Panel S " o.c. 12" o.c. 10 B " o.c. 12" o.c. 10 S " o.c. 12" o.c. 8 B " o.c. 12" o.c. 8 S " o.c. 12" o.c. 8 B " o.c. 12" o.c. 8 Table 3.1 Compressive concrete strength of concrete used for precast sections in the superstructure of Stage 1 of Mn/DOT Bridge No Date Poured Release Strength (psi) 28 Day Strength (psi) 8/18/ /19/ /22/ /24/ /25/ /29/ Table 3.2 Compressive concrete strength of CIP concrete used in Stage 1 of the superstructure for Mn/DOT Bridge No Date Poured 7 Day Strength (psi) 10 Day Strength (psi) 28 Day Strength (psi) 9/19/
54 Table 4.1 Coordinates of the VW embedment strain gages installed directly above the precast longitudinal joints (see Figure 4.1 for coordinate system, Z is depth within cross section from bottom of bridge) Joint #1 Joint #2 Joint #3 Instrument No. X (in.) Y (in.) Z (in.) CJ CJ CJ CJ CJ CJ CJ CJ CJ CJ CJ CJ CJ CJ CJ
55 Table 4.2 Coordinates of the VW embedment strain gages installed directly above the precast section web corners (see Figure 4.1 for coordinate system, Z is depth within cross section from bottom of bridge) Joint #1 Joint #2 Joint #3 Instrument No. X (in.) Y (in.) Z (in.) CJ CJ CJ CJ CJ CJ CJ CJ CJ CJ CJ CJ CJ CJ CJ CJ CJ CJ CJ CJ CJ CJ CJ CJ CJ CJ CJ CJ CJ CJ
56 Table 4.3 Coordinates of the VW spot-weldable strain gages installed on longitudinal reinforcement (see Figure 4.1 for coordinate system, Z is depth within cross section from bottom of bridge) Joint #1 Joint #2 Joint #3 Web #1 Web #2 Instrument No. X (in.) Y (in.) Z (in.) SJ SJ SJ SJ SJ SJ SJ SJ1-C SJ1-C SJ1-C SJ SJ SJ SJ SJ SJ SJ SJ SJ SJ SJ SJ SJ SJ SJ SJ SW SW SW SW SW SW
57 Table 4.4 Coordinates of the VW spot-weldable strain gages installed on the transverse hooks of the precast sections (see Figure 4.1 for coordinate system, Z is depth within cross section from bottom of bridge) Joint #1 Joint #2 Joint #3 Instrument No. X (in.) Y (in.) Z (in.) SJ1-5T SJ1-5T SJ1-5T SJ1-5T SJ1-5T SJ1-5T SJ1-5T SJ2-5T SJ2-5T SJ2-5T SJ2-5T SJ2-5T SJ2-5T SJ2-5T SJ3-5T SJ3-5T SJ3-5T SJ3-5T SJ3-5T SJ3-5T SJ3-5T
58 Table 5.1 Channel assignments for Multiplexer #1 Multiplexer #1 Ch. Gage # 1.1- CJ CJ CJ CJ CJ CJ SJ SJ SJ SJ SJ SJ SJ SJ SJ SJ Table 5.2 Channel assignments for Multiplexer #2 Multiplexer #2 Ch. Gage # 2.1- SJ1-5T SJ1-5T SJ1-5T SJ1-5T SJ1-5T SJ1-5T SJ1-5T CJ CJ CJ CJ CJ CJ CJ CJ CJ
59 Table 5.3 Channel assignments for Multiplexer #3 Multiplexer #3 Ch. Gage # 3.1- CJ CJ CJ CJ CJ CJ SJ SJ SJ SJ SJ SJ SJ1-C SJ SJ SJ Table 5.4 Channel assignments for Multiplexer #4 Multiplexer #4 Ch. Gage # 4.1- SJ2-5T SJ2-5T SJ2-5T SJ2-5T SJ2-5T SJ2-5T SJ2-5T CJ CJ CJ CJ CJ CJ CJ CJ CJ
60 Table 5.5 Channel assignments for Multiplexer #5 Multiplexer #5 Ch. Gage # 5.1- CJ CJ CJ CJ CJ CJ SJ SJ SW SW SW SJ SJ SW SW SW Table 5.6 Channel assignments for Multiplexer #6 Multiplexer #6 Ch. Gage # 6.1- SJ3-5T SJ3-5T SJ3-5T SJ3-5T SJ3-5T SJ3-5T SJ3-5T CJ CJ CJ CJ CJ CJ CJ CJ CJ
61 Table 5.7 Locations of the cables in the conduit relative to the precast longitudinal joints (see Figure 5.3 for plan view of cables) Joint # Span Cable # Multiplexer Box # Cable 6-1 Cable 6-2 Joint #1 Center Span Cable 6-3 Box #1 Cable 6-4 Joint #1 East Span Cable 6-5 Cable 6-6 Cable 5-1 Cable 5-2 Joint #2 Center Span Cable 5-3 Box #2 Cable 5-4 Joint #3 Center Span Cable 5-5 Cable 4-1 Cable 4-2 Box #3 Cable 4-3 Cable
62 Table 5.8 Instrumentation connected to Cable 6-1 SJ1-5T-1 SJ1-5T-2 SJ1-5T-3 SJ1-5T-7 SJ1-5T-5 SJ1-5T-6 SJ1-5T-4 CJ Cable 6-1 Instrument- Cable red-green black-white green-green white-blue red-red black-orange green-red white-brown red-green black-yellow green-green white-brown red-red black-black green-black white-yellow red-red black-yellow green-blue white-black red-black black-green green-red white-white red-black black-orange green-blue white-red red-red black-green green-brown white-black 50
63 Table 5.9 Instrumentation connected to Cable 6-2 CJ CJ CJ CJ CJ CJ CJ CJ Cable 6-2 Instrument- Cable red-green black-blue green-red white-orange red-red black-brown green-green white-yellow red-green black-brown green-red white-black red-black black-yellow green-red white-yellow red-blue black-black green-black white-green red-red black-white green-black white-green red-red black-white green-black white-orange red-blue black-red green-red white-green 51
64 Table 5.10 Instrumentation connected to Cable 6-3 CJ CJ CJ CJ CJ SJ CJ Cable 6-3 Instrument-Cable red-green black-white green-green white-blue red-red black-orange green-red white-brown red-green black-yellow green-green white-brown red-red black-black green-black white-yellow red-red black-yellow green-blue white-black red-black black-green green-red white-white red-black black-orange green-blue white-red 52
65 Table 5.11 Instrumentation connected to Cable 6-4 SJ SJ SJ Cable 6-4 Instrument-Cable red-black black-green green-green white-white red-red black-black green-green white-white red-red black-black green-green white-white Table 5.12 Instrumentation connected to Cable 6-5 SJ SJ SJ Cable 6-5 Instrument-Cable red-black black-green green-brown white-black red-black black-blue green-black white-yellow red-red black-black green-black white-white 53
66 Table 5.13 Instrumentation connected to Cable 6-6 SJ SJ SJ Cable 6-6 Instrument-Cable red-black black-green green-brown white-black red-black black-blue green-black white-yellow red-red black-black green-black white-white 54
67 Table 5.14 Instrumentation connected to Cable 5-1 SJ2-5T-1 SJ2-5T-2 SJ2-5T-3 SJ2-5T-7 SJ2-5T-5 SJ2-5T-6 SJ2-5T-4 CJ Cable 5-1 Instrument- Cable red-green black-white green-green white-blue red-red black-orange green-red white-brown red-green black-yellow green-green white-brown red-red black-black green-black white-yellow red-red black-yellow green-blue white-black red-black black-green green-red white-white red-black black-orange green-blue white-red red-red black-green green-brown white-black 55
68 Table 5.15 Instrumentation connected to Cable 5-2 CJ CJ CJ CJ CJ CJ CJ CJ Cable 5-2 Instrument- Cable red-green black-blue green-red white-orange red-red black-brown green-green white-yellow red-green black-brown green-red white-black red-black black-yellow green-red white-yellow red-blue black-black green-black white-green red-red black-white green-black white-orange red-blue black-red green-red white-green red-brown black-black green-black white-white 56
69 Table 5.16 Instrumentation connected to Cable 5-3 CJ CJ CJ CJ CJ CJ Cable 5-3 Instrument-Cable red-green black-white green-green white-blue red-red black-orange green-red white-brown red-green black-yellow green-green white-brown red-red black-black green-black white-yellow red-red black-yellow green-blue white-black red-black black-green green-red white-white Table 5.17 Instrumentation connected to Cable 5-4 SJ SJ SJ Cable 5-4 Instrument-Cable red-black black-green green-brown white-black red-black black-blue green-black white-yellow red-red black-black green-black white-white 57
70 Table 5.18 Instrumentation connected to Cable 5-5 SJ SJ SW SW SW Cable 5-5 Instrument- Cable red-black black-green green-brown white-black red-black black-blue green-black white-yellow red-red black-black green-black white-white red-red black-yellow green-black white-orange red-red black-brown green-green white-red 58
71 Table 5.19 Instrumentation connected to Cable 4-1 SJ3-5T-1 SJ3-5T-2 SJ3-5T-3 SJ3-5T-7 SJ3-5T-5 SJ3-5T-6 SJ3-5T-4 CJ Cable 4-1 Instrument- Cable red-green black-white green-green white-blue red-red black-orange green-red white-brown red-green black-yellow green-green white-brown red-red black-black green-black white-yellow red-red black-yellow green-blue white-black red-black black-green green-red white-white red-black black-orange green-blue white-red red-red black-green green-brown white-black 59
72 Table 5.20 Instrumentation connected to Cable 4-2 CJ CJ CJ CJ CJ CJ CJ CJ Cable 4-2 Instrument- Cable red-green black-blue green-red white-orange red-red black-brown green-green white-yellow red-green black-brown green-red white-black red-black black-yellow green-red white-yellow red-blue black-black green-black white-green red-red black-white green-black white-orange red-blue black-red green-red white-green red-brown black-black green-black white-white 60
73 Table 5.21 Instrumentation connected to Cable 4-3 CJ CJ CJ CJ CJ CJ Cable 4-3 Instrument-Cable red-green black-white green-green white-blue red-red black-orange green-red white-brown red-green black-yellow green-green white-brown red-red black-black green-black white-yellow red-red black-yellow green-blue white-black red-black black-green green-red white-white Table 5.22 Instrumentation connected to Cable 4-4 SW SW SW Cable 4-4 Instrument-Cable red-black black-green green-brown white-black red-black black-blue green-black white-yellow red-red black-black green-black white-white 61
74 Table 6.1 Superstructure cost comparison of bridges built with the Mn/DOT Inverted- T Precast Slab System to traditional slab-span bridges Waskish Bridge (Mn/DOT Bridge No ) Center City Bridge (Mn/DOT Bridge No ) Traditional Slab-span Bridge $64/S.F. $64/S.F. $60-$65/S.F. 62
75 Figures 63

 Figure 1.")
76 Precast Concrete Panel Cast-in-place Concrete Deck Steel Girder Figure 1.1 Partial-depth concrete decks prefabricated on steel or concrete beams (FHWA, 2004) Figure 1.2 Cross section of Poutre Dalle System (Hagen, 2005) 64


77 Figure 1.3 Photograph of precast section used in Poutre Dalle System (Hagen, 2005) Figure 2.1 Full-Depth Precast Prestressed Bridge Deck System (Yamane et al., 1998) 65
78 Figure 2.2 Cross section of a partial-depth precast concrete panel system (Tadros and Baishya, 1998) Figure 2.3 Cross section of a box girder bridge system with transverse post-tensioning (El- R y et al., 1996) 66
79 (Girder not shown, see Figure 2.1) Figure 2.4 Elevation view of longitudinal post-tensioning in a Full-Depth Precast Prestressed Bridge Deck System (dimensions are in mm) (Yamane et al., 1998) Grouted Shear Key Figure 2.5 Typical geometry of a shear key used in a box girder system (Huckelbridge, Jr. et al., 1995) 67
80 Figure 2.6 Typical geometry of a shear key used in a Full-Depth Precast Prestressed Panel System (dimensions are in mm) (Yamane et al., 1998) Deck Reinforcement Pier Centerline Cast-in-place Concrete Deck Diaphragm Reinforcement I-Girders Cast-in-place Diaphragm Pier Cap Figure 2.7 Interior joint detail of a precast concrete bridge girder made continuous using the Conventional Reinforcement Method (Saleh et al., 1995) 68
81 Longitudinal Posttensioning Tendons Cast-in-place Concrete Topping End Block Cast-in-place Joint End Block Figure 2.8 Elevation view of a bridge made continuous over the pier through the use of longitudinal post-tensioning (Saleh et al., 1995) Figure 2.9 Elevation view of the lab specimen used in the study performed by Hays, Jr. et al. (1980) 69
82 Figure 2.10 Cross-sectional view of the standard span of the lab specimen used in the study performed by Hays, Jr. et al. (1980) Figure 2.11 Cross-sectional view of the alternative span of the lab specimen used in the study performed by Hays, Jr. et al. (1980) 70
 Figure 2.13 Cross section of the flat panel laboratory specimen used in study performed by Buckner and Turner (1981) (see Table 2.")
83 #4 12 (not connected to precast sections) Figure 2.12 Cross section of the panel detail recommended by Hays, Jr. et al. (1980) Figure 2.13 Cross section of the flat panel laboratory specimen used in study performed by Buckner and Turner (1981) (see Table 2.3 for notation) 71

 15 Cross-sectional view of the loading apparatus")
84 Figure 2.14 Cross section of the beveled-edge laboratory specimen used in study performed by Buckner and Turner (1981) (see Table 2.3 for notation) Figure 2.15 Cross-sectional view of the loading apparatus used in the study performed by Buckner and Turner (1981) 72
85 (Panels are 4 ft. wide and 21 ft. long) Figure 2.16 Cross section of the laboratory specimen used in study performed by Peterman and Ramirez (1998a, 1998b) Figure 2.17 Cross section and reinforcement details for a tee beam used in the IT System (Kamel and Tadros, 1996) 73
86 Figure 2.18 Cross section of the IT System (dimensions are in mm) (Kamel and Tadros, 1996) Figure 2.19 Cross section of the closed trapezoidal box beam (dimensions are in mm) (Badie et al., 1999) 74
87 Figure 2.20 Cross section of the open trapezoidal box beam (dimensions are in mm) (Badie et al., 1999) Chamfered Corners Roughened Surfaces Chamfered Corner Prestressing Pattern Transverse Hook Figure 3.1 Cross-sectional view of interior inverted-t precast section concept 75
88 Prestressing Pattern Transverse Reinforcement for CIP Concrete Rail Figure 3.2 Cross-sectional view of exterior inverted-t precast section concept Figure 3.3 Photograph of the transverse hooks of the precast sections 76
 #8 bars over the Piers Caulk over")

89 Longitudinal Deck Steel Reinforcement Cage Additional Reinforcement of (4) #8 bars over the Piers Caulk over Longitudinal Joint Figure 3.4 Cross-sectional view of the precast longitudinal joint detail Figure 3.5 Photograph of formwork with indented inner surface 77
90 Horizontal Shear Reinforcement Anchorage Zone Reinforcement Confinement Reinforcement Figure 3.6 Cross-sectional view of an interior inverted-t precast section detailing transverse reinforcement within the precast sections Flanges of Precast Sections Large Voids created by the Blockedout Portions of the Precast Sections Pier cap Figure 3.7 Plan view of precast section layout showing blocked-out portions of the precast section flanges 78


91 Figure 3.8 Photograph of the reinforcement cage installed above the precast longitudinal joint Figure 3.9 Elevation view of Mn/DOT Bridge No (Hagen, 2005) 79
92 Bike Path J- Rail Stage 1 N Stage Construction Joint in Cast-in-place Concrete Deck Pier Caps Stage 2 Long. Joints Figure 3.10 Plan view of Mn/DOT Bridge No with construction stages and construction joint highlighted 80
93 Figure 3.11 Cross-sectional view and reinforcement details for an interior inverted-t precast section used in Mn/DOT Bridge No (the dimensions of the reinforcement are taken from the outside of the bar) 81

94 Approach Panel (Cast with Cast-inplace Concrete Deck) Polystyrene Precast Section Elastomeric Bearing Pad Reinforcing Dowels Abutment Figure 3.12 Connection detail at abutment, bridge deck, and approach panel Precast Sections Polystyrene Elastomeric Bearing Pad Pier Cap Reinforcing Dowel Blocked-out Portion of Precast Sections (see Figure 3.7) Figure 3.13 Connection detail at pier cap 82
95 Bike Path All instrumentation located within this portion of the bridge J- Rail +X Dir. Origin of Coordinate System +Y Dir. Stage 1 N Pier Caps Stage Const. Joint in Slab Stage 2 Long. Joints Figure 4.1 Plan view of Mn/DOT Bridge No with instrumented portion highlighted Web Corner of Precast Section Flange Corners of Precast Sections Corners Longitudinal Joint Figure 4.2 Cross-sectional view of precast longitudinal joint 83
96 Bike Path J- Rail N Locations of instrumentation in the longitudinal joints Joint 3 Joint 2 Joint 1 Full-width Shoulder Westbound Lane Figure 4.3 Plan view of Stage 1 of the bridge construction for Mn/DOT Bridge No highlighting the instrumented joints Figure 4.4 Photograph of Geokon Model VCE-4200 VW Embedment Strain Gage 84
97 Web of Precast Section Reinforcement Cage Uncoated Rebar Transverse Hooks Longitudinal Joint Ties Web of Precast Section Figure 4.5 Plan view of instrumentation detail for VW embedment strain gages located directly above precast longitudinal joints Figure 4.6 Photograph of VW embedment strain gage tied to uncoated rebar 85


98 Longitudinal Joint Figure 4.7 Photograph of VW embedment strain gages installed above precast longitudinal joints 86
99 Web of Precast Section Ties Epoxy-coated Rebar tied to Longitudinal Deck Steel (not shown) Flange of Precast Section Longitudinal Joint Flange of Precast Section Transverse Deck Steel Web of Precast Section Figure 4.8 Plan view of instrumentation detail for VW embedment strain gages located directly above the precast section web corners 87


100 Row of 10 VW embedment strain gages above precast web corners Row of 5 VW embedment strain gages directly above the longitudinal joint Figure 4.9 Cross-sectional view of instrumentation detail for VW embedment strain gages at each instrumented joint Precast Section Web Corners Figure 4.10 Photograph of VW embedment strain gages installed above precast section web corners and above precast longitudinal joint 88


101 Figure 4.11 Photograph of Geokon Model VK-4150 VW Spot-weldable Strain Gage Midspan of the middle span Center of interior support West side of exterior support Midspan of the eastern end span West side of interior support East side of interior support Figure 4.12 Elevation view of Mn/DOT Bridge No showing locations of instrumentation along the length of the bridge for continuous behavior over the piers 89
102 Represents 2 VW spot-weldable strain gages through depth Represents 3 VW spot-weldable strain gages through depth Joint 3 Joint 2 Web 2 Represents 1 VW spotweldable strain gage on longitudinal deck reinforcement Web 1 N Joint 1 Figure 4.13 Plan view of Stage 1 of the bridge construction of Mn/DOT Bridge No showing locations of instrumentation for continuous behavior over the piers VW spot-weldable strain gages Longitudinal Deck Steel Transverse Deck Steel Reinforcement Cage Figure 4.14 Cross-sectional view of instrumentation detail for locations with 3 VW spotweldable strain gages ( in Figure 4.13) 90
103 VW spot-weldable strain gages Additional reinforcement added over the piers Figure 4.15 Cross-sectional view of instrumentation detail for locations with 2 VW spotweldable strain gages ( in Figure 4.13) Figure 4.16 Photograph of VW spot-weldable strain gage welded to longitudinal reinforcement 91


104 Figure 4.17 Photograph of VW spot-weldable strain gage with waterproofing and steel cover Figure 4.18 Photograph of 3 VW spot-weldable stain gages installed on the longitudinal reinforcement at east end of east span 92

105 2 VW Spotweldable Strain gages Figure 4.19 Photograph of 2 VW spot-weldable strain gages on longitudinal reinforcement located at the centerline of the pier cap Figure 4.20 Photograph of transverse hooks of adjacent precast sections 93


106 Web of Precast Section Flange of Precast Section VW Spotweldable Strain Gages Longitudinal Joint Flange of Precast Section Transverse Hooks Web of Precast Section Figure 4.21 Plan view of instrumentation detail for VW spot-weldable strain gages on transverse hooks Figure 4.22 Photograph of VW spot-weldable strain gages on transverse hooks 94
107 Location of Gage (Longitudinal): (See Figure 4.12) 1 = Adjacent to E Abutment 2 = Midspan of E Span 3 = Eastern Side of E Pier Cap C = Center of E Pier Cap 4 = Western Side of E Pier Cap 5 = Midspan of Center Span Type of VW Strain Gage: C = VW Embedment Strain Gage (Concrete) S = VW Spot-weldable Strain Gage (Steel Reinforcement) Location of Gage (Transverse): Indicates the number of the gage at that location (longitudinal) of the bridge and height (within depth of cross section). Numbering increases from south to north. CJ Proximity of Gage: J# = Gage is installed above Longitudinal Joint (See Figure 4.12) o 1 = Long. Joint #1 o 2 = Long. Joint #2 o 3 = Long. Joint #3 W# = Gage is installed above Web of a Precast Section (See Figure 4.12) o 1 = Web #1 o 2 = Web #2 Location of Gage (Within Depth of the Cross Section): C Gages- 1 = Directly Above Long. Joint 2 = Above Precast Section Web Corners S Gages- T = Transverse Hook 1 = Bottom Long. R/F of R/F Cage 2 = Top Long. R/F of R/F Cage 3 = Long. Deck R/F Figure 4.23 Labeling scheme used for gages installed in Mn/DOT Bridge No
108 Figure 5.1 Schematic of the data acquisition system used to monitor instrumentation installed in Mn/DOT Bridge No
109 N Permanent Data Acquisition Cabinet Pier Cap Proposed New Conduit Abutment Original Conduit Deck Const. Joint Below Deck Temporary Data Acquisition Cabinet Figure 5.2 Plan view of the conduit system Cables 4-1 through 4-4 Joint #3 Cables 5-1 through 5-4 Cable 5-5 (Below Deck) N Joint #2 Cables 6-1 through 6-4 Pier Cap Cable 6-6 Joint #1 Cable 6-5 Figure 5.3 Plan view of cables within conduit system 97


110 Figure 5.4 Photograph of embedded wiring junction box located above precast longitudinal joint Figure 5.5 Photograph of multiplexer boxes located on the east face of the east pier cap (north is to the right) 98


111 North Box #1 Box #2 Box #3 Mult. #1 Mult. #2 Mult. #3 Mult. #4 Mult. #5 Mult. #6 Figure 5.6 Locations of the multiplexers within the boxes on the east face of the east pier cap Figure 5.7 Photograph of temporary data acquisition system cabinet 99


112 Figure 5.8 Photograph of permanent data acquisition system cabinet 100
113 Appendix A Bridge Plans
114 A - 1
115 A - 2
116 A - 3
117 A - 4
118 A - 5
119 A - 6
120 A - 7
121 A - 8
122 A - 9
123 A - 10
124 A - 11
125 A - 12
126 A - 13
127 A - 14

128 A - 15
129 A - 16

130 A - 17
131 A - 18
132 A - 19
133 A - 20
134 A - 21
135 A - 22
136 A - 23
137 A - 24
138 A - 25
139 A - 26
140 A - 27
141 A - 28
142 A - 29

143 A - 30
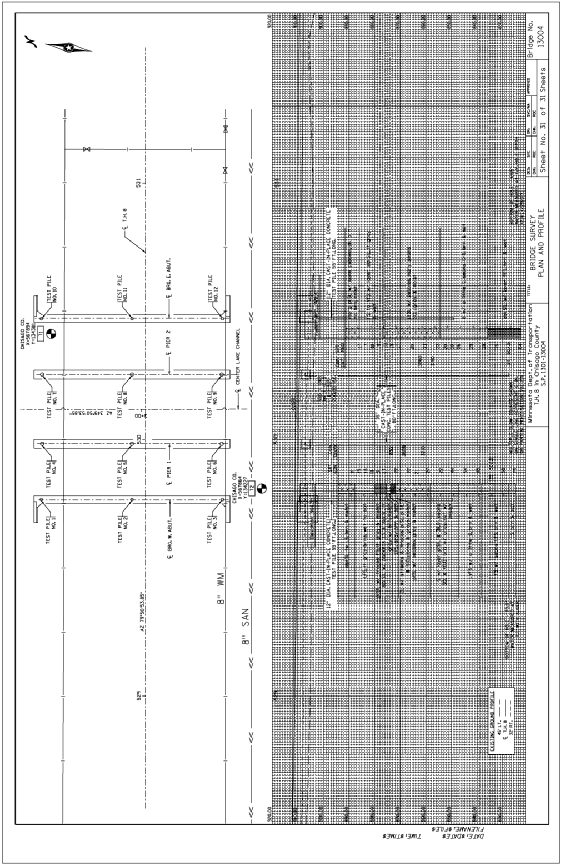
144 A - 31
145 Appendix B Design Calculations
146 B.1 Design of Interior Composite Section The inverted-t sections of the Mn/DOT Inverted-T Precast Slab System were designed to behave as a simple span under self weight and the weight of the CIP concrete deck. After the CIP concrete of the deck had cured, the deck then behaved continuously for live loads over the interior piers. The design of the inverted-t precast sections for Mn/DOT Bridge No was performed using a MathCAD Worksheet. This program allows the user to make iterative calculations rather easily. If one variable is changed, the program changes all of the calculations within the worksheet. This worksheet was originally written to be used for the design of I- girders, but it was modified to be applicable to the design of inverted-t sections. The remainder of Section B.1 presents the calculations for the design of an interior inverted-t precast section of the center span of Mn/DOT Bridge No B.1.1 Program Defaults and Inputs (B-2 through B-5) The first page of the calculations provided program defaults that allowed a user to select a beam size and strand size then provided them with the dimensions for the selected beam and strand. The rest of this section allowed the user to input material properties, additional geometry requirements (i.e., span length, etc.), loads, load factors, and the strand pattern design, all of which would be used later in the calculations. B - 1
147 B - 2

148 B - 3

149 B - 4
150 B - 5

151 B.1.2 Calculation of Section Properties (B-6 through B-9) This section of the calculations used the program defaults and user inputs from the first section to calculate the properties of the composite section. The properties that were calculated in this section included the area, moment of interia, and section moduli. B - 6
152 B - 7
153 B - 8
154 B - 9
155 B.1.3 Calculations of Moments and Shear Forces (B-10 through B-20) This section of the calculations used the section properties and user inputs to calculate the maximum moments and shear forces of which the composite section would be subjected. Moments and shear forces were calculated due to the self weight of the precast section, weight of the CIP concrete deck, weight of the barrier, and weight of the future wearing surface. In addition, the live load distribution factors were calculated and used to determine the maximum live load moments and shear forces. However, since the composite section was designed to behave continuously for live load, the live load moments and shears were also calculated based on continuous behavior using the BTBEAM program and then input into this worksheet. These live load moments and shears were used for the remainder of the calculations. The restraint moments were calculated by hand using the PCA Method and input into the worksheet at the end of this section. B - 10
156 B - 11
157 B - 12
158 B - 13

159 B - 14
160 B - 15
161 B - 16
162 B - 17
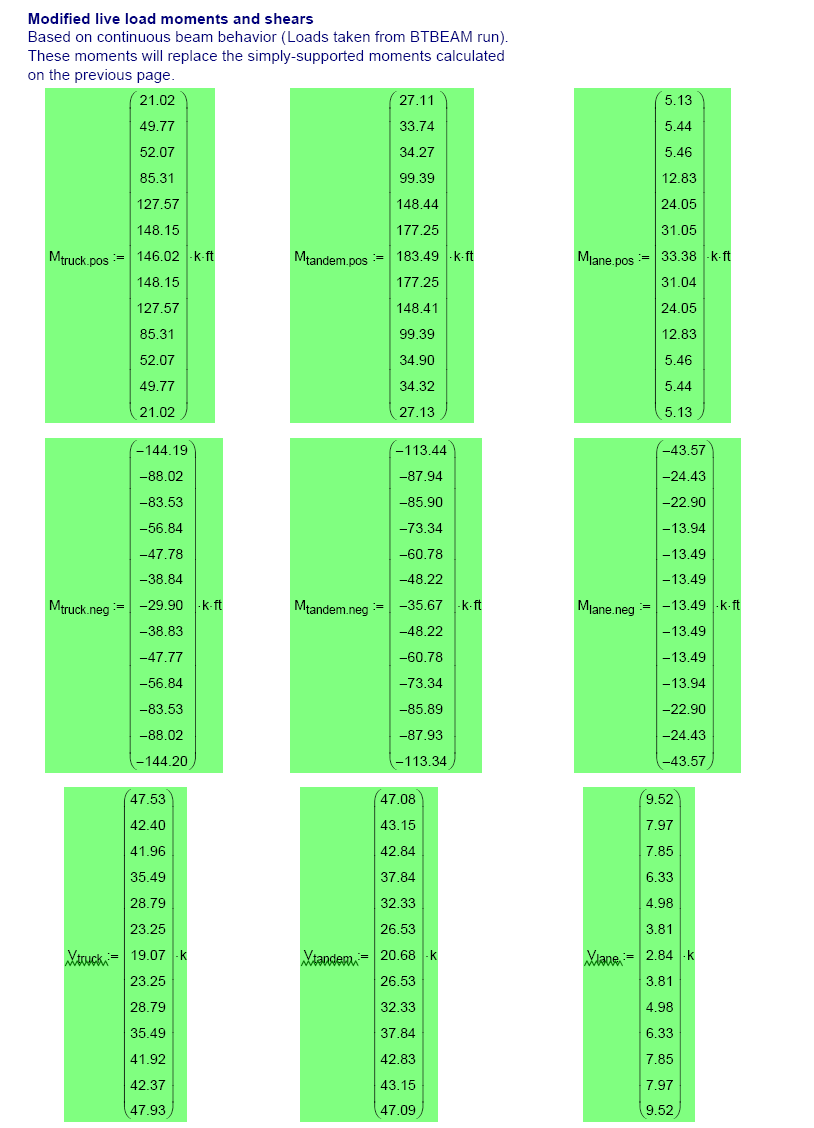
163 B - 18
164 B - 19

165 B - 20
166 B.1.4 Strength and Service Limit Checks (B-22 through B-39) This section of the calculations used the moments that had been calculated previously to calculate the stresses in the top and bottom of the precast section due to the self weight of the precast section, weight of the deck, weight of the barriers, weight of the future wearing surface, live loads, and restraint moments. In addition, prestress losses due to shrinkage, creep, and steel relaxation were calculated and then used to calculate the stresses in the top and bottom of the precast section due to the prestressing force. The calculated stresses were used to check the service limit states; maximum tensile stresses in the bottom of the precast section, and maximum compressive stresses in the top of the precast section. The stresses due to restraint moments were not considered during the service compression checks because it was felt that there was enough reserve capacity to say that each check was okay by inspection. The remainder of this section used the user inputs and section properties to calculate the design flexural capacity of the composite section. This capacity was compared to the maximum factored moment that would be applied to the section to ensure that the section had adequate flexural strength. An additional check was performed to ensure that there was enough steel reinforcement within the section to guard against abrupt flexural failure immediately after cracking. B - 21
167 B - 22
168 B - 23
169 B - 24
170 B - 25
171 B - 26
172 B - 27
173 B - 28

174 B - 29
175 B - 30
176 B - 31

177 B - 32

178 B - 33

179 B - 34
180 B - 35
181 B - 36
182 B - 37
183 B - 38

184 B - 39
185 B.1.5 Size and Spacing of Transverse Reinforcement (B-41 through B-65) This section of the calculations was used to determine the size and spacing of reinforcement to satisfy reinforcement requirements for anchorage zone, confinement, vertical shear, and horizontal (i.e., interface) shear. The requirements for anchorage zone were based on the dimensions of the section and the prestressing force, and the requirements for confinement reinforcement were based only on the dimensions of the section. The shear forces that had been calculated previously were used to calculate the maximum vertical shear force that would be exerted on the composite section. Two iterations were needed to accurately predict the vertical shear strength provided by the concrete. Once the design shear strength of the concrete was calculated, it was compared to the vertical shear demand to determine the amount and spacing of vertical shear reinforcement required. The remainder of this section was used to calculate the amount and spacing of horizontal shear reinforcement required. Following the calculations for transverse reinforcement requirements is a section that was used to calculate the camber and deflections of the composite section. This section is followed by a final design summary for an interior inverted-t precast section of the center span of Mn/DOT Bridge No B - 40
186 B - 41
187 B - 42
188 B - 43
189 B - 44
190 B - 45
191 B - 46
192 B - 47
193 B - 48
194 B - 49
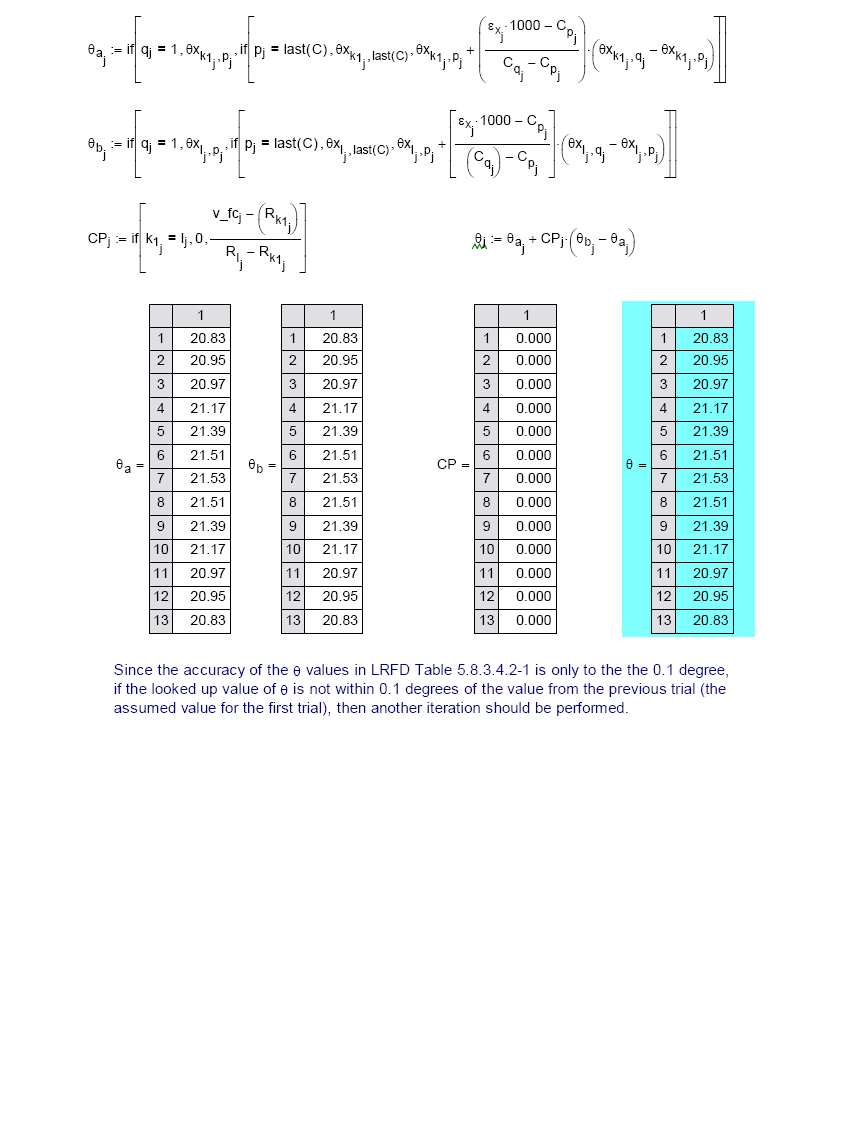
195 B - 50
196 B - 51

197 B - 52
198 B - 53
199 B - 54
200 B - 55
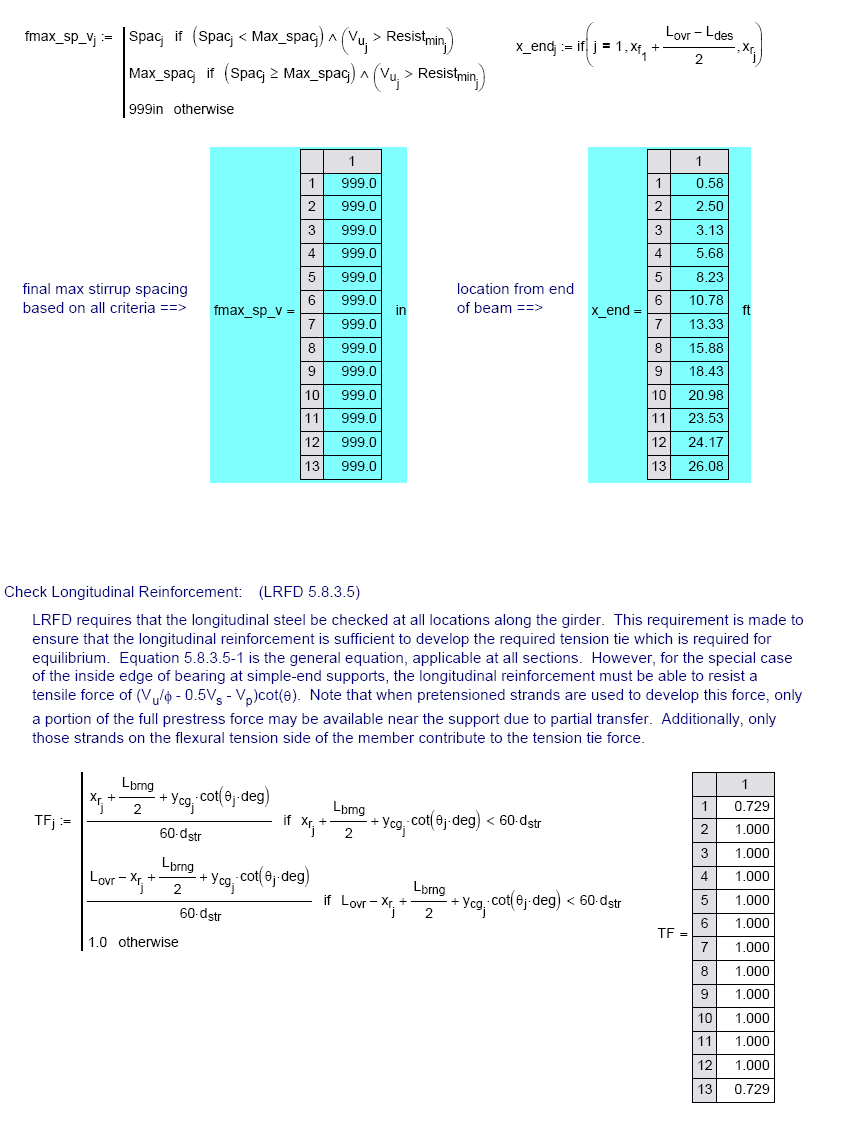
201 B - 56
202 B - 57
203 B - 58
204 B - 59
205 B - 60

206 B - 61
207 B - 62
208 B - 63
209 B - 64
210 B - 65
211 B.2 Design of Reinforcement within Negative Moment Region B - 66
212 B - 67
213 B - 68
214 B - 69
215 B - 70
216 B - 71
217 B - 72
218 B - 73
219 B - 74
220 B - 75
221 B - 76
222 B - 77
223 B - 78
224 B - 79
225 Appendix C Instrumentation and Data Acquisition System Components
226 C.1 Instrumentation The instrumentation of this bridge consisted of embedment strain gages and spotweldable strain gages. Both of these strain gages use the vibrating wire principle to obtain strain measurements within the structure. A length of steel wire is tensioned between two end blocks within the gage which expand and contract with the element (e.g., concrete, steel) altering the tension in the steel wire. This change in tension is measured as a change in the resonant frequency of vibration of the wire. Electromagnetic coils that are located close to the wire provide the excitation and readout of the gage frequency. Portable read-outs or dataloggers used in conjunction with these gages, provide the necessary voltage pulses to pluck the wire and convert the measured frequencies so as to display or record the reading directly in microstrain units. C.1.1 Geokon Model VCE-4200 Vibrating Wire Embedment Strain Gage The Geokon Model VCE-4200 Vibrating Wire (VW) Strain Gage is designed for longterm strain measurements in mass concrete, for use in structures such as foundations, piles, bridges, dams, containment vessels, tunnel liners, etc. This gage has an active gage length of 6 in. and a sensitivity of 1.0 microstrain. The temperature range for this gage is -20 C to 80 C. Figure C.1 shows a diagram of the Model VCE-4200 Vibrating Wire Embedment Strain Gage and its components. A photograph of this strain gage tied to reinforcement is provided in Figure C.2. C.1.2 Geokon Model VW-4150 Vibrating Wire Spot-weldable Strain Gage The VK-4150 VW Spot-weldable Strain Gage is designed for measuring strains on structural steel members such as bridges, piles, tunnel linings, buildings, etc. This gage consists of a VW gage element and integral coil assembly and has an active gage length of 2 in. and a sensitivity of 1.0 microstrain. The temperature range for this gage is -20 C to 80 C. Figure C.3 shows a diagram of the Model VK-4150 Vibrating Wire Spot-weldable Strain Gage and its components. A photograph of this strain gage installed on steel reinforcement is provided in Figure C.4. C.2 Data Acquisition System Components C.2.1 CR-10X Measurement and Control Module The datalogger generally serves as the central processing unit of the data acquisition system. Programs are downloaded into the CR-10X which enable it to read numerous different electrical instruments. These programs control the type of measurements to be taken (i.e., temperature, vibrating wire strain), the frequency at which measurements are taken, and the location where the collected data is to be stored (i.e., storage modules). Once a program is downloaded into the datalogger it will continue to run that program until the datalogger is shut off or a new program is downloaded in which case the previous program is erased. When the datalogger is powered on it will run the latest program that was downloaded. All communication with the datalogger, including the downloading of programs, was done using a computer via an SC929 to RS-232 interface cable. C - 1
227 The CR-10X datalogger has 12 single-ended or 6 differential channels used to obtain readings. It also has 8 ports that are used to control the operation of up to 8 AM 16/32 relay multiplexers. The CR-10X requires 12 V of DC power provided by a PS V rechargeable battery. The CR-10X supplies power to each of the peripherals connected to it. A photograph of a CR-10X Measurement and Control Module is provided in Figure C.5. C.2.2 AM 16/32 Relay Multiplexer The main function of a multiplexer is to increase the capacity of instruments that can be read by each datalogger allowing the system to monitor an increased number of instruments. The capacity of the AM 16/32 relay multiplexer depends primarily on the type of instrument to be read. For the purpose of this project, each multiplexer had the capacity for 16 differential sensors that require excitation, i.e., 16 VW strain gages, along with the differential thermistor of each gage. Therefore using three multiplexers for each datalogger increased the capacity of each datalogger to 48 VW strain gages and the capacity of the entire system to 96 VW strain gages. The program that was downloaded to the datalogger controlled the data collection from the multiplexer. The data was read from each channel of the multiplexer sequentially then the process was repeated for the next multiplexer. The AM 16/32 multiplexer required 12 V of DC power that was supplied by the datalogger. A photograph of an AM 16/32 relay multiplexer is provided in Figure C.6. C.2.3 AVW4 Vibrating Wire Interface A VW interface is located between the multiplexers and the dataloggers in systems that include VW sensors. These interfaces convert the strain and temperature measurements obtained from the VW strain gage to single-ended measurements which can be read by a datalogger. The AVW4 interface had the capacity to read four VW gages or four multiplexers with VW gages attached to them. The AVW4 VW interface required 5 V of power that was supplied by the datalogger. A photograph of an AVW4 Vibrating Wire Interface is provided in Figure C.7. C.2.4 SM16M Storage Module All of the data that the dataloggers collect was sent to the SM16M Storage Modules. Each module could hold up to 8 million low-resolution data values. The use of these modules allowed for more data storage and easier data retrieval than if the data was stored in the dataloggers. The storage module would stop storing data in the case that the storage module had become full and would not over-write old data. A photograph of an SM16M Storage Module is provided in Figure C.8. These storage modules required 5 V of DC power that was supplied through the SC12 cable that connected the storage module to the datalogger. All communication with the storage modules from a computer, including data retrieval, was done using an SC532A to RS-232 interface cable along with LoggerNet software which was downloaded from the Campbell Scientific, Inc. website ( C - 2
228 C.2.5 PS100 12V DC Power Supply with Charging Regulator and Battery The PS V DC Power Supply was used to supply 12 V of DC power to the dataloggers. These batteries included a charging regulator. Long-term charging power was supplied by a CSI Model 9591 AC transformer plugged into the permanent AC power source. A photograph of a PS V Power Supply is provided in Figure C.9. C.2.6 PC400 Software The PC400 datalogger support software program was used to write programs and to communicate with the dataloggers. One of the main features of this software was the EZSetup Wizard which was used to setup the dataloggers. In addition, this software simplified the writing and editing of programs with Short Cut, Edlog, and CRBasic programming tools. The programs for this project were written using the Edlog tool. When using this tool, the user types in a command and then fills in the variables (i.e, execution interval, delay, etc.). The programs that were downloaded into the dataloggers at the beginning of the field testing to collect data are provided in Appendix E of this report. The minimum computer requirements for this software were a 300 MHz Pentium II processor with 64 Mbytes of RAM and a screen resolution of 800x600. The recommended operating systems were Windows 98, NT, 2000, or XP. C - 3
229 Figure C.1 Diagram of VCE-4200 VW Embedment Strain Gage Figure C.2 Photograph of VCE-4200 VW Embedment Strain Gage tied to uncoated rebar C - 4
230 Figure C.3 Diagram of VK-4150 VW Spot-weldable Strain Gage Figure C.4 Photograph of VK-4150 VW Spot-weldable Strain Gage C - 5


231 Figure C.5 CR-10X Measurement and Control Module Figure C.6 AM 16/32 Relay Multiplexer C - 6


232 Figure C.7 AVW4 Vibrating Wire Interface Figure C.8 SM16M Storage Module C - 7

233 Figure C.9 PS V DC Power Supply with Charging Regulator and Battery C - 8
Draft Table of Contents. Building Code Requirements for Structural Concrete and Commentary ACI 318-14
 Draft Table of Contents Building Code Requirements for Structural Concrete and Commentary ACI 318-14 BUILDING CODE REQUIREMENTS FOR STRUCTURAL CONCRETE (ACI 318 14) Chapter 1 General 1.1 Scope of ACI 318
Safe & Sound Bridge Terminology
 Safe & Sound Bridge Terminology Abutment A retaining wall supporting the ends of a bridge, and, in general, retaining or supporting the approach embankment. Approach The part of the bridge that carries
TECHNICAL SPECIFICATION SERIES 8000 PRECAST CONCRETE
 TECHNICAL SPECIFICATION SERIES 8000 PRECAST CONCRETE TECHNICAL SPECIFICATION PART 8000 - PRECAST CONCRETE TABLE OF CONTENTS Item Number Page 8100 PRECAST CONCRETE CONSTRUCTION - GENERAL 8-3 8101 General
PRESTRESSED CONCRETE. Introduction REINFORCED CONCRETE CHAPTER SPRING 2004. Reinforced Concrete Design. Fifth Edition. By Dr. Ibrahim.
 CHAPTER REINFORCED CONCRETE Reinforced Concrete Design A Fundamental Approach - Fifth Edition Fifth Edition PRESTRESSED CONCRETE A. J. Clark School of Engineering Department of Civil and Environmental
Bridge Type Selection
 Bridge Type Selection The major consideration for bridge type selection for bridges on the State Aid system is initial cost. Future maintenance costs, construction time, and location are considered when
4B-2. 2. The stiffness of the floor and roof diaphragms. 3. The relative flexural and shear stiffness of the shear walls and of connections.
 Shear Walls Buildings that use shear walls as the lateral force-resisting system can be designed to provide a safe, serviceable, and economical solution for wind and earthquake resistance. Shear walls
Optimum proportions for the design of suspension bridge
 Journal of Civil Engineering (IEB), 34 (1) (26) 1-14 Optimum proportions for the design of suspension bridge Tanvir Manzur and Alamgir Habib Department of Civil Engineering Bangladesh University of Engineering
The following sketches show the plans of the two cases of one-way slabs. The spanning direction in each case is shown by the double headed arrow.
 9.2 One-way Slabs This section covers the following topics. Introduction Analysis and Design 9.2.1 Introduction Slabs are an important structural component where prestressing is applied. With increase
Chapter 5 Bridge Deck Slabs. Bridge Engineering 1
 Chapter 5 Bridge Deck Slabs Bridge Engineering 1 Basic types of bridge decks In-situ reinforced concrete deck- (most common type) Pre-cast concrete deck (minimize the use of local labor) Open steel grid
SECTION 5 ANALYSIS OF CONTINUOUS SPANS DEVELOPED BY THE PTI EDC-130 EDUCATION COMMITTEE LEAD AUTHOR: BRYAN ALLRED
 SECTION 5 ANALYSIS OF CONTINUOUS SPANS DEVELOPED BY THE PTI EDC-130 EDUCATION COMMITTEE LEAD AUTHOR: BRYAN ALLRED NOTE: MOMENT DIAGRAM CONVENTION In PT design, it is preferable to draw moment diagrams
SECTION 3 DESIGN OF POST TENSIONED COMPONENTS FOR FLEXURE
 SECTION 3 DESIGN OF POST TENSIONED COMPONENTS FOR FLEXURE DEVELOPED BY THE PTI EDC-130 EDUCATION COMMITTEE LEAD AUTHOR: TREY HAMILTON, UNIVERSITY OF FLORIDA NOTE: MOMENT DIAGRAM CONVENTION In PT design,
9.3 Two-way Slabs (Part I)
") 9.3 Two-way Slabs (Part I) This section covers the following topics. Introduction Analysis and Design Features in Modeling and Analysis Distribution of Moments to Strips 9.3.1 Introduction The slabs are
9.3 Two-way Slabs (Part I) This section covers the following topics. Introduction Analysis and Design Features in Modeling and Analysis Distribution of Moments to Strips 9.3.1 Introduction The slabs are
Challenging Skew: Higgins Road Steel I-Girder Bridge over I-90 OTEC 2015 - October 27, 2015 Session 26
 2014 HDR Architecture, 2014 2014 HDR, HDR, Inc., all all rights reserved. Challenging Skew: Higgins Road Steel I-Girder Bridge over I-90 OTEC 2015 - October 27, 2015 Session 26 Brandon Chavel, PhD, P.E.,
Rapid Short and Medium Span Bridge Construction Using Innovative. Precast Structural Systems
 Rapid Short and Medium Span Bridge Construction Using Innovative Precast Structural Systems By: Derek M. Scullion A thesis in partial fulfillment of the requirements for the degree of Master of Science
FEBRUARY 2014 LRFD BRIDGE DESIGN 4-1
 FEBRUARY 2014 LRFD BRIDGE DESIGN 4-1 4. STRUCTURAL ANALYSIS AND EVALUATION The analysis of bridges and structures is a mixture of science and engineering judgment. In most cases, use simple models with
SECTION 3 DESIGN OF POST- TENSIONED COMPONENTS FOR FLEXURE
 SECTION 3 DESIGN OF POST- TENSIONED COMPONENTS FOR FLEXURE DEVELOPED BY THE PTI EDC-130 EDUCATION COMMITTEE LEAD AUTHOR: TREY HAMILTON, UNIVERSITY OF FLORIDA NOTE: MOMENT DIAGRAM CONVENTION In PT design,
DESIGN OF SLABS. 3) Based on support or boundary condition: Simply supported, Cantilever slab,
 Based on support or boundary condition: Simply supported, Cantilever slab,") DESIGN OF SLABS Dr. G. P. Chandradhara Professor of Civil Engineering S. J. College of Engineering Mysore 1. GENERAL A slab is a flat two dimensional planar structural element having thickness small compared
DESIGN OF SLABS Dr. G. P. Chandradhara Professor of Civil Engineering S. J. College of Engineering Mysore 1. GENERAL A slab is a flat two dimensional planar structural element having thickness small compared
Analysis of the Response Under Live Loads of Two New Cable Stayed Bridges Built in Mexico
 Analysis of the Response Under Live Loads of Two New Cable Stayed Bridges Built in Mexico Roberto Gómez, Raul Sánchez-García, J.A. Escobar and Luis M. Arenas-García Abstract In this paper we study the
SLAB DESIGN. Introduction ACI318 Code provides two design procedures for slab systems:
 Reading Assignment SLAB DESIGN Chapter 9 of Text and, Chapter 13 of ACI318-02 Introduction ACI318 Code provides two design procedures for slab systems: 13.6.1 Direct Design Method (DDM) For slab systems
Precast Concrete Parking Structures
 Precast Concrete Parking Structures Durability starts at the joints BY DAVID C. MONROE AND JOSEPH L. WHITE Parking structures comprise the largest market segment for the structural precast, prestressed
US 51 Ohio River Bridge Engineering and Environmental Study
 US 51 Ohio River Bridge Engineering and Environmental Study ITEM NOS. 1-100.00 & 1-1140.00 Prepared by: Michael Baker Jr., Inc. 9750 Ormsby Station Rd Louisville, KY 40223 August 16, 2013 Table of Contents
A transverse strip of the deck is assumed to support the truck axle loads. Shear and fatigue of the reinforcement need not be investigated.
 Design Step 4 Design Step 4.1 DECK SLAB DESIGN In addition to designing the deck for dead and live loads at the strength limit state, the AASHTO-LRFD specifications require checking the deck for vehicular
Chapter 2 Basis of design and materials
 Chapter 2 Basis of design and materials 2.1 Structural action It is necessary to start a design by deciding on the type and layout of structure to be used. Tentative sizes must be allocated to each structural
Figure A. Maximum load testing of new precast concrete floor plank system
 Load Testing of Precast Concrete Plank By Peter Gorgas, E.I.T. Figure A. Maximum load testing of new precast concrete floor plank system Overview Testing was performed in July 2012 at Northeast Precast
APPENDIX H DESIGN CRITERIA FOR NCHRP 12-79 PROJECT NEW BRIDGE DESIGNS
 APPENDIX H DESIGN CRITERIA FOR NCHRP 12-79 PROJECT NEW BRIDGE DESIGNS This appendix summarizes the criteria applied for the design of new hypothetical bridges considered in NCHRP 12-79 s Task 7 parametric
CHAPTER 9 LONG TERM MONITORING AT THE ROUTE 351 BRIDGE
 CHAPTER 9 LONG TERM MONITORING AT THE ROUTE 351 BRIDGE 9.1 INTRODUCTION An important reason that composite piles have not gained wide acceptance in the civil engineering practice is the lack of a long
Field Damage Inspection and Static Load Test Analysis of Jiamusi Highway Prestressed Concrete Bridge in China
 Advanced Materials Research Vols. 163-167 (2011) pp 1147-1156 Online available since 2010/Dec/06 at www.scientific.net (2011) Trans Tech Publications, Switzerland doi:10.4028/www.scientific.net/amr.163-167.1147
EAST LYME HIGH SCHOOL
 Overview: 1971 N 1966 GYM 1966 CLASSROOM WING 1966 AUD. 1971 GYM 1998 1998 POOL EAST LYME HIGH SCHOOL Original 1966 Building: The original East Lyme High School was constructed in 1966 and was composed
Value Engineering vs. Alternate Designs in Bridge Bidding
 Value Engineering vs. Alternate Designs in Bridge Bidding Compares the advantages and disadvantages of alternate designs and value engineering in bidding of bridges as experienced in the State of Florida.
Index 20010 Series Prestressed Florida-I Beams (Rev. 07/12)
") Index 20010 Series Prestressed Florida-I Beams (Rev. 07/12) Design Criteria AASHTO LRFD Bridge Design Specifications, 6th Edition; Structures Detailing Manual (SDM); Structures Design Guidelines (SDG)
Index 20010 Series Prestressed Florida-I Beams (Rev. 07/12) Design Criteria AASHTO LRFD Bridge Design Specifications, 6th Edition; Structures Detailing Manual (SDM); Structures Design Guidelines (SDG)
Remote Monitoring of Soil Pressures on Bridge Footings
 More Info at Open Access Database www.ndt.net/?id=18252 Remote Monitoring of Soil Pressures on Bridge Footings Michael DAVIDSON 1, Zhihui ZHU 2, Issam HARIK 3, Charlie SUN 4, Kevin SANDEFUR 5 1 Bridge
6 RETROFITTING POST & PIER HOUSES
 Retrofitting Post & Pier Houses 71 6 RETROFITTING POST & PIER HOUSES by James E. Russell, P.E. 72 Retrofitting Post & Pier Houses Retrofitting Post & Pier Houses 73 RETROFITTING POST AND PIER HOUSES This
September 1, 2003 CONCRETE MANUAL 5-694.900 CONCRETE PAVEMENT REHABILITATION 5-694.900
 September 1, 2003 CONCRETE MANUAL 5-694.900 5-694.901 GENERAL CONCRETE PAVEMENT REHABILITATION 5-694.900 Concrete Pavement Rehabilitation is an extremely valuable tool of the Minnesota Department of Transportation
FUTURE SLAB. PENETRATIONS and. DEMOLITION of POST-TENSIONED FLOORS
 FUTURE SLAB PENETRATIONS and DEMOLITION of POST-TENSIONED FLOORS 1.0 INTRODUCTION Post-tensioned floor slabs in Australia and South East Asia are now universally regarded as the most cost effective form
TABLE OF CONTENTS. Roof Decks 172 B, BA, BV Deck N, NA Deck. Form Decks 174.6 FD,.6 FDV Deck 1.0 FD, 1.0 FDV Deck 1.5 FD Deck 2.0 FD Deck 3.
 Pages identified with the NMBS Logo as shown above, have been produced by NMBS to assist specifiers and consumers in the application of New Millennium Building Systems Deck products. Pages identified with
DESIGN OF SLABS. Department of Structures and Materials Engineering Faculty of Civil and Environmental Engineering University Tun Hussein Onn Malaysia
 DESIGN OF SLABS Department of Structures and Materials Engineering Faculty of Civil and Environmental Engineering University Tun Hussein Onn Malaysia Introduction Types of Slab Slabs are plate elements
REHABILITATION OF THE FIGUEIRA DA FOZ BRIDGE
 REHABILITATION OF THE FIGUEIRA DA FOZ BRIDGE A.Rito Proponte, Lda, Lisbon, Portugal J. Appleton A2P Consult, Lda, Lisbon, Portugal ABSTRACT: The Figueira da Foz Bridge includes a 405 m long cable stayed
1.2 Advantages and Types of Prestressing
 1.2 Advantages and Types of Prestressing This section covers the following topics. Definitions Advantages of Prestressing Limitations of Prestressing Types of Prestressing 1.2.1 Definitions The terms commonly
SEISMIC UPGRADE OF OAK STREET BRIDGE WITH GFRP
 13 th World Conference on Earthquake Engineering Vancouver, B.C., Canada August 1-6, 2004 Paper No. 3279 SEISMIC UPGRADE OF OAK STREET BRIDGE WITH GFRP Yuming DING 1, Bruce HAMERSLEY 2 SUMMARY Vancouver
CONCRETE FLOOR SLAB & CASTING BED CONSTRUCTION
 CONCRETE FLOOR SLAB & CASTING BED CONSTRUCTION General 7 www.meadowburke.com 877-518-7665 MB1109 CONCRETE FLOOR SLAB AND CASTING BED CONSTRUCTION Quality Construction Begins at Ground Level Everything
3.1 Historical Considerations
 3. Recommended Scope of Bridge improvements 3.1 Historical Considerations In the fall of 2000, an outside consultant, Fraser Design, suggested that the existing 4 th St. Bridge is potentially eligible
Preliminary steel concrete composite bridge design charts for Eurocodes
 Preliminary steel concrete composite bridge 90 Rachel Jones Senior Engineer Highways & Transportation Atkins David A Smith Regional Head of Bridge Engineering Highways & Transportation Atkins Abstract
In-situ Load Testing to Evaluate New Repair Techniques
 In-situ Load Testing to Evaluate New Repair Techniques W.J. Gold 1 and A. Nanni 2 1 Assistant Research Engineer, Univ. of Missouri Rolla, Dept. of Civil Engineering 2 V&M Jones Professor, Univ. of Missouri
Fire and Concrete Structures
 Fire and Concrete Structures Authors: David N. Bilow, P.E., S.E., Director, Engineered Structures, Portland Cement Association 5420 Old Orchard Road, Skokie, IL 60077,Phone 847-972-9064, email: dbilow@cement.org
Numerical Analysis of the Moving Formwork Bracket Stress during Construction of a Curved Continuous Box Girder Bridge with Variable Width
 Modern Applied Science; Vol. 9, No. 6; 2015 ISSN 1913-1844 E-ISSN 1913-1852 Published by Canadian Center of Science and Education Numerical Analysis of the Moving Formwork Bracket Stress during Construction
16. Beam-and-Slab Design
 ENDP311 Structural Concrete Design 16. Beam-and-Slab Design Beam-and-Slab System How does the slab work? L- beams and T- beams Holding beam and slab together University of Western Australia School of Civil
Guidelines for the Design of Post-Tensioned Floors
 Guidelines for the Design of Post-Tensioned Floors BY BIJAN O. AALAMI AND JENNIFER D. JURGENS his article presents a set of guidelines intended to T assist designers in routine post-tensioning design,
Analysis of the Interstate 10 Twin Bridge s Collapse During Hurricane Katrina
 Analysis of the Interstate 0 Twin Bridge s Collapse During Hurricane Katrina By Genda Chen, Emitt C. Witt III, David Hoffman, Ronaldo Luna, and Adam Sevi The Interstate 0 Twin Span Bridge over Lake Pontchartrain
Chapter 3 Pre-Installation, Foundations and Piers
 Chapter 3 Pre-Installation, Foundations and Piers 3-1 Pre-Installation Establishes the minimum requirements for the siting, design, materials, access, and installation of manufactured dwellings, accessory
Detailing of Reinforcment in Concrete Structures
 Chapter 8 Detailing of Reinforcment in Concrete Structures 8.1 Scope Provisions of Sec. 8.1 and 8.2 of Chapter 8 shall apply for detailing of reinforcement in reinforced concrete members, in general. For
Long-term serviceability of the structure Minimal maintenance requirements Economical construction Improved aesthetics and safety considerations
 Design Step 7.1 INTEGRAL ABUTMENT DESIGN General considerations and common practices Integral abutments are used to eliminate expansion joints at the end of a bridge. They often result in Jointless Bridges
Evaluating. A Case Study
 A Case Study Evaluating by Richard B. Stoddard, Washington State Department of Transportation In December 2002, a railroad tanker collision caused a fire under a prestressed concrete girder bridge crossing
Technical Notes 3B - Brick Masonry Section Properties May 1993
 Technical Notes 3B - Brick Masonry Section Properties May 1993 Abstract: This Technical Notes is a design aid for the Building Code Requirements for Masonry Structures (ACI 530/ASCE 5/TMS 402-92) and Specifications
bi directional loading). Prototype ten story
. Prototype ten story") NEESR SG: Behavior, Analysis and Design of Complex Wall Systems The laboratory testing presented here was conducted as part of a larger effort that employed laboratory testing and numerical simulation
NEESR SG: Behavior, Analysis and Design of Complex Wall Systems The laboratory testing presented here was conducted as part of a larger effort that employed laboratory testing and numerical simulation
Overhang Bracket Loading. Deck Issues: Design Perspective
 Deck Issues: Design Perspective Overhang Bracket Loading Deck overhangs and screed rails are generally supported on cantilever brackets during the deck pour These brackets produce an overturning couple
LOAD TESTING FOR BRIDGE RATING: DEAN S MILL OVER HANNACROIS CREEK
 REPORT FHWA/NY/SR-06/147 LOAD TESTING FOR BRIDGE RATING: DEAN S MILL OVER HANNACROIS CREEK OSMAN HAG-ELSAFI JONATHAN KUNIN SPECIAL REPORT 147 TRANSPORTATION RESEARCH AND DEVELOPMENT BUREAU New York State
Objectives. Experimentally determine the yield strength, tensile strength, and modules of elasticity and ductility of given materials.
 Lab 3 Tension Test Objectives Concepts Background Experimental Procedure Report Requirements Discussion Objectives Experimentally determine the yield strength, tensile strength, and modules of elasticity
The Impact of Market Demands on Residential Post-Tensioned Foundation Design: An Ethical Dilemma
 The Impact of Market Demands on Residential Post-Tensioned Foundation Design: An Ethical Dilemma Bart B. Barrett, B.S., P.E.1 Kerry S. Lee, M.B.A., P.E., M. ASCE2 Erik L. Nelson, Ph.D., P.E., M. ASCE3
Numerical modelling of shear connection between concrete slab and sheeting deck
 7th fib International PhD Symposium in Civil Engineering 2008 September 10-13, Universität Stuttgart, Germany Numerical modelling of shear connection between concrete slab and sheeting deck Noémi Seres
Elevated Roads for Sri Lanka
 Elevated Roads for Sri Lanka M.T.R. Jayasinghe (Senior Professor, Structural Engineering, University of Moratuwa) Senior Professor M.T.R. Jayasinghe is a Professor of Structural Engineering, University
METHOD OF STATEMENT FOR STATIC LOADING TEST
 Compression Test, METHOD OF STATEMENT FOR STATIC LOADING TEST Tension Test and Lateral Test According to the American Standards ASTM D1143 07, ASTM D3689 07, ASTM D3966 07 and Euro Codes EC7 Table of Contents
Precast Concrete Elements for Accelerated Bridge Construction
 Precast Concrete Elements for Accelerated Bridge Construction Volume 1-1. Laboratory Testing of Precast Substructure Components: Boone County Bridge Volume 1-2. Laboratory Testing of Full-Depth Precast,
CONTRACT SPECIFICATIONS - SEISMIC ISOLATION BEARINGS
 CONTRACT SPECIFICATIONS - SEISMIC ISOLATION BEARINGS 1.0 DESIGN 1.1 Scope of Work 1.1.1 This work shall consist of furnishing Isolation Bearings and installing Isolation Bearing Assemblies at the locations
National Council of Examiners for Engineering and Surveying. Principles and Practice of Engineering Structural Examination
 Structural Effective Beginning with the April 2011 The structural engineering exam is a breadth and exam examination offered in two components on successive days. The 8-hour Vertical Forces (Gravity/Other)
Reinforced Concrete Slab Design Using the Empirical Method
 Reinforced Concrete Slab Design Using the Empirical Method BridgeSight Solutions for the AASHTO LRFD Bridge Design Specifications BridgeSight Software TM Creators of effective and reliable solutions for
INCREASE OF DURABILITY AND LIFETIME OF EXISTING BRIDGES. PIARC TC 4.4 EXPERIENCE.
 INCREASE OF DURABILITY AND LIFETIME OF EXISTING BRIDGES. PIARC TC 4.4 EXPERIENCE. M.Sc. Gediminas Viršilas Head of Bridge Division, Lithuanian Road Administration Working group 2 of PIARC Technical Committee
Session 5D: Benefits of Live Load Testing and Finite Element Modeling in Rating Bridges
 Session 5D: Benefits of Live Load Testing and Finite Element Modeling in Rating Bridges Douglas R. Heath P.E., Structural Engineer Corey Richard P.E., Project Manager AECOM Overview Bridge Testing/Rating
Figure 5-11. Test set-up
 5.5. Load Procedure A uniform load configuration was used for the load tests. An air bag, placed on the top surface of the slab, was used for this purpose, and the load was applied by gradually increasing
Formwork for Concrete
 UNIVERSITY OF WASHINGTON DEPARTMENT OF CONSTRUCTION MANAGEMENT CM 420 TEMPORARY STRUCTURES Winter Quarter 2007 Professor Kamran M. Nemati Formwork for Concrete Horizontal Formwork Design and Formwork Design
LOAD TESTING OF SOME NEW BRIDGES IN LATVIA
 LOAD TESTING OF SOME NEW BRIDGES IN LATVIA Edmunds Akimovs, Civ.Eng., Bridge Engineer, Consulting Company Inzenierbuve, Address: Azenes st. 20, Riga, LV1048, Latvia. E-mail: eakimovs@inzenierbuve.lv Ainars
Evaluation of Bridge Performance and Rating through Nondestructive
 Evaluation of Bridge Performance and Rating through Nondestructive Load Testing Final Report Prepared by: Andrew Jeffrey, Sergio F. Breña, and Scott A.Civjan University of Massachusetts Amherst Department
Technical Assignment 2 TABLE OF CONTENTS
 2 TABLE OF CONTENTS Executive Summary...3 Introduction..5 Gravity Loads......6 Design Codes......7 Materials..8 Existing Structural System.. 10 Existing Floor System 15 Alternate Floor Framing Systems...17
DESIGN OF PRESTRESSED BARRIER CABLE SYSTEMS
 8601 North Black Canyon Highway Suite 103 Phoenix, AZ 8501 For Professionals Engaged in Post-Tensioning Design Issue 14 December 004 DESIGN OF PRESTRESSED BARRIER CABLE SYSTEMS by James D. Rogers 1 1.0
BRIDGE DESIGN SPECIFICATIONS APRIL 2000 SECTION 9 - PRESTRESSED CONCRETE
 SECTION 9 - PRESTRESSED CONCRETE Part A General Requirements and Materials 9.1 APPLICATION 9.1.1 General The specifications of this section are intended for design of prestressed concrete bridge members.
Full Depth Precast Concrete Highway Bridge Decks
 NOVEMBER 2007 STRUCTURES AND MATERIALS TEST LABORATORY Full Depth Precast Concrete Highway Bridge Decks BY PROF. M.G. OLIVA PROF. L.C. BANK Prof. J.S. Russell CIVIL ENGINEERING COLLEGE OF ENGINEERING UNIVERSITY
Design of Steel Structures Prof. S.R.Satish Kumar and Prof. A.R.Santha Kumar. Fig. 7.21 some of the trusses that are used in steel bridges
 7.7 Truss bridges Fig. 7.21 some of the trusses that are used in steel bridges Truss Girders, lattice girders or open web girders are efficient and economical structural systems, since the members experience
IN-SERVICE PERFORMANCE AND BEHAVIOR CHARACTERIZATION OF THE HYBRID COMPOSITE BRIDGE SYSTEM A CASE STUDY
 IN-SERVICE PERFORMANCE AND BEHAVIOR CHARACTERIZATION OF THE HYBRID COMPOSITE BRIDGE SYSTEM A CASE STUDY John M. Civitillo University of Virginia, USA Devin K. Harris University of Virginia, USA Amir Gheitasi
Materials. Estimating Steel. Players. Materials. Shop Drawings. Detailing Process. Standard shapes. Fabricated members, Built-up sections
 Materials Standard shapes W sections, C channels, Structural T, Angles, Pipes, Tubes, Rods and Plates Fabricated members, Built-up sections Adding plates to beam flanges, Stiffeners to beam webs Built
MILMAN & ASSOCIATES STRUCTURAL CONSULTING ENGINEERS/ PROJECT MANAGERS
 MILMAN & ASSOCIATES STRUCTURAL CONSULTING ENGINEERS/ PROJECT MANAGERS May 29, 2013 Revision B Structural Guideline for Design and Installation Holes in Composite Floor Slab Terminal 3, Departure Level
How To Design A Post Tensioned Deck For A Building
 SAMUEL ÁVILA STRUCTURAL OPTION FACULTY CONSULTANT: THOMAS BOOTHBY UNIVERSITY OF CENTRAL FLORIDA S ACADEMIC VILLAGES ORLANDO, FL THESIS PROPOSAL EXECUTIVE SUMMARY DECEMBER 12, 2005 Introduction: The University
Bridge Structural Rehabilitation Using FRP Laminates
 Bridge Structural Rehabilitation Using FRP Laminates South Santiam River Quartzville Road, Linn County Linn County Road Department 2011 Cooperative Partnerships Making Linn County a Better Place to Live
Design and Construction of Cantilevered Reinforced Concrete Structures
 Buildings Department Practice Note for Authorized Persons, Registered Structural Engineers and Registered Geotechnical Engineers APP-68 Design and Construction of Cantilevered Reinforced Concrete Structures
Spon Press PRESTRESSED CONCRETE DESIGN EUROCODES. University of Glasgow. Department of Civil Engineering. Prabhakara Bhatt LONDON AND NEW YORK
 PRESTRESSED CONCRETE DESIGN TO EUROCODES Prabhakara Bhatt Department of Civil Engineering University of Glasgow Spon Press an imprint of Taytor & Francfe LONDON AND NEW YORK CONTENTS Preface xix Basic
ABSTRACT 1. INTRODUCTION 2. DESCRIPTION OF THE SEGMENTAL BEAM
 Ninth LACCEI Latin American and Caribbean Conference (LACCEI 11), Engineering for a Smart Planet, Innovation, Information Technology and Computational Tools for Sustainable Development, August 3-, 11,
SCHEMATIC AND PROJECT BUDGET APPROVAL EAST CAMPUS NURSING EDUCATION AND CLASSROOM
 Shepherd University Board of Governors June 9, 2005 Agenda Item No. 9 SCHEMATIC AND PROJECT BUDGET APPROVAL EAST CAMPUS NURSING EDUCATION AND CLASSROOM In 1994 construction began on the Byrd Science and
CONCRETE REPAIR GUIDELINES. Concrete repairs can be broken down into four basic types, plus special repairs and planing.
 CONCRETE REPAIR GUIDELINES Concrete repairs can be broken down into four basic types, plus special repairs and planing. Note: It is recommended that investigation into soundness of pavement be performed
Micropiles Reduce Costs and Schedule for Merchant RR Bridge Rehabilitation
 Micropiles Reduce Costs and Schedule for Merchant RR Bridge Rehabilitation Jeff R. Hill, P.E. Hayward Baker Inc. 111 W. Port Plaza Drive Suite 600 St. Louis, MO 63146 314-542-3040 JRHill@HaywardBaker.com
How To Write An Analysis System For Bridge Test
 Study of Analysis System for Bridge Test Chen Ke, Lu Jian-Ming, Research Institute of Highway, 100088, Beijing, China (chenkezi@163.com, lujianming@263.net) Summary Analysis System for Bridge Test (Chinese
COLUMN-FREE OFFICE SPACE RISES IN CHICAGO S LOOP
 COLUMN-FREE OFFICE SPACE RISES IN CHICAGO S LOOP 30 x45 bay provides maximum tenant flexibility and increases leasing marketability By David E. Eckmann AIA, S.E. P.E. SURGING DEMANDS FOR RENTABLE OFFICE
University of Missouri Hospitals and Clinics. Structural Repair and Protection of Post-tensioned Parking Garage
 University of Missouri Hospitals and Clinics Structural Repair and Protection of Post-tensioned Parking Garage 1 University of Missouri Project The University of Missouri Health Care Patient and Visitor
REINFORCED CONCRETE. Reinforced Concrete Design. A Fundamental Approach - Fifth Edition. Walls are generally used to provide lateral support for:
 HANDOUT REINFORCED CONCRETE Reinforced Concrete Design A Fundamental Approach - Fifth Edition RETAINING WALLS Fifth Edition A. J. Clark School of Engineering Department of Civil and Environmental Engineering
INTER PLANT STANDARD STEEL INDUSTRY
 INTER PLANT STANDARD STEEL INDUSTRY CODE OF PRACTICE FOR REVAMPING OF EOT CRANES IPSS:3-02-014-03 IPSS Corresponding IS does not exist 0. FOREWORD 0.1 This Inter Plant Standard has been prepared by the
IH-635 MANAGED LANES PROJECT, SEG. 3.2
 IH-635 MANAGED LANES PROJECT, SEG. 3.2 Location: Dallas, Texas Owner: Texas Department of Transportation Client: Ferrovial Agroman Construction Cost: $1 Billion Construction Completion Date: December,
Steel and composite bridges in Germany State of the Art
 Steel and composite bridges in Germany State of the Art Univ.-Prof. Dr.-Ing. G. Hanswille Institute for Steel and Composite Structures University of Wuppertal Germany Univ.-Prof. em. Dr.-Ing. Dr. h.c.
SEISMIC DESIGN. Various building codes consider the following categories for the analysis and design for earthquake loading:
 SEISMIC DESIGN Various building codes consider the following categories for the analysis and design for earthquake loading: 1. Seismic Performance Category (SPC), varies from A to E, depending on how the
Optimising plate girder design
 Optimising plate girder design NSCC29 R. Abspoel 1 1 Division of structural engineering, Delft University of Technology, Delft, The Netherlands ABSTRACT: In the design of steel plate girders a high degree
Investigation of the November 2, 2013 collapse of concrete beams at Fort Lauderdale-Hollywood Airport runway project
 Investigation of the November 2, 2013 collapse of concrete beams at Fort Lauderdale-Hollywood Airport runway project U.S. Department of Labor Occupational Safety and Health Administration Directorate of
Welded Fabric. The CARES Guide to Reinforcing Steels Part 5. Installation of welded fabric on a major contract. 1.0 Introduction
 Welded Fabric 1.0 Introduction Welded fabric, often referred to as mesh, is a machine welded grid arrangement of reinforcing bars or wires. It is covered by British Standard BS4483. This was revised in
FORM DESIGN. easy to work with, and generally available.
 Forms play a major role in concrete construction. They give the plastic concrete its shape and hold it until it hardens. Forms protect the concrete, assist in curing it, and support any reinforcing rods
Corporate Overview. We will start shortly
 Corporate Overview We will start shortly Case studies presentation: I-35W Bridge in Minneapolis and Punggol EC26 Building in Singapore Presented by: - Luca Manetti, S&S Manager, SMARTEC SA - Branco Glisic,