Basic Biostatistics in Medical Research. Lecture 3: Introduction to Linear Regression and Logistic Regression
|
|
|
- Elvin Bennett
- 7 years ago
- Views:
Transcription

 Department of Preventive Medicine NU Feinberg")
1 Basic Biostatistics in Medical Research Lecture 3: Introduction to Linear Regression and Logistic Regression Jungwha Julia Lee, PhD, MPH Biostatistics Collaboration Center (BCC) Department of Preventive Medicine NU Feinberg School of Medicine
2 Outline Multiple linear regression estimating parameters testing hypotheses about parameters confidence and prediction interval Logistic regression odds ratio vs. relative risk interpretation of coefficient etensions of logistic regression 10/25/2011 Biostatistics Collaboration Center (BCC) Lecture 3: Intro to Linear and Logistic Regression 2
3 Data Analysis Overview All variables you encounter in data analysis can be classified according as [independent dependent] and [categorical continuous]. 10/25/2011 Biostatistics Collaboration Center (BCC) Lecture 3: Intro to Linear and Logistic Regression 3
4 Data Analysis Overview The classification of the data dictates the tool you can use: Categorical Dependent Variable Continuous Independent Variable Categorical Chi-squared test ANOVA Continuous Logistic Regression Linear Regression 10/25/2011 Biostatistics Collaboration Center (BCC) Lecture 3: Intro to Linear and Logistic Regression 4
5 Scatter Plots and Correlation A scatter plot is used to show the relationship between two variables. Correlation analysis is used to measure the strength of the association (linear relationship) between two variables. Only concerned with the strength of the relationship No causal effect is implied 10/25/2011 Biostatistics Collaboration Center (BCC) Lecture 3: Intro to Linear and Logistic Regression 5
6 Scatter Plot Eamples Linear relationships y Curvilinear relationships y y y
7 Scatter Plot Eamples Strong relationships y Weak relationships y y y
8 Scatter Plot Eamples y No relationships y
9 Correlation Coefficient The population correlation coefficient ρ (rho) measures the strength of the association between the variables The sample correlation coefficient r is an estimate of ρ and is used to measure the strength of the linear relationship in the sample observations 10/25/2011 Biostatistics Collaboration Center (BCC) Lecture 3: Intro to Linear and Logistic Regression 9
10 Features of ρ and r Unit free Range: -1 ~ +1 The closer to 1 the stronger negative linear relationship The closer to +1 the stronger positive linear relationship The closer to 0 the weaker the linear relationship 10/25/2011 Biostatistics Collaboration Center (BCC) Lecture 3: Intro to Linear and Logistic Regression 10
11 Eamples of r Values y y y r = -1 r = -.6 r = 0 y y r = +.3 r = +1
12 Sample Correlation Coefficient ( )( y y) r [ ( ) 2 ][ ( y y) 2 ] where: r = Sample correlation coefficient n = Sample size = Value of the independent variable y = Value of the dependent variable
13 Sample Correlation Coefficient Eample y r = relatively strong positive linear association between and y
14 Significance Test for Correlation Hypotheses H 0 : ρ = 0 (no correlation) H A : ρ 0 (correlation eists) Test statistic (df=n-2) r t 2 1 r n 2 10/25/2011 Biostatistics Collaboration Center (BCC) Lecture 3: Intro to Linear and Logistic Regression 14
15 Regression Analysis Regression analysis is used to: Predict the value of a dependent variable based on the value of at least one independent variable Eplain the impact of changes in an independent variable on the dependent variable 10/25/2011 Biostatistics Collaboration Center (BCC) Lecture 3: Intro to Linear and Logistic Regression 15
16 Simple Linear Regression Only one independent variable, Relationship between and y is described by a linear function Changes in y are assumed to be caused by changes in 10/25/2011 Biostatistics Collaboration Center (BCC) Lecture 3: Intro to Linear and Logistic Regression 16


17 Types of Regression Models Positive Linear Relationship Relationship NOT Linear Negative Linear Relationship No Relationship
18 Population Linear Regression Model Dependent Variable Population y intercept Population Slope Coefficient Independent Variable y β β 0 1 ε Random Error term, or residual Linear component Random Error component
19 Linear Regression Assumptions y β β 0 1 Error values (ε) are statistically independent Error values are normally distributed for any given value of The probability distribution of the errors is normal The probability distribution of the errors has constant variance The underlying relationship between the variable and the y variable is linear ε
20 Population Linear Regression y Observed Value of y for i y β β 0 1 ε Predicted Value of y for i ε i Random Error for this value Slope = β 1 Intercept = β 0 i
21 Estimated Regression Model The sample regression line provides an estimate of the population regression line Estimated (or predicted) y value Estimate of the regression intercept Estimate of the regression slope ŷ b b i 0 1 Independent variable The individual random error terms e i have a mean of zero
22 Least Squares Criterion b 0 and b 1 are obtained by finding the values of b 0 and b 1 that minimize the sum of the squared residuals e 2 (y ŷ) 2 (y (b 0 b 1 )) 2
23 The Least Squares Equation The formulas for b 1 and b 0 are: b 1 ( 2 ( )( y ) y) algebraic equivalent: y y b n ( ) n b0 y b1
24 Interpretation of Slope and Intercept b 1 is the estimated change in the average value of y as a result of a one-unit change in b 0 is the estimated average value of y when the value of is zero
25 Finding the Least Squares Equation The coefficients b 0 and b 1 will usually be found using computer software, such as Stata or SAS. Other regression measures will also be computed as part of computerbased regression analysis
26 Simple Linear Regression Table 1. Age and systolic blood pressure (SBP) among 33 adult women Age SBP Age SBP Age SBP Source: Colton. Statistics in Medicine (1974) 10/25/2011 Biostatistics Collaboration Center (BCC) Lecture 3: Intro to Linear and Logistic Regression 26
27 Simple Linear Regression SBP (mmhg) Age (years) 10/25/2011 Biostatistics Collaboration Center (BCC) Lecture 3: Intro to Linear and Logistic Regression 27
28 Least Squares Regression Properties The sum of the residuals from the least squares regression line is 0 ( ) The sum of the squared residuals is a 2 minimum (minimized ( y yˆ) ) The simple regression line always passes through the mean of the y variable and the mean of the variable The least squares coefficients are unbiased estimates of β 0 and β 1 ( y yˆ) 0
29 Eplained and Uneplained Variation Total variation is made up of two parts: SST SSR SSE Total Sum of Squares Sum of Squares Regression Sum of Squares Error 2 SST (y y) 2 SSR (ŷ y) SSE (y 2 ŷ) where: y = Average value of the dependent variable y = Observed values of the dependent variable ŷ = Estimated value of y for the given value
30 Eplained and Uneplained Variation SST = total sum of squares Measures the variation of the y i values around their mean y SSR = regression sum of squares Eplained variation attributable to the relationship between and y SSE = error sum of squares Variation attributable to factors other than the relationship between and y
31 Eplained and Uneplained Variation y y i y _ y _ SST = (y i - y) 2 SSE = (y i - y i ) 2 _ SSR = (y i - y) 2 y _ y X i
32 Coefficient of Determination, R 2 The coefficient of determination is the portion of the total variation in the dependent variable that is eplained by variation in the independent variable The coefficient of determination is also called R-squared and is denoted as R 2 R 2 SSR SST where 0 R 2 1
33 Coefficient of Determination, R 2 R 2 SSR SST sum of squares eplained by regression total sum of squares Note: In the single independent variable case, the coefficient of determination is where: 2 R r R 2 = Coefficient of determination r = Simple correlation coefficient 2
34 Eamples of R 2 Values y R 2 = 1 y R 2 = 1 Perfect linear relationship between and y: 100% of the variation in y is eplained by variation in R 2 = +1
35 Eamples of R 2 Values y 0 < R 2 < 1 Weaker linear relationship between and y: y Some but not all of the variation in y is eplained by variation in
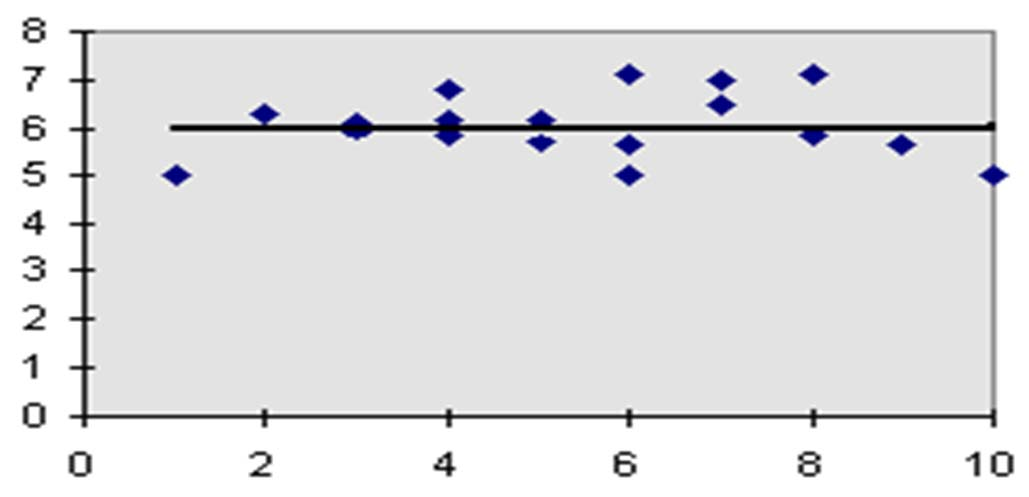
36 Eamples of R 2 Values y R 2 = 0 No linear relationship between and y: R 2 = 0 The value of Y does not depend on. (None of the variation in y is eplained by variation in )
37 Standard Error of Estimate The standard deviation of the variation of observations around the regression line is estimated by s n SSE k 1 Where SSE = Sum of squares error n = Sample size k = number of independent variables in the model
38 The Standard Deviation of the Regression Slope The standard error of the regression slope coefficient (b 1 ) is estimated by s where: s b1 b 1 s ε ( ) 2 2 s ε ( n ) = Estimate of the standard error of the least squares slope 2 s ε SSE n 2 = Sample standard error of the estimate
39 Comparing Standard Errors y Variation of observed y values from the regression line y Variation in the slope of regression lines from different possible samples small s small s b1 y y large s large s b1
40 Inference about the Slope: t test for a population slope Is there a linear relationship between and y? Null and alternative hypotheses H 0 : β 1 = 0 (no linear relationship) H 1 : β 1 0 (linear relationship does eist) Test statistic (df=n-2) t b1 β s b 1 1 where: t Test b 1 = Sample regression slope coefficient β 1 = Hypothesized slope s b1 = Estimator of the standard error of the slope
41 Inference about the Slope: t Test Estimated Regression Equation: The slope of this model is 1.22 Does age of the house affect SBP?
42 Inference about the Slope: t Test Estimated Regression Equation: Hypothesis: H 0 : 1 0 (slope) H 1 : 1 0 Estimate of Test Statistic t=5.74 P-value < Conclude: 1 0 There is a statistically significant linear trend between age and SBP. 10/25/2011 Biostatistics Collaboration Center (BCC) Lecture 3: Intro to Linear and Logistic Regression 42
43 Regression Analysis for Description Confidence Interval Estimate of the Slope (95% CI of ) : b t s 1 /2 d.f. = n - 2 b 1 At 95% level of confidence, the confidence interval for the slope is (0.79, 1.66)
44 Confidence Interval for the Average y, Given Confidence interval estimate for the mean of y given a particular p Size of interval varies according to distance away from mean, ŷ 2 1 (p ) t /2sε 2 n ( )
45 Confidence Interval for an Individual y, Given Confidence interval estimate for an Individual value of y given a particular p ŷ 1 ( ) t s 1 p /2 ε n ( ) 2 2 This etra term adds to the interval width to reflect the added uncertainty for an individual case
46 Interval Estimates for Different Values of y Prediction Interval for an individual y, given p Confidence Interval for the mean of y, given p p
47 Residual Analysis Purposes Eamine for linearity assumption Eamine for constant variance for all levels of Evaluate normal distribution assumption Graphical Analysis of Residuals Can plot residuals vs. Can create histogram of residuals to check for normality
48 Residual Analysis for Linearity y y residuals residuals Not Linear Linear
49 Residual Analysis for Constant Variance y y residuals residuals Non-constant variance Constant variance
50 Multiple Linear Regression y = p p Predicted Response variable Outcome variable Dependent variable Predictor variables Eplanatory variables Covariates Independent variables 10/25/2011 Biostatistics Collaboration Center (BCC) Lecture 3: Intro to Linear and Logistic Regression 50
51 Multiple Linear Regression Relation between a continuous variable and a set of k continuous variables y= p p Partial regression coefficients p Amount by which y changes on average when p changes by one unit and all the other p s remain constant Measures association between p and y adjusted for all other p Eample SBP vs. age, weight, height, etc 10/25/2011 Biostatistics Collaboration Center (BCC) Lecture 3: Intro to Linear and Logistic Regression 51
52 Logistic Regression
53 Logistic Regression Table 2. Age and signs of coronary heart disease (CHD) Age CHD Age CHD Age CHD Source: Colton. Statistics in Medicine (1974) 10/25/2011 Biostatistics Collaboration Center (BCC) Lecture 3: Intro to Linear and Logistic Regression 53
54 How to analyze these data? Compare mean age of diseased and nondiseased. Diseased 57.7 years Non-diseased 38.6 years Hypothesis: H 0 : 1 2 vs. H 1 : 1 2 t-test: p< Linear regression? 10/25/2011 Biostatistics Collaboration Center (BCC) Lecture 3: Intro to Linear and Logistic Regression 54
55 Scatter plot: Data from Table Signs of coronary heart disease Age (years) 10/25/2011 Biostatistics Collaboration Center (BCC) Lecture 3: Intro to Linear and Logistic Regression 55
56 Logistic regression Table 3. Prevalence (%) of signs of CHD according to age group Diseased Age group No. in group No. % /25/2011 Biostatistics Collaboration Center (BCC) Lecture 3: Intro to Linear and Logistic Regression 56
57 Scatter plot: Data from Table 3 Diseased % Age group 10/25/2011 Biostatistics Collaboration Center (BCC) Lecture 3: Intro to Linear and Logistic Regression 57
58 Objective of the Analysis How is a risk factor related to disease or death? To model the relationship between the risk of the outcome and the predictors of interest, where The outcome is binary (Yes vs No): Y=1 or 0 The predictors are X=(X1, X2,, Xp) The risk of the outcome is Pr(Y=1) or E(Y) The statistical model is Pr(Y=1 X) = E(Y X) = ƒ(x) 10/25/2011 Biostatistics Collaboration Center (BCC) Lecture 3: Intro to Linear and Logistic Regression 58
59 Construction of f(x) Linear regression: E(Y)=ƒ(X)=+X Can we use the same model? e.g., Pr(CHD)= +BMI Pr(CHD) is a probability and thus will always be between 0 and 1 Need to select f(x) so that it is always between 0 and 1 10/25/2011 Biostatistics Collaboration Center (BCC) Lecture 3: Intro to Linear and Logistic Regression 59
60 Logistic Regression Model Pr( Y 1 X ) f ( X ) e 1 X e X 10/25/2011 Biostatistics Collaboration Center (BCC) Lecture 3: Intro to Linear and Logistic Regression 60
61 Relate a binary outcome to one or more predictors. Describes the magnitude of effects using odds ratios. Let Y=1 for disease, Y=0 for non-disease, Race=1 for white, Race=0 for minority, Age. Logistic Regression 10/25/2011 Biostatistics Collaboration Center (BCC) Lecture 3: Intro to Linear and Logistic Regression 61
 = Odds for White / Odds for Non-White 10/25/2011 Biostatistics Collaboration Center (BCC) Lecture 3: Intro to Linear and Logistic Regression 62")
62 Review : Odds and Odds Ratio White Non-White Disease a b No Disease c d Risk a/(a+c) b/(b+d) Odds a/c b/d Relative Risk (RR) = a b d a c b Odds Ratio (OR ) = Odds for White / Odds for Non-White 10/25/2011 Biostatistics Collaboration Center (BCC) Lecture 3: Intro to Linear and Logistic Regression 62
63 Review : Odds and Odds Ratio White Non-White Disease No Disease 12,079 12,890 Risk 130/12, /12,991 Odds 130/12, /12,890 Relative Risk (RR) , ,991 Odds Ratio (OR ) = Odds for White / Odds for Non-White 130 /12, /12, /25/2011 Biostatistics Collaboration Center (BCC) Lecture 3: Intro to Linear and Logistic Regression 63
64 More on OR Ranges from 0 to infinity Tends to be skewed (i.e., not symmetric): OR>1: Increased risk when eposed OR=1: no difference in risk btw the two groups OR<1: Lower risk (protective) when eposed Log of OR tends to be symmetric and normally distributed. Log (OR) >0: increased risk Log (OR) =0: no difference in risk Log (OR) <0: decreased risk 10/25/2011 Biostatistics Collaboration Center (BCC) Lecture 3: Intro to Linear and Logistic Regression 64
65 Logistic Regression Model Pr( Y e 1 X ) 1 Pr( Y 1 ln Pr( Y 0 X ) X ) X 0 e X ln (Odds Ratio) 1 X ep( β 1) = Odds Ratio 10/25/2011 Biostatistics Collaboration Center (BCC) Lecture 3: Intro to Linear and Logistic Regression 65
66 Interpretation of Coefficient Let X=1 if eposed and X=0 if not eposed Let denote the regression coefficient for X, then e is the OR for the outcome, comparing the eposed to the not eposed. e Pr( Y Pr( Y 1 X 1 X 1) / 0) / Pr( Y Pr( Y 0 0 X X 1) 0) 10/25/2011 Biostatistics Collaboration Center (BCC) Lecture 3: Intro to Linear and Logistic Regression 66
67 Interpretation of Coefficient For continuous eposure measurements, e is the OR for the outcome, corresponding to one unit increase from the previous level. e Pr( Y 1 X 1) / Pr( Y 1 X ) / Pr( Y Pr( Y 0 0 X X 1) ) Which previous level? Any level! 10/25/2011 Biostatistics Collaboration Center (BCC) Lecture 3: Intro to Linear and Logistic Regression 67
68 Logistic Regression Eample Applied Logistic Regression (Hosmer & Lemeshow) Outcome: CHD recurrence, Yes vs No Predictor: Age The logistic regression model is Pr (CHD Age) e Age 0 1 e Age /25/2011 Biostatistics Collaboration Center (BCC) Lecture 3: Intro to Linear and Logistic Regression 68
69 Logistic Regression Eample id age chd /25/2011 Biostatistics Collaboration Center (BCC) Lecture 3: Intro to Linear and Logistic Regression 69
70 Logistic Regression Eample Pˆ r (CHD Age) The estimate of b 1 =0.111 with s.e.=0.024 The p-value for H 0: b 1 =0 is < The 95% conf. interval for b 1 is (0.064, 0.158) OR corresponding to one year increase of age: e b e Age Age with the 95% confidence interval of (e 0.064,e ) = (1.066, 1.171). e b 0 e b b 0 1 b 1 10/25/2011 Biostatistics Collaboration Center (BCC) Lecture 3: Intro to Linear and Logistic Regression 70
71 Multiple Logistic Regression How to make adjustment for potential confounders? In linear regression: E(Y X 1,X 2 ) = b 0 +b 1 X+b 2 X 2 In logistic regression: or, 1 ), ( X X X X e e X X Y P ) Pr( 1) Pr( ln logit(p) X X Y Y 10/25/ Biostatistics Collaboration Center (BCC) Lecture 3: Intro to Linear and Logistic Regression
72 Multiple Logistic Regression The eponential of the regression coefficient, e b1 can be interpreted as the OR corresponding to one unit increase in X 1, while the level of X 2 is fied at 2. e b 1 Pr( Y 1 X1 Pr( Y 1 X 1 1,, 1 1 X X ) / ) / Pr( Y Pr( Y 0 0 X X ,, X 2 X 2 ) 2 2 ) 10/25/2011 Biostatistics Collaboration Center (BCC) Lecture 3: Intro to Linear and Logistic Regression 72
73 Multiple Logistic Regression Eample Dependent variable whether the patient has had a second heart attack within 1 year (binary: 1= Yes v.s. 0 = No). Two independent variables: whether the patient completed a treatment consisting of anger control practice (binary: 1=Yes v.s. 0=No). score on a trait aniety scale (a higher score means more anious). 10/25/2011 Biostatistics Collaboration Center (BCC) Lecture 3: Intro to Linear and Logistic Regression 73
74 Multiple Logistic Regression Eample: Data ID Heart Attack Treatment Aniety /25/2011 Biostatistics Collaboration Center (BCC) Lecture 3: Intro to Linear and Logistic Regression 74
75 Univariate Analysis Result The parameter estimate is with a 95% confidence interval of ( , ). The OR of the second heart attack comparing those received treatment to those did not is with a 95% CI of (0.0448, ). 10/25/2011 Biostatistics Collaboration Center (BCC) Lecture 3: Intro to Linear and Logistic Regression 75
76 Multiple Analysis Result The OR for the second heart attack comparing those received treatment to those did not, while controlling for the aniety level, is 0.36 with a 95% CI of [0.04, 3.56] and a p-value of Every unit increase in Aniety score increases the odds of the second heart attack by 12.6% (95% CI: [1.1%, 25.5%], p=0.03) while treatment status remains the same. 10/25/2011 Biostatistics Collaboration Center (BCC) Lecture 3: Intro to Linear and Logistic Regression 76
77 Obtaining Risk, Risk Difference, and Relative Risk What if we want to know the risk difference or relative risk since odds ratio is too difficult to eplain? You can still use logistic regression! 10/25/2011 Biostatistics Collaboration Center (BCC) Lecture 3: Intro to Linear and Logistic Regression 77
78 Obtaining Risk, Risk Difference, and Relative Risk Pr (Heart Attack) e 1 ( Treatment0.12Aniety) e ( Treatment0.12Aniety) 10/25/2011 Biostatistics Collaboration Center (BCC) Lecture 3: Intro to Linear and Logistic Regression 78
79 Obtaining Risk, Risk Difference, and Relative Risk Aniety level = 50: Pr(Heart attack Treatment, 50)=0.19 Pr(Heart attack No Treatment, 50)=0.40 Risk Difference (RD) = = Relative Risk (RR) = 0.19 / 0.40 = 48% Aniety level = 80: Pr(Heart attack Treatment, 80)=0.89 Pr(Heart attack No Treatment, 80)=0.96 RD = = RR = 0.89 / 0.96 = 93% 10/25/2011 Biostatistics Collaboration Center (BCC) Lecture 3: Intro to Linear and Logistic Regression 79
80 How about OR? What is the OR for treatment vs. no treatment? Aniety level = 50 Pr(Heart attack Treatment, 50)=0.19 Pr(Heart attack No Treatment, 50)=0.40 OR = (0.19/0.81) / (0.40/0.60) = 0.36 Aniety level = 80 Pr(Heart attack Treatment, 80)=0.89 Pr(Heart attack No Treatment, 80)=0.96 OR = (0.89/0.11) / (0.96/0.04) = 0.36 What a surprise: the same OR??? 10/25/2011 Biostatistics Collaboration Center (BCC) Lecture 3: Intro to Linear and Logistic Regression 80
81 Etensions of Logistic Regression Polytomous response Eact method Conditional logistic regression Longitudinal data 10/25/2011 Biostatistics Collaboration Center (BCC) Lecture 3: Intro to Linear and Logistic Regression 81
82 Co Proportional Hazards Regression Outcome of interest is amount of time from an initial observation until occurrence of a subsequent event Time from baseline eamination until death Goal of Co proportional hazards regression analysis is to eamine predictors of time to an event 10/25/2011 Biostatistics Collaboration Center (BCC) Lecture 3: Intro to Linear and Logistic Regression 82
83 Net Time Statistical Genetics: Classical to Modern 10/25/2011 Biostatistics Collaboration Center (BCC) Lecture 3: Intro to Linear and Logistic Regression 83
84 Useful References Intuitive Biostatistics, Harvey Motulsky, Oford University Press, 1995 Highly readable, minimally technical Practical Statistics for Medical Research, Douglas G. Altman, Chapman & Hall, 1991 Readable, not too technical Fundamentals of Biostatistics, Bernard Rosner, Dubury, 2000 Useful reference, somewhat technical 10/25/2011 Biostatistics Collaboration Center (BCC) Lecture 3: Intro to Linear and Logistic Regression 84
85 Contact BCC Please go to our web site at: Fill out the online request form for further collaboration. 10/25/2011 Biostatistics Collaboration Center (BCC) Lecture 3: Intro to Linear and Logistic Regression 85
Chapter 13 Introduction to Linear Regression and Correlation Analysis
 Chapter 3 Student Lecture Notes 3- Chapter 3 Introduction to Linear Regression and Correlation Analsis Fall 2006 Fundamentals of Business Statistics Chapter Goals To understand the methods for displaing
Chapter 7: Simple linear regression Learning Objectives
 Chapter 7: Simple linear regression Learning Objectives Reading: Section 7.1 of OpenIntro Statistics Video: Correlation vs. causation, YouTube (2:19) Video: Intro to Linear Regression, YouTube (5:18) -
Section 14 Simple Linear Regression: Introduction to Least Squares Regression
 Slide 1 Section 14 Simple Linear Regression: Introduction to Least Squares Regression There are several different measures of statistical association used for understanding the quantitative relationship
CHAPTER 13 SIMPLE LINEAR REGRESSION. Opening Example. Simple Regression. Linear Regression
 Opening Example CHAPTER 13 SIMPLE LINEAR REGREION SIMPLE LINEAR REGREION! Simple Regression! Linear Regression Simple Regression Definition A regression model is a mathematical equation that descries the
Section 3 Part 1. Relationships between two numerical variables
 Section 3 Part 1 Relationships between two numerical variables 1 Relationship between two variables The summary statistics covered in the previous lessons are appropriate for describing a single variable.
X X X a) perfect linear correlation b) no correlation c) positive correlation (r = 1) (r = 0) (0 < r < 1)
 perfect linear correlation b) no correlation c) positive correlation (r = 1) (r = 0) (0 < r < 1)") CORRELATION AND REGRESSION / 47 CHAPTER EIGHT CORRELATION AND REGRESSION Correlation and regression are statistical methods that are commonly used in the medical literature to compare two or more variables.
CORRELATION AND REGRESSION / 47 CHAPTER EIGHT CORRELATION AND REGRESSION Correlation and regression are statistical methods that are commonly used in the medical literature to compare two or more variables.
11. Analysis of Case-control Studies Logistic Regression
 Research methods II 113 11. Analysis of Case-control Studies Logistic Regression This chapter builds upon and further develops the concepts and strategies described in Ch.6 of Mother and Child Health:
Simple Linear Regression Inference
 Simple Linear Regression Inference 1 Inference requirements The Normality assumption of the stochastic term e is needed for inference even if it is not a OLS requirement. Therefore we have: Interpretation
Basic Statistics and Data Analysis for Health Researchers from Foreign Countries
 Basic Statistics and Data Analysis for Health Researchers from Foreign Countries Volkert Siersma siersma@sund.ku.dk The Research Unit for General Practice in Copenhagen Dias 1 Content Quantifying association
Correlation Coefficient The correlation coefficient is a summary statistic that describes the linear relationship between two numerical variables 2
 Lesson 4 Part 1 Relationships between two numerical variables 1 Correlation Coefficient The correlation coefficient is a summary statistic that describes the linear relationship between two numerical variables
" Y. Notation and Equations for Regression Lecture 11/4. Notation:
 Notation: Notation and Equations for Regression Lecture 11/4 m: The number of predictor variables in a regression Xi: One of multiple predictor variables. The subscript i represents any number from 1 through
Regression Analysis: A Complete Example
 Regression Analysis: A Complete Example This section works out an example that includes all the topics we have discussed so far in this chapter. A complete example of regression analysis. PhotoDisc, Inc./Getty
Simple linear regression
 Simple linear regression Introduction Simple linear regression is a statistical method for obtaining a formula to predict values of one variable from another where there is a causal relationship between
Correlational Research. Correlational Research. Stephen E. Brock, Ph.D., NCSP EDS 250. Descriptive Research 1. Correlational Research: Scatter Plots
 Correlational Research Stephen E. Brock, Ph.D., NCSP California State University, Sacramento 1 Correlational Research A quantitative methodology used to determine whether, and to what degree, a relationship
International Statistical Institute, 56th Session, 2007: Phil Everson
 Teaching Regression using American Football Scores Everson, Phil Swarthmore College Department of Mathematics and Statistics 5 College Avenue Swarthmore, PA198, USA E-mail: peverso1@swarthmore.edu 1. Introduction
1. What is the critical value for this 95% confidence interval? CV = z.025 = invnorm(0.025) = 1.96
 = 1.96") 1 Final Review 2 Review 2.1 CI 1-propZint Scenario 1 A TV manufacturer claims in its warranty brochure that in the past not more than 10 percent of its TV sets needed any repair during the first two years
1 Final Review 2 Review 2.1 CI 1-propZint Scenario 1 A TV manufacturer claims in its warranty brochure that in the past not more than 10 percent of its TV sets needed any repair during the first two years
Module 5: Multiple Regression Analysis
 Using Statistical Data Using to Make Statistical Decisions: Data Multiple to Make Regression Decisions Analysis Page 1 Module 5: Multiple Regression Analysis Tom Ilvento, University of Delaware, College
2013 MBA Jump Start Program. Statistics Module Part 3
 2013 MBA Jump Start Program Module 1: Statistics Thomas Gilbert Part 3 Statistics Module Part 3 Hypothesis Testing (Inference) Regressions 2 1 Making an Investment Decision A researcher in your firm just
Part 2: Analysis of Relationship Between Two Variables
 Part 2: Analysis of Relationship Between Two Variables Linear Regression Linear correlation Significance Tests Multiple regression Linear Regression Y = a X + b Dependent Variable Independent Variable
Multivariate Logistic Regression
 1 Multivariate Logistic Regression As in univariate logistic regression, let π(x) represent the probability of an event that depends on p covariates or independent variables. Then, using an inv.logit formulation
Elements of statistics (MATH0487-1)
") Elements of statistics (MATH0487-1) Prof. Dr. Dr. K. Van Steen University of Liège, Belgium December 10, 2012 Introduction to Statistics Basic Probability Revisited Sampling Exploratory Data Analysis -
Elements of statistics (MATH0487-1) Prof. Dr. Dr. K. Van Steen University of Liège, Belgium December 10, 2012 Introduction to Statistics Basic Probability Revisited Sampling Exploratory Data Analysis -
STATISTICA Formula Guide: Logistic Regression. Table of Contents
 : Table of Contents... 1 Overview of Model... 1 Dispersion... 2 Parameterization... 3 Sigma-Restricted Model... 3 Overparameterized Model... 4 Reference Coding... 4 Model Summary (Summary Tab)... 5 Summary
HYPOTHESIS TESTING: CONFIDENCE INTERVALS, T-TESTS, ANOVAS, AND REGRESSION
 HYPOTHESIS TESTING: CONFIDENCE INTERVALS, T-TESTS, ANOVAS, AND REGRESSION HOD 2990 10 November 2010 Lecture Background This is a lightning speed summary of introductory statistical methods for senior undergraduate
Unit 31 A Hypothesis Test about Correlation and Slope in a Simple Linear Regression
 Unit 31 A Hypothesis Test about Correlation and Slope in a Simple Linear Regression Objectives: To perform a hypothesis test concerning the slope of a least squares line To recognize that testing for a
1) Write the following as an algebraic expression using x as the variable: Triple a number subtracted from the number
 Write the following as an algebraic expression using x as the variable: Triple a number subtracted from the number") 1) Write the following as an algebraic expression using x as the variable: Triple a number subtracted from the number A. 3(x - x) B. x 3 x C. 3x - x D. x - 3x 2) Write the following as an algebraic expression
1) Write the following as an algebraic expression using x as the variable: Triple a number subtracted from the number A. 3(x - x) B. x 3 x C. 3x - x D. x - 3x 2) Write the following as an algebraic expression
II. DISTRIBUTIONS distribution normal distribution. standard scores
 Appendix D Basic Measurement And Statistics The following information was developed by Steven Rothke, PhD, Department of Psychology, Rehabilitation Institute of Chicago (RIC) and expanded by Mary F. Schmidt,
Overview Classes. 12-3 Logistic regression (5) 19-3 Building and applying logistic regression (6) 26-3 Generalizations of logistic regression (7)
 19-3 Building and applying logistic regression (6) 26-3 Generalizations of logistic regression (7)") Overview Classes 12-3 Logistic regression (5) 19-3 Building and applying logistic regression (6) 26-3 Generalizations of logistic regression (7) 2-4 Loglinear models (8) 5-4 15-17 hrs; 5B02 Building and
Overview Classes 12-3 Logistic regression (5) 19-3 Building and applying logistic regression (6) 26-3 Generalizations of logistic regression (7) 2-4 Loglinear models (8) 5-4 15-17 hrs; 5B02 Building and
Introduction to Statistics and Quantitative Research Methods
 Introduction to Statistics and Quantitative Research Methods Purpose of Presentation To aid in the understanding of basic statistics, including terminology, common terms, and common statistical methods.
Introduction to Quantitative Methods
 Introduction to Quantitative Methods October 15, 2009 Contents 1 Definition of Key Terms 2 2 Descriptive Statistics 3 2.1 Frequency Tables......................... 4 2.2 Measures of Central Tendencies.................
Introduction. Hypothesis Testing. Hypothesis Testing. Significance Testing
 Introduction Hypothesis Testing Mark Lunt Arthritis Research UK Centre for Ecellence in Epidemiology University of Manchester 13/10/2015 We saw last week that we can never know the population parameters
SIMPLE LINEAR CORRELATION. r can range from -1 to 1, and is independent of units of measurement. Correlation can be done on two dependent variables.
 SIMPLE LINEAR CORRELATION Simple linear correlation is a measure of the degree to which two variables vary together, or a measure of the intensity of the association between two variables. Correlation
Statistical Models in R
 Statistical Models in R Some Examples Steven Buechler Department of Mathematics 276B Hurley Hall; 1-6233 Fall, 2007 Outline Statistical Models Structure of models in R Model Assessment (Part IA) Anova
Outline. Topic 4 - Analysis of Variance Approach to Regression. Partitioning Sums of Squares. Total Sum of Squares. Partitioning sums of squares
 Topic 4 - Analysis of Variance Approach to Regression Outline Partitioning sums of squares Degrees of freedom Expected mean squares General linear test - Fall 2013 R 2 and the coefficient of correlation
UNIVERSITY OF NAIROBI
 UNIVERSITY OF NAIROBI MASTERS IN PROJECT PLANNING AND MANAGEMENT NAME: SARU CAROLYNN ELIZABETH REGISTRATION NO: L50/61646/2013 COURSE CODE: LDP 603 COURSE TITLE: RESEARCH METHODS LECTURER: GAKUU CHRISTOPHER
Unit 12 Logistic Regression Supplementary Chapter 14 in IPS On CD (Chap 16, 5th ed.)
") Unit 12 Logistic Regression Supplementary Chapter 14 in IPS On CD (Chap 16, 5th ed.) Logistic regression generalizes methods for 2-way tables Adds capability studying several predictors, but Limited to
Unit 12 Logistic Regression Supplementary Chapter 14 in IPS On CD (Chap 16, 5th ed.) Logistic regression generalizes methods for 2-way tables Adds capability studying several predictors, but Limited to
Simple Regression Theory II 2010 Samuel L. Baker
 SIMPLE REGRESSION THEORY II 1 Simple Regression Theory II 2010 Samuel L. Baker Assessing how good the regression equation is likely to be Assignment 1A gets into drawing inferences about how close the
Chapter 9 Descriptive Statistics for Bivariate Data
 9.1 Introduction 215 Chapter 9 Descriptive Statistics for Bivariate Data 9.1 Introduction We discussed univariate data description (methods used to eplore the distribution of the values of a single variable)
Association Between Variables
 Contents 11 Association Between Variables 767 11.1 Introduction............................ 767 11.1.1 Measure of Association................. 768 11.1.2 Chapter Summary.................... 769 11.2 Chi
17. SIMPLE LINEAR REGRESSION II
 17. SIMPLE LINEAR REGRESSION II The Model In linear regression analysis, we assume that the relationship between X and Y is linear. This does not mean, however, that Y can be perfectly predicted from X.
Additional sources Compilation of sources: http://lrs.ed.uiuc.edu/tseportal/datacollectionmethodologies/jin-tselink/tselink.htm
 Mgt 540 Research Methods Data Analysis 1 Additional sources Compilation of sources: http://lrs.ed.uiuc.edu/tseportal/datacollectionmethodologies/jin-tselink/tselink.htm http://web.utk.edu/~dap/random/order/start.htm
Handling missing data in Stata a whirlwind tour
 Handling missing data in Stata a whirlwind tour 2012 Italian Stata Users Group Meeting Jonathan Bartlett www.missingdata.org.uk 20th September 2012 1/55 Outline The problem of missing data and a principled
Organizing Your Approach to a Data Analysis
 Biost/Stat 578 B: Data Analysis Emerson, September 29, 2003 Handout #1 Organizing Your Approach to a Data Analysis The general theme should be to maximize thinking about the data analysis and to minimize
DESCRIPTIVE STATISTICS. The purpose of statistics is to condense raw data to make it easier to answer specific questions; test hypotheses.
 DESCRIPTIVE STATISTICS The purpose of statistics is to condense raw data to make it easier to answer specific questions; test hypotheses. DESCRIPTIVE VS. INFERENTIAL STATISTICS Descriptive To organize,
Answer: C. The strength of a correlation does not change if units change by a linear transformation such as: Fahrenheit = 32 + (5/9) * Centigrade
 * Centigrade") Statistics Quiz Correlation and Regression -- ANSWERS 1. Temperature and air pollution are known to be correlated. We collect data from two laboratories, in Boston and Montreal. Boston makes their measurements
Statistics Quiz Correlation and Regression -- ANSWERS 1. Temperature and air pollution are known to be correlated. We collect data from two laboratories, in Boston and Montreal. Boston makes their measurements
Statistics 305: Introduction to Biostatistical Methods for Health Sciences
 Statistics 305: Introduction to Biostatistical Methods for Health Sciences Modelling the Log Odds Logistic Regression (Chap 20) Instructor: Liangliang Wang Statistics and Actuarial Science, Simon Fraser
MULTIPLE REGRESSION AND ISSUES IN REGRESSION ANALYSIS
 MULTIPLE REGRESSION AND ISSUES IN REGRESSION ANALYSIS MSR = Mean Regression Sum of Squares MSE = Mean Squared Error RSS = Regression Sum of Squares SSE = Sum of Squared Errors/Residuals α = Level of Significance
Introduction to Longitudinal Data Analysis
 Introduction to Longitudinal Data Analysis Longitudinal Data Analysis Workshop Section 1 University of Georgia: Institute for Interdisciplinary Research in Education and Human Development Section 1: Introduction
Simple Linear Regression
 STAT 101 Dr. Kari Lock Morgan Simple Linear Regression SECTIONS 9.3 Confidence and prediction intervals (9.3) Conditions for inference (9.1) Want More Stats??? If you have enjoyed learning how to analyze
Descriptive Statistics
 Descriptive Statistics Primer Descriptive statistics Central tendency Variation Relative position Relationships Calculating descriptive statistics Descriptive Statistics Purpose to describe or summarize
DATA INTERPRETATION AND STATISTICS
 PholC60 September 001 DATA INTERPRETATION AND STATISTICS Books A easy and systematic introductory text is Essentials of Medical Statistics by Betty Kirkwood, published by Blackwell at about 14. DESCRIPTIVE
LOGISTIC REGRESSION ANALYSIS
 LOGISTIC REGRESSION ANALYSIS C. Mitchell Dayton Department of Measurement, Statistics & Evaluation Room 1230D Benjamin Building University of Maryland September 1992 1. Introduction and Model Logistic
Module 3: Correlation and Covariance
 Using Statistical Data to Make Decisions Module 3: Correlation and Covariance Tom Ilvento Dr. Mugdim Pašiƒ University of Delaware Sarajevo Graduate School of Business O ften our interest in data analysis
2. Simple Linear Regression
 Research methods - II 3 2. Simple Linear Regression Simple linear regression is a technique in parametric statistics that is commonly used for analyzing mean response of a variable Y which changes according
The correlation coefficient
 The correlation coefficient Clinical Biostatistics The correlation coefficient Martin Bland Correlation coefficients are used to measure the of the relationship or association between two quantitative
Individual Growth Analysis Using PROC MIXED Maribeth Johnson, Medical College of Georgia, Augusta, GA
 Paper P-702 Individual Growth Analysis Using PROC MIXED Maribeth Johnson, Medical College of Georgia, Augusta, GA ABSTRACT Individual growth models are designed for exploring longitudinal data on individuals
Algebra 1 Course Information
 Course Information Course Description: Students will study patterns, relations, and functions, and focus on the use of mathematical models to understand and analyze quantitative relationships. Through
Multinomial and Ordinal Logistic Regression
 Multinomial and Ordinal Logistic Regression ME104: Linear Regression Analysis Kenneth Benoit August 22, 2012 Regression with categorical dependent variables When the dependent variable is categorical,
Ordinal Regression. Chapter
 Ordinal Regression Chapter 4 Many variables of interest are ordinal. That is, you can rank the values, but the real distance between categories is unknown. Diseases are graded on scales from least severe
Statistics for Sports Medicine
 Statistics for Sports Medicine Suzanne Hecht, MD University of Minnesota (suzanne.hecht@gmail.com) Fellow s Research Conference July 2012: Philadelphia GOALS Try not to bore you to death!! Try to teach
Coefficient of Determination
 Coefficient of Determination The coefficient of determination R 2 (or sometimes r 2 ) is another measure of how well the least squares equation ŷ = b 0 + b 1 x performs as a predictor of y. R 2 is computed
Regression III: Advanced Methods
 Lecture 16: Generalized Additive Models Regression III: Advanced Methods Bill Jacoby Michigan State University http://polisci.msu.edu/jacoby/icpsr/regress3 Goals of the Lecture Introduce Additive Models
Principles of Hypothesis Testing for Public Health
 Principles of Hypothesis Testing for Public Health Laura Lee Johnson, Ph.D. Statistician National Center for Complementary and Alternative Medicine johnslau@mail.nih.gov Fall 2011 Answers to Questions
Business Statistics. Successful completion of Introductory and/or Intermediate Algebra courses is recommended before taking Business Statistics.
 Business Course Text Bowerman, Bruce L., Richard T. O'Connell, J. B. Orris, and Dawn C. Porter. Essentials of Business, 2nd edition, McGraw-Hill/Irwin, 2008, ISBN: 978-0-07-331988-9. Required Computing
Correlation and Regression
 Correlation and Regression Scatterplots Correlation Explanatory and response variables Simple linear regression General Principles of Data Analysis First plot the data, then add numerical summaries Look
1 Simple Linear Regression I Least Squares Estimation
 Simple Linear Regression I Least Squares Estimation Textbook Sections: 8. 8.3 Previously, we have worked with a random variable x that comes from a population that is normally distributed with mean µ and
Univariate Regression
 Univariate Regression Correlation and Regression The regression line summarizes the linear relationship between 2 variables Correlation coefficient, r, measures strength of relationship: the closer r is
business statistics using Excel OXFORD UNIVERSITY PRESS Glyn Davis & Branko Pecar
 business statistics using Excel Glyn Davis & Branko Pecar OXFORD UNIVERSITY PRESS Detailed contents Introduction to Microsoft Excel 2003 Overview Learning Objectives 1.1 Introduction to Microsoft Excel
1.5 Oneway Analysis of Variance
 Statistics: Rosie Cornish. 200. 1.5 Oneway Analysis of Variance 1 Introduction Oneway analysis of variance (ANOVA) is used to compare several means. This method is often used in scientific or medical experiments
Correlation key concepts:
 CORRELATION Correlation key concepts: Types of correlation Methods of studying correlation a) Scatter diagram b) Karl pearson s coefficient of correlation c) Spearman s Rank correlation coefficient d)
Course Text. Required Computing Software. Course Description. Course Objectives. StraighterLine. Business Statistics
 Course Text Business Statistics Lind, Douglas A., Marchal, William A. and Samuel A. Wathen. Basic Statistics for Business and Economics, 7th edition, McGraw-Hill/Irwin, 2010, ISBN: 9780077384470 [This
Multiple Regression: What Is It?
 Multiple Regression Multiple Regression: What Is It? Multiple regression is a collection of techniques in which there are multiple predictors of varying kinds and a single outcome We are interested in
Introduction to Regression and Data Analysis
 Statlab Workshop Introduction to Regression and Data Analysis with Dan Campbell and Sherlock Campbell October 28, 2008 I. The basics A. Types of variables Your variables may take several forms, and it
Chapter 10. Key Ideas Correlation, Correlation Coefficient (r),
,") Chapter 0 Key Ideas Correlation, Correlation Coefficient (r), Section 0-: Overview We have already explored the basics of describing single variable data sets. However, when two quantitative variables
Chapter 0 Key Ideas Correlation, Correlation Coefficient (r), Section 0-: Overview We have already explored the basics of describing single variable data sets. However, when two quantitative variables
1. The parameters to be estimated in the simple linear regression model Y=α+βx+ε ε~n(0,σ) are: a) α, β, σ b) α, β, ε c) a, b, s d) ε, 0, σ
 are: a) α, β, σ b) α, β, ε c) a, b, s d) ε, 0, σ") STA 3024 Practice Problems Exam 2 NOTE: These are just Practice Problems. This is NOT meant to look just like the test, and it is NOT the only thing that you should study. Make sure you know all the material
STA 3024 Practice Problems Exam 2 NOTE: These are just Practice Problems. This is NOT meant to look just like the test, and it is NOT the only thing that you should study. Make sure you know all the material
13. Poisson Regression Analysis
 136 Poisson Regression Analysis 13. Poisson Regression Analysis We have so far considered situations where the outcome variable is numeric and Normally distributed, or binary. In clinical work one often
Example: Boats and Manatees
 Figure 9-6 Example: Boats and Manatees Slide 1 Given the sample data in Table 9-1, find the value of the linear correlation coefficient r, then refer to Table A-6 to determine whether there is a significant
Chapter 5 Analysis of variance SPSS Analysis of variance
 Chapter 5 Analysis of variance SPSS Analysis of variance Data file used: gss.sav How to get there: Analyze Compare Means One-way ANOVA To test the null hypothesis that several population means are equal,
I L L I N O I S UNIVERSITY OF ILLINOIS AT URBANA-CHAMPAIGN
 Beckman HLM Reading Group: Questions, Answers and Examples Carolyn J. Anderson Department of Educational Psychology I L L I N O I S UNIVERSITY OF ILLINOIS AT URBANA-CHAMPAIGN Linear Algebra Slide 1 of
STAT 350 Practice Final Exam Solution (Spring 2015)
") PART 1: Multiple Choice Questions: 1) A study was conducted to compare five different training programs for improving endurance. Forty subjects were randomly divided into five groups of eight subjects
PART 1: Multiple Choice Questions: 1) A study was conducted to compare five different training programs for improving endurance. Forty subjects were randomly divided into five groups of eight subjects
Overview of Violations of the Basic Assumptions in the Classical Normal Linear Regression Model
 Overview of Violations of the Basic Assumptions in the Classical Normal Linear Regression Model 1 September 004 A. Introduction and assumptions The classical normal linear regression model can be written
STATS8: Introduction to Biostatistics. Data Exploration. Babak Shahbaba Department of Statistics, UCI
 STATS8: Introduction to Biostatistics Data Exploration Babak Shahbaba Department of Statistics, UCI Introduction After clearly defining the scientific problem, selecting a set of representative members
Teaching Multivariate Analysis to Business-Major Students
 Teaching Multivariate Analysis to Business-Major Students Wing-Keung Wong and Teck-Wong Soon - Kent Ridge, Singapore 1. Introduction During the last two or three decades, multivariate statistical analysis
Predictor Coef StDev T P Constant 970667056 616256122 1.58 0.154 X 0.00293 0.06163 0.05 0.963. S = 0.5597 R-Sq = 0.0% R-Sq(adj) = 0.
 = 0.") Statistical analysis using Microsoft Excel Microsoft Excel spreadsheets have become somewhat of a standard for data storage, at least for smaller data sets. This, along with the program often being packaged
Statistical analysis using Microsoft Excel Microsoft Excel spreadsheets have become somewhat of a standard for data storage, at least for smaller data sets. This, along with the program often being packaged
New Work Item for ISO 3534-5 Predictive Analytics (Initial Notes and Thoughts) Introduction
 Introduction") Introduction New Work Item for ISO 3534-5 Predictive Analytics (Initial Notes and Thoughts) Predictive analytics encompasses the body of statistical knowledge supporting the analysis of massive data sets.
Introduction New Work Item for ISO 3534-5 Predictive Analytics (Initial Notes and Thoughts) Predictive analytics encompasses the body of statistical knowledge supporting the analysis of massive data sets.
Final Exam Practice Problem Answers
 Final Exam Practice Problem Answers The following data set consists of data gathered from 77 popular breakfast cereals. The variables in the data set are as follows: Brand: The brand name of the cereal
Factors affecting online sales
 Factors affecting online sales Table of contents Summary... 1 Research questions... 1 The dataset... 2 Descriptive statistics: The exploratory stage... 3 Confidence intervals... 4 Hypothesis tests... 4
The Big Picture. Correlation. Scatter Plots. Data
 The Big Picture Correlation Bret Hanlon and Bret Larget Department of Statistics Universit of Wisconsin Madison December 6, We have just completed a length series of lectures on ANOVA where we considered
Section Format Day Begin End Building Rm# Instructor. 001 Lecture Tue 6:45 PM 8:40 PM Silver 401 Ballerini
 NEW YORK UNIVERSITY ROBERT F. WAGNER GRADUATE SCHOOL OF PUBLIC SERVICE Course Syllabus Spring 2016 Statistical Methods for Public, Nonprofit, and Health Management Section Format Day Begin End Building
Fairfield Public Schools
 Mathematics Fairfield Public Schools AP Statistics AP Statistics BOE Approved 04/08/2014 1 AP STATISTICS Critical Areas of Focus AP Statistics is a rigorous course that offers advanced students an opportunity
Chicago Booth BUSINESS STATISTICS 41000 Final Exam Fall 2011
 Chicago Booth BUSINESS STATISTICS 41000 Final Exam Fall 2011 Name: Section: I pledge my honor that I have not violated the Honor Code Signature: This exam has 34 pages. You have 3 hours to complete this
Section 1: Simple Linear Regression
 Section 1: Simple Linear Regression Carlos M. Carvalho The University of Texas McCombs School of Business http://faculty.mccombs.utexas.edu/carlos.carvalho/teaching/ 1 Regression: General Introduction
Premaster Statistics Tutorial 4 Full solutions
 Premaster Statistics Tutorial 4 Full solutions Regression analysis Q1 (based on Doane & Seward, 4/E, 12.7) a. Interpret the slope of the fitted regression = 125,000 + 150. b. What is the prediction for
Chi Squared and Fisher's Exact Tests. Observed vs Expected Distributions
 BMS 617 Statistical Techniques for the Biomedical Sciences Lecture 11: Chi-Squared and Fisher's Exact Tests Chi Squared and Fisher's Exact Tests This lecture presents two similarly structured tests, Chi-squared
Lecture Notes Module 1
 Lecture Notes Module 1 Study Populations A study population is a clearly defined collection of people, animals, plants, or objects. In psychological research, a study population usually consists of a specific
Notes on Applied Linear Regression
 Notes on Applied Linear Regression Jamie DeCoster Department of Social Psychology Free University Amsterdam Van der Boechorststraat 1 1081 BT Amsterdam The Netherlands phone: +31 (0)20 444-8935 email:
Part II. Multiple Linear Regression
 Part II Multiple Linear Regression 86 Chapter 7 Multiple Regression A multiple linear regression model is a linear model that describes how a y-variable relates to two or more xvariables (or transformations
Linear Models in STATA and ANOVA
 Session 4 Linear Models in STATA and ANOVA Page Strengths of Linear Relationships 4-2 A Note on Non-Linear Relationships 4-4 Multiple Linear Regression 4-5 Removal of Variables 4-8 Independent Samples
SAMPLE SIZE TABLES FOR LOGISTIC REGRESSION
 STATISTICS IN MEDICINE, VOL. 8, 795-802 (1989) SAMPLE SIZE TABLES FOR LOGISTIC REGRESSION F. Y. HSIEH* Department of Epidemiology and Social Medicine, Albert Einstein College of Medicine, Bronx, N Y 10461,
Econometrics Simple Linear Regression
 Econometrics Simple Linear Regression Burcu Eke UC3M Linear equations with one variable Recall what a linear equation is: y = b 0 + b 1 x is a linear equation with one variable, or equivalently, a straight
MULTIPLE CHOICE. Choose the one alternative that best completes the statement or answers the question.
 Module 7 Test Name MULTIPLE CHOICE. Choose the one alternative that best completes the statement or answers the question. You are given information about a straight line. Use two points to graph the equation.