Graphical Perception as a Basis for Drawing Graphs. Ross Ihaka University of Auckland
|
|
|
- Eustace Mason
- 7 years ago
- Views:
Transcription
1 Graphical Perception as a Basis for Drawing Graphs Ross Ihaka University of Auckland
2 Outline Scope of the talk Colour choice for area fills Drawing smooth curves Extension to piecewise smooth curves
3 Colour Choosing colours that work together is hard! Relying on judgement or taste is very unreliable for most of us. Choosing colours for data graphics is even harder, because badly chosen colours may not just look horrible, they can also be misleading.
4 The Irradiation Illusion
5 Simultaneous Contrast
6 Colour Theory 101 The normal human eye has three colour receptors with peak sensitivities in the red, green, and blue regions of the spectrum. A sensation of colour can be produced stimulating the red, green and blue receptors with pure (single wavelength) colours at the peak sensitivity of each kind of receptor. This permits an external description of colour by the amount of each primary used to produce the colours. RGB: the amounts of red, green, and blue light used to produce the colour. HSV: a mapping of RGB into hue, saturation and value that correlates better with our perception of colour in terms of hue (colour of the rainbow), purity (red vs pink) and brightness (light vs dark) of colours.
7 Colour Theory 101 A better understanding of colour can be gained by understanding how the vision system processes colour. Internal circuitry converts the signals from the receptors into light-dark, yellow-blue and red-green signals. Transformation of the yellow-blue and red-green signals to polar coordinates converts them to our perceptual notions of colour-hue and colour purity. The mapping of colour stimulus to perceived colours is highly non-linear. It is useful to try to mimic this non-linearity to match the way that we see colours.
8 Perception of Colour The use of RGB and HSV spaces does not yield a faithful representation of the way in which we perceive colour. It is useful to apply a non-linear transformation to the three-dimensional colour space to make it more perceptually uniform. Euclidean distances in the transformed space provide a measure of perceptual distances. Pairs of colours the same distance apart in the space will appear equally similar. A number of spaces have been defined which provide perceptually uniform representations of colour that can be transformed in RGB or other colour specifications.
9 Uniform Colour Spaces CIELAB is used in the printing industry (subtractive colour applications) CIELUV is used in lighting applications (additive colour) CIEUVW is an attempt to be even more perceptually uniform. Use of these spaces makes it possible to specify colour in a way that matches human perception.
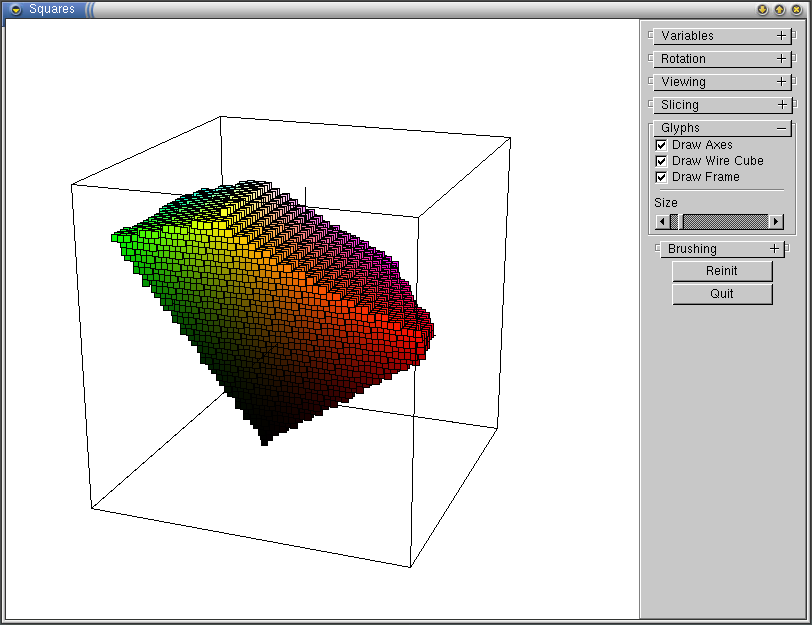
10 LUV Space

11 Horizontal Slices of LUV Colours on each of the circles differ only in hue.
12 Choosing Fill Colours Choose a set of colours that are equally bright and equally colourful. This ensures that we view the colours without bias. Equal brightness eliminates illumination illusion effects. Equal colourfulness means the eye is not preferentially drawn to particular areas. There is also a useful side-effect of choosing colours in this way...
13 Colour Harmony Choosing colours that work together harmoniously is hard. A few people have an innate ability to do this, but most of us don t. In the course of teaching painting at art school, Albert Munsell quantified a set of rules for producing harmonious colours. The essence of these rules is to choose colours equally spaced along smooth curves in a perceptually uniform colour space. The proposed method of choosing colours fits this principle.
14 Equally-Spaced HSV Colours
15 Equally-Spaced HSV Colours The circus wheel and poster, although they yell successfully for momentary attention, soon become so painful to the vision that we turn from them. Albert Munsell
16 Equally-Spaced Harmonious Colours The following colours were chosen using the R hcl function. A Six Colour Palette (L = 85, C = 35)
17 Equally-Spaced Harmonious Colours Darker, more colourful colours chosen using the R hcl function. A Six Colour Palette (L = 75, C = 55)
18 Computer Science PhD Graduates Fall Summer Spring Winter 20 Students Year Equispaced colours, full circle. hcl(h = 30 + seq(0, 360, length=5)[1:4], 35, 85)
19 Computer Science PhD Graduates Fall Summer Spring Winter 20 Students Year Equispaced colours, half circle. hcl(h = seq(60, 240, by = 60), 35, 85)
20 Computer Science PhD Graduates Fall Summer Spring Winter 20 Students Year Metaphorical colours. csphd(hcl(h = seq(210, 60,length = 4), 35, 85))
21 Computer Science PhD Graduates Fall Summer Spring Winter 20 Students Year Cool colours. hcl(h = seq(120, 0, length = 4) + 150, 35, 85)
22 Computer Science PhD Graduates Fall Summer Spring Winter 20 Students Year Warm colours. hcl(h = seq(120, 0, length = 4) - 30, 35, 85)
23 Drawing Smooth Curves Given an arbitrary function f and an interval [a,b], I want to have an automatic procedure that will draw the graph of the function over the interval. Using the procedure should be as easy as this. plot(f, a, b) At this level of generality the problem is hard but, for more restricted classes of function, progress can be made. This talk will mostly consider smooth (i.e. differentiable) functions but will also mention piecewise-smooth functions.
24 Curves and Polylines In computer graphics, a polyline is a connected set of line segments. A standard method for drawing parametric curves in a vector drawing system uses a polyline approximation based on (many) equally-spaced parameter values. Drawing the graph of a function f (x) over an interval [a,b] is an important special case. This is the method used in the R function curve, which uses 101 equally-spaced points by default.
25 A Smooth Function
26 A Smooth Function
27 A Smooth Function
28 A Smooth Function Absolute Error
29 What Makes a Polyline Approximation Good? Even when the accuracy of the polyline approximation is good, it may not look right because it is clearly not a smooth curve. This is because the visual system detects the corners at the joins of the segments making up the polyline. This is very much like the edge-detection process built into the visual system. The real issue here is one of visual perception rather than mathematical accuracy.
30 Visual Detection of Polyline Joins As with many perceptual phenomena, there appears to be a threshold effect for detection of a join between polylines. When the change direction, θ, of the polylines is small (e.g. < 3 ), no join is detected and the transition from one segment to the next is seen as smooth. θ
31 Drawing Visually Smooth Polylines To draw a polyline approximation to a curve that is visually smooth: Choose points along the curve so that the change of angle from segment to segment is less than the visually smooth threshold. Draw the polyline that joins the points.
32 Mathematical Formulation Given a smooth function f : [a,b] R, let φ(x) be the angle that the tangent to f (x) at x makes with the x-axis. We want to choose a = x 0 < x 1 < x 2 < < x n = b so that the change of angle from x i to x i+1 is small. I.e., for some suitably small δ the x i should satisfy φ(x i+1 ) φ(x i ) < δ for i = 1,...,n. How can the x i values be chosen to make this happen?
33 A Solution The function h(x) = x a φ (t) dt. is a monotonically non-decreasing function of x and so has a well-defined inverse. Further, if u < v, v φ(v) φ(u) = φ v (t)dt φ (t) dt = h(v) h(u) u u Choose points h(a) = y 0 < y 1 < y 2 < < y n = h(b) such that y i+1 y i < δ for all i. Set x i = h 1 (y i ) then the points ( x0, f (x 0 ) ), ( x 1, f (x 2 ) ),..., ( x n, f (x n ) ) define the approximating polyline.
34 Choice of Plotting Ordinates h(x) x
35 A Smooth Polyline Approximation (86 Points)
36 Computer Implementation To implement the method in a computer the continuous problem is approximated by its discrete version using a very finely spaced grid of points splitting up the interval from a to b. Derivatives are replaced by differences. Indefinite integrals are replaced by cumulative sums. Linear interpolation can be used to compute h(x) and h 1 (u).
37 An R Implementation smoothx = function(f, a, b, delta = 2.5, n = 1001) { dr = delta * pi / 180 x = seq(a, b, length = n) y = f(x) <Compute scalings ax and ay> phi = atan2(ay * diff(y), ax * diff(x)) d.phi = c(0, diff(phi), 0) u = cumsum(abs(d.phi) + 1e-3/n) if (u[n] - u[1] < dr) x[c(1, length(x))] else approx(u, x, n = ceiling((u[n] - u[1])/dr) + 1)$y }
38 Piecewise Continuous Functions There are many (useful/interesting) functions that not continuous on their domain or which lie partly outside the plotting window of interest. Extending the drawing method outlined previously requires decomposing the domain of a function into intervals where the smooth polyline approximation can be used. This means dealing with: Regions where the function is out of the viewing window (clipping). Points where the function is not defined. Simple function discontinuities. Asymptotes.
39 Houston, We Have a Problem Patent No.: US 6,704,013 B2 Michael E. Hosea, 2004 (Texas Instruments) FUNCTION GRAPHING METHOD WITH DETECTION OF DISCONTINUITIES Patent No.: US 7,595,801 B1 Barry M. Cherkas, 2009 COMPLETE FUNCTION GRAPHING SYSTEM AND METHOD Patent No.: US 7,920,142 B2 Luke Kelly and Jinsong Yu, 2009 (Microsoft) IDENTIFYING ASYMPTOTES IN APPROXIMATED CURVES AND SURFACES. These (software) patents make work in this area problematic.
40 Example: A Discontinuous Function /2 0 1/2 1
41 Example: A Density From Ash s Basic Probability Theory
42 Example: The Gamma Function (A Torture Test)
43 Example: An Empirical CDF 1 1/ /2 1
44 Example: An Empirical CDF 1 1/ /2 1
45 Curves and Area Fills /2 0 1/2 1
46 Summary Keeping the constraints and capabilities of human perception in mind can help with the production of software for drawing information (and other) graphics. Two examples were presented. Choosing colours for area fills. Drawing smooth curves.
CBIR: Colour Representation. COMPSCI.708.S1.C A/P Georgy Gimel farb
 CBIR: Colour Representation COMPSCI.708.S1.C A/P Georgy Gimel farb Colour Representation Colour is the most widely used visual feature in multimedia context CBIR systems are not aware of the difference
Overview. Raster Graphics and Color. Overview. Display Hardware. Liquid Crystal Display (LCD) Cathode Ray Tube (CRT)
 Cathode Ray Tube (CRT)") Raster Graphics and Color Greg Humphreys CS445: Intro Graphics University of Virginia, Fall 2004 Color models Color models Display Hardware Video display devices Cathode Ray Tube (CRT) Liquid Crystal Display
Raster Graphics and Color Greg Humphreys CS445: Intro Graphics University of Virginia, Fall 2004 Color models Color models Display Hardware Video display devices Cathode Ray Tube (CRT) Liquid Crystal Display
Outline. Quantizing Intensities. Achromatic Light. Optical Illusion. Quantizing Intensities. CS 430/585 Computer Graphics I
 CS 430/585 Computer Graphics I Week 8, Lecture 15 Outline Light Physical Properties of Light and Color Eye Mechanism for Color Systems to Define Light and Color David Breen, William Regli and Maxim Peysakhov
Colour Image Segmentation Technique for Screen Printing
 60 R.U. Hewage and D.U.J. Sonnadara Department of Physics, University of Colombo, Sri Lanka ABSTRACT Screen-printing is an industry with a large number of applications ranging from printing mobile phone
GIS Tutorial 1. Lecture 2 Map design
 GIS Tutorial 1 Lecture 2 Map design Outline Choropleth maps Colors Vector GIS display GIS queries Map layers and scale thresholds Hyperlinks and map tips 2 Lecture 2 CHOROPLETH MAPS Choropleth maps Color-coded
Computer Vision. Color image processing. 25 August 2014
 Computer Vision Color image processing 25 August 2014 Copyright 2001 2014 by NHL Hogeschool and Van de Loosdrecht Machine Vision BV All rights reserved j.van.de.loosdrecht@nhl.nl, jaap@vdlmv.nl Color image
Choosing Colors for Data Visualization Maureen Stone January 17, 2006
 Choosing Colors for Data Visualization Maureen Stone January 17, 2006 The problem of choosing colors for data visualization is expressed by this quote from information visualization guru Edward Tufte:
the points are called control points approximating curve
 Chapter 4 Spline Curves A spline curve is a mathematical representation for which it is easy to build an interface that will allow a user to design and control the shape of complex curves and surfaces.
Expert Color Choices for Presenting Data
 Expert Color Choices for Presenting Data Maureen Stone, StoneSoup Consulting The problem of choosing colors for data visualization is expressed by this quote from information visualization guru Edward
Escaping RGBland: Selecting Colors for Statistical Graphics
 Escaping RGBland: Selecting Colors for Statistical Graphics Achim Zeileis, Kurt Hornik, Paul Murrell http://statmath.wu.ac.at/~zeileis/ Overview Motivation Color in statistical graphics Challenges Illustrations
MA 323 Geometric Modelling Course Notes: Day 02 Model Construction Problem
 MA 323 Geometric Modelling Course Notes: Day 02 Model Construction Problem David L. Finn November 30th, 2004 In the next few days, we will introduce some of the basic problems in geometric modelling, and
DESIGN ELEMENTS OF DESIGN
 DESIGN Definition of Design: The term has different connotations in different fields. Informally, a design refers to a plan for the construction of an object (as in architectural blueprints and sewing
A simpler version of this lesson is covered in the basic version of these teacher notes.
 Lesson Element Colour Theory Lesson 2 Advanced Colour Theory A simpler version of this lesson is covered in the basic version of these teacher notes. Task instructions The objective of the lesson is to
Assessment. Presenter: Yupu Zhang, Guoliang Jin, Tuo Wang Computer Vision 2008 Fall
 Automatic Photo Quality Assessment Presenter: Yupu Zhang, Guoliang Jin, Tuo Wang Computer Vision 2008 Fall Estimating i the photorealism of images: Distinguishing i i paintings from photographs h Florin
(Refer Slide Time: 1:42)
") Introduction to Computer Graphics Dr. Prem Kalra Department of Computer Science and Engineering Indian Institute of Technology, Delhi Lecture - 10 Curves So today we are going to have a new topic. So far
Introduction to Computer Graphics Dr. Prem Kalra Department of Computer Science and Engineering Indian Institute of Technology, Delhi Lecture - 10 Curves So today we are going to have a new topic. So far
Classroom Tips and Techniques: The Student Precalculus Package - Commands and Tutors. Content of the Precalculus Subpackage
 Classroom Tips and Techniques: The Student Precalculus Package - Commands and Tutors Robert J. Lopez Emeritus Professor of Mathematics and Maple Fellow Maplesoft This article provides a systematic exposition
Color. & the CIELAB. System
 Color & the CIELAB System An Interpretation of the CIELAB System olor perception has been debated for many years and, as in any evaluation that relies on human senses, the essence of analysis remains subjective.
STT315 Chapter 4 Random Variables & Probability Distributions KM. Chapter 4.5, 6, 8 Probability Distributions for Continuous Random Variables
 Chapter 4.5, 6, 8 Probability Distributions for Continuous Random Variables Discrete vs. continuous random variables Examples of continuous distributions o Uniform o Exponential o Normal Recall: A random
Perception of Light and Color
 Perception of Light and Color Theory and Practice Trichromacy Three cones types in retina a b G+B +R Cone sensitivity functions 100 80 60 40 20 400 500 600 700 Wavelength (nm) Short wavelength sensitive
THE BASICS OF COLOUR THEORY
 HUE: VALUE: THE BASICS OF COLOUR THEORY Hue is another word for colour, such as blue, red, yellow-green Distinguishes between the lightness (tint) and darkness (shade) of Colours. (TONE) CHROMA: The vibrancy
Georgia Department of Education Kathy Cox, State Superintendent of Schools 7/19/2005 All Rights Reserved 1
 Accelerated Mathematics 3 This is a course in precalculus and statistics, designed to prepare students to take AB or BC Advanced Placement Calculus. It includes rational, circular trigonometric, and inverse
L 2 : x = s + 1, y = s, z = 4s + 4. 3. Suppose that C has coordinates (x, y, z). Then from the vector equality AC = BD, one has
. Then from the vector equality AC = BD, one has") The line L through the points A and B is parallel to the vector AB = 3, 2, and has parametric equations x = 3t + 2, y = 2t +, z = t Therefore, the intersection point of the line with the plane should satisfy:
The line L through the points A and B is parallel to the vector AB = 3, 2, and has parametric equations x = 3t + 2, y = 2t +, z = t Therefore, the intersection point of the line with the plane should satisfy:
Diverging Color Maps for Scientific Visualization
 Diverging Color Maps for Scientific Visualization Kenneth Moreland Sandia National Laboratories Abstract. One of the most fundamental features of scientific visualization is the process of mapping scalar
UNDERSTANDING DIFFERENT COLOUR SCHEMES MONOCHROMATIC COLOUR
 UNDERSTANDING DIFFERENT COLOUR SCHEMES MONOCHROMATIC COLOUR Monochromatic Colours are all the Colours (tints, tones and shades) of a single hue. Monochromatic colour schemes are derived from a single base
VISUAL ARTS VOCABULARY
 VISUAL ARTS VOCABULARY Abstract Artwork in which the subject matter is stated in a brief, simplified manner; little or no attempt is made to represent images realistically, and objects are often simplified
CS 325 Computer Graphics
 CS 325 Computer Graphics 01 / 25 / 2016 Instructor: Michael Eckmann Today s Topics Review the syllabus Review course policies Color CIE system chromaticity diagram color gamut, complementary colors, dominant
Processing the Image or Can you Believe what you see? Light and Color for Nonscientists PHYS 1230
 Processing the Image or Can you Believe what you see? Light and Color for Nonscientists PHYS 1230 Optical Illusions http://www.michaelbach.de/ot/mot_mib/index.html Vision We construct images unconsciously
Digital Image Basics. Introduction. Pixels and Bitmaps. Written by Jonathan Sachs Copyright 1996-1999 Digital Light & Color
 Written by Jonathan Sachs Copyright 1996-1999 Digital Light & Color Introduction When using digital equipment to capture, store, modify and view photographic images, they must first be converted to a set
H.Calculating Normal Vectors
 Appendix H H.Calculating Normal Vectors This appendix describes how to calculate normal vectors for surfaces. You need to define normals to use the OpenGL lighting facility, which is described in Chapter
Diagrams and Graphs of Statistical Data
 Diagrams and Graphs of Statistical Data One of the most effective and interesting alternative way in which a statistical data may be presented is through diagrams and graphs. There are several ways in
Important Notes Color
 Important Notes Color Introduction A definition for color (MPI Glossary) The selective reflection of light waves in the visible spectrum. Materials that show specific absorption of light will appear the
1. Introduction to image processing
 1 1. Introduction to image processing 1.1 What is an image? An image is an array, or a matrix, of square pixels (picture elements) arranged in columns and rows. Figure 1: An image an array or a matrix
Diverging Color Maps for Scientific Visualization (Expanded)
") Diverging Color Maps for Scientific Visualization (Expanded) Kenneth Moreland Sandia National Laboratories Abstract. One of the most fundamental features of scientific visualization is the process of mapping
Diverging Color Maps for Scientific Visualization (Expanded) Kenneth Moreland Sandia National Laboratories Abstract. One of the most fundamental features of scientific visualization is the process of mapping
PLOTTING DATA AND INTERPRETING GRAPHS
 PLOTTING DATA AND INTERPRETING GRAPHS Fundamentals of Graphing One of the most important sets of skills in science and mathematics is the ability to construct graphs and to interpret the information they
Chapter 3 RANDOM VARIATE GENERATION
 Chapter 3 RANDOM VARIATE GENERATION In order to do a Monte Carlo simulation either by hand or by computer, techniques must be developed for generating values of random variables having known distributions.
At the core of this relationship there are the three primary pigment colours RED, YELLOW and BLUE, which cannot be mixed from other colour elements.
 The Colour Wheel The colour wheel is designed so that virtually any colours you pick from it will look good together. Over the years, many variations of the basic design have been made, but the most common
Prentice Hall Mathematics: Algebra 2 2007 Correlated to: Utah Core Curriculum for Math, Intermediate Algebra (Secondary)
") Core Standards of the Course Standard 1 Students will acquire number sense and perform operations with real and complex numbers. Objective 1.1 Compute fluently and make reasonable estimates. 1. Simplify
Core Standards of the Course Standard 1 Students will acquire number sense and perform operations with real and complex numbers. Objective 1.1 Compute fluently and make reasonable estimates. 1. Simplify
Jitter Measurements in Serial Data Signals
 Jitter Measurements in Serial Data Signals Michael Schnecker, Product Manager LeCroy Corporation Introduction The increasing speed of serial data transmission systems places greater importance on measuring
Advanced Computer Graphics. Rendering Equation. Matthias Teschner. Computer Science Department University of Freiburg
 Advanced Computer Graphics Rendering Equation Matthias Teschner Computer Science Department University of Freiburg Outline rendering equation Monte Carlo integration sampling of random variables University
Phase Portraits for u = A u
 Phase Portraits for u = A u How to Construct a Phase Portrait Badly Threaded Solution Curves Solution Curve Tangent Matching Phase Portrait Illustration Phase plot by computer Revised Computer Phase plot
Exam 1 Sample Question SOLUTIONS. y = 2x
 Exam Sample Question SOLUTIONS. Eliminate the parameter to find a Cartesian equation for the curve: x e t, y e t. SOLUTION: You might look at the coordinates and notice that If you don t see it, we can
. Address the following issues in your solution:
 CM 3110 COMSOL INSTRUCTIONS Faith Morrison and Maria Tafur Department of Chemical Engineering Michigan Technological University, Houghton, MI USA 22 November 2012 Zhichao Wang edits 21 November 2013 revised
HSI BASED COLOUR IMAGE EQUALIZATION USING ITERATIVE n th ROOT AND n th POWER
 HSI BASED COLOUR IMAGE EQUALIZATION USING ITERATIVE n th ROOT AND n th POWER Gholamreza Anbarjafari icv Group, IMS Lab, Institute of Technology, University of Tartu, Tartu 50411, Estonia sjafari@ut.ee
Chapter 5: Working with contours
 Introduction Contoured topographic maps contain a vast amount of information about the three-dimensional geometry of the land surface and the purpose of this chapter is to consider some of the ways in
Current Standard: Mathematical Concepts and Applications Shape, Space, and Measurement- Primary
 Shape, Space, and Measurement- Primary A student shall apply concepts of shape, space, and measurement to solve problems involving two- and three-dimensional shapes by demonstrating an understanding of:
Fixed Point Theorems
 Fixed Point Theorems Definition: Let X be a set and let T : X X be a function that maps X into itself. (Such a function is often called an operator, a transformation, or a transform on X, and the notation
Module1. x 1000. y 800.
 Module1 1 Welcome to the first module of the course. It is indeed an exciting event to share with you the subject that has lot to offer both from theoretical side and practical aspects. To begin with,
Calibration Best Practices
 Calibration Best Practices for Manufacturers SpectraCal, Inc. 17544 Midvale Avenue N., Suite 100 Shoreline, WA 98133 (206) 420-7514 info@spectracal.com http://studio.spectracal.com Calibration Best Practices
Color Balancing Techniques
 Written by Jonathan Sachs Copyright 1996-1999 Digital Light & Color Introduction Color balancing refers to the process of removing an overall color bias from an image. For example, if an image appears
3 hours One paper 70 Marks. Areas of Learning Theory
 GRAPHIC DESIGN CODE NO. 071 Class XII DESIGN OF THE QUESTION PAPER 3 hours One paper 70 Marks Section-wise Weightage of the Theory Areas of Learning Theory Section A (Reader) Section B Application of Design
GRID AND PRISM SPECTROMETERS
 FYSA230/2 GRID AND PRISM SPECTROMETERS 1. Introduction Electromagnetic radiation (e.g. visible light) experiences reflection, refraction, interference and diffraction phenomena when entering and passing
The Information Processing model
 The Information Processing model A model for understanding human cognition. 1 from: Wickens, Lee, Liu, & Becker (2004) An Introduction to Human Factors Engineering. p. 122 Assumptions in the IP model Each
SolidWorks Implementation Guides. Sketching Concepts
 SolidWorks Implementation Guides Sketching Concepts Sketching in SolidWorks is the basis for creating features. Features are the basis for creating parts, which can be put together into assemblies. Sketch
8.2 Cells and Energy. What is photosynthesis? Photosynthesis takes place in the chloroplasts. CHAPTER 8. Solar cells and chloroplasts
 CHAPTER 8 CELL PROCESSES 8.2 Cells and Energy To stay alive, you need a constant supply of energy. You need energy to move, think, grow, and even sleep. Where does that energy come from? It all starts
Grade 6 Mathematics Assessment. Eligible Texas Essential Knowledge and Skills
 Grade 6 Mathematics Assessment Eligible Texas Essential Knowledge and Skills STAAR Grade 6 Mathematics Assessment Mathematical Process Standards These student expectations will not be listed under a separate
DATA LAYOUT AND LEVEL-OF-DETAIL CONTROL FOR FLOOD DATA VISUALIZATION
 DATA LAYOUT AND LEVEL-OF-DETAIL CONTROL FOR FLOOD DATA VISUALIZATION Sayaka Yagi Takayuki Itoh Ochanomizu University Mayumi Kurokawa Yuuichi Izu Takahisa Yoneyama Takashi Kohara Toshiba Corporation ABSTRACT
South Carolina College- and Career-Ready (SCCCR) Pre-Calculus
 Pre-Calculus") South Carolina College- and Career-Ready (SCCCR) Pre-Calculus Key Concepts Arithmetic with Polynomials and Rational Expressions PC.AAPR.2 PC.AAPR.3 PC.AAPR.4 PC.AAPR.5 PC.AAPR.6 PC.AAPR.7 Standards Know
South Carolina College- and Career-Ready (SCCCR) Pre-Calculus Key Concepts Arithmetic with Polynomials and Rational Expressions PC.AAPR.2 PC.AAPR.3 PC.AAPR.4 PC.AAPR.5 PC.AAPR.6 PC.AAPR.7 Standards Know
ANALYTICAL METHODS FOR ENGINEERS
 UNIT 1: Unit code: QCF Level: 4 Credit value: 15 ANALYTICAL METHODS FOR ENGINEERS A/601/1401 OUTCOME - TRIGONOMETRIC METHODS TUTORIAL 1 SINUSOIDAL FUNCTION Be able to analyse and model engineering situations
Improved predictive modeling of white LEDs with accurate luminescence simulation and practical inputs
 Improved predictive modeling of white LEDs with accurate luminescence simulation and practical inputs TracePro Opto-Mechanical Design Software s Fluorescence Property Utility TracePro s Fluorescence Property
Prentice Hall Algebra 2 2011 Correlated to: Colorado P-12 Academic Standards for High School Mathematics, Adopted 12/2009
 Content Area: Mathematics Grade Level Expectations: High School Standard: Number Sense, Properties, and Operations Understand the structure and properties of our number system. At their most basic level
Section 1.1. Introduction to R n
 The Calculus of Functions of Several Variables Section. Introduction to R n Calculus is the study of functional relationships and how related quantities change with each other. In your first exposure to
Blender 3D Animation
 Bachelor Maths/Physics/Computer Science University Paris-Sud Digital Imaging Course Blender 3D Animation Christian Jacquemin Introduction to Computer Animation Animation Basics animation consists in changing
The Contribution of Street Lighting to Light Pollution
 The Contribution of Street Lighting to Light Pollution Peter D Hiscocks, Royal Astronomical Society, Toronto Centre, Canada Sverrir Guðmundsson, Amateur Astronomical Society of Seltjarnarnes, Iceland April
A Strategy for Teaching Finite Element Analysis to Undergraduate Students
 A Strategy for Teaching Finite Element Analysis to Undergraduate Students Gordon Smyrell, School of Computing and Mathematics, University of Teesside The analytical power and design flexibility offered
1 if 1 x 0 1 if 0 x 1
 Chapter 3 Continuity In this chapter we begin by defining the fundamental notion of continuity for real valued functions of a single real variable. When trying to decide whether a given function is or
2008 AP Calculus AB Multiple Choice Exam
 008 AP Multiple Choice Eam Name 008 AP Calculus AB Multiple Choice Eam Section No Calculator Active AP Calculus 008 Multiple Choice 008 AP Calculus AB Multiple Choice Eam Section Calculator Active AP Calculus
Using Image J to Measure the Brightness of Stars (Written by Do H. Kim)
") Using Image J to Measure the Brightness of Stars (Written by Do H. Kim) What is Image J? Image J is Java-based image processing program developed at the National Institutes of Health. Image J runs on everywhere,
Using Image J to Measure the Brightness of Stars (Written by Do H. Kim) What is Image J? Image J is Java-based image processing program developed at the National Institutes of Health. Image J runs on everywhere,
Birmingham City Schools
 Activity 1 Classroom Rules & Regulations Policies & Procedures Course Curriculum / Syllabus LTF Activity: Interval Notation (Precal) 2 Pre-Assessment 3 & 4 1.2 Functions and Their Properties 5 LTF Activity:
Understanding Poles and Zeros
 MASSACHUSETTS INSTITUTE OF TECHNOLOGY DEPARTMENT OF MECHANICAL ENGINEERING 2.14 Analysis and Design of Feedback Control Systems Understanding Poles and Zeros 1 System Poles and Zeros The transfer function
In mathematics, there are four attainment targets: using and applying mathematics; number and algebra; shape, space and measures, and handling data.
 MATHEMATICS: THE LEVEL DESCRIPTIONS In mathematics, there are four attainment targets: using and applying mathematics; number and algebra; shape, space and measures, and handling data. Attainment target
REAL TIME TRAFFIC LIGHT CONTROL USING IMAGE PROCESSING
 REAL TIME TRAFFIC LIGHT CONTROL USING IMAGE PROCESSING Ms.PALLAVI CHOUDEKAR Ajay Kumar Garg Engineering College, Department of electrical and electronics Ms.SAYANTI BANERJEE Ajay Kumar Garg Engineering
MATH 132: CALCULUS II SYLLABUS
 MATH 32: CALCULUS II SYLLABUS Prerequisites: Successful completion of Math 3 (or its equivalent elsewhere). Math 27 is normally not a sufficient prerequisite for Math 32. Required Text: Calculus: Early
LAYOUT OF THE KEYBOARD
 Dr. Charles Hofmann, LaSalle hofmann@lasalle.edu Dr. Roseanne Hofmann, MCCC rhofman@mc3.edu ------------------------------------------------------------------------------------------------- DISPLAY CONTRAST
NEW YORK STATE TEACHER CERTIFICATION EXAMINATIONS
 NEW YORK STATE TEACHER CERTIFICATION EXAMINATIONS TEST DESIGN AND FRAMEWORK September 2014 Authorized for Distribution by the New York State Education Department This test design and framework document
CS 4620 Practicum Programming Assignment 6 Animation
 CS 4620 Practicum Programming Assignment 6 Animation out: Friday 14th November 2014 due: : Monday 24th November 2014 1 Introduction In this assignment, we will explore a common topic in animation: key
A Proposal for OpenEXR Color Management
 A Proposal for OpenEXR Color Management Florian Kainz, Industrial Light & Magic Revision 5, 08/05/2004 Abstract We propose a practical color management scheme for the OpenEXR image file format as used
Arrangements And Duality
 Arrangements And Duality 3.1 Introduction 3 Point configurations are tbe most basic structure we study in computational geometry. But what about configurations of more complicated shapes? For example,
TOPIC 4: DERIVATIVES
 TOPIC 4: DERIVATIVES 1. The derivative of a function. Differentiation rules 1.1. The slope of a curve. The slope of a curve at a point P is a measure of the steepness of the curve. If Q is a point on the
GeoGebra. 10 lessons. Gerrit Stols
 GeoGebra in 10 lessons Gerrit Stols Acknowledgements GeoGebra is dynamic mathematics open source (free) software for learning and teaching mathematics in schools. It was developed by Markus Hohenwarter
COOL ART WITH MATH & SCIENCE OPTICAL ILLUSIONS CREATIVE ACTIVITIES THAT MAKE MATH & SCIENCE FUN FOR KIDS! A NDERS HANSON AND ELISSA MANN
 CHECKERBOARD HOW-TO LIBRARY COOL ART WITH MATH & SCIENCE OPTICAL ILLUSIONS CREATIVE ACTIVITIES THAT MAKE MATH & SCIENCE FUN FOR KIDS! A NDERS HANSON AND ELISSA MANN C O O L A R T W I T H M A T H & S C
Multivariate data visualization using shadow
 Proceedings of the IIEEJ Ima and Visual Computing Wor Kuching, Malaysia, Novembe Multivariate data visualization using shadow Zhongxiang ZHENG Suguru SAITO Tokyo Institute of Technology ABSTRACT When visualizing
The Effects of Start Prices on the Performance of the Certainty Equivalent Pricing Policy
 BMI Paper The Effects of Start Prices on the Performance of the Certainty Equivalent Pricing Policy Faculty of Sciences VU University Amsterdam De Boelelaan 1081 1081 HV Amsterdam Netherlands Author: R.D.R.
Solutions for Review Problems
 olutions for Review Problems 1. Let be the triangle with vertices A (,, ), B (4,, 1) and C (,, 1). (a) Find the cosine of the angle BAC at vertex A. (b) Find the area of the triangle ABC. (c) Find a vector
Dear Accelerated Pre-Calculus Student:
 Dear Accelerated Pre-Calculus Student: I am very excited that you have decided to take this course in the upcoming school year! This is a fastpaced, college-preparatory mathematics course that will also
ELEMENTS OF ART & PRINCIPLES OF DESIGN
 ELEMENTS OF ART & PRINCIPLES OF DESIGN Elements of Art: 1. COLOR Color (hue) is one of the elements of art. Artists use color in many different ways. The colors we see are light waves absorbed or reflected
Visualizing of Berkeley Earth, NASA GISS, and Hadley CRU averaging techniques
 Visualizing of Berkeley Earth, NASA GISS, and Hadley CRU averaging techniques Robert Rohde Lead Scientist, Berkeley Earth Surface Temperature 1/15/2013 Abstract This document will provide a simple illustration
Derive 5: The Easiest... Just Got Better!
 Liverpool John Moores University, 1-15 July 000 Derive 5: The Easiest... Just Got Better! Michel Beaudin École de Technologie Supérieure, Canada Email; mbeaudin@seg.etsmtl.ca 1. Introduction Engineering
Visualizing Multidimensional Data Through Time Stephen Few July 2005
 Visualizing Multidimensional Data Through Time Stephen Few July 2005 This is the first of three columns that will feature the winners of DM Review's 2005 data visualization competition. I want to extend
Vector Spaces; the Space R n
 Vector Spaces; the Space R n Vector Spaces A vector space (over the real numbers) is a set V of mathematical entities, called vectors, U, V, W, etc, in which an addition operation + is defined and in which
A QUICK GUIDE TO THE FORMULAS OF MULTIVARIABLE CALCULUS
 A QUIK GUIDE TO THE FOMULAS OF MULTIVAIABLE ALULUS ontents 1. Analytic Geometry 2 1.1. Definition of a Vector 2 1.2. Scalar Product 2 1.3. Properties of the Scalar Product 2 1.4. Length and Unit Vectors
Logo Symmetry Learning Task. Unit 5
 Logo Symmetry Learning Task Unit 5 Course Mathematics I: Algebra, Geometry, Statistics Overview The Logo Symmetry Learning Task explores graph symmetry and odd and even functions. Students are asked to
Estimated Pre Calculus Pacing Timeline
 Estimated Pre Calculus Pacing Timeline 2010-2011 School Year The timeframes listed on this calendar are estimates based on a fifty-minute class period. You may need to adjust some of them from time to
Computer Graphics. Geometric Modeling. Page 1. Copyright Gotsman, Elber, Barequet, Karni, Sheffer Computer Science - Technion. An Example.
 An Example 2 3 4 Outline Objective: Develop methods and algorithms to mathematically model shape of real world objects Categories: Wire-Frame Representation Object is represented as as a set of points
Electrical Resonance
 Electrical Resonance (R-L-C series circuit) APPARATUS 1. R-L-C Circuit board 2. Signal generator 3. Oscilloscope Tektronix TDS1002 with two sets of leads (see Introduction to the Oscilloscope ) INTRODUCTION
Visualization of 2D Domains
 Visualization of 2D Domains This part of the visualization package is intended to supply a simple graphical interface for 2- dimensional finite element data structures. Furthermore, it is used as the low
Harmonic oscillations of spiral springs Springs linked in parallel and in series
 .3.26 Related topics Spring constant, Hooke s Law, oscillations, limit of elasticity, parallel springs, serial springs, use of an interface. Principle and task The spring constant D is determined for different
Lecture 2. Marginal Functions, Average Functions, Elasticity, the Marginal Principle, and Constrained Optimization
 Lecture 2. Marginal Functions, Average Functions, Elasticity, the Marginal Principle, and Constrained Optimization 2.1. Introduction Suppose that an economic relationship can be described by a real-valued
Color Theory for Floral Design
 Color Theory for Floral Design Essential Questions: Why would a floral designer need to have an understanding of color theory? How is color used to create floral designs? How can color be used for store
THE NATURE OF LIGHT AND COLOR
 THE NATURE OF LIGHT AND COLOR THE PHYSICS OF LIGHT Electromagnetic radiation travels through space as electric energy and magnetic energy. At times the energy acts like a wave and at other times it acts
Worksheet 1. What You Need to Know About Motion Along the x-axis (Part 1)
") Worksheet 1. What You Need to Know About Motion Along the x-axis (Part 1) In discussing motion, there are three closely related concepts that you need to keep straight. These are: If x(t) represents the
Worksheet 1. What You Need to Know About Motion Along the x-axis (Part 1) In discussing motion, there are three closely related concepts that you need to keep straight. These are: If x(t) represents the