Image enhancement and sharpening. Lecture 6-7 February 19-26, 2008
|
|
|
- Dylan Briggs
- 7 years ago
- Views:
Transcription
1 Image enhancement and sharpening Lecture 6-7 February 19-26, 2008
2 Procedures of image processing Preprocessing Radiometric correction is concerned with improving the accuracy of surface spectral reflectance, emittance, or back-scattered measurements obtained using a remote sensing system. Detector error correction, Atmospheric and topographic corrections Geometric correction is concerned with placing the above measurements or derivativeproducts in their proper locations. Information enhancement Point operations change the value of each individual pixel independent of all other pixels Local operations change the value of individual pixels in the context of the values of neighboring pixels. Information enhancement includes image reduction, image magnification, transect extraction, contrast adjustments (linear and non-linear), band ratioing, spatial filtering, fourier transformations, principle components analysis, image sharpening, and texture transformations Information extraction Post-classification Information output Image or enhanced image itself, thematic map, vector map, spatail database, summary statistics and graphs


3 1. Image reduction 2x reduction 1. Sampling every other row or column or Nearest Neighbor in ENVI 2. Pixel aggregate (average of 4 pixels)


4 2. Image magnification 2x magnification 1. Duplicate every row and colume or Nearest Neighbor in ENVI 2. Bilinear resampling 3. Cubic resampling

5 A common interface in ENVI For Spatial Subsetting Reduction Magnification

")


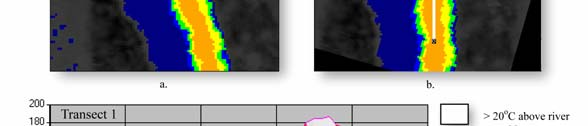


6 3. Transects (spatial profiles)

7 4. Spectral profiles
8 5. Contrast Enhancement (stretch) Materials or objects reflect or emit similar amounts of radiant flux (so similar pixel value) Low-contrast imagery with pixel range less than the designed radiometric range for TM less than the designed To improve the contrast: Linear technique Minimum-maximum contrast stretch Percentage linear contrast stretch Standard deviation contrast stretch Piecewise linear contrast stretch Non-linear technique Histogram equalization Contrast enhancement is only intended to improve the visual quality of a displayed image by increasing the range (spreading or stretching) of data values to occupy the available image display range (usually 0-255). It does not change the pixel values, unless save it as a new image. It is not good practice to use saved image for classification and change detection.
9 Minimum-maximum contrast stretch BV out = BV max in k min min k k quant k where: -BV in in is is the the original input brightness value --quant kk is is the the range of of the the brightness values that can be be displayed on on the the CRT (e.g., 255), --min kk is is the the minimum value in in the the image, --max kk is is the the maximum value in in the the image, and --BV BV out out is is the the output brightness value
10 Percentage linear and standard deviation contrast stretch X percentage (say 5%) top or low values of the image will be set to 0 or 255, rest of values will be linearly stretched to 0 to 255 ENVI has a default of a 2% linear stretch applied to each image band, meaning the bottom and top 2% of image values are excluded by positioning the range bars at the appropriate points. Low 2% and top 2% will be saturated to 0 and 255, respectively. The values between the range bars are then stretched linearly between 0 and 255 resulting in a new image. If the percentage coincides with a standard deviation percentage, then it is called a standard deviation contrast stretch. For a normal distribution, 68%, 95.4%, 99.73% values lie in ±1σ, ±2 σ, ±3 σ. So 16% linear contrast stretch is the ±1σ contrast stretch.
11


12 original Saturating the water Stretching the land Saturating the land Stretching the water Special linear contrast stretch Or Stretch on demand
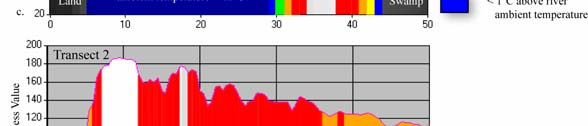
13 Piecewise linear contrast stretch When the histogram of an image is not Gaussian (bimodal, trimodal, ), it is possible to apply a piecewise linear contrast stretch. But you better to know what each mode in the histogram represents in the real world.

14 Stretch both land and water
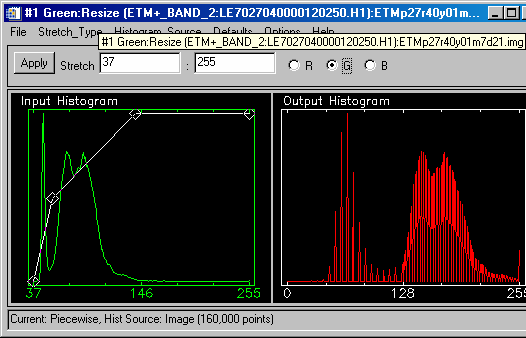
15 Nonlinear contrast stretch: histogram equalization It automatically reduces the contrast in the very light or dark parts of the image associated with the tails of a normally distributed histogram. Some pixels that originally have different values are now assigned the same value (perhaps loss information), while other value that were once very close together are now spread out, increasing the contrast between them

16 Scan the p272 and 274 L i
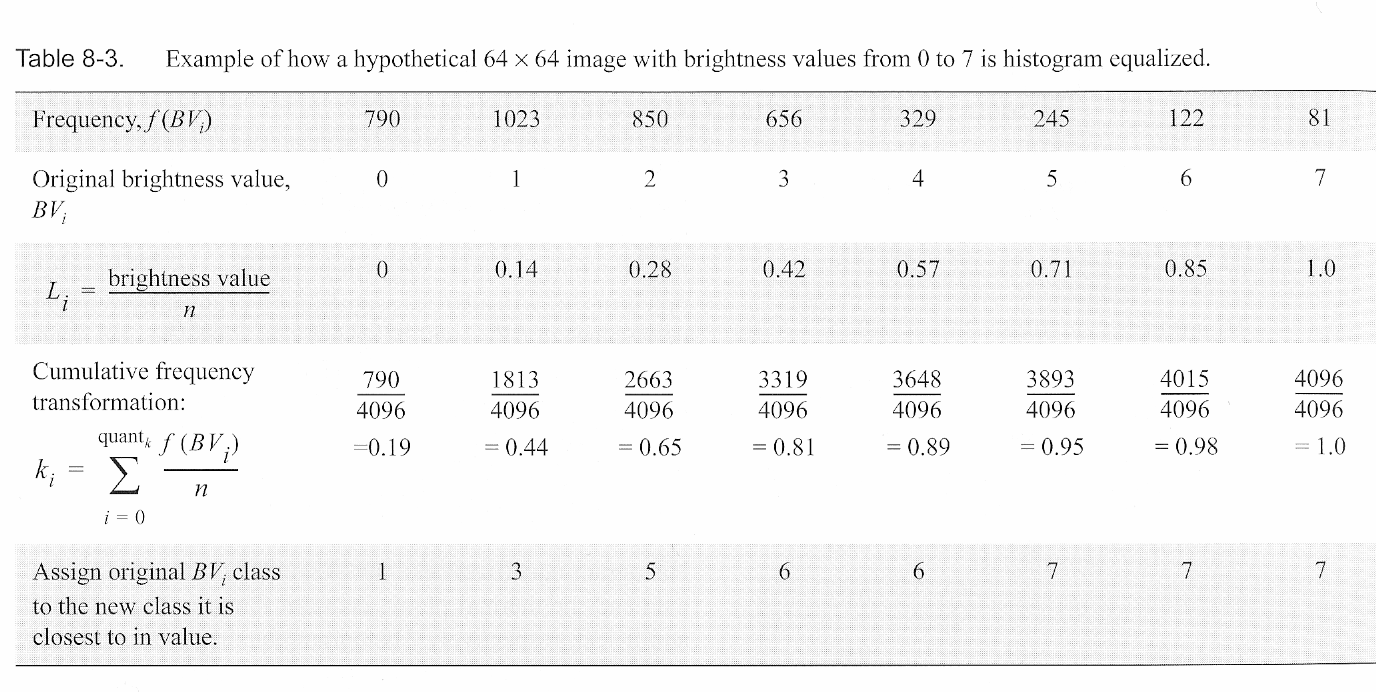
17 (n=7)

18 Original Histogram equalized
19 6. Band Ratioing Sometimes differences in brightness values from identical surface materials are caused by topographic slope and aspect, shadows, atmospheric constitutional change, or seasons changes in sun angle and intensity. Band ratio can be applied to reduce the effects of such environmental conditions. In addition, band ratio also help to discriminate between soils and vegetation BV i, j, ratio = BV BV i, j, k i, j, l where: -BV i,j,k i,j,k is is the the original input brightness value in in band k -BV i,j,l i,j,l is is the the original input brightness value in in band ll --BV BV i,j,ratio is is the the ratio output brightness value
 None of the single band")
20 Source: Vincent et al., 2004 relative phycocyanin content (PC) None of the single band relation passed the Durbin-Watson statistical test.
21 Based on Equation 4 Based on Equation 5 Applying best equations derived from Landsat 7 to Landsat 5: Indicating the best spectral ratio model is more robust than the best model derived from single Bands, with regard to changes in sun angle (season), atmospheric transmission, and instrument Settings between Landsat 5 and 7


22 Applied to July 1, 2000 Applied to Sep 27, 2000
23 7. Spatial filtering to enhance low, high frequency detail, and edges Spatial frequency is the number of changes in brightness value per unit distance for any particular part of an image. If there are very few changes in brightness value over a given area in an image, this is referred to as a low-frequency area. Conversely, if the brightness values change dramatically over short distances, this is an area of high-frequency detail. To see the spatial frequency, we look at the local (neighboring) pixel value changes. The spatial frequency may be enhanced or subdued using: Spatial convolution filtering: based primarily on the use of convolution masks Fourier analysis: mathematically separates an image into its spatial frequency components
24 7.1 Spatial convolution filtering A linear spatial filter is is a filter for which the brightness value (BV i,j i,j,out) at at location i,j i,jin in the output image is is a function of of some weighted average (linear combination) of of brightness values located in in a particular spatial pattern around the i,j i,jlocation in in the input image. The process of of evaluating the weighted neighboring pixel values is is called two-dimensional convolution filtering.
25 The size of of the the neighborhood convolution mask or or kernel (n) ) is is usually 3 x 3, 3, 5 x 5, 5, 7 x 7, 7, or or 9 x We will constrain our discussion to to 3 x 3 convolution masks with nine coefficients, c i, i, defined at at the the following locations: c 1 1 c 2 c Mask template = c 4 4 c 5 c c 7 7 c 8 c The The coefficients, c 1, 1, in in the the mask are are multiplied by by the the following individual brightness values (BV (BV i ) i ) in in the the input input image: c 1 x 1 BV BV 1 c 1 2 x 2 BV BV 2 c 2 3 x 3 BV BV 3 3 Mask template = c 4 x 4 BV BV 4 c 4 5 x 5 BV BV 5 c 5 6 x 6 BV BV 6 6 c 7 x 7 BV BV 7 c 7 8 x 8 BV BV 8 c 8 9 x 9 BV BV 9 9 The The primary input input pixel pixel under investigation at at any any one one time time is is BV BV 5 = 5 BV BV i,j i,j
26 7.1.1 Low frequency (pass) filter: block the high spatial frequency detail, left the low-frequency A kernel with small positive values with the same or a little large central value High frequency (pass) filter: remove the slowly varying components and enhance the highfrequency local variations. a kernel with a high central value, typically surrounded by negative weights a b c d e
27 This will result in 2 lines and 2 columns smaller than the original image. Software can deal with this problem in different ways (refer to book p277) FF 5, out = int 9 i= 1 c i x BV n i a d b e
28 7.1.3 Linear edge enhancement Directional Laplacian Highlight points, lines, edges, suppress uniform and smooth regions Vertical edges Horizontal edge NW-SE NE-SW directional Laplacian

29 7.1.4 Nonlinear edge enhancement Sobel Sobel out X Y 5, where = = ( BV3 + 2BV6 + BV9 ) ( BV1 + 2BV4 + BV7 ) ( BV + 2BV + BV ) ( BV + 2BV + BV ) X = 1 = X Y Y = order Robert Roberts out where X = BV Y = BV 6 5, 5 = X BV BV Y X = Y =
30 7.2 Fourier transform Spatial domain to frequency domain Frequency image contains all information found in the original image Frequency image is useful for image restoration (noise remove), filtering (low, high frequency, and edge detection), radiometric correction, image to image registration For noise removed in frequency domain, it is much easier to identify and remove than in spatial domain.

31 When stationary periodic noise is a singlefrequency sinusoidal function in the spatial domain, its Fourier transform is bright points. A line connecting the points is always perpendicular to the orientation of the noise lines in the original image

32 Spatial domain to frequency domain Frequency domain back to spatial domain after removed the noises

33 After user-defined cut filter, transform back to spatial domain.

34 A solution to get G is to put the convolution mask at the center of a zero-value image that has the same size of F. Low-pass filter block high frequency High-pass filter block low frequency
35 8. Principle Components Analysis (PCA) There are large correlations among remote sensing bands. PCA will result in another uncorrelated datasets: principal component images (PCs). PC1 contains the largest variation, PC2 contains the second largest variation, The first two or three components (PCs) contain over 90% of information from the original many bands. The rest of bands contains the noises. It is a great compress operation, and reducing the dimensionality of the original data The new principal component images that may be more interpretable than the original data.
36 Using Covariance matrix Is unstandardized PCA Using correlation matrix Is standardized PCA
37 E Or using the Correlation matrix replace the Cov (covariance matrix) where EV EV T is is the the transpose of of the the eigenvector matrix, EV, and E is is a diagonal covariance matrix whose elements, λ i,i i,i,, called eigenvalues, are are the thevariances of of the the pth principal components, where p = 1 to to n components. The largest λ i,j will i,j will relate relate to to the the PC1, PC1, then then
38 Get the Eigenvalues Get the Eigenvectors
39 Correlation, R k,p k,p,, Between Band k and Each Principal Component p where: where: a k,p = k,p eigenvector for for band band kkand and component p λ p p = pth ptheigenvalue Var Var k k = variance of of band band kkin in the the covariance matrix matrix
40 Computer pixel values for the new PCs newbv i, j, p = n k = 1 a kp BV i, j, k New pixel value for new PCs See an example in the book p where α kp kp = eigenvectors, BV BV i,j,k i,j,k = brightness value in in band k for for the the pixel at at row i, i, column j, j, and n = number of of bands.
41 Inverse PC rotation Similar as the inverse FFT, to transfer from frequency domain back to the spatial domain, the inverse PC rotation is to transfer the PC images back into their original data space, without including the noise bands, using the same statistics files saved from the forward PC rotation. Be sure to use the same covariance matrix or correlation matrix you used for forward PC rotation.
42 9. Minimum Noise Fraction Transform (MNF) It is determine the inherent dimensionality of image data, to segregate noise in the data, and to reduce the computational requirements for subsequent processing The first rotation uses the principal components of the noise covariance matrix to decorrelate and rescale the noise in the data (noise whitening), resulting in transformed data in which the noise has unit variance and no band-to-band correlations The second rotation uses the PCs derived from the original image data after they have been noise-whitened by the first rotation and rescaled by the noise standard deviation. You can divide the images into two parts: large eigenvalues and coherent eigenimages and near-unity eigenvalues and noisedominated images. Only use the first part for furthering processing. Use estimate noise statistics from data Shift diff subset (optional), selecting a subset that is spectrally uniform, less variation Bands with larger eigenvalues (>1) contain data, others contain noises. Visually examine the bands along with their eigenvalues and find those bands with noises Inverse MNF use only the first part of the MNF bands to remove the noise from the images.

43
44 10. Image sharpening or data fusion Image sharpening: automatically merge a low-resolution color image with a highresolution grayscale image Data fusion: quantitatively combining or merging data from multiple sources to maximize the extractible information from the data. It is used to merge remote sensing data of different spatial and/or spectral resolutions to create a higher spatial and/or spectral resolution image(s). HSV (hue-saturation-value), IHS (intensity-hue-saturation), HLS (hue-lightnesssaturation) color transforms Brovey transform Gram-Schmidt spectral sharpening PC spectral sharpening CN spectral sharpening Data fusion can be used to Low spatial resolution with high spatial resolution image to increase spatial resolution Low spatial and high spectral with high spatial and high spectral to increase both spatial and spectral resolution Two complementary but completely different types of remote sensing data (e..g. radar and optical)
45 HSV Transform an RGB image to HSV (hue, saturation, value) color space. Replace the value band with the high-resolution image, automatically resample the hue and saturation bands to the high resolution pixel size using a nearest neighbor, bilinear, or cubic convolution tech, and finally transform the image back to RGB color space.

46 Xie and Keller, 2006
47 Color normalization (brovey) Using a mathematical combination of the color image and high resolution data. Each band in the color image is multiplied by a ratio of the high resolution data divided by the sum of the color bands. The function automatically resamples the three color bands to the high resolution pixel size using a nearest neighbor, bilinear, or cubic convolution tech, and finally transform the image back to RGB color space.
48 Gram-Schmidt spectral sharpening First, a panchromatic band is simulated from the lower spatial resolution spectral bands. Second, a Gram-Schmidt transformation is performed on the simulated panchromatic band and the spectral bands, where the simulated panchromatic band is employed as the first band. Third, the high spatial resolution panchromatic band is swapped with the first Gram- Schmidt band. Finally, the inverse Gram-Schmidt transform is then applied to form the pan-sharpened spectral bands.
49 PC spectral sharpening A principal components transformation is performed on the multispectral data. The PC band 1 is replaced with the high resolution band, which is scaled to match the PC band 1 so no distortion of the spectral information occurs. Then, an inverse transform is performed. The multispectral data is automatically resampled to the high resolution pixel size using a nearest neighbor, bilinear, or cubic convolution technique. The assumption behind this is that the first PC carries the information common to all bands and is approximately equal to the high space resolution image.
Digital image processing
 746A27 Remote Sensing and GIS Lecture 4 Digital image processing Chandan Roy Guest Lecturer Department of Computer and Information Science Linköping University Digital Image Processing Most of the common
Bildverarbeitung und Mustererkennung Image Processing and Pattern Recognition
 Bildverarbeitung und Mustererkennung Image Processing and Pattern Recognition 1. Image Pre-Processing - Pixel Brightness Transformation - Geometric Transformation - Image Denoising 1 1. Image Pre-Processing
SAMPLE MIDTERM QUESTIONS
 Geography 309 Sample MidTerm Questions Page 1 SAMPLE MIDTERM QUESTIONS Textbook Questions Chapter 1 Questions 4, 5, 6, Chapter 2 Questions 4, 7, 10 Chapter 4 Questions 8, 9 Chapter 10 Questions 1, 4, 7
RESOLUTION MERGE OF 1:35.000 SCALE AERIAL PHOTOGRAPHS WITH LANDSAT 7 ETM IMAGERY
 RESOLUTION MERGE OF 1:35.000 SCALE AERIAL PHOTOGRAPHS WITH LANDSAT 7 ETM IMAGERY M. Erdogan, H.H. Maras, A. Yilmaz, Ö.T. Özerbil General Command of Mapping 06100 Dikimevi, Ankara, TURKEY - (mustafa.erdogan;
Adaptive HSI Data Processing for Near-Real-time Analysis and Spectral Recovery *
 Adaptive HSI Data Processing for Near-Real-time Analysis and Spectral Recovery * Su May Hsu, 1 Hsiao-hua Burke and Michael Griffin MIT Lincoln Laboratory, Lexington, Massachusetts 1. INTRODUCTION Hyperspectral
Some elements of photo. interpretation
 Some elements of photo Shape Size Pattern Color (tone, hue) Texture Shadows Site Association interpretation Olson, C. E., Jr. 1960. Elements of photographic interpretation common to several sensors. Photogrammetric
Environmental Remote Sensing GEOG 2021
 Environmental Remote Sensing GEOG 2021 Lecture 4 Image classification 2 Purpose categorising data data abstraction / simplification data interpretation mapping for land cover mapping use land cover class
Dimensionality Reduction: Principal Components Analysis
 Dimensionality Reduction: Principal Components Analysis In data mining one often encounters situations where there are a large number of variables in the database. In such situations it is very likely
Introduction to Imagery and Raster Data in ArcGIS
 Esri International User Conference San Diego, California Technical Workshops July 25, 2012 Introduction to Imagery and Raster Data in ArcGIS Simon Woo slides Cody Benkelman - demos Overview of Presentation
Assessment. Presenter: Yupu Zhang, Guoliang Jin, Tuo Wang Computer Vision 2008 Fall
 Automatic Photo Quality Assessment Presenter: Yupu Zhang, Guoliang Jin, Tuo Wang Computer Vision 2008 Fall Estimating i the photorealism of images: Distinguishing i i paintings from photographs h Florin
Supervised Classification workflow in ENVI 4.8 using WorldView-2 imagery
 Supervised Classification workflow in ENVI 4.8 using WorldView-2 imagery WorldView-2 is the first commercial high-resolution satellite to provide eight spectral sensors in the visible to near-infrared
Review Jeopardy. Blue vs. Orange. Review Jeopardy
 Review Jeopardy Blue vs. Orange Review Jeopardy Jeopardy Round Lectures 0-3 Jeopardy Round $200 How could I measure how far apart (i.e. how different) two observations, y 1 and y 2, are from each other?
PIXEL-LEVEL IMAGE FUSION USING BROVEY TRANSFORME AND WAVELET TRANSFORM
 PIXEL-LEVEL IMAGE FUSION USING BROVEY TRANSFORME AND WAVELET TRANSFORM Rohan Ashok Mandhare 1, Pragati Upadhyay 2,Sudha Gupta 3 ME Student, K.J.SOMIYA College of Engineering, Vidyavihar, Mumbai, Maharashtra,
The Role of SPOT Satellite Images in Mapping Air Pollution Caused by Cement Factories
 The Role of SPOT Satellite Images in Mapping Air Pollution Caused by Cement Factories Dr. Farrag Ali FARRAG Assistant Prof. at Civil Engineering Dept. Faculty of Engineering Assiut University Assiut, Egypt.
Personal Identity Verification (PIV) IMAGE QUALITY SPECIFICATIONS FOR SINGLE FINGER CAPTURE DEVICES
 IMAGE QUALITY SPECIFICATIONS FOR SINGLE FINGER CAPTURE DEVICES") Personal Identity Verification (PIV) IMAGE QUALITY SPECIFICATIONS FOR SINGLE FINGER CAPTURE DEVICES 1.0 SCOPE AND PURPOSE These specifications apply to fingerprint capture devices which scan and capture
Personal Identity Verification (PIV) IMAGE QUALITY SPECIFICATIONS FOR SINGLE FINGER CAPTURE DEVICES 1.0 SCOPE AND PURPOSE These specifications apply to fingerprint capture devices which scan and capture
COMPARISON OF OBJECT BASED AND PIXEL BASED CLASSIFICATION OF HIGH RESOLUTION SATELLITE IMAGES USING ARTIFICIAL NEURAL NETWORKS
 COMPARISON OF OBJECT BASED AND PIXEL BASED CLASSIFICATION OF HIGH RESOLUTION SATELLITE IMAGES USING ARTIFICIAL NEURAL NETWORKS B.K. Mohan and S. N. Ladha Centre for Studies in Resources Engineering IIT
Calculation of Minimum Distances. Minimum Distance to Means. Σi i = 1
 Minimum Distance to Means Similar to Parallelepiped classifier, but instead of bounding areas, the user supplies spectral class means in n-dimensional space and the algorithm calculates the distance between
Analysis of Landsat ETM+ Image Enhancement for Lithological Classification Improvement in Eagle Plain Area, Northern Yukon
 Analysis of Landsat ETM+ Image Enhancement for Lithological Classification Improvement in Eagle Plain Area, Northern Yukon Shihua Zhao, Department of Geology, University of Calgary, zhaosh@ucalgary.ca,
Component Ordering in Independent Component Analysis Based on Data Power
 Component Ordering in Independent Component Analysis Based on Data Power Anne Hendrikse Raymond Veldhuis University of Twente University of Twente Fac. EEMCS, Signals and Systems Group Fac. EEMCS, Signals
Sharpening through spatial filtering
 Sharpening through spatial filtering Stefano Ferrari Università degli Studi di Milano stefano.ferrari@unimi.it Elaborazione delle immagini (Image processing I) academic year 2011 2012 Sharpening The term
Multiscale Object-Based Classification of Satellite Images Merging Multispectral Information with Panchromatic Textural Features
 Remote Sensing and Geoinformation Lena Halounová, Editor not only for Scientific Cooperation EARSeL, 2011 Multiscale Object-Based Classification of Satellite Images Merging Multispectral Information with
PROBLEMS IN THE FUSION OF COMMERCIAL HIGH-RESOLUTION SATELLITE AS WELL AS LANDSAT 7 IMAGES AND INITIAL SOLUTIONS
 ISPRS SIPT IGU UCI CIG ACSG Table of contents Table des matières Authors index Index des auteurs Search Recherches Exit Sortir PROBLEMS IN THE FUSION OF COMMERCIAL HIGH-RESOLUTION SATELLITE AS WELL AS
CROP CLASSIFICATION WITH HYPERSPECTRAL DATA OF THE HYMAP SENSOR USING DIFFERENT FEATURE EXTRACTION TECHNIQUES
 Proceedings of the 2 nd Workshop of the EARSeL SIG on Land Use and Land Cover CROP CLASSIFICATION WITH HYPERSPECTRAL DATA OF THE HYMAP SENSOR USING DIFFERENT FEATURE EXTRACTION TECHNIQUES Sebastian Mader
Convolution. 1D Formula: 2D Formula: Example on the web: http://www.jhu.edu/~signals/convolve/
 Basic Filters (7) Convolution/correlation/Linear filtering Gaussian filters Smoothing and noise reduction First derivatives of Gaussian Second derivative of Gaussian: Laplacian Oriented Gaussian filters
Introduction to Principal Components and FactorAnalysis
 Introduction to Principal Components and FactorAnalysis Multivariate Analysis often starts out with data involving a substantial number of correlated variables. Principal Component Analysis (PCA) is a
Probability and Random Variables. Generation of random variables (r.v.)
") Probability and Random Variables Method for generating random variables with a specified probability distribution function. Gaussian And Markov Processes Characterization of Stationary Random Process Linearly
Probability and Random Variables Method for generating random variables with a specified probability distribution function. Gaussian And Markov Processes Characterization of Stationary Random Process Linearly
MODULATION TRANSFER FUNCTION MEASUREMENT METHOD AND RESULTS FOR THE ORBVIEW-3 HIGH RESOLUTION IMAGING SATELLITE
 MODULATION TRANSFER FUNCTION MEASUREMENT METHOD AND RESULTS FOR THE ORBVIEW-3 HIGH RESOLUTION IMAGING SATELLITE K. Kohm ORBIMAGE, 1835 Lackland Hill Parkway, St. Louis, MO 63146, USA kohm.kevin@orbimage.com
Computational Foundations of Cognitive Science
 Computational Foundations of Cognitive Science Lecture 15: Convolutions and Kernels Frank Keller School of Informatics University of Edinburgh keller@inf.ed.ac.uk February 23, 2010 Frank Keller Computational
IMAGE RECOGNITION FOR CATS AND DOGS
 IMAGE RECOGNITION FOR CATS AND DOGS HYO JIN CHUNG AND MINH N. TRAN Abstract. In this project, we are given a training set of 8 images of cats and 8 images of dogs to classify a testing set of 38 images
Resolution Enhancement of Photogrammetric Digital Images
 DICTA2002: Digital Image Computing Techniques and Applications, 21--22 January 2002, Melbourne, Australia 1 Resolution Enhancement of Photogrammetric Digital Images John G. FRYER and Gabriele SCARMANA
The Scientific Data Mining Process
 Chapter 4 The Scientific Data Mining Process When I use a word, Humpty Dumpty said, in rather a scornful tone, it means just what I choose it to mean neither more nor less. Lewis Carroll [87, p. 214] In
Lectures 6&7: Image Enhancement
 Lectures 6&7: Image Enhancement Leena Ikonen Pattern Recognition (MVPR) Lappeenranta University of Technology (LUT) leena.ikonen@lut.fi http://www.it.lut.fi/ip/research/mvpr/ 1 Content Background Spatial
Information Contents of High Resolution Satellite Images
 Information Contents of High Resolution Satellite Images H. Topan, G. Büyüksalih Zonguldak Karelmas University K. Jacobsen University of Hannover, Germany Keywords: satellite images, mapping, resolution,
Object Recognition and Template Matching
 Object Recognition and Template Matching Template Matching A template is a small image (sub-image) The goal is to find occurrences of this template in a larger image That is, you want to find matches of
Factor Analysis. Chapter 420. Introduction
 Chapter 420 Introduction (FA) is an exploratory technique applied to a set of observed variables that seeks to find underlying factors (subsets of variables) from which the observed variables were generated.
NCSS Statistical Software Principal Components Regression. In ordinary least squares, the regression coefficients are estimated using the formula ( )
") Chapter 340 Principal Components Regression Introduction is a technique for analyzing multiple regression data that suffer from multicollinearity. When multicollinearity occurs, least squares estimates
Chapter 340 Principal Components Regression Introduction is a technique for analyzing multiple regression data that suffer from multicollinearity. When multicollinearity occurs, least squares estimates
Shear :: Blocks (Video and Image Processing Blockset )
") 1 of 6 15/12/2009 11:15 Shear Shift rows or columns of image by linearly varying offset Library Geometric Transformations Description The Shear block shifts the rows or columns of an image by a gradually
1 of 6 15/12/2009 11:15 Shear Shift rows or columns of image by linearly varying offset Library Geometric Transformations Description The Shear block shifts the rows or columns of an image by a gradually
Tutorial. Filtering Images F I L T E R I N G. Filtering Images. with. TNTmips. page 1
 F I L T E R I N G Tutorial Filtering Images Filtering Images with TNTmips page 1 Filtering Images Before Getting Started In working with digital forms of aerial photographs or satellite imagery, you will
DIGITAL IMAGE PROCESSING AND ANALYSIS
 DIGITAL IMAGE PROCESSING AND ANALYSIS Human and Computer Vision Applications with CVIPtools SECOND EDITION SCOTT E UMBAUGH Uffi\ CRC Press Taylor &. Francis Group Boca Raton London New York CRC Press is
ENVI Classic Tutorial: Atmospherically Correcting Multispectral Data Using FLAASH 2
 ENVI Classic Tutorial: Atmospherically Correcting Multispectral Data Using FLAASH Atmospherically Correcting Multispectral Data Using FLAASH 2 Files Used in this Tutorial 2 Opening the Raw Landsat Image
Modelling, Extraction and Description of Intrinsic Cues of High Resolution Satellite Images: Independent Component Analysis based approaches
 Modelling, Extraction and Description of Intrinsic Cues of High Resolution Satellite Images: Independent Component Analysis based approaches PhD Thesis by Payam Birjandi Director: Prof. Mihai Datcu Problematic
jorge s. marques image processing
 image processing images images: what are they? what is shown in this image? What is this? what is an image images describe the evolution of physical variables (intensity, color, reflectance, condutivity)
EECS 556 Image Processing W 09. Interpolation. Interpolation techniques B splines
 EECS 556 Image Processing W 09 Interpolation Interpolation techniques B splines What is image processing? Image processing is the application of 2D signal processing methods to images Image representation
Redundant Wavelet Transform Based Image Super Resolution
 Redundant Wavelet Transform Based Image Super Resolution Arti Sharma, Prof. Preety D Swami Department of Electronics &Telecommunication Samrat Ashok Technological Institute Vidisha Department of Electronics
Department of Mechanical Engineering, King s College London, University of London, Strand, London, WC2R 2LS, UK; e-mail: david.hann@kcl.ac.
 INT. J. REMOTE SENSING, 2003, VOL. 24, NO. 9, 1949 1956 Technical note Classification of off-diagonal points in a co-occurrence matrix D. B. HANN, Department of Mechanical Engineering, King s College London,
Resolution Enhancement of images with Interpolation and DWT-SWT Wavelet Domain Components
 Resolution Enhancement of images with Interpolation and DWT-SWT Wavelet Domain Components Mr. G.M. Khaire 1, Prof. R.P.Shelkikar 2 1 PG Student, college of engg, Osmanabad. 2 Associate Professor, college
Definition of KOMPSAT-3 Product Quality
 KOMPSAT-1 KOMPSAT-2 KOMPSAT-3 KOMPSAT-5 KOMPSAT-3A Korea Aerospace Research Institute 115 Gwahangro, Yuseong-gu Daejeon, 305-333, Korea Definition of KOMPSAT-3 Product Quality March 27, 2014 DongHan Lee
Lecture 14. Point Spread Function (PSF)
") Lecture 14 Point Spread Function (PSF), Modulation Transfer Function (MTF), Signal-to-noise Ratio (SNR), Contrast-to-noise Ratio (CNR), and Receiver Operating Curves (ROC) Point Spread Function (PSF) Recollect
Lecture 14 Point Spread Function (PSF), Modulation Transfer Function (MTF), Signal-to-noise Ratio (SNR), Contrast-to-noise Ratio (CNR), and Receiver Operating Curves (ROC) Point Spread Function (PSF) Recollect
Visualization and Feature Extraction, FLOW Spring School 2016 Prof. Dr. Tino Weinkauf. Flow Visualization. Image-Based Methods (integration-based)
") Visualization and Feature Extraction, FLOW Spring School 2016 Prof. Dr. Tino Weinkauf Flow Visualization Image-Based Methods (integration-based) Spot Noise (Jarke van Wijk, Siggraph 1991) Flow Visualization:
Visualization and Feature Extraction, FLOW Spring School 2016 Prof. Dr. Tino Weinkauf Flow Visualization Image-Based Methods (integration-based) Spot Noise (Jarke van Wijk, Siggraph 1991) Flow Visualization:
Comparison of Non-linear Dimensionality Reduction Techniques for Classification with Gene Expression Microarray Data
 CMPE 59H Comparison of Non-linear Dimensionality Reduction Techniques for Classification with Gene Expression Microarray Data Term Project Report Fatma Güney, Kübra Kalkan 1/15/2013 Keywords: Non-linear
Scanners and How to Use Them
 Written by Jonathan Sachs Copyright 1996-1999 Digital Light & Color Introduction A scanner is a device that converts images to a digital file you can use with your computer. There are many different types
Image Segmentation and Registration
 Image Segmentation and Registration Dr. Christine Tanner (tanner@vision.ee.ethz.ch) Computer Vision Laboratory, ETH Zürich Dr. Verena Kaynig, Machine Learning Laboratory, ETH Zürich Outline Segmentation
Common factor analysis
 Common factor analysis This is what people generally mean when they say "factor analysis" This family of techniques uses an estimate of common variance among the original variables to generate the factor
Digital Imaging and Multimedia. Filters. Ahmed Elgammal Dept. of Computer Science Rutgers University
 Digital Imaging and Multimedia Filters Ahmed Elgammal Dept. of Computer Science Rutgers University Outlines What are Filters Linear Filters Convolution operation Properties of Linear Filters Application
Exercise 1.12 (Pg. 22-23)
") Individuals: The objects that are described by a set of data. They may be people, animals, things, etc. (Also referred to as Cases or Records) Variables: The characteristics recorded about each individual.
Individuals: The objects that are described by a set of data. They may be people, animals, things, etc. (Also referred to as Cases or Records) Variables: The characteristics recorded about each individual.
Analecta Vol. 8, No. 2 ISSN 2064-7964
 EXPERIMENTAL APPLICATIONS OF ARTIFICIAL NEURAL NETWORKS IN ENGINEERING PROCESSING SYSTEM S. Dadvandipour Institute of Information Engineering, University of Miskolc, Egyetemváros, 3515, Miskolc, Hungary,
Comparison of Nine Fusion Techniques for Very High Resolution Data
 Comparison of Nine Fusion Techniques for Very High Resolution Data Konstantinos G. Nikolakopoulos Abstract The term image fusion covers multiple techniques used to combine the geometric detail of a high-resolution
Face detection is a process of localizing and extracting the face region from the
 Chapter 4 FACE NORMALIZATION 4.1 INTRODUCTION Face detection is a process of localizing and extracting the face region from the background. The detected face varies in rotation, brightness, size, etc.
Glencoe. correlated to SOUTH CAROLINA MATH CURRICULUM STANDARDS GRADE 6 3-3, 5-8 8-4, 8-7 1-6, 4-9
 Glencoe correlated to SOUTH CAROLINA MATH CURRICULUM STANDARDS GRADE 6 STANDARDS 6-8 Number and Operations (NO) Standard I. Understand numbers, ways of representing numbers, relationships among numbers,
Principal components analysis
 CS229 Lecture notes Andrew Ng Part XI Principal components analysis In our discussion of factor analysis, we gave a way to model data x R n as approximately lying in some k-dimension subspace, where k
MODIS IMAGES RESTORATION FOR VNIR BANDS ON FIRE SMOKE AFFECTED AREA
 MODIS IMAGES RESTORATION FOR VNIR BANDS ON FIRE SMOKE AFFECTED AREA Li-Yu Chang and Chi-Farn Chen Center for Space and Remote Sensing Research, National Central University, No. 300, Zhongda Rd., Zhongli
Accurate and robust image superresolution by neural processing of local image representations
 Accurate and robust image superresolution by neural processing of local image representations Carlos Miravet 1,2 and Francisco B. Rodríguez 1 1 Grupo de Neurocomputación Biológica (GNB), Escuela Politécnica
Sachin Patel HOD I.T Department PCST, Indore, India. Parth Bhatt I.T Department, PCST, Indore, India. Ankit Shah CSE Department, KITE, Jaipur, India
 Image Enhancement Using Various Interpolation Methods Parth Bhatt I.T Department, PCST, Indore, India Ankit Shah CSE Department, KITE, Jaipur, India Sachin Patel HOD I.T Department PCST, Indore, India
WATER BODY EXTRACTION FROM MULTI SPECTRAL IMAGE BY SPECTRAL PATTERN ANALYSIS
 WATER BODY EXTRACTION FROM MULTI SPECTRAL IMAGE BY SPECTRAL PATTERN ANALYSIS Nguyen Dinh Duong Department of Environmental Information Study and Analysis, Institute of Geography, 18 Hoang Quoc Viet Rd.,
Admin stuff. 4 Image Pyramids. Spatial Domain. Projects. Fourier domain 2/26/2008. Fourier as a change of basis
 Admin stuff 4 Image Pyramids Change of office hours on Wed 4 th April Mon 3 st March 9.3.3pm (right after class) Change of time/date t of last class Currently Mon 5 th May What about Thursday 8 th May?
Algebra 2 Chapter 1 Vocabulary. identity - A statement that equates two equivalent expressions.
 Chapter 1 Vocabulary identity - A statement that equates two equivalent expressions. verbal model- A word equation that represents a real-life problem. algebraic expression - An expression with variables.
KEYWORDS: image classification, multispectral data, panchromatic data, data accuracy, remote sensing, archival data
 Improving the Accuracy of Historic Satellite Image Classification by Combining Low-Resolution Multispectral Data with High-Resolution Panchromatic Data Daniel J. Getman 1, Jonathan M. Harbor 2, Chris J.
(Refer Slide Time: 06:10)
") Computer Graphics Prof. Sukhendu Das Dept. of Computer Science and Engineering Indian Institute of Technology, Madras Lecture - 43 Digital Image Processing Welcome back to the last part of the lecture
Computer Graphics Prof. Sukhendu Das Dept. of Computer Science and Engineering Indian Institute of Technology, Madras Lecture - 43 Digital Image Processing Welcome back to the last part of the lecture
Principal Component Analysis
 Principal Component Analysis Principle Component Analysis: A statistical technique used to examine the interrelations among a set of variables in order to identify the underlying structure of those variables.
Module 3: Correlation and Covariance
 Using Statistical Data to Make Decisions Module 3: Correlation and Covariance Tom Ilvento Dr. Mugdim Pašiƒ University of Delaware Sarajevo Graduate School of Business O ften our interest in data analysis
Ring grave detection in high resolution satellite images of agricultural land
 Ring grave detection in high resolution satellite images of agricultural land Siri Øyen Larsen, Øivind Due Trier, Ragnar Bang Huseby, and Rune Solberg, Norwegian Computing Center Collaborators: The Norwegian
Adaptive Demand-Forecasting Approach based on Principal Components Time-series an application of data-mining technique to detection of market movement
 Adaptive Demand-Forecasting Approach based on Principal Components Time-series an application of data-mining technique to detection of market movement Toshio Sugihara Abstract In this study, an adaptive
A Novel Method to Improve Resolution of Satellite Images Using DWT and Interpolation
 A Novel Method to Improve Resolution of Satellite Images Using DWT and Interpolation S.VENKATA RAMANA ¹, S. NARAYANA REDDY ² M.Tech student, Department of ECE, SVU college of Engineering, Tirupati, 517502,
How To Cluster
 Data Clustering Dec 2nd, 2013 Kyrylo Bessonov Talk outline Introduction to clustering Types of clustering Supervised Unsupervised Similarity measures Main clustering algorithms k-means Hierarchical Main
Readings in Image Processing
 OVERVIEW OF IMAGE PROCESSING K.M.M. Rao*,Deputy Director,NRSA,Hyderabad-500 037 Introduction Image Processing is a technique to enhance raw images received from cameras/sensors placed on satellites, space
Introduction to Principal Component Analysis: Stock Market Values
 Chapter 10 Introduction to Principal Component Analysis: Stock Market Values The combination of some data and an aching desire for an answer does not ensure that a reasonable answer can be extracted from
Medical Image Processing on the GPU. Past, Present and Future. Anders Eklund, PhD Virginia Tech Carilion Research Institute andek@vtc.vt.
 Medical Image Processing on the GPU Past, Present and Future Anders Eklund, PhD Virginia Tech Carilion Research Institute andek@vtc.vt.edu Outline Motivation why do we need GPUs? Past - how was GPU programming
Lab #8: Introduction to ENVI (Environment for Visualizing Images) Image Processing
 Image Processing") Lab #8: Introduction to ENVI (Environment for Visualizing Images) Image Processing ASSIGNMENT: Display each band of a satellite image as a monochrome image and combine three bands into a color image, and
Lab #8: Introduction to ENVI (Environment for Visualizing Images) Image Processing ASSIGNMENT: Display each band of a satellite image as a monochrome image and combine three bands into a color image, and
Biggar High School Mathematics Department. National 5 Learning Intentions & Success Criteria: Assessing My Progress
 Biggar High School Mathematics Department National 5 Learning Intentions & Success Criteria: Assessing My Progress Expressions & Formulae Topic Learning Intention Success Criteria I understand this Approximation
An Assessment of the Effectiveness of Segmentation Methods on Classification Performance
 An Assessment of the Effectiveness of Segmentation Methods on Classification Performance Merve Yildiz 1, Taskin Kavzoglu 2, Ismail Colkesen 3, Emrehan K. Sahin Gebze Institute of Technology, Department
PERFORMANCE ANALYSIS OF HIGH RESOLUTION IMAGES USING INTERPOLATION TECHNIQUES IN MULTIMEDIA COMMUNICATION SYSTEM
 PERFORMANCE ANALYSIS OF HIGH RESOLUTION IMAGES USING INTERPOLATION TECHNIQUES IN MULTIMEDIA COMMUNICATION SYSTEM Apurva Sinha 1, Mukesh kumar 2, A.K. Jaiswal 3, Rohini Saxena 4 Department of Electronics
Spectral Response for DigitalGlobe Earth Imaging Instruments
 Spectral Response for DigitalGlobe Earth Imaging Instruments IKONOS The IKONOS satellite carries a high resolution panchromatic band covering most of the silicon response and four lower resolution spectral
DESCRIPTIVE STATISTICS. The purpose of statistics is to condense raw data to make it easier to answer specific questions; test hypotheses.
 DESCRIPTIVE STATISTICS The purpose of statistics is to condense raw data to make it easier to answer specific questions; test hypotheses. DESCRIPTIVE VS. INFERENTIAL STATISTICS Descriptive To organize,
Least-Squares Intersection of Lines
 Least-Squares Intersection of Lines Johannes Traa - UIUC 2013 This write-up derives the least-squares solution for the intersection of lines. In the general case, a set of lines will not intersect at a
Land Use/Land Cover Map of the Central Facility of ARM in the Southern Great Plains Site Using DOE s Multi-Spectral Thermal Imager Satellite Images
 Land Use/Land Cover Map of the Central Facility of ARM in the Southern Great Plains Site Using DOE s Multi-Spectral Thermal Imager Satellite Images S. E. Báez Cazull Pre-Service Teacher Program University
Resolutions of Remote Sensing
 Resolutions of Remote Sensing 1. Spatial (what area and how detailed) 2. Spectral (what colors bands) 3. Temporal (time of day/season/year) 4. Radiometric (color depth) Spatial Resolution describes how
Lean Six Sigma Analyze Phase Introduction. TECH 50800 QUALITY and PRODUCTIVITY in INDUSTRY and TECHNOLOGY
 TECH 50800 QUALITY and PRODUCTIVITY in INDUSTRY and TECHNOLOGY Before we begin: Turn on the sound on your computer. There is audio to accompany this presentation. Audio will accompany most of the online
TerraColor White Paper
 TerraColor White Paper TerraColor is a simulated true color digital earth imagery product developed by Earthstar Geographics LLC. This product was built from imagery captured by the US Landsat 7 (ETM+)
Galaxy Morphological Classification
 Galaxy Morphological Classification Jordan Duprey and James Kolano Abstract To solve the issue of galaxy morphological classification according to a classification scheme modelled off of the Hubble Sequence,
Module II: Multimedia Data Mining
 ALMA MATER STUDIORUM - UNIVERSITÀ DI BOLOGNA Module II: Multimedia Data Mining Laurea Magistrale in Ingegneria Informatica University of Bologna Multimedia Data Retrieval Home page: http://www-db.disi.unibo.it/courses/dm/
Noise estimation in remote sensing imagery using data masking
 INT. J. REMOTE SENSING, 2003, VOL. 24, NO. 4, 689 702 Noise estimation in remote sensing imagery using data masking B. R. CORNER, R. M. NARAYANAN* and S. E. REICHENBACH Department of Electrical Engineering,
SPREADSHEET EDUCATION MATERIAL USING REMOTE SENSING IMAGE AND MAP IMAGE
 SPREADSHEET EDUCATION MATERIAL USING REMOTE SENSING IMAGE AND MAP IMAGE Kiyotada Sato a, *, Ryuzo Yokoyama b a Ichinoseki National College of Technology Mechanical Engineering, Hagisho Ichinoseki City,
Principal Component Analysis
 Principal Component Analysis ERS70D George Fernandez INTRODUCTION Analysis of multivariate data plays a key role in data analysis. Multivariate data consists of many different attributes or variables recorded
1 2 3 1 1 2 x = + x 2 + x 4 1 0 1
 (d) If the vector b is the sum of the four columns of A, write down the complete solution to Ax = b. 1 2 3 1 1 2 x = + x 2 + x 4 1 0 0 1 0 1 2. (11 points) This problem finds the curve y = C + D 2 t which
Steven M. Ho!and. Department of Geology, University of Georgia, Athens, GA 30602-2501
 PRINCIPAL COMPONENTS ANALYSIS (PCA) Steven M. Ho!and Department of Geology, University of Georgia, Athens, GA 30602-2501 May 2008 Introduction Suppose we had measured two variables, length and width, and
Adaptive Face Recognition System from Myanmar NRC Card
 Adaptive Face Recognition System from Myanmar NRC Card Ei Phyo Wai University of Computer Studies, Yangon, Myanmar Myint Myint Sein University of Computer Studies, Yangon, Myanmar ABSTRACT Biometrics is
A PHOTOGRAMMETRIC APPRAOCH FOR AUTOMATIC TRAFFIC ASSESSMENT USING CONVENTIONAL CCTV CAMERA
 A PHOTOGRAMMETRIC APPRAOCH FOR AUTOMATIC TRAFFIC ASSESSMENT USING CONVENTIONAL CCTV CAMERA N. Zarrinpanjeh a, F. Dadrassjavan b, H. Fattahi c * a Islamic Azad University of Qazvin - nzarrin@qiau.ac.ir
EXPLORING SPATIAL PATTERNS IN YOUR DATA
 EXPLORING SPATIAL PATTERNS IN YOUR DATA OBJECTIVES Learn how to examine your data using the Geostatistical Analysis tools in ArcMap. Learn how to use descriptive statistics in ArcMap and Geoda to analyze
Canada J1K 2R1 b. * Corresponding author: Email: wangz@dmi.usherb.ca; Tel. +1-819-8218000-2855;Fax:+1-819-8218200
 Production of -resolution remote sensing images for navigation information infrastructures Wang Zhijun a, *, Djemel Ziou a, Costas Armenakis b a Dept of mathematics and informatics, University of Sherbrooke,
5: Magnitude 6: Convert to Polar 7: Convert to Rectangular
 TI-NSPIRE CALCULATOR MENUS 1: Tools > 1: Define 2: Recall Definition --------------- 3: Delete Variable 4: Clear a-z 5: Clear History --------------- 6: Insert Comment 2: Number > 1: Convert to Decimal