The Limits of Measurement: Problems in Estimating Reading Achievement in PIRLS 2006 for Low-performing Countries
|
|
|
- Leo Merritt
- 7 years ago
- Views:
Transcription
1 The Limits of Measurement: Problems in Estimating Reading Achievement in PIRLS 2006 for Low-performing Countries Pierre Foy, Michael O. Martin, Ina V.S. Mullis, TIMSS & PIRLS International Study Center Boston College Abstract Abstract This research uses results from PIRLS 2006 to demonstrate how the quality of the measurement based on complex IRT methodology for large scale assessments erodes when the assessment items are too difficult for many of the students. Based on diagnostic information from the PIRLS 2006 IRT scaling, results show that an average percent correct of 30 percent across all the items on the assessment is a useful minimum achievement target, and that countries where fourth grade achievement does not reach this level on the field test should consider administering PIRLS at a higher grade. Such countries also have the option of participating in prepirls, IEA s new and less demanding version of PIRLS, which also will be conducted in conjunction with PIRLS in Keywords: Item Percent Correct, Item Response Theory, Large-scale International Assessment, Low-performing countries, Reading Achievement Introduction It is a well-known principle of educational measurement that the difficulty of the items used to assess student achievement should match the ability of the students taking the assessment. In the context of assessing reading comprehension, measurement is most efficient when there is a reasonable match between the reading ability level of the student population being assessed and the difficulty of the assessment passages and items. The greater the mismatch, the more difficult it becomes to achieve reliable measurement. In particular, when the assessment tasks are much too challenging for most of the students, to the extent that many students cannot answer even one question correctly, it is extremely difficult to achieve acceptable measurement quality. Participating in IEA s PIRLS (Progress in International Reading Literacy Study) is a very resource intensive, high effort endeavor. Further, the ostensible reason for participation is to 1
2 obtain high-quality information to use in formulating education policy. However, if the reliability of the students achievement results has eroded to the point that there is little confidence in the results, participating in PIRLS may not be efficient from a cost/benefit perspective. In this situation, while the experience of participating in a large-scale international assessment is valuable in and of itself, and important background information may be collected, considerable resources and effort will be expended for achievement data that may not be very useful or informative. IEA is an inclusive organization that encourages participation by as many countries and regional entities as possible. In support of this goal, the TIMSS and PIRLS IRT-based assessment methodology is very robust and provides accurate measurement across a wide range of student abilities. However, like any assessment of student achievement, TIMSS and PIRLS have limits on their measurement capabilities. In particular, as countries with low levels of student achievement consider participating, it is becoming apparent that there needs to be careful consideration of the correspondence between the demands of the assessments and the achievement of the participating students. The purpose of this research is to use PIRLS 2006 data to demonstrate the degree of erosion in the quality of achievement measurement when the knowledge and skills of the students are considerably below those demanded by the assessment (i.e., the items are too difficult for most students). This research further considers criteria for when the measurement approaches used by PIRLS 2006 have reached their limits, and the reliability of student achievement estimates has decreased to the point that it is no longer meaningful to report the results. International Performance on PIRLS 2006 When PIRLS was designed originally in 1999, it was targeted at the fourth grade of primary school because this was an important transition point in children s development as readers. In most of the countries intending to participate in PIRLS, fourth grade students essentially had learned how to read and were now reading to learn (Mullis, Kennedy, Martin, & Sainsbury, 2006). Thus, PIRLS is a high-quality, demanding assessment of reading comprehension, designed to measure what accomplished primary school readers can do that have made the transition to reading to learn. The complete PIRLS 2006 assessment consisted of 10 passages, 5 literary and 5 informational. The literary texts were complete short stories covering a variety of settings, each having one or two main characters and a plot with one or two central events. The informational texts covered a variety of scientific, geographical, biographical, and procedural material and were structured sequentially or by topic. As well as prose, each informational text included organizational and 2
3 presentational features such as diagrams, maps, illustrations, photographs, text boxes, lists, or tables. To support the variety of questions necessary to cover the range of comprehension processes assessed, the passages averaged 760 words in length, with a range of from 495 to 872 words (Mullis, Martin, Kennedy, & Foy, 2007). As a way of describing the overall difficulty of the PIRLS 2006 assessment, the PIRLS 2006 International Report (Mullis, Martin, Kennedy, & Foy, 2007) presented for each country the percentage of students answering each item correctly, averaged across all items in the assessment. In most countries, student achievement was distributed across the full range of the PIRLS assessment, with some students answering most of the items correctly, some students answering few of the items correctly, and most students somewhere in between. Although there were exceptions, in most of the PIRLS 2006 countries there was a reasonable match between the overall difficulty of the assessment and the general level of reading comprehension of the students, and student achievement could be reported with a high degree of confidence. Most PIRLS 2006 participating countries had an average percent correct in the middle of the percentage range, somewhere from 30 to 70 percent, which seems entirely appropriate for an assessment designed to compare countries across a wide range of achievement levels. The average percent correct across all countries was 54 percent. There were four countries, however, where students found the PIRLS assessment particularly challenging. These were Kuwait (22% correct), Morocco (21%), Qatar (24%), and South Africa (21%). Although the absolute lower limit in terms of average percent correct is 0 (i.e., no items answered correctly), because about half the items were in multiple choice format and guessing on these was possible, the effective lower limit for the PIRLS 2006 assessment is somewhat higher than this; probably in the region percent. 1 With an average percent correct for the country not far above the level a nonreader could approach by chance, it is evident that many students in these countries were unable to engage meaningfully with the PIRLS reading passages and items. 1 Of the 167 score points on the PIRLS 2006 assessment, 64 points came from multiple-choice items and the remainder from constructed response items. Students completely unable to read would likely omit the constructed response items and would receive zero points for these items. However, such students could, in principle, choose an option randomly for each of the multiple choice items, and since each item has four options, could expect to choose correctly on one occasion in four. On average, therefore, such students could expect to answer 16 of the 64 multiple choice items correctly by chance alone. Including the remaining 103 points from constructed response items in the total, such students could expect on average to receive 16 points from the total of 167 points, or approximately 10%. The actual lower limit is probably somewhat higher than this, however, because evidence from the test taking literature suggests that most students who guess have at least some partial information and consequently do not guess completely at random. 3
4 In addition to overall reading achievement, PIRLS 2006 reported achievement in terms of two purposes for reading and two reading comprehension processes. The average difficulty of the items addressing reading for literary experience (55%) and reading to acquire and use information (51%) were approximately equal and similar to the overall difficulty level of the assessment. However, undoubtedly reflecting inherent differences in the complexity of the processes themselves, the items addressing the interpreting, integrating, and evaluating comprehension process were more difficult on average than those addressing retrieval and straightforward inferencing (44% correct versus 64% correct). Not surprisingly, students in the four lowest achieving countries found the interpreting, integrating, and evaluating items to be especially challenging, and on average very few of these items were answered correctly Kuwait (13%), Morocco (11%), Qatar (14%), and South Africa (14%). Because of this very low performance, student achievement for interpreting, integrating, and evaluating was not reported in these countries in the PIRLS 2006 International Report. Reporting Student Achievement on PIRLS 2006 As a large scale international assessment, PIRLS was designed to monitor reading comprehension across the entire fourth-grade student population in each country. The 10 reading passages in PIRLS 2006 were distributed among students in each country according to a matrix-sampling design, with each student reading two of the 10 passages. Student achievement on the PIRLS assessment was reported using IRT scaling in conjunction with conditioning and plausible values (Foy, Galia, & Li, 2007). This methodology estimates students achievement from their responses to the passages that they have read and maps it onto the PIRLS achievement scale, 2 enabling comparisons among student populations and across assessment cycles to measure trends in reading achievement. The PIRLS scaling methodology is robust, and readily represents the full range of student responses to the PIRLS passages and items on the PIRLS achievement scale in most countries. More specifically, in the large majority of countries where the average percent correct ranges from 30 percent upwards, the PIRLS scaling appears to provide accurate measures of student achievement. However, for countries with lower performance levels, below 30 percent correct, information produced by the scaling process indicates that the PIRLS assessment is not a good 2 The PIRLS achievement scale was established to have a mean of 500 and standard deviation of 100 corresponding to the mean and standard deviation across the countries that participated in the first cycle of PIRLS in
5 fit for many of the students, and that the achievement results produced by the PIRLS scaling may not be reliable indicators of the average level of reading achievement in the country. Symptoms of Unreliable Measurement in Low Performing Countries The PIRLS scaling methodology fits a complex model to the data for each country, using each student s pattern of responses to the PIRLS passages and items in conjunction with all available information about the student s background characteristics to estimate the student s likely achievement distribution. Because this distribution is conditional on the student s item responses and background, it is known as the posterior distribution. The student s posterior distribution encapsulates all that we know about the achievement of that student, but the fact that it is a probability distribution (and not a point estimate) indicates that there is still some uncertainty about the student s precise level of achievement. The posterior distribution is assumed to be approximately normally distributed, conditional on the student s item responses and background characteristics. Therefore, the standard deviation of the posterior distribution, which is a measure of the spread, or dispersion of the distribution, may be taken as a measure of how well the student s achievement has been estimated. The smaller the standard deviation, the narrower will be the possible range of student achievement and the more accurate the estimation. Conversely, the larger the standard deviation, the greater the dispersion will be and the more uncertainty in the achievement estimation. As the standard deviation of a student s posterior distribution is a measure of how precisely that student s achievement has been estimated, the average posterior standard deviation across all students in a country may be taken as an indicator of how well achievement has been measured in that country, in comparison to other countries. Table 1 presents the average posterior standard deviation for each PIRLS 2006 country for overall reading and for the retrieval and straightforward inferencing and for the interpreting, integrating, and evaluating comprehension processes. Countries are sorted in descending order by average posterior standard deviation on reading overall. It is noteworthy that the four countries where students found the PIRLS 2006 items most challenging South Africa, Morocco, Kuwait, and Qatar have the largest average standard deviations of all countries, for overall reading and for each of the two comprehension processes. Not only is student reading achievement low in these countries, it is also not as precisely estimated as in the other countries, and there is more uncertainty involved. [Take in Table 1 about here] 5
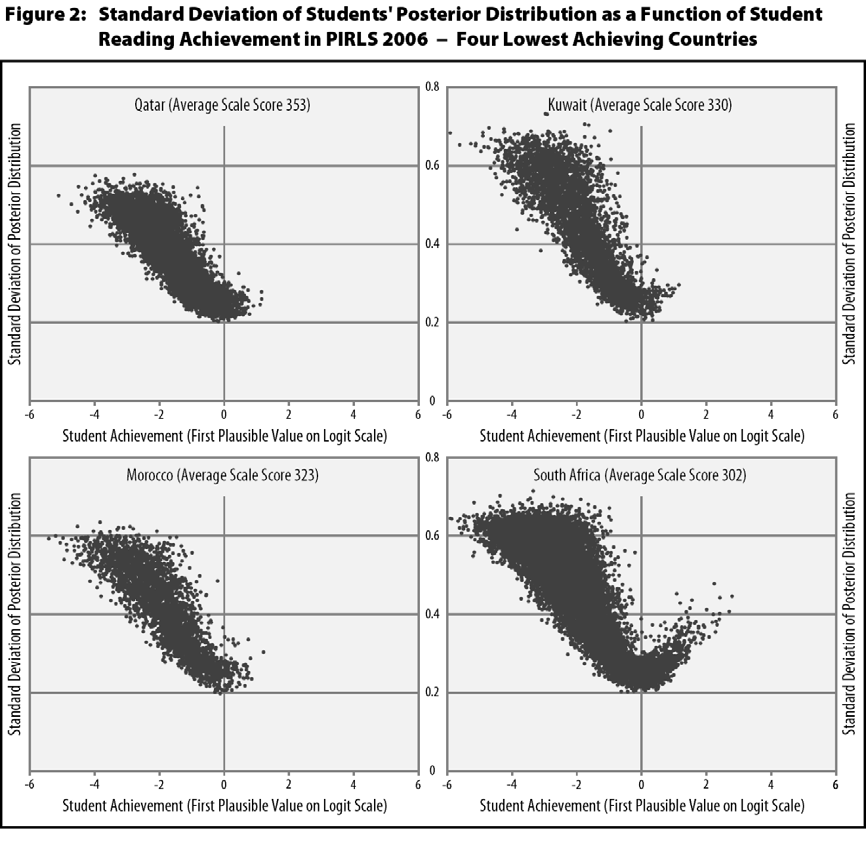
6 Given that achievement was measured with least precision overall in the lowest achieving countries, it is useful to examine whether measurement is equally precise all across the achievement spectrum in each country, or whether, for example, it is less precisely estimated among lower achieving students. In order to provide an estimate of student achievement that can be used for analysis and reporting purposes, PIRLS draws five plausible values from the posterior distribution for each student. Because the posterior distribution incorporates all available information about a student s reading proficiency, each plausible value drawn from this distribution is an estimate of the student s achievement. Although each plausible value is an unbiased estimate of the student s achievement, each one includes some error due to the uncertainty of the estimation process. Therefore, group statistics such as means or percentages should be computed by first calculating the statistic separately for each plausible value and then averaging across the five estimates to get the best result. The variability among the five estimates of the statistic reflects the error from the imputation process. Using the first plausible value 3 as an indicator of student achievement, Figure 1 presents the relationship between student achievement and posterior standard deviation for three countries spanning a range of average achievement on PIRLS 2006, including the Russian Federation (high average achievement 565 point average), Norway (mid-level average achievement 498 point average), and Indonesia (mid-to-low average achievement 405 point average). The figure also shows the relationship across all the PIRLS 2006 countries that had average reading achievement greater than 400, i.e., all countries except the four lowest achieving ones. [Take in Figure 1 about here] Figure 1 shows that for each of the three countries and for the aggregate across countries, posterior standard deviations were at their lowest, and consequently measurement at its most precise, at the midpoint of the achievement distribution. As achievement increased above the midpoint, the posterior standard deviation also increased somewhat, as exemplified by the display for the Russian Federation, a country with most students in the upper half of the achievement distribution. The posterior standard deviation also increased as achievement decreased below the midpoint, as may be seen most clearly from the display for Indonesia, a country with most students in the lower half of the distribution. In this display, the standard deviation increased steadily as achievement decreased. The Figure 1 display for the aggregate of all countries with average achievement above 400 clearly shows the u-shaped relationship between achievement and posterior standard deviation. This display also shows that the relationship is somewhat asymmetrical for this set of countries, that is, there were 3 Plausible values and standard deviations are shown on the logit scale, before transformation to the PIRLS International Scale with its (500, 100) metric. 6
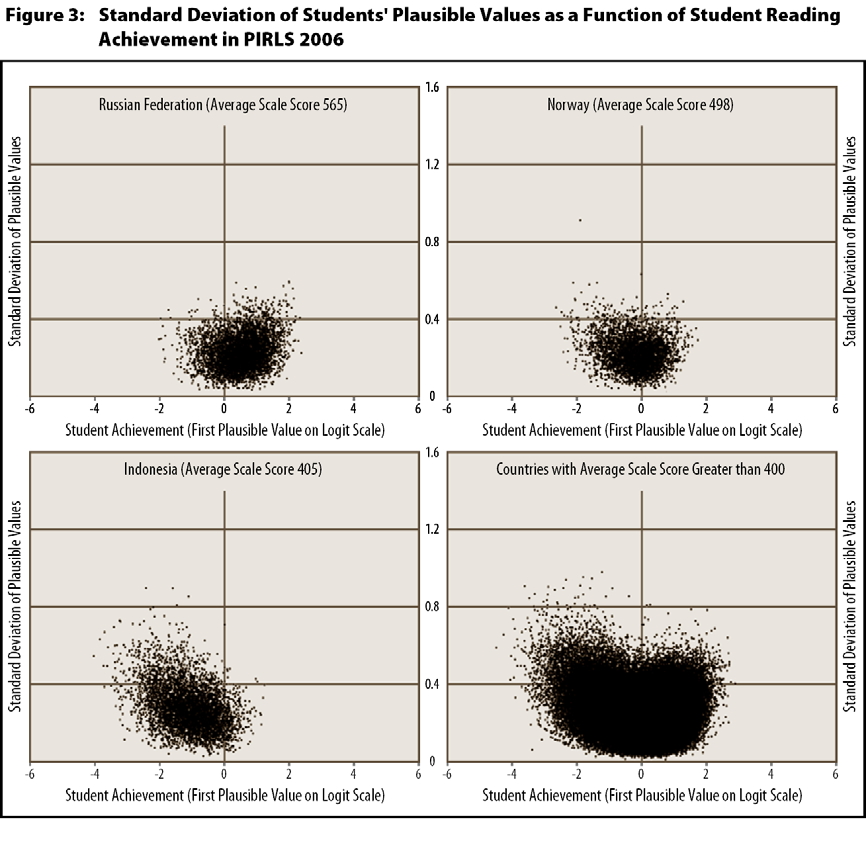
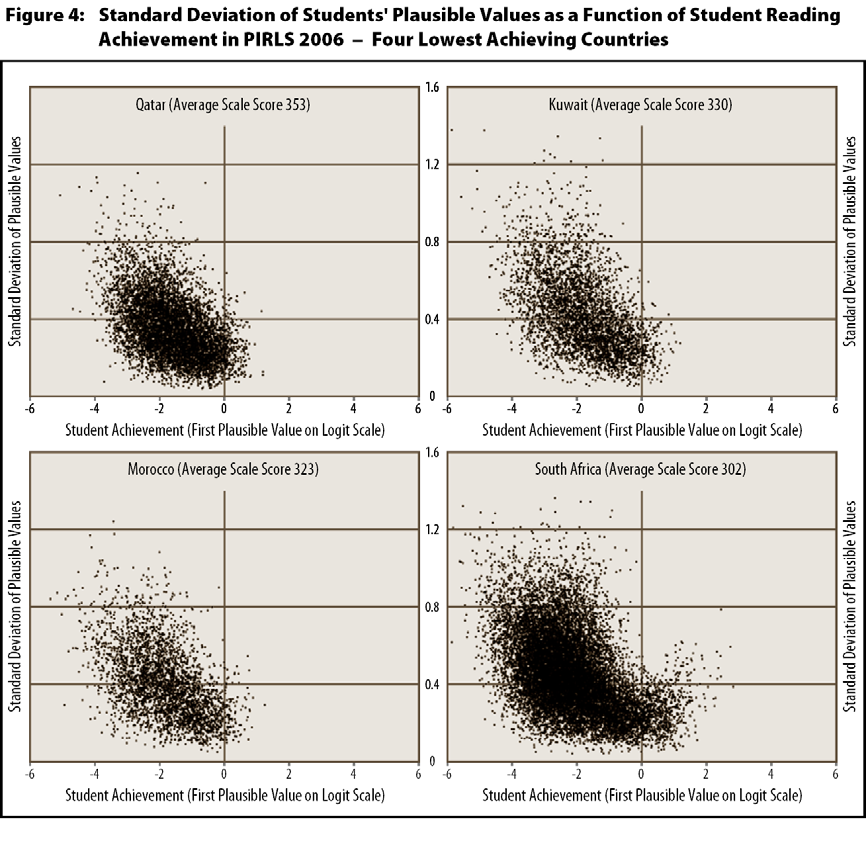
7 relatively more students with achievement more than 2 logits below the midpoint than 2 logits above it, and these lower achieving students had generally higher standard deviations. Across this set of countries, the vast majority of students had posterior standard deviations below 0.4 logits. Figure 2 presents the relationship between reading achievement and posterior standard deviation for the four lowest-achieving countries in PIRLS As would be expected, in these countries there was a much greater proportion of students in the lower half of the achievement distribution, particularly in the region of the scale below -2 logits, than in the displays shown in Figure 1. It also is very clear that the achievement of the lowest achieving countries was poorly estimated. In Qatar, which had the highest average achievement of the four, about half the students had standard deviations greater than 0.4, and in the other three countries, more than half the students had standard deviations of 0.4 or greater. [Take in Figure 2 about here] As the standard deviation of the conditional distribution from which a student s five plausible values are drawn, the posterior standard deviation is one indicator of how precisely achievement has been measured. Another, related indicator is the dispersion among the plausible values themselves, as measured by the standard deviation of each student s five plausible values. Figure 3 provides a perspective on the relationship between achievement and this indicator of measurement precision. It shows how the plausible value standard deviation varies as a function of the first plausible value for the Russian Federation, Norway, and Indonesia, as well as for the aggregate of all PIRLS 2006 countries with average scores above 400. For these countries, which have a reasonably good match between the difficulty of the items and the achievement of the students, there is no clear relationship between achievement and measurement precision, although for Indonesia, which as a country is towards the lower end of the achievement distribution, there is evidence of larger standard deviations among lower achieving students. [Take in Figure 3 about here] Figure 4 presents the data on the same relationship for the four lowest achieving countries: Qatar, Kuwait, Morocco, and South Africa. Confirming the message from Figure 2, along with generally low achievement (mostly in the range -4 logits to 0 logits), these countries have many students with relatively large standard deviations. Whereas among countries with average scores above 400, plausible value standard deviations rarely exceeded 0.8 logits (Figure 3), in the lowest achieving countries such standard deviations ranged above 1.2 logits. 7
8 [Take in Figure 4 about here] Why Are Very Low Achievers Badly Estimated? As a general rule, in order to estimate a student s achievement level and locate the student on an achievement scale it is necessary to present the student with a series of tasks, some of which the student can do successfully and some of which the student is less successful or cannot do. IRT scaling proceeds by examining which items the student answered correctly and which items incorrectly, and based on the difficulty of the items, arrives at an estimate of the proficiency such a student most likely would have. Crucial to finding this proficiency estimate is having both items that the student could answer correctly and items that the student could not answer correctly. Both are necessary; it is the difference between what a student can and cannot do that is at the heart of the proficiency estimation process. Because the estimation of student proficiency is dependent on evidence of what a student can and cannot do, it is difficult to derive a reliable proficiency estimate when the student can answer very few items correctly and hence provides little evidence of what he or she can do. Fortunately, the marginal estimation procedure used by PIRLS does not rely on accurately estimating each student s proficiency, but rather combines student responses to the items they were administered to estimate the achievement distribution of the entire population. In constructing such population estimates, having a few students with extremely low scores is not a problem, but as the proportion of such students increases, the reliability of the measurement suffers and the threat of bias in the results becomes an important issue. Bias from Very Low Achievers The Floor Effect Constructors of achievement tests have long been aware of the ceiling effect in measuring student achievement. A test has a ceiling if the items are too easy for the students taking the test, such that many students answer all of the items correctly. The maximum score on such a test is an underestimate of those students real achievement, in the sense that they would probably do better on a more difficult test that would allow them to show more of what they are capable of. Perhaps less common in the measurement field is the floor effect. A test can have a floor effect if it is much too difficult for a student, so that the student cannot answer any of the items correctly. In that situation, the lowest possible score on the test (a zero score) may well be an overestimate of the student s real achievement, compared to what the results would show on an easier test with items better suited to the student s ability. 8
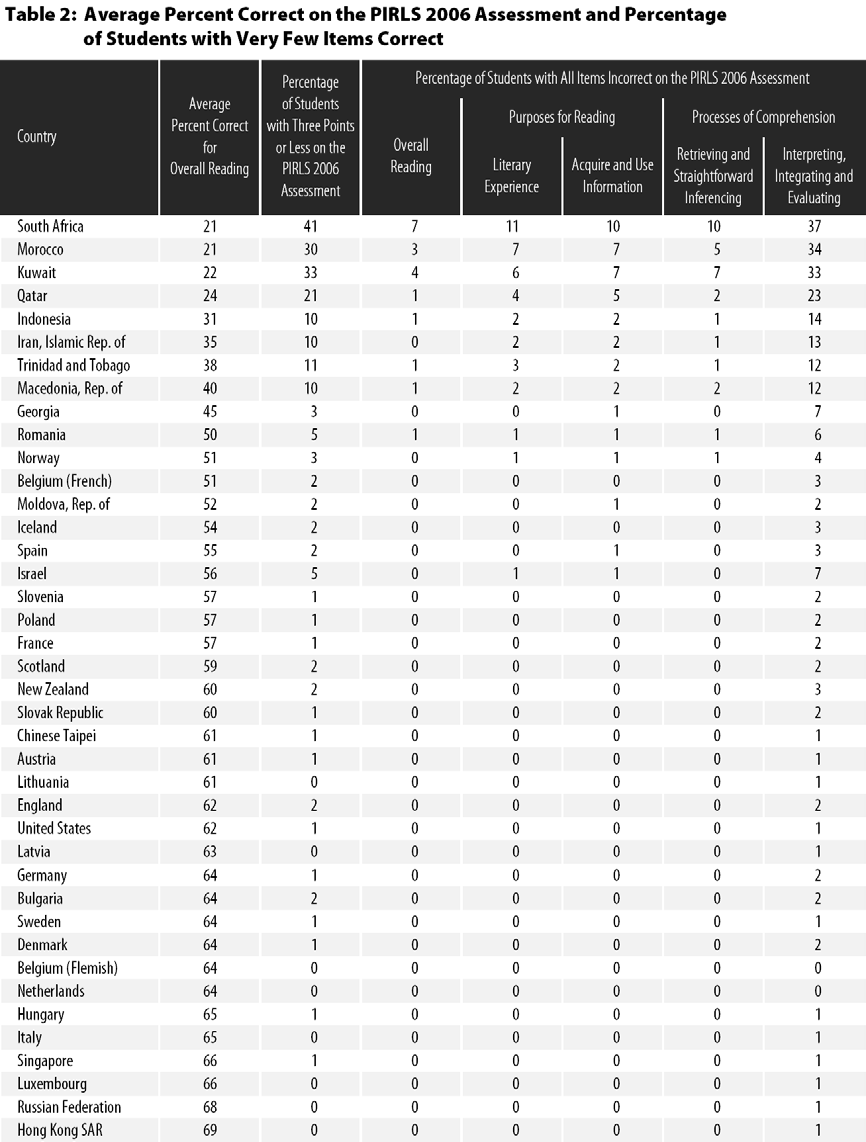
9 In a large scale assessment such as PIRLS, the presence of a floor effect in a country can lead to bias in reporting. If a substantial proportion of students are affected by the floor effect, there will be a substantial proportion of students whose achievement is overestimated, and including such students will lead to overestimation of the achievement distribution of the population as a whole. Monitoring trends over time is particularly problematic for a country experiencing a floor effect in its assessment. Educators and policy makers can work hard and make real strides in improving education from one assessment cycle to the next, yet not see evidence of this improvement in the assessment results. This can occur because overestimation at the earlier cycle can mask gains from actual improvement at the later cycle. If there are substantial numbers of students with very low scores in the earlier cycle, their achievement may be overestimated 4 and consequently the overall achievement distribution biased upwards. Following four or five years of sustained educational improvements, it could be expected that there would be proportionately fewer very low achievers at the next assessment cycle and therefore fewer students whose achievement has been overestimated. However, because the achievement distribution at the earlier cycle was overestimated to begin with, the difference between the two cycles would not be as big as it would have been if achievement at the earlier time had been estimated accurately. The apparently poor return for all of the effort could be very disheartening to those who worked so hard and could prove a disincentive to further investment and effort. Limits of Measurement for PIRLS Experience with PIRLS 2006 has shown that PIRLS at the fourth grade may not be a good match for countries with large proportions of very low achieving students. Although it is clear that the quality of measurement suffers when large proportions of students in a country struggle to answer even the most basic questions on the assessment, it is not clear that there is a particular achievement level below which measurement is not sufficiently reliable. To provide information about low performance on PIRLS, Table 2 lists each country that participated in PIRLS 2006 in descending order by average percent correct across all of the items in the assessment. As well as this global indicator of the relative difficulty of the assessment in each country, the table shows two other indicators of low performance. 4 Even though these students will have very low scores on the assessment, these low scores overestimate what the students would have scored on an assessment more suited to their achievement level. 9
10 The second column in Table 2 shows the percentage of students scoring three score points or less as an indicator of the proportion of students in a country likely to be unable to engage with the passages in the PIRLS assessment. That is, each student reads two passages, which on average offers a maximum of 33 score points. Taking 10 percent of the available points as a realistic estimate for a nonreader, such a student could expect to score 3 points on average on the two passages. As a further perspective on extremely low performance, Table 2 also presents the percentage of students with zero score points (i.e., did not respond correctly to any item), on the assessment overall as well as separately for reading purpose (literary and informational) and comprehension process (retrieval and straightforward inferencing; and interpreting, integrating, and evaluating). [Take in Table 2 about here] As mentioned earlier, all but the four lowest performing countries had average percent correct greater than 30 percent, so this may serve as a suitable minimum achievement target in considering whether PIRLS is a good match for the level of achievement in a country. As shown in Table 2, countries with achievement below this level have substantial percentages of students unable to engage with the PIRLS passages (i.e., scored three points or less on the assessment), ranging from 21 percent in Qatar to 41 percent in South Africa. As can be seen from the results of the IRT scaling discussed earlier, it can be a challenge to have reliable measurement with such high proportions of extremely low achievers. In terms of the more stringent criterion, the percentage of students with zero score points, the results for the overall assessment do not seem alarming at first glance, with South Africa having the highest proportion of such students at 7 percent. However, the figures for the assessment overall do not take into consideration some very large percentages for the interpreting, integrating, and evaluating comprehension process. These range from 23 percent in Qatar to 37 percent in South Africa. It was because of such very low performance that achievement results on this comprehension process were not reported for Qatar, Kuwait, Morocco, and South Africa in PIRLS Conclusion On the basis of the data presented in Table 2, it seems that an average percent correct of 30 percent is a useful minimum achievement target for countries considering administering PIRLS at the fourth grade. In particular, countries planning PIRLS participation for the first time in PIRLS 2011 and who are concerned that their students may not have reached the cognitive competencies of reading comprehension described in the PIRLS 2011 Framework (Mullis, Martin, Kennedy, Trong, & Sainsbury, 2009) should examine their field test results 10
11 very carefully. By being based on a series of extended texts dealing with somewhat complicated content, PIRLS is especially challenging for weaker readers. If students cannot persevere through the texts and the field test shows average achievement below the 30 percent correct level, there will not be sufficient response data for reliable estimates in the main assessment. Countries in this situation should consider the likely poor quality of the results and perhaps participate in PIRLS at a higher grade. Also, because IEA is dedicated to widespread participation, it has developed a companion reading comprehension assessment that is based on the PIRLS Framework and uses the same assessment approaches as PIRLS, but is less difficult called prepirls. Countries can participate in prepirls or both prepirls and PIRLS depending on their students capabilities as readers. The goal is to have the measurement match the capabilities of the students to maximize reliability and provide useful, informative results. References Foy, P., Galia, J., & Li, I. (2007). Scaling the PIRLS 2006 reading assessment data. In M.O. Martin, I.V.S. Mullis, & A.M. Kennedy (Eds.), PIRLS 2006 technical report. Chestnut Hill, MA: TIMSS & PIRLS International Study Center, Boston College. Mullis, I.V.S., Martin, M.O., Kennedy, A.M., Trong, K.L., & Sainsbury, M. (2009). PIRLS 2011 assessment framework. Chestnut Hill, MA: TIMSS & PIRLS International Study Center, Boston College. Mullis, I.V.S., Kennedy, A.M., Martin, M.O., & Sainsbury, M. (2006). PIRLS 2006 assessment framework and specifications. (2 nd ed.). Chestnut Hill, MA: TIMSS & PIRLS International Study Center, Boston College. Mullis, I.V.S., Martin, M.O., Kennedy, A.M., & Foy, P. (2007). PIRLS 2006 international report: IEA s progress in international reading literacy study in primary schools in 40 countries. Chestnut Hill, MA: TIMSS & PIRLS International Study Center, Boston College. 11
12
13
14
15
16
17
Chapter 1. International Student Achievement in Reading
 Chapter 1 International Student Achievement in Reading Hong Kong SAR, the Russian Federation, Finland, and Singapore were the top-performing countries in PIRLS 2011. Since 2001, ten countries have raised
TIMSS IEA s TIMSS 2003 International Report on Achievement in the Mathematics Cognitive Domains
 Ina V.S. Mullis Michael O. Martin Pierre Foy TIMSS IEA s TIMSS 2003 International Report on Achievement in the Mathematics s Findings from a Developmental Project International Association for the Evaluation
TIMSS 2011 User Guide for the International Database
 TIMSS 2011 User Guide for the International Database Edited by: Pierre Foy, Alka Arora, and Gabrielle M. Stanco TIMSS 2011 User Guide for the International Database Edited by: Pierre Foy, Alka Arora,
11. Quality Assurance Procedures
 Martin, M.O., Mullis, I.V.S., and Kelly, D.L. (1996) Quality Assurance Procedures in M.O. Martin and D.L. Kelly (eds.), Third International Mathematics and Science Study (TIMSS) Technical Report, Volume
Comparison of Research Designs Template
 Comparison of Comparison of The following seven tables provide an annotated template to guide you through the comparison of research designs assignment in this course. These tables help you organize your
TIMSS & PIRLS INTERNATIONAL STUDY CENTER, LYNCH SCHOOL OF EDUCATION, BOSTON COLLEGE
 172 TIMSS & PIRLS INTERNATIONAL STUDY CENTER, LYNCH SCHOOL OF EDUCATION, BOSTON COLLEGE Chapter 8 Creating and Checking the TIMSS 2003 Database Juliane Barth, Ralph Carstens, and Oliver Neuschmidt 8.1
Conn Valuation Services Ltd.
 CAPITALIZED EARNINGS VS. DISCOUNTED CASH FLOW: Which is the more accurate business valuation tool? By Richard R. Conn CMA, MBA, CPA, ABV, ERP Is the capitalized earnings 1 method or discounted cash flow
CALCULATIONS & STATISTICS
 CALCULATIONS & STATISTICS CALCULATION OF SCORES Conversion of 1-5 scale to 0-100 scores When you look at your report, you will notice that the scores are reported on a 0-100 scale, even though respondents
CRITICAL PATH ANALYSIS AND GANTT CHARTS
 CRITICAL PATH ANALYSIS AND GANTT CHARTS 1. An engineering project is modelled by the activity network shown in the figure above. The activities are represented by the arcs. The number in brackets on each
Astrid Roe. What has Norway done to improve students reading skills and reading engagement?
 Astrid Roe What has Norway done to improve students reading skills and reading engagement? A short presentation of the Norwegian school system Publicly funded comprehensive school system No selecting,
A s h o r t g u i d e t o s ta n d A r d i s e d t e s t s
 A short guide to standardised tests Copyright 2013 GL Assessment Limited Published by GL Assessment Limited 389 Chiswick High Road, 9th Floor East, London W4 4AL www.gl-assessment.co.uk GL Assessment is
Opportunity Document for STEP Literacy Assessment
 Opportunity Document for STEP Literacy Assessment Introduction Children, particularly in urban settings, begin school with a variety of strengths and challenges that impact their learning. Some arrive
Teacher Prep Student Performance Models - Six Core Principles
 Teacher preparation program student performance models: Six core design principles Just as the evaluation of teachers is evolving into a multifaceted assessment, so too is the evaluation of teacher preparation
Findings from IEA s Trends in International. and Ina V.S. Mullis
 Findings from IEA s Trends in International Edited by Alka Arora, Pierre Foy,Study MichaelatO. the Martin, Mathematics and Science Twelfth Grade and Ina V.S. Mullis Findings from IEA s Trends in International
Assessment Policy. 1 Introduction. 2 Background
 Assessment Policy 1 Introduction This document has been written by the National Foundation for Educational Research (NFER) to provide policy makers, researchers, teacher educators and practitioners with
TIMSS 1999. International Mathematics Report ISC
 TIMSS 1999 International Mathematics Report Findings from IEA s Repeat of the Third International Mathematics and Science Study at the Eighth Grade Ina V.S. Mullis Michael O. Martin Eugenio J. Gonzalez
Fairfield Public Schools
 Mathematics Fairfield Public Schools AP Statistics AP Statistics BOE Approved 04/08/2014 1 AP STATISTICS Critical Areas of Focus AP Statistics is a rigorous course that offers advanced students an opportunity
Depth-of-Knowledge Levels for Four Content Areas Norman L. Webb March 28, 2002. Reading (based on Wixson, 1999)
") Depth-of-Knowledge Levels for Four Content Areas Norman L. Webb March 28, 2002 Language Arts Levels of Depth of Knowledge Interpreting and assigning depth-of-knowledge levels to both objectives within
Depth-of-Knowledge Levels for Four Content Areas Norman L. Webb March 28, 2002 Language Arts Levels of Depth of Knowledge Interpreting and assigning depth-of-knowledge levels to both objectives within
Missing Data. A Typology Of Missing Data. Missing At Random Or Not Missing At Random
 [Leeuw, Edith D. de, and Joop Hox. (2008). Missing Data. Encyclopedia of Survey Research Methods. Retrieved from http://sage-ereference.com/survey/article_n298.html] Missing Data An important indicator
Determination of g using a spring
 INTRODUCTION UNIVERSITY OF SURREY DEPARTMENT OF PHYSICS Level 1 Laboratory: Introduction Experiment Determination of g using a spring This experiment is designed to get you confident in using the quantitative
Content of textbooks: one of the factors affecting fourth-grader science achievements in TIMSS. Andrejs Geske University of Latvia andrejs.geske@lu.
 Content of textbooks: one of the factors affecting fourth-grader science achievements in TIMSS Andrejs Geske University of Latvia andrejs.geske@lu.lv Rita Geske University of Latvia rita.geske@inbox.lv
Purposes and Processes of Reading Comprehension
 2 PIRLS Reading Purposes and Processes of Reading Comprehension PIRLS examines the processes of comprehension and the purposes for reading, however, they do not function in isolation from each other or
Poverty Indices: Checking for Robustness
 Chapter 5. Poverty Indices: Checking for Robustness Summary There are four main reasons why measures of poverty may not be robust. Sampling error occurs because measures of poverty are based on sample
Sample Size Issues for Conjoint Analysis
 Chapter 7 Sample Size Issues for Conjoint Analysis I m about to conduct a conjoint analysis study. How large a sample size do I need? What will be the margin of error of my estimates if I use a sample
Jack s Dyslexia Index indicates he has dyslexic difficulties that are mild in extent.
 Dyslexia Portfolio Report for Jack Jones Assessed by Sue Thompson on 05/08/2009 Report for parents When a child is identified as dyslexic, additional support will be needed from both school and home to
Statistics 2014 Scoring Guidelines
 AP Statistics 2014 Scoring Guidelines College Board, Advanced Placement Program, AP, AP Central, and the acorn logo are registered trademarks of the College Board. AP Central is the official online home
Fixed-Effect Versus Random-Effects Models
 CHAPTER 13 Fixed-Effect Versus Random-Effects Models Introduction Definition of a summary effect Estimating the summary effect Extreme effect size in a large study or a small study Confidence interval
Validity, Fairness, and Testing
 Validity, Fairness, and Testing Michael Kane Educational Testing Service Conference on Conversations on Validity Around the World Teachers College, New York March 2012 Unpublished Work Copyright 2010 by
Missing Data: Part 1 What to Do? Carol B. Thompson Johns Hopkins Biostatistics Center SON Brown Bag 3/20/13
 Missing Data: Part 1 What to Do? Carol B. Thompson Johns Hopkins Biostatistics Center SON Brown Bag 3/20/13 Overview Missingness and impact on statistical analysis Missing data assumptions/mechanisms Conventional
SENSITIVITY ANALYSIS AND INFERENCE. Lecture 12
 This work is licensed under a Creative Commons Attribution-NonCommercial-ShareAlike License. Your use of this material constitutes acceptance of that license and the conditions of use of materials on this
Chapter 6: The Information Function 129. CHAPTER 7 Test Calibration
 Chapter 6: The Information Function 129 CHAPTER 7 Test Calibration 130 Chapter 7: Test Calibration CHAPTER 7 Test Calibration For didactic purposes, all of the preceding chapters have assumed that the
Mathematics Cognitive Domains Framework: TIMSS 2003 Developmental Project Fourth and Eighth Grades
 Appendix A Mathematics Cognitive Domains Framework: TIMSS 2003 Developmental Project Fourth and Eighth Grades To respond correctly to TIMSS test items, students need to be familiar with the mathematics
Multiple Imputation for Missing Data: A Cautionary Tale
 Multiple Imputation for Missing Data: A Cautionary Tale Paul D. Allison University of Pennsylvania Address correspondence to Paul D. Allison, Sociology Department, University of Pennsylvania, 3718 Locust
CHI-SQUARE: TESTING FOR GOODNESS OF FIT
 CHI-SQUARE: TESTING FOR GOODNESS OF FIT In the previous chapter we discussed procedures for fitting a hypothesized function to a set of experimental data points. Such procedures involve minimizing a quantity
What are plausible values and why are they useful?
 What are plausible values and why are they useful? Matthias von Davier Educational Testing Service, Princeton, New Jersey, United States Eugenio Gonzalez Educational Testing Service, Princeton, New Jersey,
Problem of the Month: Fair Games
 Problem of the Month: The Problems of the Month (POM) are used in a variety of ways to promote problem solving and to foster the first standard of mathematical practice from the Common Core State Standards:
Accurately and Efficiently Measuring Individual Account Credit Risk On Existing Portfolios
 Accurately and Efficiently Measuring Individual Account Credit Risk On Existing Portfolios By: Michael Banasiak & By: Daniel Tantum, Ph.D. What Are Statistical Based Behavior Scoring Models And How Are
Measurement and Metrics Fundamentals. SE 350 Software Process & Product Quality
 Measurement and Metrics Fundamentals Lecture Objectives Provide some basic concepts of metrics Quality attribute metrics and measurements Reliability, validity, error Correlation and causation Discuss
How to Design and Interpret a Multiple-Choice-Question Test: A Probabilistic Approach*
 Int. J. Engng Ed. Vol. 22, No. 6, pp. 1281±1286, 2006 0949-149X/91 $3.00+0.00 Printed in Great Britain. # 2006 TEMPUS Publications. How to Design and Interpret a Multiple-Choice-Question Test: A Probabilistic
Test Bias. As we have seen, psychological tests can be well-conceived and well-constructed, but
 Test Bias As we have seen, psychological tests can be well-conceived and well-constructed, but none are perfect. The reliability of test scores can be compromised by random measurement error (unsystematic
Statistics. Measurement. Scales of Measurement 7/18/2012
 Statistics Measurement Measurement is defined as a set of rules for assigning numbers to represent objects, traits, attributes, or behaviors A variableis something that varies (eye color), a constant does
Grade Level Year Total Points Core Points % At Standard 9 2003 10 5 7 %
 Performance Assessment Task Number Towers Grade 9 The task challenges a student to demonstrate understanding of the concepts of algebraic properties and representations. A student must make sense of the
Q1. The graph below shows how a sinusoidal alternating voltage varies with time when connected across a resistor, R.
 Q1. The graph below shows how a sinusoidal alternating voltage varies with time when connected across a resistor, R. (a) (i) State the peak-to-peak voltage. peak-to-peak voltage...v (1) (ii) State the
Problem of the Month Pick a Pocket
 The Problems of the Month (POM) are used in a variety of ways to promote problem solving and to foster the first standard of mathematical practice from the Common Core State Standards: Make sense of problems
WHAT IS A JOURNAL CLUB?
 WHAT IS A JOURNAL CLUB? With its September 2002 issue, the American Journal of Critical Care debuts a new feature, the AJCC Journal Club. Each issue of the journal will now feature an AJCC Journal Club
Empirical Methods in Applied Economics
 Empirical Methods in Applied Economics Jörn-Ste en Pischke LSE October 2005 1 Observational Studies and Regression 1.1 Conditional Randomization Again When we discussed experiments, we discussed already
Confidence Intervals for One Standard Deviation Using Standard Deviation
 Chapter 640 Confidence Intervals for One Standard Deviation Using Standard Deviation Introduction This routine calculates the sample size necessary to achieve a specified interval width or distance from
Chapter 7. The Physics Curriculum in the Participating Countries
 Chapter 7 The Physics in the Participating Countries The physics assessment for TIMSS Advanced 2008 was developed according to a framework designed to reflect the physics studied around the world in science
INTRODUCTION TO MULTIPLE CORRELATION
 CHAPTER 13 INTRODUCTION TO MULTIPLE CORRELATION Chapter 12 introduced you to the concept of partialling and how partialling could assist you in better interpreting the relationship between two primary
10. Training Sessions for Free-Response Scoring and Administration of Performance Assessment
 Mullis, I.V.S., Jones, C., and Garden, R.A. (1996) Training Sessions for Free-Response Scoring and Administration of Performance Assessment in M.O. Martin and D.L. Kelly (eds.), Third International Mathematics
Directions for Administering the Graded Passages
 Directions for Administering the Graded Passages The versions (A D for grades 9 12; A and B for adult literacy students at grades 1 8) of Graded Passages are about different topics but similar in length
Translation and Translation Verification
 Translation and Translation Verification Alana Yu David Ebbs Introduction This chapter describes the procedures and activities related to countries preparation of national versions of the TIMSS and PIRLS
Chapter 5: Analysis of The National Education Longitudinal Study (NELS:88)
") Chapter 5: Analysis of The National Education Longitudinal Study (NELS:88) Introduction The National Educational Longitudinal Survey (NELS:88) followed students from 8 th grade in 1988 to 10 th grade in
Chapter 5: Analysis of The National Education Longitudinal Study (NELS:88) Introduction The National Educational Longitudinal Survey (NELS:88) followed students from 8 th grade in 1988 to 10 th grade in
FURTHER RESEARCH ON THE READING-STORAGE TEST AS A MEASURE OF GAIN DURING READING a. Ronald P. Carver b University of Missouri at Kansas City
 FURTHER RESEARCH ON THE READING-STORAGE TEST AS A MEASURE OF GAIN DURING READING a Ronald P. Carver b University of Missouri at Kansas City Abstract. The sensitivity of the reading-storage technique as
This chapter will demonstrate how to perform multiple linear regression with IBM SPSS
 CHAPTER 7B Multiple Regression: Statistical Methods Using IBM SPSS This chapter will demonstrate how to perform multiple linear regression with IBM SPSS first using the standard method and then using the
UNDERSTANDING THE TWO-WAY ANOVA
 UNDERSTANDING THE e have seen how the one-way ANOVA can be used to compare two or more sample means in studies involving a single independent variable. This can be extended to two independent variables
Descriptive Methods Ch. 6 and 7
 Descriptive Methods Ch. 6 and 7 Purpose of Descriptive Research Purely descriptive research describes the characteristics or behaviors of a given population in a systematic and accurate fashion. Correlational
Performance Assessment Task Baseball Players Grade 6. Common Core State Standards Math - Content Standards
 Performance Assessment Task Baseball Players Grade 6 The task challenges a student to demonstrate understanding of the measures of center the mean, median and range. A student must be able to use the measures
Suitable for: Beginners with absolutely no previous experience. Beginners who appear particularly shy or nervous.
 Lesson plan 1: CHORD STRUMMING FOR THE BEGINNER Suitable for: Beginners with absolutely no previous experience. Beginners who appear particularly shy or nervous. Prerequisites: None General Objective:
PRELIMINARY ITEM STATISTICS USING POINT-BISERIAL CORRELATION AND P-VALUES
 PRELIMINARY ITEM STATISTICS USING POINT-BISERIAL CORRELATION AND P-VALUES BY SEEMA VARMA, PH.D. EDUCATIONAL DATA SYSTEMS, INC. 15850 CONCORD CIRCLE, SUITE A MORGAN HILL CA 95037 WWW.EDDATA.COM Overview
How Not to Count the Poor? A Reply to Reddy and Pogge
 How Not to Count the Poor? A Reply to Reddy and Pogge Martin Ravallion 1 Reddy and Pogge (2002) claim that the World Bank has systematically underestimated the extent of poverty in the world in the 1990s,
Description of the Qualitative Reading Inventory-5
 1 Description Description of the Qualitative Reading Inventory-5 General Description of the Qualitative Reading Inventory-5 The Word Lists The Pre-Primer, Primer, First Grade, and Second Grade Third Grade
Solving Algebra and Other Story Problems with Simple Diagrams: a Method Demonstrated in Grade 4 6 Texts Used in Singapore
 The Mathematics Educator 2004, Vol. 14, No. 1, 42 46 Solving Algebra and Other Story Problems with Simple Diagrams: a Method Demonstrated in Grade 4 6 Texts Used in Singapore Sybilla Beckmann Out of the
SINGLE-SUPPLY OPERATION OF OPERATIONAL AMPLIFIERS
 SINGLE-SUPPLY OPERATION OF OPERATIONAL AMPLIFIERS One of the most common applications questions on operational amplifiers concerns operation from a single supply voltage. Can the model OPAxyz be operated
MRC Autism Research Forum Interventions in Autism
 MRC Autism Research Forum Interventions in Autism Date: 10 July 2003 Location: Aim: Commonwealth Institute, London The aim of the forum was to bring academics in relevant disciplines together, to discuss
MULTIPLE REGRESSION WITH CATEGORICAL DATA
 DEPARTMENT OF POLITICAL SCIENCE AND INTERNATIONAL RELATIONS Posc/Uapp 86 MULTIPLE REGRESSION WITH CATEGORICAL DATA I. AGENDA: A. Multiple regression with categorical variables. Coding schemes. Interpreting
Guide to Writing a Project Report
 Guide to Writing a Project Report The following notes provide a guideline to report writing, and more generally to writing a scientific article. Please take the time to read them carefully. Even if your
Hypothesis testing. c 2014, Jeffrey S. Simonoff 1
 Hypothesis testing So far, we ve talked about inference from the point of estimation. We ve tried to answer questions like What is a good estimate for a typical value? or How much variability is there
Statistics courses often teach the two-sample t-test, linear regression, and analysis of variance
 2 Making Connections: The Two-Sample t-test, Regression, and ANOVA In theory, there s no difference between theory and practice. In practice, there is. Yogi Berra 1 Statistics courses often teach the two-sample
INTERNATIONAL STANDARD ON AUDITING (UK AND IRELAND) 530 AUDIT SAMPLING AND OTHER MEANS OF TESTING CONTENTS
 530 AUDIT SAMPLING AND OTHER MEANS OF TESTING CONTENTS") INTERNATIONAL STANDARD ON AUDITING (UK AND IRELAND) 530 AUDIT SAMPLING AND OTHER MEANS OF TESTING CONTENTS Paragraph Introduction... 1-2 Definitions... 3-12 Audit Evidence... 13-17 Risk Considerations
INTERNATIONAL STANDARD ON AUDITING (UK AND IRELAND) 530 AUDIT SAMPLING AND OTHER MEANS OF TESTING CONTENTS Paragraph Introduction... 1-2 Definitions... 3-12 Audit Evidence... 13-17 Risk Considerations
Evaluating and Grading Student Work
 University of Southern California Center for Excellence in Teaching 1 We know that grades often cause anxiety for students. Receiving grades can be an emotional experience. While some students view it
Manufacturing Analytics: Uncovering Secrets on Your Factory Floor
 SIGHT MACHINE WHITE PAPER Manufacturing Analytics: Uncovering Secrets on Your Factory Floor Quick Take For manufacturers, operational insight is often masked by mountains of process and part data flowing
Do Commodity Price Spikes Cause Long-Term Inflation?
 No. 11-1 Do Commodity Price Spikes Cause Long-Term Inflation? Geoffrey M.B. Tootell Abstract: This public policy brief examines the relationship between trend inflation and commodity price increases and
"Statistical methods are objective methods by which group trends are abstracted from observations on many separate individuals." 1
 BASIC STATISTICAL THEORY / 3 CHAPTER ONE BASIC STATISTICAL THEORY "Statistical methods are objective methods by which group trends are abstracted from observations on many separate individuals." 1 Medicine
Differentiating Mobile Service Plans Through Consumer Value Metrics
 Introduction Mobile operators face an existential crisis: how to differentiate their brands and make their offers stand out in a marketplace that is increasingly crowded with similar plans. There are several
CONTENTS OF DAY 2. II. Why Random Sampling is Important 9 A myth, an urban legend, and the real reason NOTES FOR SUMMER STATISTICS INSTITUTE COURSE
 1 2 CONTENTS OF DAY 2 I. More Precise Definition of Simple Random Sample 3 Connection with independent random variables 3 Problems with small populations 8 II. Why Random Sampling is Important 9 A myth,
EFFECTIVE STRATEGIC PLANNING IN MODERN INFORMATION AGE ORGANIZATIONS
 EFFECTIVE STRATEGIC PLANNING IN MODERN INFORMATION AGE ORGANIZATIONS Cezar Vasilescu and Aura Codreanu Abstract: The field of strategic management has offered a variety of frameworks and concepts during
APPENDIX N. Data Validation Using Data Descriptors
 APPENDIX N Data Validation Using Data Descriptors Data validation is often defined by six data descriptors: 1) reports to decision maker 2) documentation 3) data sources 4) analytical method and detection
CHAPTER THREE COMMON DESCRIPTIVE STATISTICS COMMON DESCRIPTIVE STATISTICS / 13
 COMMON DESCRIPTIVE STATISTICS / 13 CHAPTER THREE COMMON DESCRIPTIVE STATISTICS The analysis of data begins with descriptive statistics such as the mean, median, mode, range, standard deviation, variance,
Credit Card Market Study Interim Report: Annex 4 Switching Analysis
 MS14/6.2: Annex 4 Market Study Interim Report: Annex 4 November 2015 This annex describes data analysis we carried out to improve our understanding of switching and shopping around behaviour in the UK
Imputing Missing Data using SAS
 ABSTRACT Paper 3295-2015 Imputing Missing Data using SAS Christopher Yim, California Polytechnic State University, San Luis Obispo Missing data is an unfortunate reality of statistics. However, there are
Review Jeopardy. Blue vs. Orange. Review Jeopardy
 Review Jeopardy Blue vs. Orange Review Jeopardy Jeopardy Round Lectures 0-3 Jeopardy Round $200 How could I measure how far apart (i.e. how different) two observations, y 1 and y 2, are from each other?
The Science and Art of Market Segmentation Using PROC FASTCLUS Mark E. Thompson, Forefront Economics Inc, Beaverton, Oregon
 The Science and Art of Market Segmentation Using PROC FASTCLUS Mark E. Thompson, Forefront Economics Inc, Beaverton, Oregon ABSTRACT Effective business development strategies often begin with market segmentation,
C A R I B B E A N E X A M I N A T I O N S C O U N C I L REPORT ON CANDIDATES WORK IN THE SECONDARY EDUCATION CERTIFICATE EXAMINATION MAY/JUNE 2011
 C A R I B B E A N E X A M I N A T I O N S C O U N C I L REPORT ON CANDIDATES WORK IN THE SECONDARY EDUCATION CERTIFICATE EXAMINATION MAY/JUNE 2011 ECONOMICS GENERAL PROFICIENCY EXAMINATION Copyright 2011
Considering the effects of UPS operation with leading power factor loads
 Considering the effects of UPS operation with leading power factor loads Over the past five years, a new generation of data processing and communications equipment has become prevalent in modern data centers
Strategic Program Management
 Governance Assessment Organizational Change Management Strategic Program Management Continuous Improvement Framework Processes Strategy Strategic Program Management Bob Prieto Published by Construction
oxford english testing.com
 oxford english testing.com The Oxford Online Placement Test: The Meaning of OOPT Scores Introduction oxford english testing.com The Oxford Online Placement Test is a tool designed to measure test takers
3.7 USING AN ACTIVE-LEARNING QUIZ SERIES IN AN INTRODUCTORY METEOROLOGY COLLEGE COURSE
 3.7 USING AN ACTIVE-LEARNING QUIZ SERIES IN AN INTRODUCTORY METEOROLOGY COLLEGE COURSE Neil F. Laird 1, Laura A. Golson 1, Kathryn E. Wood 1, and Karen Feasel 2 1 Department of Geoscience, Hobart & William
Systematic reviews and meta-analysis
 Evidence-Based Medicine And Healthcare Singapore Med J 2005 Vol 46(6) : 270 CME Article Systematic reviews and meta-analysis S Green ABSTRACT Systematic reviews form a potential method for overcoming the
The Effect of Dropping a Ball from Different Heights on the Number of Times the Ball Bounces
 The Effect of Dropping a Ball from Different Heights on the Number of Times the Ball Bounces Or: How I Learned to Stop Worrying and Love the Ball Comment [DP1]: Titles, headings, and figure/table captions
Student Performance Q&A:
 Student Performance Q&A: 2008 AP Calculus AB and Calculus BC Free-Response Questions The following comments on the 2008 free-response questions for AP Calculus AB and Calculus BC were written by the Chief
MANAGEMENT OPTIONS AND VALUE PER SHARE
 1 MANAGEMENT OPTIONS AND VALUE PER SHARE Once you have valued the equity in a firm, it may appear to be a relatively simple exercise to estimate the value per share. All it seems you need to do is divide
Market Simulators for Conjoint Analysis
 Chapter 10 Market Simulators for Conjoint Analysis The market simulator is usually considered the most important tool resulting from a conjoint analysis project. The simulator is used to convert raw conjoint
SUCCESSFUL EXECUTION OF PRODUCT DEVELOPMENT PROJECTS: THE EFFECTS OF PROJECT MANAGEMENT FORMALITY, AUTONOMY AND RESOURCE FLEXIBILITY
 SUCCESSFUL EXECUTION OF PRODUCT DEVELOPMENT PROJECTS: THE EFFECTS OF PROJECT MANAGEMENT FORMALITY, AUTONOMY AND RESOURCE FLEXIBILITY MOHAN V. TATIKONDA Kenan-Flagler Business School University of North
MEASURE A REVIEW OF OUTCOMES OF SCHOOL EDUCATION IN AUSTRALIA. John Ainley Eveline Gebhardt. Australian Council for Educational Research
 MEASURE MEASURE A REVIEW OF OUTCOMES OF SCHOOL EDUCATION IN AUSTRALIA John Ainley Eveline Gebhardt Australian Council for Educational Research MEASURE MEASURE A REVIEW OF OUTCOMES OF SCHOOL EDUCATION IN
Partial Estimates of Reliability: Parallel Form Reliability in the Key Stage 2 Science Tests
 Partial Estimates of Reliability: Parallel Form Reliability in the Key Stage 2 Science Tests Final Report Sarah Maughan Ben Styles Yin Lin Catherine Kirkup September 29 Partial Estimates of Reliability:
Unit 1 Number Sense. In this unit, students will study repeating decimals, percents, fractions, decimals, and proportions.
 Unit 1 Number Sense In this unit, students will study repeating decimals, percents, fractions, decimals, and proportions. BLM Three Types of Percent Problems (p L-34) is a summary BLM for the material
WMS III to WMS IV: Rationale for Change
 Pearson Clinical Assessment 19500 Bulverde Rd San Antonio, TX, 28759 Telephone: 800 627 7271 www.pearsonassessments.com WMS III to WMS IV: Rationale for Change Since the publication of the Wechsler Memory