ANTARCTIC IN THE NEWS THE REAL STORY. By Joseph D Aleo, CCM
|
|
|
- Lee Chapman
- 7 years ago
- Views:
Transcription
1 ANTARCTIC IN THE NEWS THE REAL STORY By Joseph D Aleo, CCM As seems to always be the case, the news media have completely misled the public once again regarding climate related issues, this time by alleging claims of 4 meter high future sea level rise increases, supposedly addressed in two recent studies which performed analysis of glacier melt behavior of six large glaciers in West Antarctica. Scientists who believe in global warming have long been perplexed why Antarctica was not experiencing the melting the arctic has experienced (which dependably repeats in 60 year cycles). So they have been searching for the holy grail with a heavy dose of confirmation bias. One study was published in Geophysical Research Letters (GRL) and titled Sustained increase in ice discharge from the Amundsen Sea Embayment, West Antarctica, from 1973 to This study is available here: The second study was published in Science and titled Marine Ice Sheet Collapse Potentially Under Way for the Thwaites Glacier Basin, West Antarctica. This study is available here: Both studies evaluate the relatively recent melt rate history of these glaciers with one focusing on the use observed satellite data to estimate melt rate behavior while the other uses computer models to estimate melt rate behavior. Amazingly enough and considering how the press manufactured headlines about sea level rise increases being determined from these studies neither of the studies addresses or make any claims about the impact of their research results on specific future sea level rise projections. In fact GLC study mentions nothing specific about future sea level rise projections while the Science study clearly notes that their research models are not coupled to a global climate model to provide forcing nor do they include an ice-shelf cavity-circulation model to derive melt rates. Few if any such fully coupled models presently exist (13). As such, our simulations do not constitute a projection of future sea level in response to projected climate forcing. Also unreported by the same climate alarmist propaganda focused media were the significant qualifications, limitations and cautions noted in these studies concerning their glacier melt research findings.
2 The GRL published study noted for example the following qualifiers regarding its analysis: These observations are a possible sign of the progressive collapse of this sector in response to the high melting of its buttressing ice shelves by the ocean. Until numerical ice sheet models coupled with realistic oceanic forcing are able to replicate these observations, projections of the evolution of this sector of West Antarctica should be interpreted with caution. The Science published study contained the following similarly related qualifiers regarding its analysis: Although our simple melt parameterization suggests that a full-scale collapse of this sector may be inevitable, it leaves large uncertainty in the timing. Thus, icesheet models fully coupled to ocean/climate models are required to reduce the uncertainty in the chronology of a collapse. New York Times article by Justin Gillis 0n May 12, 2014 similarly has taken as gospel these new carefully choreographed releases. The collapse of large parts of the ice sheet in West Antarctica appears to have begun and is almost certainly unstoppable, with global warming accelerating the pace of the disintegration, two groups of scientists reported Monday. The finding, which had been feared by some scientists for decades, means that a rise in global sea level of at least 10 feet may now be inevitable. The rise may continue to be relatively slow for at least the next century or so, the scientists said, but sometime after that it will probably speed up so sharply as to become a crisis. The Pollard and Rignot quotes in the NYT article say: Over all, the loss of the West Antarctic ice from warming is appearing more likely a definite thing to worry about on a thousand-year time scale but not a hundred years, Dr. Pollard said. [Rignot] said. It happened many times before when the Earth was as warm as it is about to be. Note the words more likely a definite thing and as warm as it is about to be. So this is all speculation. Little attention was given to these another recent story: National Geographic 10 December 2013 New Record for Coldest Place on Earth, in Antarctica Scientists measure lowest temperature on Earth via satellites.
3 Using new satellite data, scientists have measured the most frigid temperature ever recorded on the continent s eastern highlands: about -136 F (-93 C) colder than dry ice.. Nor these papers: Abstract 7 JUN 2013 Recent snowfall anomalies in Dronning Maud Land, East Antarctica, in a historical and future climate perspective Enhanced snowfall on the East Antarctic ice sheet is projected to significantly mitigate 21st century global sea level rise. In recent years (2009 and 2011), regionally extreme snowfall anomalies in Dronning Maud Land, in the Atlantic sector of East Antarctica, have been observed. It has been unclear, however, whether these anomalies can be ascribed to natural decadal variability, or whether they could signal the beginning of a long-term increase of snowfall. Here we use output of a regional atmospheric climate model, evaluated with available firn core records and gravimetry observations, and show that such episodes had not been seen previously in the satellite climate data era (1979). Comparisons with historical data that originate from firn cores, one with records extending back to the 18th century, confirm that accumulation anomalies of this scale have not occurred in the past ~60 years, although comparable anomalies are found further back in time. We examined several regional climate model projections, describing various warming scenarios into the 21st century. Anomalies with magnitudes similar to the recently observed ones were not present in the model output for the current climate, but were found increasingly probable toward the end of the 21st century. Abstract 2 NOV 2012 An improved understanding of processes dominating the sensitive balance between mass loss primarily due to glacial discharge and mass gain through precipitation is essential for determining the future behavior of the Antarctic ice sheet and its contribution to sea level rise. While satellite observations of Antarctica indicate that West Antarctica experiences dramatic mass loss along the Antarctic Peninsula and Pine Island Glacier, East Antarctica has remained comparably stable. In this study, we describe the causes and magnitude of recent extreme precipitation events along the East Antarctic coast that led to significant regional mass accumulations that partially compensate for some of the recent global ice mass losses that contribute to global sea level rise. The gain of almost350 Gt from 2009 to 2011 is equivalent to a decrease in global mean sea level at a rate of 0.32 mm/yr over this three-year period.
4 Also in the last decade of the nineteenth century, between 1892 and 1897, there occurred an enormous outburst of ice from the Antarctic, which filled the Southern Ocean with ice floes and icebergs to such an extent that traffic between South America, Africa, and Australia had to seek a more northerly track. This outburst had far-reaching climatic repercussions. The monsoon regimen of the Indian Ocean was profoundly disturbed In upwards of 6,500,000 people were on famine relief for several months. The loss of cattle was great, running into many millions. 1 But the biggest sin is ignoring the data WHAT S REALLY HAPPENING Antarctic sea ice has expanded to record levels for April, increasing by more than 110,000 square kilometers a day last month to nine million square kilometers. The National Snow and Ice Data Centre said the rapid expansion had continued into May and the seasonal cover was now bigger than the record by a significant margin This exceeds the past record for the satellite era by about 320,000 sq km, which was set in April 2008, the Centre said.
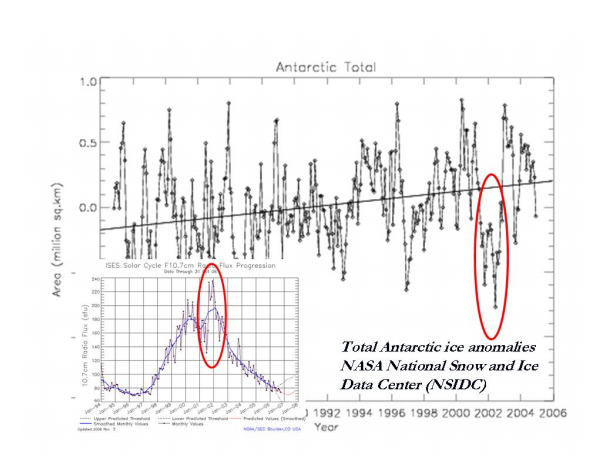
5 The southern hemisphere sea ice flowing off of Antarctica has been increasing since 1979.The anomalies peaked in 2008, and This year could break that record. Satellites show the temperatures have ben declining there since 1979.

6 The data that looks into the southern polar region from satellite shows no warming (a very slight cooling) since They only look as far as 80S. When we look at the South Pole plots rom NASA GISS for summer and winter we find cooling too. The coldest winter was 2004, summer 2000.

7

8 Also note sea level rises have slowed almost 50% since the early 1900s (now about 4 inches down from 7 inches). Antarctic ice has been increasing since As the growing glaciers spill out off the land into the sea, they melt in summer. And by the way floating ice, doesn t raise sea level when it melts, any more than ice cubes in a drink don t cause the glass to overflow when the ice melts. Huybrechts (2009) states that the amount of nearby ocean warming required to generate enough sub-ice-shelf melting to initiate a significant retreat of the West Antarctic ice sheet...may well take several centuries to develop. And once started, he says that the transition time for a total collapse of the West Antarctic ice sheet would range from one thousand to several thousand years, which time period, in his words, is nowhere near the century timescales for West Antarctic ice-sheet decay based on simple marine ice-sheet models, such as have been employed in the past. Huybrechts, P West-side story of Antarctic ice. Nature 458: THE 2001/02 SCARE

9 The story they forgot back in 2001/02, the world s attention was called to the break up of the Ross Ice Sheet. The media said that was the end of that sheet and the start of major Antarctic ice melt. That break up was due to strong ultraviolet radiation, which caused warming of the high atmosphere through ozone chemistry in low and middle latitudes with dynamical and radiative coupling down into the troposphere. This caused a shrinking of the polar vortices in both hemispheres and a temporary break up of the southern polar vortex into two centers for a time. Changes in the circulation likely resulted in the break up of the ice, but it quickly returned.
10
Temporal variation in snow cover over sea ice in Antarctica using AMSR-E data product
 Temporal variation in snow cover over sea ice in Antarctica using AMSR-E data product Michael J. Lewis Ph.D. Student, Department of Earth and Environmental Science University of Texas at San Antonio ABSTRACT
Data Sets of Climate Science
 The 5 Most Important Data Sets of Climate Science Photo: S. Rahmstorf This presentation was prepared on the occasion of the Arctic Expedition for Climate Action, July 2008. Author: Stefan Rahmstorf, Professor
Future needs of remote sensing science in Antarctica and the Southern Ocean: A report to support the Horizon Scan activity of COMNAP and SCAR
 Future needs of remote sensing science in Antarctica and the Southern Ocean: A report to support the Horizon Scan activity of COMNAP and SCAR Thomas Wagner (thomas.wagner@nasa.gov) Charles Webb NASA Cryospheric
climate science A SHORT GUIDE TO This is a short summary of a detailed discussion of climate change science.
 A SHORT GUIDE TO climate science This is a short summary of a detailed discussion of climate change science. For more information and to view the full report, visit royalsociety.org/policy/climate-change
The Polar Climate Zones
 The Polar Climate Zones How cold is it in the polar climate? Polar areas are the coldest of all the major climate zones The Sun is hardly ever high enough in the sky to cause the plentiful ice to melt,
Jessica Blunden, Ph.D., Scientist, ERT Inc., Climate Monitoring Branch, NOAA s National Climatic Data Center
 Kathryn Sullivan, Ph.D, Acting Under Secretary of Commerce for Oceans and Atmosphere and NOAA Administrator Thomas R. Karl, L.H.D., Director,, and Chair of the Subcommittee on Global Change Research Jessica
Graphing Sea Ice Extent in the Arctic and Antarctic
 Graphing Sea Ice Extent in the Arctic and Antarctic Summary: Students graph sea ice extent (area) in both polar regions (Arctic and Antarctic) over a three-year period to learn about seasonal variations
A Few Facts about Antarctica
 A Few Facts about Antarctica Antarctica is the continent that surrounds the South Pole, the southernmost point at the bottom of the earth. Antarctica is a continent because it is land that is covered by
The Ice Age By: Sue Peterson
 www.k5learning.com Objective sight words (pulses, intermittent, isotopes, chronicle, methane, tectonic plates, volcanism, configurations, land-locked, erratic); concepts (geological evidence and specific
How Do Oceans Affect Weather and Climate?
 How Do Oceans Affect Weather and Climate? In Learning Set 2, you explored how water heats up more slowly than land and also cools off more slowly than land. Weather is caused by events in the atmosphere.
Climate Change is Underway Lesson Plan
 Climate Change is Underway Lesson Plan For Teachers: The following is a lesson plan designed to be used with section of the Climate Change material entitled Climate Change is Underway from the After Earth
What Causes Climate? Use Target Reading Skills
 Climate and Climate Change Name Date Class Climate and Climate Change Guided Reading and Study What Causes Climate? This section describes factors that determine climate, or the average weather conditions
The Oceans Role in Climate
 The Oceans Role in Climate Martin H. Visbeck A Numerical Portrait of the Oceans The oceans of the world cover nearly seventy percent of its surface. The largest is the Pacific, which contains fifty percent
Chapter Overview. Seasons. Earth s Seasons. Distribution of Solar Energy. Solar Energy on Earth. CHAPTER 6 Air-Sea Interaction
 Chapter Overview CHAPTER 6 Air-Sea Interaction The atmosphere and the ocean are one independent system. Earth has seasons because of the tilt on its axis. There are three major wind belts in each hemisphere.
Orbital-Scale Climate Change
 Orbital-Scale Climate Change Climate Needed for Ice Age Warm winter and non-frozen oceans so lots of evaporation and snowfall Cool summer so that ice does not melt Ice Age Model When ice growing ocean
FACTS ABOUT CLIMATE CHANGE
 FACTS ABOUT CLIMATE CHANGE 1. What is climate change? Climate change is a long-term shift in the climate of a specific location, region or planet. The shift is measured by changes in features associated
SOUTHERN OCEAN CURRENTS. http://www.polar.org/antsun/oldissues2002-2003/sun121502/current.html
 Map from: SOUTHERN OCEAN CURRENTS http://www.polar.org/antsun/oldissues2002-2003/sun121502/current.html FROM: The Antarctic Coastal Current Joanna Gyory, John Cangialosi, Ieng Jo, Arthur J. Mariano, Edward
The Antarctic Ice Sheet and Global Warming - 2005
 6th Annual S.T. Lee Lecture in Antarctic Studies INTRODUCTION and WELCOME Professor Pat Walsh Vice-Chancellor Victoria University of Wellington S. T. LEE LECTURE Through a Crevasse Darkly: An Update on
GETTING TO THE CORE: THE LINK BETWEEN TEMPERATURE AND CARBON DIOXIDE
 DESCRIPTION This lesson plan gives students first-hand experience in analyzing the link between atmospheric temperatures and carbon dioxide ( ) s by looking at ice core data spanning hundreds of thousands
ARI: The water-mass signature and pathways of Greenland Ice Sheet meltwater in the Arctic and North Atlantic as inferred by an inverse method
 Final Report ARI: The water-mass signature and pathways of Greenland Ice Sheet meltwater in the Arctic and North Atlantic as inferred by an inverse method Geoffrey Gebbie Department of Physical Oceanography
Teacher s Guide For. Glaciers and Ice Caps The Melting
 Teacher s Guide For Glaciers and Ice Caps The Melting For grade 7 - College Program produced by Centre Communications, Inc. for Ambrose Video Publishing, Inc. Executive Producer William V. Ambrose Teacher's
CHAPTER 5 Lectures 10 & 11 Air Temperature and Air Temperature Cycles
 CHAPTER 5 Lectures 10 & 11 Air Temperature and Air Temperature Cycles I. Air Temperature: Five important factors influence air temperature: A. Insolation B. Latitude C. Surface types D. Coastal vs. interior
Antarctic Temperature and Sea Ice Trends over the Last Century
 Antarctic Temperature and Sea Ice Trends over the Last Century High latitude regions of the Earth (the Arctic and Antarctic) have been considered as bellwethers in the detection of global climate change.
Southern AER Atmospheric Education Resource
 Southern AER Atmospheric Education Resource Vol. 9 No. 5 Spring 2003 Editor: Lauren Bell In this issue: g Climate Creations exploring mother nature s remote control for weather and Climate. g Crazy Climate
Geography affects climate.
 KEY CONCEPT Climate is a long-term weather pattern. BEFORE, you learned The Sun s energy heats Earth s surface unevenly The atmosphere s temperature changes with altitude Oceans affect wind flow NOW, you
Therefore, this is a very important question, which encourages consideration of the current management of the resource.
 Aalisarnermut, Piniarnermut Nunalerinermullu Naalakkersuisoqarfik Department of Fisheries, Hunting and Agriculture Finn's speech to NAFMC Climate change in the North Atlantic has become a reality which
The Water Cycle Now You See It, Now You Don t
 The Water Cycle Now You See It, Now You Don t Unit: Salinity Patterns & the Water Cycle l Grade Level: Elementary l Time Required: Introduction - 30 min. - Activity as groups 45min Wrap Up 20 min l Content
6.4 Taigas and Tundras
 6.4 Taigas and Tundras In this section, you will learn about the largest and coldest biomes on Earth. The taiga is the largest land biome and the tundra is the coldest. The taiga The largest land biome
Antarctica s Pine Island Glacier:
 Keywords: Climate Change at www.scilinks.org Enter code: TST101301 Antarctica s Pine Island Glacier: A Climate Canary? Using atmospheric and oceanic processes and the poles to teach the climate system
Mapping of Antarctic sea ice in the depletion phase: an indicator of climatic change?
 Mapping of Antarctic sea ice in the depletion phase: an indicator of climatic change? G. Sreenivasan 1 and T. J. Majumdar 2, * 1 Regional Remote Sensing Service Centre, Nagpur 440 010, India 2 Space Applications
7613-1 - Page 1. Weather Unit Exam Pre-Test Questions
 Weather Unit Exam Pre-Test Questions 7613-1 - Page 1 Name: 1) Equal quantities of water are placed in four uncovered containers with different shapes and left on a table at room temperature. From which
James Hansen, Reto Ruedy, Makiko Sato, Ken Lo
 If It s That Warm, How Come It s So Damned Cold? James Hansen, Reto Ruedy, Makiko Sato, Ken Lo The past year, 2009, tied as the second warmest year in the 130 years of global instrumental temperature records,
Tide - rhythmic oscillation of the ocean surface due to gravitational & centrifugal forces ( inertia ) between the Earth, Moon and Sun.
 between the Earth, Moon and Sun.") Chapter 4: The Changing Level of the Sea Tides Longer Scale Variations Influence on Beaches Tide - rhythmic oscillation of the ocean surface due to gravitational & centrifugal forces ( inertia ) between
Chapter 4: The Changing Level of the Sea Tides Longer Scale Variations Influence on Beaches Tide - rhythmic oscillation of the ocean surface due to gravitational & centrifugal forces ( inertia ) between
SPATIAL DISTRIBUTION OF NORTHERN HEMISPHERE WINTER TEMPERATURES OVER THE SOLAR CYCLE DURING THE LAST 130 YEARS
 SPATIAL DISTRIBUTION OF NORTHERN HEMISPHERE WINTER TEMPERATURES OVER THE SOLAR CYCLE DURING THE LAST 130 YEARS Kalevi Mursula, Ville Maliniemi, Timo Asikainen ReSoLVE Centre of Excellence Department of
ENVIRONMENTAL STRUCTURE AND FUNCTION: CLIMATE SYSTEM Vol. II - Low-Latitude Climate Zones and Climate Types - E.I. Khlebnikova
 LOW-LATITUDE CLIMATE ZONES AND CLIMATE TYPES E.I. Khlebnikova Main Geophysical Observatory, St. Petersburg, Russia Keywords: equatorial continental climate, ITCZ, subequatorial continental (equatorial
CLIMATE, WATER & LIVING PATTERNS THINGS
 CLIMATE, WATER & LIVING PATTERNS NAME THE SIX MAJOR CLIMATE REGIONS DESCRIBE EACH CLIMATE REGION TELL THE FIVE FACTORS THAT AFFECT CLIMATE EXPLAIN HOW THOSE FACTORS AFFECT CLIMATE DESCRIBE HOW CLIMATES
Projections of sea level rise
 Projections of sea level rise Jonathan Gregory Lead author, Chapter 13, Sea level change Yann Arthus-Bertrand / Altitude Causes of global mean sea level rise (GMSLR) Global mean sea level rise is caused
Temporal and spatial evolution of the Antarctic sea ice prior to the September 2012 record maximum extent
 GEOPHYSICAL RESEARCH LETTERS, VOL. 40, 5894 5898, doi:10.1002/2013gl058371, 2013 Temporal and spatial evolution of the Antarctic sea ice prior to the September 2012 record maximum extent John Turner, 1
Chapter 3: Climate and Climate Change Answers
 Chapter 3: Climate and Climate Change Answers Section A: Climate 1. (a) Explain what each of the following means: (4 x 1 mark) (i) climate the average weather of an area over a 25 30 year period (ii) maritime
Climates are described by the same conditions used to describe
 58 The Causes of Climate R E A D I N G Climates are described by the same conditions used to describe weather, such as temperature, precipitation, and wind. You now know that oceans have an important effect
Radiative effects of clouds, ice sheet and sea ice in the Antarctic
 Snow and fee Covers: Interactions with the Atmosphere and Ecosystems (Proceedings of Yokohama Symposia J2 and J5, July 1993). IAHS Publ. no. 223, 1994. 29 Radiative effects of clouds, ice sheet and sea
List 10 different words to describe the weather in the box, below.
 Weather and Climate Lesson 1 Web Quest: What is the Weather? List 10 different words to describe the weather in the box, below. How do we measure the weather? Use this web link to help you: http://www.bbc.co.uk/weather/weatherwise/activities/weatherstation/
Lecture 4: Pressure and Wind
 Lecture 4: Pressure and Wind Pressure, Measurement, Distribution Forces Affect Wind Geostrophic Balance Winds in Upper Atmosphere Near-Surface Winds Hydrostatic Balance (why the sky isn t falling!) Thermal
How To Predict Climate Change
 A changing climate leads to changes in extreme weather and climate events the focus of Chapter 3 Presented by: David R. Easterling Chapter 3:Changes in Climate Extremes & their Impacts on the Natural Physical
6 th Grade Science Assessment: Weather & Water Select the best answer on the answer sheet. Please do not make any marks on this test.
 Select the be answer on the answer sheet. Please do not make any marks on this te. 1. Weather is be defined as the A. changes that occur in cloud formations from day to day. B. amount of rain or snow that
FIRST GRADE 1 WEEK LESSON PLANS AND ACTIVITIES
 FIRST GRADE 1 WEEK LESSON PLANS AND ACTIVITIES UNIVERSE CYCLE OVERVIEW OF FIRST GRADE UNIVERSE WEEK 1. PRE: Describing the Universe. LAB: Comparing and contrasting bodies that reflect light. POST: Exploring
Impacts of Global Warming on Polar Ecosystems
 Impacts of Global Warming on Polar Ecosystems Carlos M. Duarte (ed.) Offprint of Chapter INTRODUCTION: GLOBAL WARMING AND POLAR ECOSYSTEMS by Carlos M. Duarte Mediterranean Institute for Advanced Studies
Atmospheric Dynamics of Venus and Earth. Institute of Geophysics and Planetary Physics UCLA 2 Lawrence Livermore National Laboratory
 Atmospheric Dynamics of Venus and Earth G. Schubert 1 and C. Covey 2 1 Department of Earth and Space Sciences Institute of Geophysics and Planetary Physics UCLA 2 Lawrence Livermore National Laboratory
Sea level scenarios and extreme weather events
 Extreme weather and nuclear power plants (EXWE) Sea level scenarios and extreme weather events Milla Johansson, Kimmo Kahma, Hilkka Pellikka, Hanna Tietäväinen, Seppo Saku and Kirsti Jylhä Finnish Meteorological
II. Related Activities
 (1) Global Cloud Resolving Model Simulations toward Numerical Weather Forecasting in the Tropics (FY2005-2010) (2) Scale Interaction and Large-Scale Variation of the Ocean Circulation (FY2006-2011) (3)
The Science and Ethics of Global warming. Global warming has become one of the central political and scientific issues of
 The Science and Ethics of Global warming Global warming has become one of the central political and scientific issues of our time. It holds a fascination for scientists because of the tremendous complexity
Ms Chairman and distinguished guests,
 Ms Chairman and distinguished guests, On behalf of the Ministry of the Environment, I am honored to open this conference that brings together scientists, policymakers and civil society from the Barents
Chapter 3 Communities, Biomes, and Ecosystems
 Communities, Biomes, and Ecosystems Section 1: Community Ecology Section 2: Terrestrial Biomes Section 3: Aquatic Ecosystems Click on a lesson name to select. 3.1 Community Ecology Communities A biological
FRENCH ARCTIC INITIATIVE SCIENTIFIC PRIORITIES
 FRENCH ARCTIC INITIATIVE SCIENTIFIC PRIORITIES J.J. Pangrazi / Biosphoto J.J. Pangrazi / Biosphoto Conference audience Edouard Bard introductory lecture Dr. Denis-Didier Rousseau (CNRS Senior Research
Climate Control and Ozone Depletion. Chapter 19
 Climate Control and Ozone Depletion Chapter 19 Global Warming and Global Cooling Are Not New Over the past 4.5 billion years the climate has been altered by Volcanic emissions Changes in solar input Movement
Queensland rainfall past, present and future
 Queensland rainfall past, present and future Historically, Queensland has had a variable climate, and recent weather has reminded us of that fact. After experiencing the longest drought in recorded history,
Humidity, Condensation, Clouds, and Fog. Water in the Atmosphere
 Humidity, Condensation, Clouds, and Fog or Water in the Atmosphere The Hydrologic Cycle Where the Water Exists on Earth Evaporation From the Oceans and Land The Source of Water Vapor for the Atmosphere
Monsoon Variability and Extreme Weather Events
 Monsoon Variability and Extreme Weather Events M Rajeevan National Climate Centre India Meteorological Department Pune 411 005 rajeevan@imdpune.gov.in Outline of the presentation Monsoon rainfall Variability
AIR TEMPERATURE IN THE CANADIAN ARCTIC IN THE MID NINETEENTH CENTURY BASED ON DATA FROM EXPEDITIONS
 PRACE GEOGRAFICZNE, zeszyt 107 Instytut Geografii UJ Kraków 2000 Rajmund Przybylak AIR TEMPERATURE IN THE CANADIAN ARCTIC IN THE MID NINETEENTH CENTURY BASED ON DATA FROM EXPEDITIONS Abstract: The paper
Section 1 The Earth System
 Section 1 The Earth System Key Concept Earth is a complex system made up of many smaller systems through which matter and energy are continuously cycled. What You Will Learn Energy and matter flow through
Anyone Else Notice That Its Been Windy Lately?
 National Weather Service Aberdeen, South Dakota January 2014 Inside this issue: Has it Been Windy Lately or What? 2013 Year in Review 2013 Year in Review (cont.) 1 2 3 Has it Been Windy Lately or What?
Seasonal & Daily Temperatures. Seasons & Sun's Distance. Solstice & Equinox. Seasons & Solar Intensity
 Seasonal & Daily Temperatures Seasons & Sun's Distance The role of Earth's tilt, revolution, & rotation in causing spatial, seasonal, & daily temperature variations Please read Chapter 3 in Ahrens Figure
What are the controls for calcium carbonate distribution in marine sediments?
 Lecture 14 Marine Sediments (1) The CCD is: (a) the depth at which no carbonate secreting organisms can live (b) the depth at which seawater is supersaturated with respect to calcite (c) the depth at which
W.C. Rusty Riese, PhD Adjunct Professor, Rice University
 W.C. Rusty Riese, PhD Adjunct Professor, Rice University What are we being told? What are the data? What are the take-aways? What are your responsibilities? Mann Hockey Stick Curve The Arctic is melting
PMEL Press Releases and NOAA News Stories FY09- FY14
 PMEL Press Releases and NOAA News Stories FY09- FY14 PMEL WIDE Oceanographer named to head NOAA s Seattle research laboratory http://www.noaanews.noaa.gov/stories2011/20111018_pmel.html CLIMATE THEME most
For public information only; not an official document. November 2013
 For public information only; not an official document November 2013 1) There is a strong scientific consensus that the global climate is changing and that human activity contributes significantly to this
Module 11: The Cruise Ship Sector. Destination #3
 Module 11: The Cruise Ship Sector Destination #3 Cruise Destinations Welcome to your third destination. Use the following resource article to learn about the different oceans and time zones. Seen from
Impacts of Global Warming on North Carolina s Coastal Economy
 Impacts of Global Warming on North Carolina s Coastal Economy IMPACTS OF GLOBAL WARMING ON NORTH CAROLINA S COASTAL ECONOMY Key Findings Global warming is projected to have significant impacts on North
Changes in past, present and future sea level, focusing on the Norwegian west coast. J. E. Ø. Nilsen, K. Richter og H. Drange
 Changes in past, present and future sea level, focusing on the Norwegian west coast J. E. Ø. Nilsen, K. Richter og H. Drange Assessing sea level during the last 50 years Status for today s sea level Estimate
South Africa. General Climate. UNDP Climate Change Country Profiles. A. Karmalkar 1, C. McSweeney 1, M. New 1,2 and G. Lizcano 1
 UNDP Climate Change Country Profiles South Africa A. Karmalkar 1, C. McSweeney 1, M. New 1,2 and G. Lizcano 1 1. School of Geography and Environment, University of Oxford. 2. Tyndall Centre for Climate
Climate Extremes Research: Recent Findings and New Direc8ons
 Climate Extremes Research: Recent Findings and New Direc8ons Kenneth Kunkel NOAA Cooperative Institute for Climate and Satellites North Carolina State University and National Climatic Data Center h#p://assessment.globalchange.gov
RaysWeather.Com 2015-2016 Winter Fearless Forecast
 Author: Dr. Ray Russell Founder and President of RaysWeather.Com Date: October 10, 2015 RaysWeather.Com 2015-2016 Winter Fearless Forecast Background It's that time of year--leaves change, temperatures
AGAP Antarctic Research Project Visualizing Data Learning About Antarctica From RADAR Data? Teacher Version (answers italicized)
") AGAP Antarctic Research Project Visualizing Data Learning About Antarctica From RADAR Data? Teacher Version (answers italicized) Image of Subglacial Lake network courtesy of NSF Ice Sheet: A large glacier
AGAP Antarctic Research Project Visualizing Data Learning About Antarctica From RADAR Data? Teacher Version (answers italicized) Image of Subglacial Lake network courtesy of NSF Ice Sheet: A large glacier
Unit 2 Lesson 4 The Geologic Time Scale. Copyright Houghton Mifflin Harcourt Publishing Company
 Once Upon a Time How have geologists described the rate of geologic change? Geology is the scientific study of the origin, history, and structure of Earth and the processes that shape it. Early geologists
Hurricanes. Characteristics of a Hurricane
 Hurricanes Readings: A&B Ch. 12 Topics 1. Characteristics 2. Location 3. Structure 4. Development a. Tropical Disturbance b. Tropical Depression c. Tropical Storm d. Hurricane e. Influences f. Path g.
FOURTH GRADE WEATHER
 FOURTH GRADE WEATHER 1 WEEK LESSON PLANS AND ACTIVITIES WATER CYCLE OVERVIEW OF FOURTH GRADE WATER WEEK 1. PRE: Comparing different reservoirs of water. LAB: Experimenting with surface tension and capillary
Examining the Recent Pause in Global Warming
 Examining the Recent Pause in Global Warming Global surface temperatures have warmed more slowly over the past decade than previously expected. The media has seized this warming pause in recent weeks,
The Balance of Power in the Earth-Sun System
 NASA Facts National Aeronautics and Space Administration www.nasa.gov The Balance of Power in the Earth-Sun System The Sun is the major source of energy for Earth s oceans, atmosphere, land, and biosphere.
Ocean in Motion 2: What Causes Ocean Currents and How Do We Measure Them?
 Ocean in Motion 2: What Causes Ocean Currents and How Do We Measure Them? A. Overview 1. The Ocean in Motion -- Circulation In this program, students will learn about the driving forces responsible for
Global Warming. Charles F. Keller
 Global Warming Charles F. Keller Smokestacks at an industrial plant. Introduction Global warming is in the news. While scientists agree that temperatures are rising, they disagree as to the causes and
The Earth System. The geosphere is the solid Earth that includes the continental and oceanic crust as well as the various layers of Earth s interior.
 The Earth System The atmosphere is the gaseous envelope that surrounds Earth. It consists of a mixture of gases composed primarily of nitrogen, oxygen, carbon dioxide, and water vapor. The atmosphere and
Where Will the Polar Bears Go?
 Service Stewardship Where Will the Polar Bears Go? Courtesy Kaathy Crane, NOAA Arctic Research Office Science Protect the Earth The Arctic is one of the least explored places on earth, and is changing
Name Period 4 th Six Weeks Notes 2015 Weather
 Name Period 4 th Six Weeks Notes 2015 Weather Radiation Convection Currents Winds Jet Streams Energy from the Sun reaches Earth as electromagnetic waves This energy fuels all life on Earth including the
ES 106 Laboratory # 3 INTRODUCTION TO OCEANOGRAPHY. Introduction The global ocean covers nearly 75% of Earth s surface and plays a vital role in
 ES 106 Laboratory # 3 INTRODUCTION TO OCEANOGRAPHY 3-1 Introduction The global ocean covers nearly 75% of Earth s surface and plays a vital role in the physical environment of Earth. For these reasons,
Supporting Online Material for
 www.sciencemag.org/cgi/content/full/311/5768/1747/dc1 Supporting Online Material for Paleoclimatic Evidence for Future Ice-Sheet Instability and Rapid Sea- Level Rise Jonathan T. Overpeck,* Bette L. Otto-Bliesner,
2008 Global Surface Temperature in GISS Analysis
 2008 Global Surface Temperature in GISS Analysis James Hansen, Makiko Sato, Reto Ruedy, Ken Lo Calendar year 2008 was the coolest year since 2000, according to the Goddard Institute for Space Studies analysis
Climate, water and renewable energy in the Nordic countries
 102 Regional Hydrological Impacts of Climatic Change Hydroclimatic Variability (Proceedings of symposium S6 held during the Seventh IAHS Scientific Assembly at Foz do Iguaçu, Brazil, April 2005). IAHS
Roy W. Spencer 1. Search and Discovery Article #110117 (2009) Posted September 8, 2009. Abstract
 Posted September 8, 2009. Abstract") AV Satellite Evidence against Global Warming Being Caused by Increasing CO 2 * Roy W. Spencer 1 Search and Discovery Article #110117 (2009) Posted September 8, 2009 *Adapted from oral presentation at AAPG
AV Satellite Evidence against Global Warming Being Caused by Increasing CO 2 * Roy W. Spencer 1 Search and Discovery Article #110117 (2009) Posted September 8, 2009 *Adapted from oral presentation at AAPG
Activity 8 Drawing Isobars Level 2 http://www.uni.edu/storm/activities/level2/index.shtml
 Activity 8 Drawing Isobars Level 2 http://www.uni.edu/storm/activities/level2/index.shtml Objectives: 1. Students will be able to define and draw isobars to analyze air pressure variations. 2. Students
A Message From The Chair
 Web Version Update preferences Unsubscribe Like Tweet Forward A Message From The Chair It s a big year for small islands. As we work to conclude our regional preparations for the Third International Conference
City of Cambridge Climate Protection Action Committee. Recommendations for Adaptation to Climate Change. Purpose
 City of Cambridge Climate Protection Action Committee Recommendations for Adaptation to Climate Change Purpose The Climate Protection Action Committee (CPAC) is an advisory body to the City Manager on
defined largely by regional variations in climate
 1 Physical Environment: Climate and Biomes EVPP 110 Lecture Instructor: Dr. Largen Fall 2003 2 Climate and Biomes Ecosystem concept physical and biological components of environment are considered as single,
For public information only; not an official document. March 2013
 For public information only; not an official document March 2013 1) There is a strong scientific consensus that the global climate is changing and that human activity contributes significantly. This consensus
Estimating Firn Emissivity, from 1994 to1998, at the Ski Hi Automatic Weather Station on the West Antarctic Ice Sheet Using Passive Microwave Data
 Estimating Firn Emissivity, from 1994 to1998, at the Ski Hi Automatic Weather Station on the West Antarctic Ice Sheet Using Passive Microwave Data Mentor: Dr. Malcolm LeCompte Elizabeth City State University
A Year in Antarctica. Features of This Text. Focus for Instruction
 TM Celebration Press Reading DRA2 Level 38 Guided Reading Level P Genre: Nonfiction Narrative Reading Skill: A Year in Antarctica By Anita Ganeri What happens when a team of scientists sets out to spend
Reflection of Sunlight by Snow: Contribution to Earth s Energy Budget. Stephen Warren University of Washington, Seattle
 Reflection of Sunlight by Snow: Contribution to Earth s Energy Budget Stephen Warren University of Washington, Seattle Presentation to Congressional delegation, Ilulissat, Greenland, 20 July 2007 Sunlight
Noon Sun Angle = 90 Zenith Angle
 Noon Sun Angle Worksheet Name Name Date Subsolar Point (Latitude where the sun is overhead at noon) Equinox March 22 nd 0 o Equinox September 22 nd 0 o Solstice June 22 nd 23.5 N Solstice December 22 nd
Regents Questions: Plate Tectonics
 Earth Science Regents Questions: Plate Tectonics Name: Date: Period: August 2013 Due Date: 17 Compared to the oceanic crust, the continental crust is (1) less dense and more basaltic (3) more dense and
Bipolar Atlantic Thermohaline Circulation (BIAC) a IPY proposal coordinated by Tor Gammelsrød Geophysical Institute, University of Bergen
 a IPY proposal coordinated by Tor Gammelsrød Geophysical Institute, University of Bergen") Bipolar Atlantic Thermohaline Circulation (BIAC) a IPY proposal coordinated by Tor Gammelsrød Geophysical Institute, University of Bergen The role of the Thermohaline Circulation (THC) as a driving force
Bipolar Atlantic Thermohaline Circulation (BIAC) a IPY proposal coordinated by Tor Gammelsrød Geophysical Institute, University of Bergen The role of the Thermohaline Circulation (THC) as a driving force
ATM S 111, Global Warming: Understanding the Forecast
 ATM S 111, Global Warming: Understanding the Forecast DARGAN M. W. FRIERSON DEPARTMENT OF ATMOSPHERIC SCIENCES DAY 1: OCTOBER 1, 2015 Outline How exactly the Sun heats the Earth How strong? Important concept