Pixel-based image classification. Lecture 8 March 4, 2008
|
|
|
- Phyllis Nash
- 7 years ago
- Views:
Transcription
1 Pixel-based image classification Lecture 8 March 4, 2008
2 What is image classification or pattern recognition Is a process of classifying multispectral (hyperspectral) images into patterns of varying gray or assigned colors that represent either clusters of statistically different sets of multiband data, some of which can be correlated with separable classes/features/materials. This is the result of Unsupervised Classification, or numerical discriminators composed of these sets of data that have been grouped and specified by associating each with a particular class, etc. whose identity is known independently and which has representative areas (training sites) within the image where that class is located. This is the result of Supervised Classification. Spectral classes are those that are inherent in the remote sensor data and must be identified and then labeled by the analyst. Information classes are those that human beings define.
 into unique clusters according to some statistically determined criteria. The analyst then re-labels and combines the spectral clusters into information classes. supervised classification.")
3 unsupervised classification, The computer or algorithm automatically group pixels with similar spectral characteristics (means, standard deviations, covariance matrices, correlation matrices, etc.) into unique clusters according to some statistically determined criteria. The analyst then re-labels and combines the spectral clusters into information classes. supervised classification. Identify known a priori through a combination of fieldwork, map analysis, and personal experience as training sites; the spectral characteristics of these sites are used to train the classification algorithm for eventual land-cover mapping of the remainder of the image. Every pixel both within and outside the training sites is then evaluated and assigned to the class of which it has the highest likelihood of being a member.
4 Hard vs. Fuzzy classification Supervised and unsupervised classification algorithms typically use hard classification logic to produce a classification map that consists of hard, discrete categories (e.g., forest, agriculture). Conversely, it is also possible to use fuzzy set classification logic, which takes into account the heterogeneous and imprecise nature (mix pixels) of the real world. Proportion of the m classes within a pixel (e.g., 10% bare soil, 10% shrub, 80% forest). Fuzzy classification schemes are not currently standardized.
5
6 Pixel-based vs. Object-oriented classification In the past, most digital image classification was based on processing the entire scene pixel by pixel. This is commonly referred to as per-pixel (pixel-based) classification. Object-oriented classification techniques allow the analyst to decompose the scene into many relatively homogenous image objects (referred to as patches or segments) using a multiresolution image segmentation process. The various statistical characteristics of these homogeneous image objects in the scene are then subjected to traditional statistical or fuzzy logic classification. Object-oriented classification based on image segmentation is often used for the analysis of highspatial-resolution imagery (e.g., 1 1 m Space Imaging IKONOS and m Digital Globe QuickBird).
7 Knowledge-based information extraction: Artificial Intelligence Neural network Decision tree Support vector machine (SVM)
8 Purposes of classification Land use and land cover (LULC) Vegetation types Geologic terrains Mineral exploration Alteration mapping.
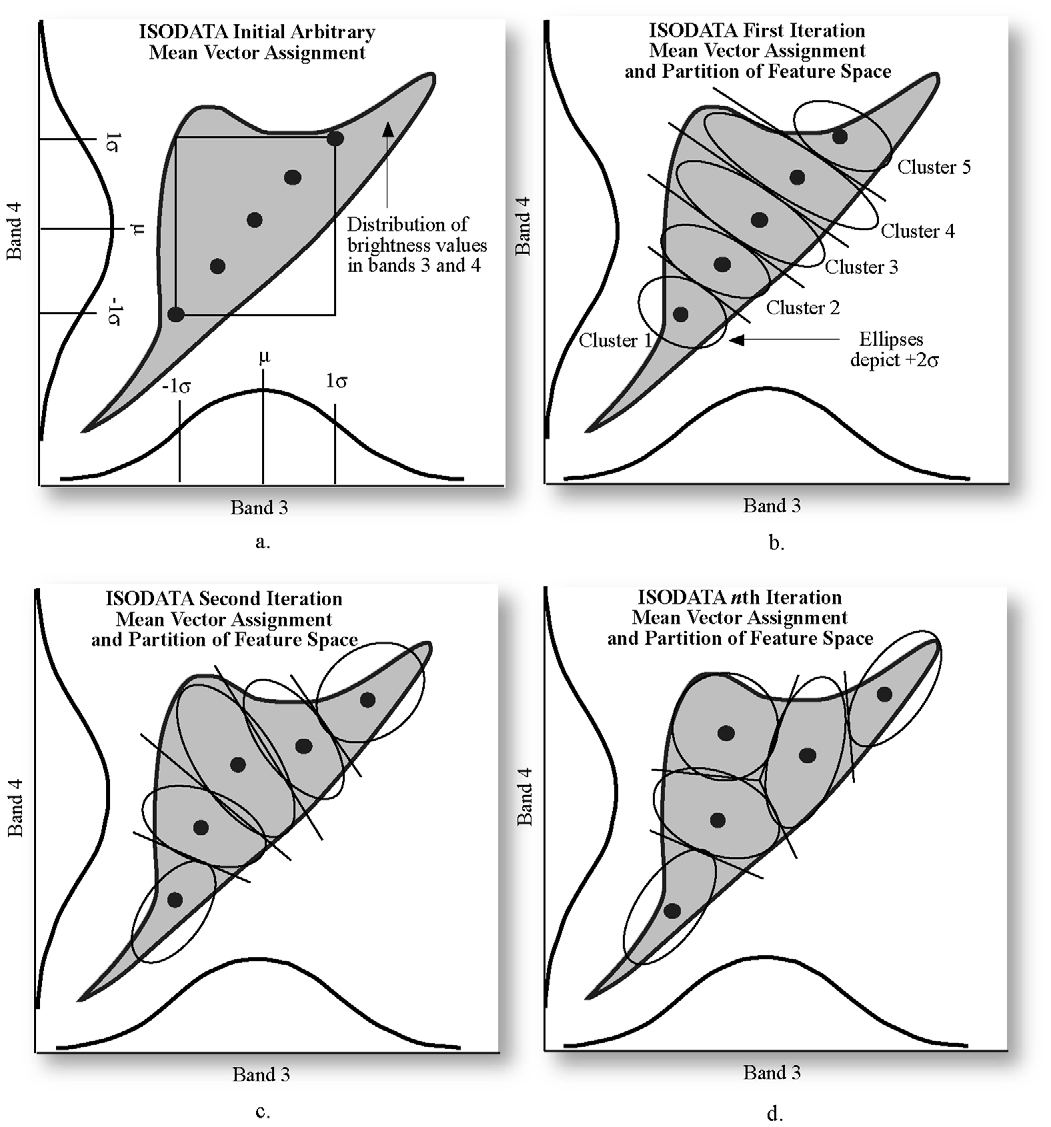
9 1. Unsupervised classification Uses statistical techniques to group n-dimensional data into their natural spectral clusters, and uses the iterative procedures label certain clusters as specific information classes K-mean and ISODATA For the first iteration arbitrary starting values (i.e., the cluster properties) have to be selected. These initial values can influence the outcome of the classification. In general, both methods assign first arbitrary initial cluster values. The second step classifies each pixel to the closest cluster. In the third step the new cluster mean vectors are calculated based on all the pixels in one cluster. The second and third steps are repeated until the "change" between the iteration is small. The "change" can be defined in several different ways, either by measuring the distances of the mean cluster vector have changed from one iteration to another or by the percentage of pixels that have changed between iterations. The ISODATA algorithm has some further refinements by splitting and merging of clusters. Clusters are merged if either the number of members (pixel) in a cluster is less than a certain threshold or if the centers of two clusters are closer than a certain threshold. Clusters are split into two different clusters if the cluster standard deviation exceeds a predefined value and the number of members (pixels) is twice the threshold for the minimum number of members.
10
11
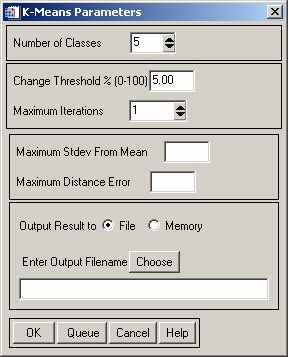
12 ISODATA: Initial Cluster Values (properties) number of classes maximum iterations pixel change threshold (0-100%) (The change threshold is used to end the iterative process when the number of pixels in each class changes by less than the threshold. The classification will end when either this threshold is met or the maximum number of iterations has been reached) initializing from statistics (Erdas) or from input (ENVI) (the initial values to put in for ENVI are minimum # pixel in class, maximum class stdv, minimum class distance, maximum # merge pairs)
 and maximum distance error (in pixel value).")
13 Maximum Class Stdv (in pixel value). If the stdv of a class is larger than this threshold then the class is split into two classes. Minimum class distance (in pixel value) between class means. If the distance between two class means is less than the minimum value entered, then ENVI merges the classes. Optional Maximum stdev from mean (1 to 3σ) and maximum distance error (in pixel value). If any of these two setup, the some pixels might not be classified.

14 5-10 classes, 8 iterations, 5 for change threshold, (MinP 5, MaxSD 1, MinD 5, MMP 2)
15 1-5 classes, 11 iterations, 5 for change threshold, (MinP 5, MaxSD 1, MinD 5, MMP 2)
16 5 classes 10 classes
17 2. Supervised classification: training sites selection Based on known a priori through a combination of fieldwork, map analysis, and personal experience on-screen selection of polygonal training data (ROI), and/or on-screen seeding of training data (ENVI does not have this, Erdas Imagine does). The seed program begins at a single x, y location and evaluates neighboring pixel values in all bands of interest. Using criteria specified by the analyst, the seed algorithm expands outward like an amoeba as long as it finds pixels with spectral characteristics similar to the original seed pixel. This is a very effective way of collecting homogeneous training information. From spectral library of field measurements
18 Statistic extraction of each training site Each Each pixel pixel in in each each training site site associated with with a particular class class (c) (c) is is represented by by a measurement vector, X c ; c ; Average of of all all pixels in in a training site site called mean vector, M c ; c ; a covariance matrix of of V c. c. X c = BV BV BV.. BV i, j,1 i, j,2 i, j,3 i, j, k M c = µ c µ c µ c.. µ ck V c = cov cov.. cov c11 c21 ck1 cov cov cov c12 c22 ck 2...cov...cov...cov c1k c2k ckk where BV BV i,j,k is i,j,k is the the brightness value for for the the i,j i,j th th pixel pixel in in band band k. k. µ ck represents ck the the mean mean value value of of all all pixels pixels obtained for for class classcc in in band band k. k. Cov Cov ckl is ckl is the the covariance of of class class ccbetween between bands bands llthrough through k. k.

19 Selecting ROIs Alfalfa Cotton Grass Fallow

20 Spectra of ROIs from ETM+ image

21 Spectra from library Resampled to match TM/ETM+, 6 bands
22 Supervised classification methods Various supervised classification algorithms may be used to assign an unknown pixel to one of m possible classes. The choice of a particular classifier or decision rule depends on the nature of the input data and the desired output. Parametric classification algorithms assumes that the observed measurement vectors X c obtained for each class in each spectral band during the training phase of the supervised classification are Gaussian; that is, they are normally distributed. Nonparametric classification algorithms make no such assumption. Several widely adopted nonparametric classification algorithms include: one-dimensional density slicing parallepiped, minimum distance, nearest-neighbor, and neural network and expert system analysis. The most widely adopted parametric classification algorithms is the: maximum likelihood. Hyperspectral classification methods Binary Encoding Spectral Angle Mapper Matched Filtering Spectral Feature Fitting Linear Spectral Unmixing
23 If a pixel value lies above the low threshold and below the high threshold for all n bands being classified, it is assigned to that class. If the pixel value falls in multiple classes, ENVI assigns the pixel to the last class matched. Areas that do not fall within any of the parallelepipeds are designated as unclassified. In ENVI, you can use 1-3σ 2.1 Parallepiped This is a widely used digital image classification decision rule based on simple Boolean and/or logic. µ + ck σ ck BVijk µ ck σ ck L ck BV ijk H ck

24 This method is a computationally efficient method. But an unknown pixel might meet the criteria of more than one class and is always assigned to the first class for which it meets all criteria. The Minimum Distance to Means can assign any pixel to just one class.

25 1 means 1 stdev from mean, 2 means 2 stdev from mean, 3 means 3 stdev from mean; Use 1, you will classify the closest pixels to the class Use 3, you will include some not so closest pixels to the class

26
27 2.2 Minimum distance ( BV ) ( ) 2 ijk µ + BV 2 ck ijl cl Dist = µ The The distance used used in in a minimum distance to to means classification algorithm can can take take two two forms: the the Euclidean Dist = ( BV ) 2 ( ) 2 ijk µ ck + BVijl µ cl distance based on on the the Pythagorean theorem and and the the round the the block distance. The The Euclidean distance is is more more computationally intensive, but but it it is is more more frequently used used All pixels are classified to the nearest class unless a standard deviation or distance threshold is specified, in which case some pixels may be unclassified if they do not meet the selected criteria. Dist = ( BV ) ( ) 2 ijk µ + BV ck 2 ijl cl Dist = µ e.g. the distance of point a to class forest is 2 2 ( ) + ( ) = 4. 6
, then the pixels with values outside the mean ± 2σ will not be classified. If the Max distance error is set at 4.")
28 If either Max stdev or Max distance error is not set, all pixels will be classified. If the Max stdev from mean is set at 2 (stdev), then the pixels with values outside the mean ± 2σ will not be classified. If the Max distance error is set at 4.2 (pixel value), then the pixels with distance larger than 4.2 will not be classified.
29 2.3 Maximum likelihood Instead based on training class multispectral distance measurements, the maximum likelihood decision rule is based on probability. The maximum likelihood procedure assumes that each training class in each band are normally distributed (Gaussian). Training data with bi- or n-modal histograms in a single band are not ideal. In such cases the individual modes probably represent unique classes that should be trained upon individually and labeled as separate training classes. the probability of a pixel belonging to each of a predefined set of m classes is calculated based on a normal probability density function, and the pixel is then assigned to the class for which the probability is the highest. probability

30 The The estimated probability density function for for class class w i (e.g., i (e.g., forest) is is computed using the the equation: pˆ ( x w ) i 1 1 exp ˆ σ 2 ( x ˆ µ ) i = 1 2 ( 2π ) 2 ˆ σ 2 i i where exp exp [ [] ] is is e (the (the base base of of the the natural logarithms) raised to to the the computed power, x is is one one of of the the brightness values on on the the x-axis, µˆi is is the the estimated mean of of all all the the values in in the the forest training class, and and σˆi 2 is is the the estimated variance e of of all all the the measurements in in this this class. Therefore, we we need need to to store store only only the the mean and and variance of of each each training t class class (e.g., (e.g., forest) to to compute the the probability function associated with with any any of of the the individual brightness values in in it. it.
31 For For multiple bands of of remote sensor data data for for the the classes of of interest, we we compute an an n- n- dimensional multivariate normal density function using: p ( X w ) i = ( 2π ) 1 n 2 V i 1 2 exp 1 2 T 1 ( X M ) V ( X M ) i i i 1 where V is is the the determinant of of the the covariance matrix, V i i is is the the inverse of of the the covariance matrix, and and ( ) is is the the transpose of of the the vector ( T X M X M i ) i.. The The mean vectors (M (M i ) i ) and and covariance matrix (V (V i ) i ) for for each each class class are are estimated from from the the training data. data.
 V ( X M ) i i i The assign the measurement vector X of an unknown pixel to a class, the maximum likelihood decision rule computers the")
32 Without Prior Probability Information: Decide unknown measurement vector X is in class i if, and only if, p i > p j for all i and j out of 1, 2,... m possible classes and p i = 1 2 log e V i 1 2 T 1 ( X M ) V ( X M ) i i i The assign the measurement vector X of an unknown pixel to a class, the maximum likelihood decision rule computers the value pi for each class. Then it assigns the pixel to the class that has the largest value Unless you select a probability threshold (0-1), all pixels are classified. Each pixel is assigned to the class that has the highest probability
![Probability threshold from [0, 1].](/docs-images/59/42740970/images/33-0.png "0 means zero probability of similarity, 1 means 100%")
33 Probability threshold from [0, 1]. 0 means zero probability of similarity, 1 means 100% probability of similarity.
34 2.4 Mahalanobis Distance M-distance is similar to the Euclidian distance Dist = ( ) T 1 X M V ( ) i X M i i It is similar to the Maximum Likelihood classification but assumes all class covariances are equal and therefore is a faster method. All pixels are classified to the closest ROI class unless you specify a distance threshold, in which case some pixels may be unclassified if they do not meet the threshold (in DN number)
35 2.5 Spectral Angle Mapper
36 2.6 Spectral Feature Fitting compare the fit of image reflectance spectra to selected reference reflectance spectra using a least-squares squares technique. SFF is an absorption-feature-based methodology. Both reflectance spectra should be continuum removed. A scale image is output for each reference spectrum and is a measure of absorption feature depth which is related to material abundance. The image and reference spectra are compared at each selected wavelength in a least-squares sense and the root mean square (rms) error is determined for each reference spectrum.
37 Least square tech (regression)

38 A continuum is a mathematical function used to isolate a particular absorption feature for analysis

39 Supervised classification method: Spectral Feature Fitting Source:
Environmental Remote Sensing GEOG 2021
 Environmental Remote Sensing GEOG 2021 Lecture 4 Image classification 2 Purpose categorising data data abstraction / simplification data interpretation mapping for land cover mapping use land cover class
Calculation of Minimum Distances. Minimum Distance to Means. Σi i = 1
 Minimum Distance to Means Similar to Parallelepiped classifier, but instead of bounding areas, the user supplies spectral class means in n-dimensional space and the algorithm calculates the distance between
ENVI Classic Tutorial: Classification Methods
 ENVI Classic Tutorial: Classification Methods Classification Methods 2 Files Used in this Tutorial 2 Examining a Landsat TM Color Image 3 Reviewing Image Colors 3 Using the Cursor Location/Value 4 Examining
Some elements of photo. interpretation
 Some elements of photo Shape Size Pattern Color (tone, hue) Texture Shadows Site Association interpretation Olson, C. E., Jr. 1960. Elements of photographic interpretation common to several sensors. Photogrammetric
SAMPLE MIDTERM QUESTIONS
 Geography 309 Sample MidTerm Questions Page 1 SAMPLE MIDTERM QUESTIONS Textbook Questions Chapter 1 Questions 4, 5, 6, Chapter 2 Questions 4, 7, 10 Chapter 4 Questions 8, 9 Chapter 10 Questions 1, 4, 7
Cafcam: Crisp And Fuzzy Classification Accuracy Measurement Software
 Cafcam: Crisp And Fuzzy Classification Accuracy Measurement Software Mohamed A. Shalan 1, Manoj K. Arora 2 and John Elgy 1 1 School of Engineering and Applied Sciences, Aston University, Birmingham, UK
Multiscale Object-Based Classification of Satellite Images Merging Multispectral Information with Panchromatic Textural Features
 Remote Sensing and Geoinformation Lena Halounová, Editor not only for Scientific Cooperation EARSeL, 2011 Multiscale Object-Based Classification of Satellite Images Merging Multispectral Information with
Machine Learning using MapReduce
 Machine Learning using MapReduce What is Machine Learning Machine learning is a subfield of artificial intelligence concerned with techniques that allow computers to improve their outputs based on previous
ARTIFICIAL INTELLIGENCE (CSCU9YE) LECTURE 6: MACHINE LEARNING 2: UNSUPERVISED LEARNING (CLUSTERING)
 LECTURE 6: MACHINE LEARNING 2: UNSUPERVISED LEARNING (CLUSTERING)") ARTIFICIAL INTELLIGENCE (CSCU9YE) LECTURE 6: MACHINE LEARNING 2: UNSUPERVISED LEARNING (CLUSTERING) Gabriela Ochoa http://www.cs.stir.ac.uk/~goc/ OUTLINE Preliminaries Classification and Clustering Applications
ARTIFICIAL INTELLIGENCE (CSCU9YE) LECTURE 6: MACHINE LEARNING 2: UNSUPERVISED LEARNING (CLUSTERING) Gabriela Ochoa http://www.cs.stir.ac.uk/~goc/ OUTLINE Preliminaries Classification and Clustering Applications
CROP CLASSIFICATION WITH HYPERSPECTRAL DATA OF THE HYMAP SENSOR USING DIFFERENT FEATURE EXTRACTION TECHNIQUES
 Proceedings of the 2 nd Workshop of the EARSeL SIG on Land Use and Land Cover CROP CLASSIFICATION WITH HYPERSPECTRAL DATA OF THE HYMAP SENSOR USING DIFFERENT FEATURE EXTRACTION TECHNIQUES Sebastian Mader
COMPARISON OF OBJECT BASED AND PIXEL BASED CLASSIFICATION OF HIGH RESOLUTION SATELLITE IMAGES USING ARTIFICIAL NEURAL NETWORKS
 COMPARISON OF OBJECT BASED AND PIXEL BASED CLASSIFICATION OF HIGH RESOLUTION SATELLITE IMAGES USING ARTIFICIAL NEURAL NETWORKS B.K. Mohan and S. N. Ladha Centre for Studies in Resources Engineering IIT
Supervised Classification workflow in ENVI 4.8 using WorldView-2 imagery
 Supervised Classification workflow in ENVI 4.8 using WorldView-2 imagery WorldView-2 is the first commercial high-resolution satellite to provide eight spectral sensors in the visible to near-infrared
Non-Homogeneous Hidden Markov Chain Models for Wavelet-Based Hyperspectral Image Processing. Marco F. Duarte Mario Parente
 Non-Homogeneous Hidden Markov Chain Models for Wavelet-Based Hyperspectral Image Processing Marco F. Duarte Mario Parente Hyperspectral Imaging One signal/image per band Hyperspectral datacube Spectrum
How To Cluster
 Data Clustering Dec 2nd, 2013 Kyrylo Bessonov Talk outline Introduction to clustering Types of clustering Supervised Unsupervised Similarity measures Main clustering algorithms k-means Hierarchical Main
Linear Threshold Units
 Linear Threshold Units w x hx (... w n x n w We assume that each feature x j and each weight w j is a real number (we will relax this later) We will study three different algorithms for learning linear
Modelling, Extraction and Description of Intrinsic Cues of High Resolution Satellite Images: Independent Component Analysis based approaches
 Modelling, Extraction and Description of Intrinsic Cues of High Resolution Satellite Images: Independent Component Analysis based approaches PhD Thesis by Payam Birjandi Director: Prof. Mihai Datcu Problematic
Example: Credit card default, we may be more interested in predicting the probabilty of a default than classifying individuals as default or not.
 Statistical Learning: Chapter 4 Classification 4.1 Introduction Supervised learning with a categorical (Qualitative) response Notation: - Feature vector X, - qualitative response Y, taking values in C
Statistical Machine Learning
 Statistical Machine Learning UoC Stats 37700, Winter quarter Lecture 4: classical linear and quadratic discriminants. 1 / 25 Linear separation For two classes in R d : simple idea: separate the classes
CS 688 Pattern Recognition Lecture 4. Linear Models for Classification
 CS 688 Pattern Recognition Lecture 4 Linear Models for Classification Probabilistic generative models Probabilistic discriminative models 1 Generative Approach ( x ) p C k p( C k ) Ck p ( ) ( x Ck ) p(
Azure Machine Learning, SQL Data Mining and R
 Azure Machine Learning, SQL Data Mining and R Day-by-day Agenda Prerequisites No formal prerequisites. Basic knowledge of SQL Server Data Tools, Excel and any analytical experience helps. Best of all:
An Assessment of the Effectiveness of Segmentation Methods on Classification Performance
 An Assessment of the Effectiveness of Segmentation Methods on Classification Performance Merve Yildiz 1, Taskin Kavzoglu 2, Ismail Colkesen 3, Emrehan K. Sahin Gebze Institute of Technology, Department
Chapter 12 Discovering New Knowledge Data Mining
 Chapter 12 Discovering New Knowledge Data Mining Becerra-Fernandez, et al. -- Knowledge Management 1/e -- 2004 Prentice Hall Additional material 2007 Dekai Wu Chapter Objectives Introduce the student to
Clustering. Danilo Croce Web Mining & Retrieval a.a. 2015/201 16/03/2016
 Clustering Danilo Croce Web Mining & Retrieval a.a. 2015/201 16/03/2016 1 Supervised learning vs. unsupervised learning Supervised learning: discover patterns in the data that relate data attributes with
Digital image processing
 746A27 Remote Sensing and GIS Lecture 4 Digital image processing Chandan Roy Guest Lecturer Department of Computer and Information Science Linköping University Digital Image Processing Most of the common
Land Use/Land Cover Map of the Central Facility of ARM in the Southern Great Plains Site Using DOE s Multi-Spectral Thermal Imager Satellite Images
 Land Use/Land Cover Map of the Central Facility of ARM in the Southern Great Plains Site Using DOE s Multi-Spectral Thermal Imager Satellite Images S. E. Báez Cazull Pre-Service Teacher Program University
Classification algorithm in Data mining: An Overview
 Classification algorithm in Data mining: An Overview S.Neelamegam #1, Dr.E.Ramaraj *2 #1 M.phil Scholar, Department of Computer Science and Engineering, Alagappa University, Karaikudi. *2 Professor, Department
The Scientific Data Mining Process
 Chapter 4 The Scientific Data Mining Process When I use a word, Humpty Dumpty said, in rather a scornful tone, it means just what I choose it to mean neither more nor less. Lewis Carroll [87, p. 214] In
Feature Selection vs. Extraction
 Feature Selection In many applications, we often encounter a very large number of potential features that can be used Which subset of features should be used for the best classification? Need for a small
Practical Data Science with Azure Machine Learning, SQL Data Mining, and R
 Practical Data Science with Azure Machine Learning, SQL Data Mining, and R Overview This 4-day class is the first of the two data science courses taught by Rafal Lukawiecki. Some of the topics will be
PATTERN RECOGNITION AND MACHINE LEARNING CHAPTER 4: LINEAR MODELS FOR CLASSIFICATION
 PATTERN RECOGNITION AND MACHINE LEARNING CHAPTER 4: LINEAR MODELS FOR CLASSIFICATION Introduction In the previous chapter, we explored a class of regression models having particularly simple analytical
Neural Networks Lesson 5 - Cluster Analysis
 Neural Networks Lesson 5 - Cluster Analysis Prof. Michele Scarpiniti INFOCOM Dpt. - Sapienza University of Rome http://ispac.ing.uniroma1.it/scarpiniti/index.htm michele.scarpiniti@uniroma1.it Rome, 29
SPECIAL PERTURBATIONS UNCORRELATED TRACK PROCESSING
 AAS 07-228 SPECIAL PERTURBATIONS UNCORRELATED TRACK PROCESSING INTRODUCTION James G. Miller * Two historical uncorrelated track (UCT) processing approaches have been employed using general perturbations
Multisensor Data Fusion and Applications
 Multisensor Data Fusion and Applications Pramod K. Varshney Department of Electrical Engineering and Computer Science Syracuse University 121 Link Hall Syracuse, New York 13244 USA E-mail: varshney@syr.edu
Research On The Classification Of High Resolution Image Based On Object-oriented And Class Rule
 Research On The Classification Of High Resolution Image Based On Object-oriented And Class Rule Li Chaokui a,b, Fang Wen a,b, Dong Xiaojiao a,b a National-Local Joint Engineering Laboratory of Geo-Spatial
203.4770: Introduction to Machine Learning Dr. Rita Osadchy
 203.4770: Introduction to Machine Learning Dr. Rita Osadchy 1 Outline 1. About the Course 2. What is Machine Learning? 3. Types of problems and Situations 4. ML Example 2 About the course Course Homepage:
WATER BODY EXTRACTION FROM MULTI SPECTRAL IMAGE BY SPECTRAL PATTERN ANALYSIS
 WATER BODY EXTRACTION FROM MULTI SPECTRAL IMAGE BY SPECTRAL PATTERN ANALYSIS Nguyen Dinh Duong Department of Environmental Information Study and Analysis, Institute of Geography, 18 Hoang Quoc Viet Rd.,
MACHINE LEARNING IN HIGH ENERGY PHYSICS
 MACHINE LEARNING IN HIGH ENERGY PHYSICS LECTURE #1 Alex Rogozhnikov, 2015 INTRO NOTES 4 days two lectures, two practice seminars every day this is introductory track to machine learning kaggle competition!
Multispectral Data Analysis: A Signal Theory Perspective
 Multispectral Data Analysis: A Signal Theory Perspective by David Landgrebe School of Electrical Engineering Purdue University West Lafayette IN 47907-1285 landgreb@ecn.purdue.edu Preface This document
Medical Information Management & Mining. You Chen Jan,15, 2013 You.chen@vanderbilt.edu
 Medical Information Management & Mining You Chen Jan,15, 2013 You.chen@vanderbilt.edu 1 Trees Building Materials Trees cannot be used to build a house directly. How can we transform trees to building materials?
Machine Learning and Data Analysis overview. Department of Cybernetics, Czech Technical University in Prague. http://ida.felk.cvut.
 Machine Learning and Data Analysis overview Jiří Kléma Department of Cybernetics, Czech Technical University in Prague http://ida.felk.cvut.cz psyllabus Lecture Lecturer Content 1. J. Kléma Introduction,
Resolutions of Remote Sensing
 Resolutions of Remote Sensing 1. Spatial (what area and how detailed) 2. Spectral (what colors bands) 3. Temporal (time of day/season/year) 4. Radiometric (color depth) Spatial Resolution describes how
RESOLUTION MERGE OF 1:35.000 SCALE AERIAL PHOTOGRAPHS WITH LANDSAT 7 ETM IMAGERY
 RESOLUTION MERGE OF 1:35.000 SCALE AERIAL PHOTOGRAPHS WITH LANDSAT 7 ETM IMAGERY M. Erdogan, H.H. Maras, A. Yilmaz, Ö.T. Özerbil General Command of Mapping 06100 Dikimevi, Ankara, TURKEY - (mustafa.erdogan;
UNSUPERVISED MACHINE LEARNING TECHNIQUES IN GENOMICS
 UNSUPERVISED MACHINE LEARNING TECHNIQUES IN GENOMICS Dwijesh C. Mishra I.A.S.R.I., Library Avenue, New Delhi-110 012 dcmishra@iasri.res.in What is Learning? "Learning denotes changes in a system that enable
Class #6: Non-linear classification. ML4Bio 2012 February 17 th, 2012 Quaid Morris
 Class #6: Non-linear classification ML4Bio 2012 February 17 th, 2012 Quaid Morris 1 Module #: Title of Module 2 Review Overview Linear separability Non-linear classification Linear Support Vector Machines
A Learning Based Method for Super-Resolution of Low Resolution Images
 A Learning Based Method for Super-Resolution of Low Resolution Images Emre Ugur June 1, 2004 emre.ugur@ceng.metu.edu.tr Abstract The main objective of this project is the study of a learning based method
CS 2750 Machine Learning. Lecture 1. Machine Learning. http://www.cs.pitt.edu/~milos/courses/cs2750/ CS 2750 Machine Learning.
 Lecture Machine Learning Milos Hauskrecht milos@cs.pitt.edu 539 Sennott Square, x5 http://www.cs.pitt.edu/~milos/courses/cs75/ Administration Instructor: Milos Hauskrecht milos@cs.pitt.edu 539 Sennott
The Idiots Guide to GIS and Remote Sensing
 The Idiots Guide to GIS and Remote Sensing 1. Picking the right imagery 1 2. Accessing imagery 1 3. Processing steps 1 a. Geocorrection 2 b. Processing Landsat images layerstacking 4 4. Landcover classification
WebFOCUS RStat. RStat. Predict the Future and Make Effective Decisions Today. WebFOCUS RStat
 Information Builders enables agile information solutions with business intelligence (BI) and integration technologies. WebFOCUS the most widely utilized business intelligence platform connects to any enterprise
y = Xβ + ε B. Sub-pixel Classification
 Sub-pixel Mapping of Sahelian Wetlands using Multi-temporal SPOT VEGETATION Images Jan Verhoeye and Robert De Wulf Laboratory of Forest Management and Spatial Information Techniques Faculty of Agricultural
Assessment. Presenter: Yupu Zhang, Guoliang Jin, Tuo Wang Computer Vision 2008 Fall
 Automatic Photo Quality Assessment Presenter: Yupu Zhang, Guoliang Jin, Tuo Wang Computer Vision 2008 Fall Estimating i the photorealism of images: Distinguishing i i paintings from photographs h Florin
Predictive Modeling Techniques in Insurance
 Predictive Modeling Techniques in Insurance Tuesday May 5, 2015 JF. Breton Application Engineer 2014 The MathWorks, Inc. 1 Opening Presenter: JF. Breton: 13 years of experience in predictive analytics
Objectives. Raster Data Discrete Classes. Spatial Information in Natural Resources FANR 3800. Review the raster data model
 Spatial Information in Natural Resources FANR 3800 Raster Analysis Objectives Review the raster data model Understand how raster analysis fundamentally differs from vector analysis Become familiar with
III THE CLASSIFICATION OF URBAN LAND COVER USING REMOTE SENSING
 The Dynamics of Global Urban Expansion 31 III THE CLASSIFICATION OF URBAN LAND COVER USING REMOTE SENSING 1. Overview and Rationale The systematic study of global urban expansion requires good data that
Remote Sensing of Environment
 Remote Sensing of Environment 115 (2011) 1145 1161 Contents lists available at ScienceDirect Remote Sensing of Environment journal homepage: www.elsevier.com/locate/rse Per-pixel vs. object-based classification
Data Mining - Evaluation of Classifiers
 Data Mining - Evaluation of Classifiers Lecturer: JERZY STEFANOWSKI Institute of Computing Sciences Poznan University of Technology Poznan, Poland Lecture 4 SE Master Course 2008/2009 revised for 2010
15.062 Data Mining: Algorithms and Applications Matrix Math Review
 .6 Data Mining: Algorithms and Applications Matrix Math Review The purpose of this document is to give a brief review of selected linear algebra concepts that will be useful for the course and to develop
The Role of SPOT Satellite Images in Mapping Air Pollution Caused by Cement Factories
 The Role of SPOT Satellite Images in Mapping Air Pollution Caused by Cement Factories Dr. Farrag Ali FARRAG Assistant Prof. at Civil Engineering Dept. Faculty of Engineering Assiut University Assiut, Egypt.
An Introduction to Data Mining. Big Data World. Related Fields and Disciplines. What is Data Mining? 2/12/2015
 An Introduction to Data Mining for Wind Power Management Spring 2015 Big Data World Every minute: Google receives over 4 million search queries Facebook users share almost 2.5 million pieces of content
Analysis of kiva.com Microlending Service! Hoda Eydgahi Julia Ma Andy Bardagjy December 9, 2010 MAS.622j
 Analysis of kiva.com Microlending Service! Hoda Eydgahi Julia Ma Andy Bardagjy December 9, 2010 MAS.622j What is Kiva? An organization that allows people to lend small amounts of money via the Internet
Lecture 9: Introduction to Pattern Analysis
 Lecture 9: Introduction to Pattern Analysis g Features, patterns and classifiers g Components of a PR system g An example g Probability definitions g Bayes Theorem g Gaussian densities Features, patterns
Cluster analysis Cosmin Lazar. COMO Lab VUB
 Cluster analysis Cosmin Lazar COMO Lab VUB Introduction Cluster analysis foundations rely on one of the most fundamental, simple and very often unnoticed ways (or methods) of understanding and learning,
Lecture 3: Linear methods for classification
 Lecture 3: Linear methods for classification Rafael A. Irizarry and Hector Corrada Bravo February, 2010 Today we describe four specific algorithms useful for classification problems: linear regression,
Using Data Mining for Mobile Communication Clustering and Characterization
 Using Data Mining for Mobile Communication Clustering and Characterization A. Bascacov *, C. Cernazanu ** and M. Marcu ** * Lasting Software, Timisoara, Romania ** Politehnica University of Timisoara/Computer
Data, Measurements, Features
 Data, Measurements, Features Middle East Technical University Dep. of Computer Engineering 2009 compiled by V. Atalay What do you think of when someone says Data? We might abstract the idea that data are
Big Data Analytics CSCI 4030
 High dim. data Graph data Infinite data Machine learning Apps Locality sensitive hashing PageRank, SimRank Filtering data streams SVM Recommen der systems Clustering Community Detection Web advertising
Social Media Mining. Data Mining Essentials
 Introduction Data production rate has been increased dramatically (Big Data) and we are able store much more data than before E.g., purchase data, social media data, mobile phone data Businesses and customers
CS Master Level Courses and Areas COURSE DESCRIPTIONS. CSCI 521 Real-Time Systems. CSCI 522 High Performance Computing
 CS Master Level Courses and Areas The graduate courses offered may change over time, in response to new developments in computer science and the interests of faculty and students; the list of graduate
Object-Oriented Approach of Information Extraction from High Resolution Satellite Imagery
 IOSR Journal of Computer Engineering (IOSR-JCE) e-issn: 2278-0661,p-ISSN: 2278-8727, Volume 17, Issue 3, Ver. IV (May Jun. 2015), PP 47-52 www.iosrjournals.org Object-Oriented Approach of Information Extraction
Component Ordering in Independent Component Analysis Based on Data Power
 Component Ordering in Independent Component Analysis Based on Data Power Anne Hendrikse Raymond Veldhuis University of Twente University of Twente Fac. EEMCS, Signals and Systems Group Fac. EEMCS, Signals
Categorical Data Visualization and Clustering Using Subjective Factors
 Categorical Data Visualization and Clustering Using Subjective Factors Chia-Hui Chang and Zhi-Kai Ding Department of Computer Science and Information Engineering, National Central University, Chung-Li,
APPLICATION OF MULTITEMPORAL LANDSAT DATA TO MAP AND MONITOR LAND COVER AND LAND USE CHANGE IN THE CHESAPEAKE BAY WATERSHED
 APPLICATION OF MULTITEMPORAL LANDSAT DATA TO MAP AND MONITOR LAND COVER AND LAND USE CHANGE IN THE CHESAPEAKE BAY WATERSHED S. J. GOETZ Woods Hole Research Center Woods Hole, Massachusetts 054-096 USA
MSCA 31000 Introduction to Statistical Concepts
 MSCA 31000 Introduction to Statistical Concepts This course provides general exposure to basic statistical concepts that are necessary for students to understand the content presented in more advanced
3 An Illustrative Example
 Objectives An Illustrative Example Objectives - Theory and Examples -2 Problem Statement -2 Perceptron - Two-Input Case -4 Pattern Recognition Example -5 Hamming Network -8 Feedforward Layer -8 Recurrent
Statistics Graduate Courses
 Statistics Graduate Courses STAT 7002--Topics in Statistics-Biological/Physical/Mathematics (cr.arr.).organized study of selected topics. Subjects and earnable credit may vary from semester to semester.
Supervised and unsupervised learning - 1
 Chapter 3 Supervised and unsupervised learning - 1 3.1 Introduction The science of learning plays a key role in the field of statistics, data mining, artificial intelligence, intersecting with areas in
Volume 2, Issue 9, September 2014 International Journal of Advance Research in Computer Science and Management Studies
 Volume 2, Issue 9, September 2014 International Journal of Advance Research in Computer Science and Management Studies Research Article / Survey Paper / Case Study Available online at: www.ijarcsms.com
Remote Sensing and Land Use Classification: Supervised vs. Unsupervised Classification Glen Busch
 Remote Sensing and Land Use Classification: Supervised vs. Unsupervised Classification Glen Busch Introduction In this time of large-scale planning and land management on public lands, managers are increasingly
Machine Learning with MATLAB David Willingham Application Engineer
 Machine Learning with MATLAB David Willingham Application Engineer 2014 The MathWorks, Inc. 1 Goals Overview of machine learning Machine learning models & techniques available in MATLAB Streamlining the
Mapping Land Cover Patterns of Gunma Prefecture, Japan, by Using Remote Sensing ABSTRACT
 1 Mapping Land Cover Patterns of Gunma Prefecture, Japan, by Using Remote Sensing Zhaohui Deng, Yohei Sato, Hua Jia Department of Biological and Environmental Engineering, Graduate School of Agricultural
Classification Problems
 Classification Read Chapter 4 in the text by Bishop, except omit Sections 4.1.6, 4.1.7, 4.2.4, 4.3.3, 4.3.5, 4.3.6, 4.4, and 4.5. Also, review sections 1.5.1, 1.5.2, 1.5.3, and 1.5.4. Classification Problems
Data Mining. Cluster Analysis: Advanced Concepts and Algorithms
 Data Mining Cluster Analysis: Advanced Concepts and Algorithms Tan,Steinbach, Kumar Introduction to Data Mining 4/18/2004 1 More Clustering Methods Prototype-based clustering Density-based clustering Graph-based
Classifying Manipulation Primitives from Visual Data
 Classifying Manipulation Primitives from Visual Data Sandy Huang and Dylan Hadfield-Menell Abstract One approach to learning from demonstrations in robotics is to make use of a classifier to predict if
Comparison of Non-linear Dimensionality Reduction Techniques for Classification with Gene Expression Microarray Data
 CMPE 59H Comparison of Non-linear Dimensionality Reduction Techniques for Classification with Gene Expression Microarray Data Term Project Report Fatma Güney, Kübra Kalkan 1/15/2013 Keywords: Non-linear
Big Ideas in Mathematics
 Big Ideas in Mathematics which are important to all mathematics learning. (Adapted from the NCTM Curriculum Focal Points, 2006) The Mathematics Big Ideas are organized using the PA Mathematics Standards
MVA ENS Cachan. Lecture 2: Logistic regression & intro to MIL Iasonas Kokkinos Iasonas.kokkinos@ecp.fr
 Machine Learning for Computer Vision 1 MVA ENS Cachan Lecture 2: Logistic regression & intro to MIL Iasonas Kokkinos Iasonas.kokkinos@ecp.fr Department of Applied Mathematics Ecole Centrale Paris Galen
Topographic Change Detection Using CloudCompare Version 1.0
 Topographic Change Detection Using CloudCompare Version 1.0 Emily Kleber, Arizona State University Edwin Nissen, Colorado School of Mines J Ramón Arrowsmith, Arizona State University Introduction CloudCompare
Local outlier detection in data forensics: data mining approach to flag unusual schools
 Local outlier detection in data forensics: data mining approach to flag unusual schools Mayuko Simon Data Recognition Corporation Paper presented at the 2012 Conference on Statistical Detection of Potential
Myths and misconceptions about remote sensing
 Myths and misconceptions about remote sensing Ned Horning (graphics support - Nicholas DuBroff) Version: 1.0 Creation Date: 2004-01-01 Revision Date: 2004-01-01 License: This document is licensed under
The Data Mining Process
 Sequence for Determining Necessary Data. Wrong: Catalog everything you have, and decide what data is important. Right: Work backward from the solution, define the problem explicitly, and map out the data
Ring grave detection in high resolution satellite images of agricultural land
 Ring grave detection in high resolution satellite images of agricultural land Siri Øyen Larsen, Øivind Due Trier, Ragnar Bang Huseby, and Rune Solberg, Norwegian Computing Center Collaborators: The Norwegian
DATA MINING TECHNIQUES AND APPLICATIONS
 DATA MINING TECHNIQUES AND APPLICATIONS Mrs. Bharati M. Ramageri, Lecturer Modern Institute of Information Technology and Research, Department of Computer Application, Yamunanagar, Nigdi Pune, Maharashtra,
Linear Discrimination. Linear Discrimination. Linear Discrimination. Linearly Separable Systems Pairwise Separation. Steven J Zeil.
 Steven J Zeil Old Dominion Univ. Fall 200 Discriminant-Based Classification Linearly Separable Systems Pairwise Separation 2 Posteriors 3 Logistic Discrimination 2 Discriminant-Based Classification Likelihood-based:
TDA and Machine Learning: Better Together
 TDA and Machine Learning: Better Together TDA AND MACHINE LEARNING: BETTER TOGETHER 2 TABLE OF CONTENTS The New Data Analytics Dilemma... 3 Introducing Topology and Topological Data Analysis... 3 The Promise
Comparative Analysis of EM Clustering Algorithm and Density Based Clustering Algorithm Using WEKA tool.
 International Journal of Engineering Research and Development e-issn: 2278-067X, p-issn: 2278-800X, www.ijerd.com Volume 9, Issue 8 (January 2014), PP. 19-24 Comparative Analysis of EM Clustering Algorithm
An Overview of Knowledge Discovery Database and Data mining Techniques
 An Overview of Knowledge Discovery Database and Data mining Techniques Priyadharsini.C 1, Dr. Antony Selvadoss Thanamani 2 M.Phil, Department of Computer Science, NGM College, Pollachi, Coimbatore, Tamilnadu,
Introduction to data mining. Example of remote sensing image analysis
 Ocean's Big Data Mining, 2014 (Data mining in large sets of complex oceanic data: new challenges and solutions) 8-9 Sep 2014 Brest (France) Monday, September 8, 2014, 4:00 pm - 5:30 pm Introduction to
Machine Learning: Overview
 Machine Learning: Overview Why Learning? Learning is a core of property of being intelligent. Hence Machine learning is a core subarea of Artificial Intelligence. There is a need for programs to behave
Image Analysis CHAPTER 16 16.1 ANALYSIS PROCEDURES
 CHAPTER 16 Image Analysis 16.1 ANALYSIS PROCEDURES Studies for various disciplines require different technical approaches, but there is a generalized pattern for geology, soils, range, wetlands, archeology,
CI6227: Data Mining. Lesson 11b: Ensemble Learning. Data Analytics Department, Institute for Infocomm Research, A*STAR, Singapore.
 CI6227: Data Mining Lesson 11b: Ensemble Learning Sinno Jialin PAN Data Analytics Department, Institute for Infocomm Research, A*STAR, Singapore Acknowledgements: slides are adapted from the lecture notes
Distances, Clustering, and Classification. Heatmaps
 Distances, Clustering, and Classification Heatmaps 1 Distance Clustering organizes things that are close into groups What does it mean for two genes to be close? What does it mean for two samples to be