The Effect of Rising Sea Levels on the Greater Houston Area, Texas
|
|
|
- Wilfrid Phillip Tyler
- 7 years ago
- Views:
Transcription
1 The Effect of Rising Sea Levels on the Greater Houston Area, Texas Tim Prather Geo 327G 12/5/2013
2 Problem: The city of Houston and the surrounding suburbs and metropolitan area is home to approximately 6 million inhabitants and serves a major hub for communication, petroleum refining, and business for the United States Gulf Coast Region. Recent global temperature fluctuations and subsequent melting of polar and other continental ice sheets have resulted in a rise in sea levels, threatening populations and urban centers situated near shorelines at relatively low elevations. Sitting at an elevation of just 13 meters above present day sea level, the Houston metropolitan region may be affected by the predicted rises in sea level, over the next century, which may reach a maximum height of up to 6 meters above present day levels. Goal: Produce a map of the Texas coast highlighting the Houston metro region using GIS techniques and spatial analysis to assess how various sea level rises may affect the city. Using raster data to create elevation models, satellite imagery, and state population data an accurate hazard map can be produced. Data Sources: - acquired shape-files for population extent and statistics for the Houston metro area. source of background imagery and DEM grids
3 Methods: 1) Adding the downloaded data to a blank map in ArcMap 10, and establishing a folder workspace for all of my data. Data loaded: Rasters: grdn31w097_1, grdn31w096_1, grdn30w096_1, grdn31w095_1, grdn30w097_1, grdn30w095_1, grdn29w097_1, grdn29w096_1 Compressed SID mulitband image: N-15-25_30_loc.sid Figure 1. The added satellite imagery and DEM rasters. The DEMs must be stitched together using the mosaic tool to make any sense of them.
 This tool stitches together the different DEM rasters into one raster.")
4 2) Stitching the rasters together and inputting the correct parameters so it comes out with the same cellsize and bit type as the original rasters. Figure 2. (ArcToolbox > Data Management > Raster > Raster Dataset > Mosaic to New Raster) This tool stitches together the different DEM rasters into one raster. 3) I then moved this DEM behind the imagery photo by moving it below that file in the TOC and set the transparency of the imagery to 50%. This allows me to visualize the DEM under the actual imagery of the region.

5 Figure 3. The finished mosaic of the raster data sets. 4) Setting the coordinate system spatial reference of the mosaicked DEM and imagery to the same reference of WGS 1984 UTM Zone 15N.prj and the datum to D_WGS_1984. This will also change the units of the DEM to meters, which is the unit I would prefer to work with. I accomplished this using the Project Raster tool, setting a new cell size to 30 m, and using the geographic transformation: NAD_1983_To_WGS_1984_1. I also used a bilinear resampling technique, rather than nearest neighbor, because I was not working with a categorical raster, but with continuous data.
 This shows the required input parameters to project my DEM raster to the same coordinate system as my")
6 Figure 4. (ArcToolbox > Data Management > Projections and Transformations > Raster > Project Raster) This shows the required input parameters to project my DEM raster to the same coordinate system as my imagery. 5) Changing the symbology of the mosaic to an equal interval classification to display the data in a more manageable way and so elevation contours are grouped together. During this step I was also able to calculate a mean height for my DEM, which was 32 meters.
 After moving things around in my TOC some more it was time to clip the DEM to the size of the satellite image to remove the edges that went beyond the bounds of the image, then do the same thing")
7 Figure 5. Changing the symbology. 6) After moving things around in my TOC some more it was time to clip the DEM to the size of the satellite image to remove the edges that went beyond the bounds of the image, then do the same thing for the image by clipping to the bounds of the DEM. This will establish my study area in a box. However, because the imagery photo did not lend itself to any type of clipping tools in the ArcToolbox I was forced to circumvent any traditional approach and create a clipping rectangle in the editor to create the bounds of my study area. 7) I created a new Personal GeoDatabase and feature class, in ArcCatalog, for the rectangle in the same coordinate system as the rest of my data and drew it around the bounds of my study area.

8 Figure 6. Creating the PGD and feature class. Figure 7. Drawing the bounding rectangle that I will use to clip the DEM and imagery to.
 Using the clip tool to bound the DEM, the same procedure was utilized for")
9 Figure 8. (ArcToolbox > Data Management > Raster > Raster Processing > Clip) Using the clip tool to bound the DEM, the same procedure was utilized for the satellite image, though for the image it clipped each band of the multi-band image at a time. Figure 9. The product of clipping.

10 8) Next I added the shapefiles I downloaded containing the population data for the Houston Metro Area so when I create the DEM of the predicted rises in sea level we can visualize what regions will be affected. These shapefiles are projected on the fly by ArcGIS. Figure 10. The product of clipping. The Houston metro region shown in green. The TOC indicates the name of the shapefile by region (ex. Brazoria poly, or Galveston poly). 9) I then created a zero elevation contour to show present day sea level and a binary raster of all values from my DEM that were below 0 meters above sea level to represent water.
 Creating a sea level contour, 200 m interval to cover the highest")
11 Figure 11. ( ArcToolbox > Spatial Analyst > Map Algebra > Raster Calculator) Binary Raster. Figure 12. ( ArcToolbox > Spatial Analyst > Surface > Contour) Creating a sea level contour, 200 m interval to cover the highest point in the DEM.
 I then used the raster calculator to subtract 2 meters to 6 meters ( in 2 m intervals) to model sea level rise and repeated the process of creating a new shoreline from the new zero level")
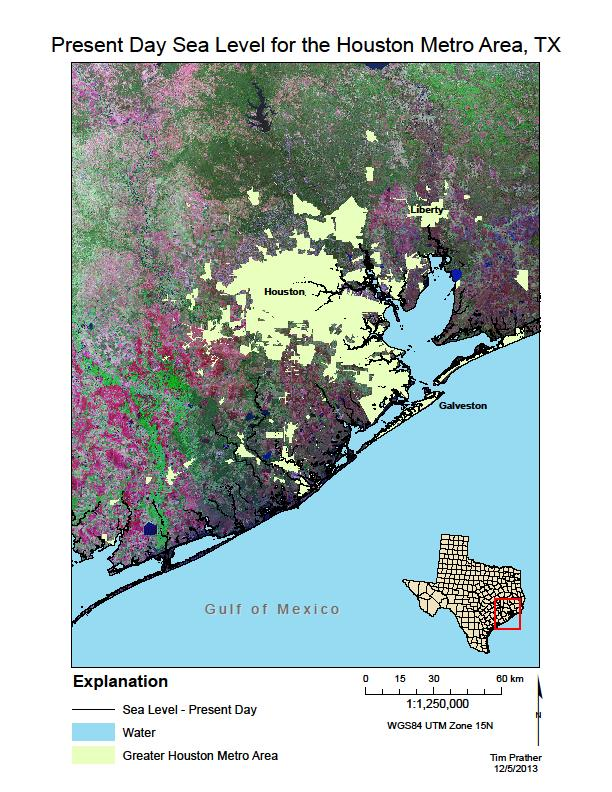
12 Figure 13. The binary raster and sea level contour. 10) I then used the raster calculator to subtract 2 meters to 6 meters ( in 2 m intervals) to model sea level rise and repeated the process of creating a new shoreline from the new zero level contour and a new sea extent using a binary raster for each case. 11) The final products are shown as maps with appropriate markup in the last 4 pages.

13 Figure 14. (ArcToolbox > Spatial Analyst > Map Algebra > Raster Calculator) Creating the new sea level by subtracting 2-6 meters. Conclusion: ArcMap has allowed me to create a series of maps illustrating the impact of rising sea level on coastal Texas urban centers. By combining raster and vector data, and utilizing the wide range of tools in ArcToolbox, I have provided an accurate hazard map for the region should the rate of current sea level rise remain the same or accelerate over the next century. These final maps display present day sea level and subsequent rise in 2 meter intervals. In this series Galveston and Matagorda islands are entirely submerged and the coastal regions of Houston are obliterated by the Gulf of Mexico. This major population, transportation, and production hub of the world should plan for the eventual rise in sea level to remain as such.
14
15
16
17
Raster: The Other GIS Data
 04-Raster_Tutorial_Arcgis_93.Doc Page 1 of 11 Raster: The Other GIS Data Objectives Understand the raster format and how it is used to model continuous geographic phenomena Understand how projections &
Geography 3251: Mountain Geography Assignment III: Natural hazards A Case Study of the 1980s Mt. St. Helens Eruption
 Name: Geography 3251: Mountain Geography Assignment III: Natural hazards A Case Study of the 1980s Mt. St. Helens Eruption Learning Objectives: Assigned: May 30, 2012 Due: June 1, 2012 @ 9 AM 1. Learn
How To Hydrologically Condition A Digital Dam
 Program: Funding: Conservation Applications of LiDAR Data http://tsp.umn.edu/lidar Environment and Natural Resources Trust Fund Module: Instructor: Hydrologic Applications Sean Vaughn, DNR GIS Hydrologist
ANALYSIS 3 - RASTER What kinds of analysis can we do with GIS?
 ANALYSIS 3 - RASTER What kinds of analysis can we do with GIS? 1. Measurements 2. Layer statistics 3. Queries 4. Buffering (vector); Proximity (raster) 5. Filtering (raster) 6. Map overlay (layer on layer
Introduction to Imagery and Raster Data in ArcGIS
 Esri International User Conference San Diego, California Technical Workshops July 25, 2012 Introduction to Imagery and Raster Data in ArcGIS Simon Woo slides Cody Benkelman - demos Overview of Presentation
Effects of Florida Under a 10 Meter Sea Level Rise
 Effects of Florida Under a 10 Meter Sea Level Rise Chance B. Murray Dec. 7 2009 I. Goal Assess the effects a 10 meter sea level rise would have on Florida. Mission: Determine the length of Florida s coastline
Data source, type, and file naming convention
 Exercise 1: Basic visualization of LiDAR Digital Elevation Models using ArcGIS Introduction This exercise covers activities associated with basic visualization of LiDAR Digital Elevation Models using ArcGIS.
GEOGRAPHIC INFORMATION SYSTEMS Lecture 20: Adding and Creating Data
 Adding Existing Data Into ArcGIS - there are many different ways to get data into ArcGIS GEOGRAPHIC INFORMATION SYSTEMS Lecture 20: Adding and Creating Data Add Data - normally we use the Add Data button
Tutorial 8 Raster Data Analysis
 Objectives Tutorial 8 Raster Data Analysis This tutorial is designed to introduce you to a basic set of raster-based analyses including: 1. Displaying Digital Elevation Model (DEM) 2. Slope calculations
University of Arkansas Libraries ArcGIS Desktop Tutorial. Section 4: Preparing Data for Analysis
 : Preparing Data for Analysis When a user acquires a particular data set of interest, it is rarely in the exact form that is needed during analysis. This tutorial describes how to change the data to make
Create a folder on your network drive called DEM. This is where data for the first part of this lesson will be stored.
 In this lesson you will create a Digital Elevation Model (DEM). A DEM is a gridded array of elevations. In its raw form it is an ASCII, or text, file. First, you will interpolate elevations on a topographic
Introduction to GIS. http://libguides.mit.edu/gis
 Introduction to GIS http://libguides.mit.edu/gis 1 Overview What is GIS? Types of Data and Projections What can I do with GIS? Data Sources and Formats Software Data Management Tips 2 What is GIS? 3 Characteristics
INSTRUCTIONS FOR MAKING 3D,.DWG CONTOUR LINES
 INSTRUCTIONS FOR MAKING 3D,.DWG CONTOUR LINES A TUTORIAL FROM SPATIAL AND NUMERIC DATA SERVICES NICOLE SCHOLTZ AND GEOFF IVERSON Overview... 2 A. Get a Digital Elevation Model (DEM)... 3 B. Open ArcMap,
Managing Imagery and Raster Data in ArcGIS
 Technical Workshops Managing Imagery and Raster Data in ArcGIS Hong Xu, Sangeet Mathew, Mark Harris Presentation Overview ArcGIS raster data models Which model to use Mosaic dataset storage and properties
A Tutorial for New Users of the Marine Data Model. Alyssa Aaby, Dawn Wright Oregon State University
 A Tutorial for New Users of the Marine Data Model Alyssa Aaby, Dawn Wright Oregon State University Tutorial Purpose Assist in simple data entry into MDM Starting point for project work or specific database
Government 98dn Mapping Social and Environmental Space
 Government 98dn Mapping Social and Environmental Space LAB EXERCISE 5: The Analysis of Fields Objectives of this lab: Visualizing raster data Using Spatial Analyst functions to create new data Analysis
INTRODUCTION TO ARCGIS SOFTWARE
 INTRODUCTION TO ARCGIS SOFTWARE I. History of Software Development a. Developer ESRI - Environmental Systems Research Institute, Inc., in 1969 as a privately held consulting firm that specialized in landuse
ArcFuels Supplemental Material: GIS 9.x Tips and Tricks
 ArcFuels Supplemental Material: GIS 9.x Tips and Tricks Supplemental material: GIS Tips and Tricks... 1 Shapefiles: Points, Lines, and Polygons... 2 Creating a New Shapefile (point, line, or polygon)...
Government 1008: Introduction to Geographic Information Systems. LAB EXERCISE 4: Got Database?
 Government 1008: Introduction to Geographic Information Systems Objectives: Creating geodatabases Joining attribute tables Attribute and location based queries Spatial joins Creating spatial and attribute
WFP Liberia Country Office
 1 Oscar Gobbato oscar.gobbato@wfp.org oscar.gobbato@libero.it WFP Liberia Country Office GIS training - Summary Objectives 1 To introduce to participants the basic concepts and techniques in using Geographic
Working with Digital Elevation Models and Digital Terrain Models in ArcMap 9
 Working with Digital Elevation Models and Digital Terrain Models in ArcMap 9 1 TABLE OF CONTENTS INTRODUCTION...3 WORKING WITH DIGITAL TERRAIN MODEL (DTM) DATA FROM NRVIS, CITY OF KITCHENER, AND CITY OF
Syllabus AGET 782. GIS for Agricultural and Natural Resources Management
 Syllabus AGET 782 Course Title: GIS for Agricultural and Natural Resources Management Course Abbreviation: AGET 782 Course Credits: Instructor: Course Description: Required Text: 3 hours Timothy N. Burcham,
A GIS helps you answer questions and solve problems by looking at your data in a way that is quickly understood and easily shared.
 A Geographic Information System (GIS) integrates hardware, software, and data for capturing, managing, analyzing, and displaying all forms of geographically referenced information. GIS allows us to view,
Government 1009: Advanced Geographical Information Systems Workshop. LAB EXERCISE 3b: Network
 Government 1009: Advanced Geographical Information Systems Workshop LAB EXERCISE 3b: Network Objective: Using the Network Analyst in ArcGIS Implementing a network functionality as a model In this exercise,
Tutorial. VISUALIZATION OF TERRA-i DETECTIONS
 VISUALIZATION OF TERRA-i DETECTIONS. Suggested citation: PAZ-GARCIA, P. & COCA-CASTRO, A. (2014) Visualization of Terra-i detections. for the Terra-i project. Version 2. Getting started Before beginning,
Working with the Raster Calculator
 Working with the Raster Calculator The Raster Calculator provides you a powerful tool for performing multiple tasks. You can perform mathematical calculations using operators and functions, set up selection
Finding GIS Data and Preparing it for Use
 Finding_Data_Tutorial.Doc Page 1 of 19 Getting Ready for the Tutorial Sign Up for the GIS-L Listserv Finding GIS Data and Preparing it for Use The Yale University GIS-L Listserv is an internal University
Raster to Vector Conversion for Overlay Analysis
 Raster to Vector Conversion for Overlay Analysis In some cases, it may be necessary to perform vector-based analyses on a raster data set, or vice versa. The types of analyses that can be performed on
Online Digitizing and Editing of GIS Layers (On-Screen or Head s Up Digitizing)
") Online Digitizing and Editing of GIS Layers (On-Screen or Head s Up Digitizing) 2011 Charlie Schweik, Alexander Stepanov, Maria Fernandez, Lara Aniskoff Note: This work is licensed under the Creative Commons
Online Digitizing and Editing of GIS Layers (On-Screen or Head s Up Digitizing) 2011 Charlie Schweik, Alexander Stepanov, Maria Fernandez, Lara Aniskoff Note: This work is licensed under the Creative Commons
Tutorial 3 - Map Symbology in ArcGIS
 Tutorial 3 - Map Symbology in ArcGIS Introduction ArcGIS provides many ways to display and analyze map features. Although not specifically a map-making or cartographic program, ArcGIS does feature a wide
Introduction to the ArcGIS Data Model and Application Structure
 Introduction to the ArcGIS Data Model and Application Structure RNR/GEOG 417/517 Lab 6 Presentation Overview The georelational data model Structure of ArcGIS software Structure of an ArcGIS workspace Demonstrations/previews
GIS EXAM #2 QUERIES. Attribute queries only looks at the records in the attribute tables to some kind of
 GIS EXAM #2 QUERIES - Queries extracts particular records from a table or feature class for use; - Queries are an essential aspect of GIS analysis, and allows us to interrogate a dataset and look for patterns;
A Method Using ArcMap to Create a Hydrologically conditioned Digital Elevation Model
 A Method Using ArcMap to Create a Hydrologically conditioned Digital Elevation Model High resolution topography derived from LiDAR data is becoming more readily available. This new data source of topography
What is GIS. What is GIS? University of Tsukuba. What do you image of GIS? Copyright(C) ESRI Japan Corporation. All rights reserved.
 ESRI Japan Corporation. All rights reserved.") What is GIS University of Tsukuba Graduate School of Life and Environmental Science April 21 st, 2011 What is GIS? What do you image of GIS? Gas Insulated Switch Groupe Interventional Speciale Geographic
What is GIS University of Tsukuba Graduate School of Life and Environmental Science April 21 st, 2011 What is GIS? What do you image of GIS? Gas Insulated Switch Groupe Interventional Speciale Geographic
Data Visualization. Prepared by Francisco Olivera, Ph.D., Srikanth Koka Department of Civil Engineering Texas A&M University February 2004
 Data Visualization Prepared by Francisco Olivera, Ph.D., Srikanth Koka Department of Civil Engineering Texas A&M University February 2004 Contents Brief Overview of ArcMap Goals of the Exercise Computer
MrSID Plug-in for 3D Analyst
 LizardTech MrSID Plug-in for 3D Analyst User Manual Copyrights Copyright 2009 2010 LizardTech. All rights reserved. Information in this document is subject to change without notice. The software described
Understanding Raster Data
 Introduction The following document is intended to provide a basic understanding of raster data. Raster data layers (commonly referred to as grids) are the essential data layers used in all tools developed
Exer. 1 Using Handheld GPS for location & recording points
 Exer. 1 Using Handheld GPS for location & recording points Field Objectives: 1. Familiarity with handheld receivers (Trimble Juno) 2. Basic positioning in Lat/Long and UTM 3. Familiarity with changing
Raster Tutorial. Copyright 1995-2010 Esri All rights reserved.
 Copyright 1995-2010 Esri All rights reserved. Table of Contents Introduction to the ArcGIS raster tutorial......................... 3 Exercise 1: Creating a mosaic dataset.......................... 4 Exercise
What do I do first in ArcView 8.x? When the program starts Select from the Dialog box: A new empty map
 www.library.carleton.ca/find/gis Introduction Introduction to Georeferenced Images using ArcGIS Georeferenced images such as aerial photographs or satellite images can be used in many ways in both GIS
Tutorial 6 GPS/Point Shapefile Creation
 Tutorial 6 GPS/Point Shapefile Creation The objectives of this tutorial include: 1. Converting GPS field collected point information into a shapefile 2. Creating a shapefile from a simple x,y coordinate
Using ArcGIS ModelBuilder to batch process files
 The ArcGIS Model Builder is a tool you can use to help process a large number of files in an automated fashion. To open a new ModelBuilder document, either choose ModelBuilder from the Geoprocessing menu,
Exercise 3: Building a GIS data library
 The Scenario You are preparing for an interview for a GIS position for a particular county. They asked that you present a GIS demonstration as part of your interviewing process. You decide to develop a
Getting Started with the ArcGIS Predictive Analysis Add-In
 Getting Started with the ArcGIS Predictive Analysis Add-In Table of Contents ArcGIS Predictive Analysis Add-In....................................... 3 Getting Started 4..............................................
v Software Release Notice -. Acquired Software
 v Software Release Notice -. Acquired Software 1. Software Name: Software Version: ArcView GIs@ 3.3 2. Software Function: ArcView GIS 3.3, developed by Environmental Systems Research Institute, Inc. (ESRI@),
Mosaicking and Subsetting Images
 Mosaicking and Subsetting Images Using SAGA GIS Tutorial ID: IGET_RS_005 This tutorial has been developed by BVIEER as part of the IGET web portal intended to provide easy access to geospatial education.
A Workflow for Creating and Sharing Maps
 A Workflow for Creating and Sharing Maps By Keith Mann, Esri What You Will Need Item Source ArcGIS Online for Organizations subscription ArcGIS 10.1 for Desktop (Any license level) ArcGIS Spatial Analyst
Providing the Public with Data Visualization using Google Maps
 GIS - T March 30 th, 2011 Providing the Public with Data Visualization using Google Maps Patrick Kielty and Matt Allen Pennsylvania Department of Transportation Purpose Quickly and Easily create web based
ArcGIS. Image Server tutorial
 ArcGIS 9 ArcGIS Image Server tutorial Copyright 2006, 2007, and 2008 Zanja Technologies, Inc. All rights reserved. The information contained in this work is the property of Zanja Technologies, Inc., under
Advanced Image Management using the Mosaic Dataset
 Esri International User Conference San Diego, California Technical Workshops July 25, 2012 Advanced Image Management using the Mosaic Dataset Vinay Viswambharan, Mike Muller Agenda ArcGIS Image Management
Digital Terrain Model Grid Width 10 m DGM10
 Digital Terrain Model Grid Width 10 m Status of documentation: 23.02.2015 Seite 1 Contents page 1 Overview of dataset 3 2 Description of the dataset contents 4 3 Data volume 4 4 Description of the data
How to georectify an image in ArcMap 10
 How to georectify an image in ArcMap 10 The University Library has a large collection of historical aerial photos for some North Carolina Counties ( http://www.lib.unc.edu/reference/gis/usda/index.html
ArcGIS Reference Document
 Migration of GIS Data to ArcSDE Page 1 of 10 Table of Contents A Brief Summary of DEP s GIS Data Storage o The Y Drive o ArcSDE (Spatial Database) Keeping Your GIS Project Data Current o Checking Your
Relating Land Cover Changes to Stream Water Quality in North Carolina
 Relating Land Cover Changes to Stream Water Quality in North Carolina STUDENT HANDOUT! Central Question How has land cover within Long Creek Watershed in Charlotte, NC changed between 1988 and 2008? Overview
Geographic Information Systems Training Module I through 4
 Geographic Information Systems Training Module I through 4 ARC GIS 10.x Geographic Information Systems and GPS Training Guide Developed by Stephen P. Menard Jr, USAID/Malawi Program Officer - Original
Creating a File Geodatabase
 Creating a File Geodatabase Updated by Thomas Stieve January 06, 2012 This exercise demonstrates how to create a file geodatabase in ArcGIS 10; how to import existing data into the geodatabase, and how
RS/GIS Quick Start Guides Collaborative training materials available from the Biodiversity Informatics & Geospatial Innovation Facilities
 http://gif.berkeley.edu Collaborative training materials available from the Biodiversity Informatics & Geospatial Innovation Facilities http://biodiversityinformatics.amnh.org Using the ArcMap model builder
ADWR GIS Metadata Policy
 ADWR GIS Metadata Policy 1 PURPOSE OF POLICY.. 3 INTRODUCTION.... 4 What is metadata?... 4 Why is it important? 4 When to fill metadata...4 STANDARDS. 5 FGDC content standards for geospatial metadata...5
Spatial Database Support
 Page 1 of 11 Spatial Database Support Global Mapper can import vector data from and export vector data to the following spatial databases: Esri ArcSDE Geodatabase Esri File Geodatabase Esri Personal Geodatabases
A Brief Explanation of Basic Web Services
 A Brief Explanation of Basic Web Services What is REST? REpresentational State Transfer (REST) is a way for software to work when distributed across a network. For example, if I want to view the Iowa Dept
GIS I Business Exr02 (av 9-10) - Expand Market Share (v3b, Jul 2013)
 - Expand Market Share (v3b, Jul 2013)") GIS I Business Exr02 (av 9-10) - Expand Market Share (v3b, Jul 2013) Learning Objectives: Reinforce information literacy skills Reinforce database manipulation / querying skills Reinforce joining and mapping
GIS I Business Exr02 (av 9-10) - Expand Market Share (v3b, Jul 2013) Learning Objectives: Reinforce information literacy skills Reinforce database manipulation / querying skills Reinforce joining and mapping
GEOREFERENCING HISTORIC MAPS USING ARCGIS DESKTOP 10
 5/20/2011 BALL STATE UNIVERSITY LIBRARIES GIS RESEARCH AND MAP COLLECTION GEOREFERENCING HISTORIC MAPS USING ARCGIS DESKTOP 10 GEOREFERENCING HISTORIC MAPS USING ARCGIS DESKTOP 10 *This tutorial is appropriate
Spatial Analyst Tutorial
 Copyright 1995-2010 Esri All rights reserved. Table of Contents About the ArcGIS Spatial Analyst Tutorial......................... 3 Exercise 1: Preparing for analysis............................ 5 Exercise
What is GIS? Geographic Information Systems. Introduction to ArcGIS. GIS Maps Contain Layers. What Can You Do With GIS? Layers Can Contain Features
 What is GIS? Geographic Information Systems Introduction to ArcGIS A database system in which the organizing principle is explicitly SPATIAL For CPSC 178 Visualization: Data, Pixels, and Ideas. What Can
WHAT IS GIS - AN INRODUCTION
 WHAT IS GIS - AN INRODUCTION GIS DEFINITION GIS is an acronym for: Geographic Information Systems Geographic This term is used because GIS tend to deal primarily with geographic or spatial features. Information
Cookbook 23 September 2013 GIS Analysis Part 1 - A GIS is NOT a Map!
 Cookbook 23 September 2013 GIS Analysis Part 1 - A GIS is NOT a Map! Overview 1. A GIS is NOT a Map! 2. How does a GIS handle its data? Data Formats! GARP 0344 (Fall 2013) Page 1 Dr. Carsten Braun 1) A
The Courses. Covering complete breadth of GIS technology from ESRI including ArcGIS, ArcGIS Server and ArcGIS Engine.
 ESRI India: Corporate profile ESRI India A profile India s Premier GIS Company Strategic alliance between ESRI Inc. and NIIT Technologies Adjudged as India s Best GIS Solutions Company - Map India 2001
CityGML goes to Broadway
 CityGML goes to Broadway Thomas H. Kolbe, Barbara Burger, Berit Cantzler Chair of Geoinformatics thomas.kolbe@tum.de September 11, 2015 Photogrammetric Week 2015, Stuttgart The New York City Open Data
ES341 Overview of key file formats and file extensions in ArcGIS
 ES341 Overview of key file formats and file extensions in ArcGIS Commonly Encountered File Types/Extensions in ArcGIS.mxd A file containing a map, its layers, display information, and other elements used
Modeling Fire Hazard By Monica Pratt, ArcUser Editor
 By Monica Pratt, ArcUser Editor Spatial modeling technology is growing like wildfire within the emergency management community. In areas of the United States where the population has expanded to abut natural
Geographic Information Systems (GIS) @ GIS at UCSD. Here to help you explore our world
 @ GIS at UCSD. Here to help you explore our world") Geographic Information Systems (GIS) @ GIS at UCSD Here to help you explore our world GIS at UCSD what it is and what it means to you Tracey Hughes UCSD GIS Coordinator 2006 Image from Google Earth An
Geographic Information Systems (GIS) @ GIS at UCSD Here to help you explore our world GIS at UCSD what it is and what it means to you Tracey Hughes UCSD GIS Coordinator 2006 Image from Google Earth An
Creating Geoprocessing Services Tutorial
 Creating Geoprocessing Services Tutorial Copyright 1995-2010 Esri All rights reserved. Table of Contents Guide to the geoprocessing service examples....................... 3 GP service step by step: Buffer
DATA VISUALIZATION GABRIEL PARODI STUDY MATERIAL: PRINCIPLES OF GEOGRAPHIC INFORMATION SYSTEMS AN INTRODUCTORY TEXTBOOK CHAPTER 7
 DATA VISUALIZATION GABRIEL PARODI STUDY MATERIAL: PRINCIPLES OF GEOGRAPHIC INFORMATION SYSTEMS AN INTRODUCTORY TEXTBOOK CHAPTER 7 Contents GIS and maps The visualization process Visualization and strategies
Spatially Enabling SharePoint
 www.environment.gov.au/ssd Spatially Enabling SharePoint Renee Bartolo Program Leader, Spatial Sciences and Data Integration Supervising Scientist - working to protect the environment from the impacts
Coastal Engineering Indices to Inform Regional Management
 Coastal Engineering Indices to Inform Regional Management Lauren Dunkin FSBPA 14 February 2013 Outline Program overview Standard products Coastal Engineering Index Conclusion and future work US Army Corps
Converting GIS Datasets into CAD Format
 Ball State University Libraries GIS Research and Map Collection Converting GIS Datasets into CAD Format Author: Angela Gibson, 6/13/2014 Overview: One of the most common requests from students is for GIS
GIS Data Quality and Evaluation. Tomislav Sapic GIS Technologist Faculty of Natural Resources Management Lakehead University
 GIS Data Quality and Evaluation Tomislav Sapic GIS Technologist Faculty of Natural Resources Management Lakehead University The quality of GIS data gains in importance when considering some of the main
Lecture 3: Models of Spatial Information
 Lecture 3: Models of Spatial Information Introduction In the last lecture we discussed issues of cartography, particularly abstraction of real world objects into points, lines, and areas for use in maps.
Using CAD Data in ArcGIS
 Esri International User Conference San Diego, California Technical Workshops July 27, 2012 Using CAD Data in ArcGIS Jeff Reinhart & Phil Sanchez Agenda Overview of ArcGIS CAD Support Using CAD Datasets
GIS Data in ArcGIS. Pay Attention to Data!!!
 GIS Data in ArcGIS Pay Attention to Data!!! 1 GIS Data Models Vector Points, lines, polygons, multi-part, multi-patch Composite & secondary features Regions, dynamic segmentation (routes) Raster Grids,
Coastal Flooding Analysis Eric B. Grosfils, Geology Department, Pomona College
 Coastal Flooding Analysis Eric B. Grosfils, Geology Department, Pomona College OVERVIEW In the aftermath of the deadly Indian Ocean tsunami induced by a magnitude 9.0 earthquake off the shore of Sumatra
Remote Sensing, GPS and GIS Technique to Produce a Bathymetric Map
 Remote Sensing, GPS and GIS Technique to Produce a Bathymetric Map Mark Schnur EES 5053 Remote Sensing Fall 2007 University of Texas at San Antonio, Department of Earth and Environmental Science, San Antonio,
ERCB/AGS Information Series 136. Digital Mapping and 3D Visualization/ Modelling of Subsurface Geology Using ArcGIS 9.2 and Well Log Data
 ERCB/AGS Information Series 136 Digital Mapping and 3D Visualization/ Modelling of Subsurface Geology Using ArcGIS 9.2 and Well Log Data ERCB/AGS Information Series 136 Digital Mapping and 3D Visualization/Modelling
GIS Architecture and Data Management Practices Boone County GIS Created and Maintained by the Boone County Planning Commission GIS Services Division
 GIS Architecture and Data Management Practices Boone County GIS Created and Maintained by the Boone County Planning Commission June 2008 Background Boone County s GIS program has been in existence for
Under GIS Data select Hydrography This will show all of the state-wide options for hydrography data. For this project, we want the seventh entry in
 Introductory Exercises for GIS Using ArcMap & ArcCatalog GIS Cyberinfrastructure Module EEB 5894, section 10 Please refer to the ESRI online GIS Dictionary for additional details on any of the terms in
3D VISUALIZATION OF GEOTHERMAL WELLS DIRECTIONAL SURVEYS AND INTEGRATION WITH DIGITAL ELEVATION MODEL (DEM)
") Presented at Short Course VII on Exploration for Geothermal Resources, organized by UNU-GTP, GDC and KenGen, at Lake Bogoria and Lake Naivasha, Kenya, Oct. 27 Nov. 18, 2012. GEOTHERMAL TRAINING PROGRAMME
Presented at Short Course VII on Exploration for Geothermal Resources, organized by UNU-GTP, GDC and KenGen, at Lake Bogoria and Lake Naivasha, Kenya, Oct. 27 Nov. 18, 2012. GEOTHERMAL TRAINING PROGRAMME
June, 2006 Tutorial: Create map with multiple views and data layers using ArcMap GIS 9.0
 June, 2006 Tutorial: Create map with multiple views and data layers using ArcMap GIS 9.0 This presentation demonstrates how to create a publication-quality map illustration consisting of three panes or
Working with climate data and niche modeling I. Creation of bioclimatic variables
 Working with climate data and niche modeling I. Creation of bioclimatic variables Julián Ramírez-Villegas 1 and Aaron Bueno-Cabrera 2 1 International Centre for Tropical Agriculture (CIAT), Cali, Colombia,
ArcGIS Data Models Practical Templates for Implementing GIS Projects
 ArcGIS Data Models Practical Templates for Implementing GIS Projects GIS Database Design According to C.J. Date (1995), database design deals with the logical representation of data in a database. The
GIS Beyond the Basics: Web Maps and File Sharing Services
 GIS Beyond the Basics: Web Maps and File Sharing Services by Julie Coco, PE I. INTRODUCING WEB-BASED GIS SERVICES A GIS service, or Geoservice, provides a way to retrieve maps, images, or geoprocessing
ArcScan Tutorial. Copyright 1995-2010 Esri All rights reserved.
 Copyright 1995-2010 Esri All rights reserved. Table of Contents Exercise 1: Interactive vectorization........................... 3 Exercise 2: Automatic vectorization........................... 12 Copyright
Getting Started With LP360
 Getting Started With LP360 10/30/2014 1 Contents What is LP360?... 3 System Requirements... 3 Installing LP360... 4 How to Enable the LP360 Extension... 4 How to Display the LP360 Toolbar... 4 How to Import
GIS Tools for Land Managers
 Citation: Karl, J. 2010. GIS Tools for Land Managers. Sound Science White Paper Series #05. www.sound-science.org. GIS Tools for Land Managers Most land managers recognize that geographic information systems
Shoreline Change Prediction Model for Coastal Zone Management in Thailand
 Journal of Shipping and Ocean Engineering 2 (2012) 238-243 D DAVID PUBLISHING Shoreline Change Prediction Model for Coastal Zone Management in Thailand Siriluk Prukpitikul, Varatip Buakaew, Watchara Keshdet,
University of Arkansas Libraries ArcGIS Desktop Tutorial. Section 2: Manipulating Display Parameters in ArcMap. Symbolizing Features and Rasters:
 : Manipulating Display Parameters in ArcMap Symbolizing Features and Rasters: Data sets that are added to ArcMap a default symbology. The user can change the default symbology for their features (point,
GEOGRAPHIC INFORMATION SYSTEMS CERTIFICATION
 GEOGRAPHIC INFORMATION SYSTEMS CERTIFICATION GIS Syllabus - Version 1.2 January 2007 Copyright AICA-CEPIS 2009 1 Version 1 January 2007 GIS Certification Programme 1. Target The GIS certification is aimed
GIS: Geographic Information Systems A short introduction
 GIS: Geographic Information Systems A short introduction Outline The Center for Digital Scholarship What is GIS? Data types GIS software and analysis Campus GIS resources Center for Digital Scholarship
Determining the Antarctic Ice Sheet Grounding Line with Photoclinometry using LANDSAT Imagery and ICESat Laser Altimetry
 Determining the Antarctic Ice Sheet Grounding Line with Photoclinometry using LANDSAT Imagery and ICESat Laser Altimetry Jamika Baltrop, MyAsia Reid Mentor: Dr. Malcolm LeCompte 1704 Weeksville Road, Box
Version 3.0, April 16, 2012, updated for ArcGIS 10.0 Produced by the Geographic Information Network of Alaska http://www.gina.alaska.
 Using the AlaskaMapped Web Services in ESRI ArcGIS Version 3.0, April 16, 2012, updated for ArcGIS 10.0 Produced by the Geographic Information Network of Alaska http://www.gina.alaska.edu AlaskaMapped
3D Analysis and Surface Modeling
 3D Analysis and Surface Modeling Dr. Fang Qiu Surface Analysis and 3D Visualization Surface Model Data Set Grid vs. TIN 2D vs. 3D shape Creating Surface Model Creating TIN Creating 3D features Surface