Chapter 2 Population. 2.1 Introduction
|
|
|
- Elisabeth Hopkins
- 7 years ago
- Views:
Transcription
1 Chapter 2 Population 2.1 Introduction This chapter includes basic information about North Augusta s residents and households including current characteristics and forecasts of the future. The data in this chapter provides a basis for the remaining chapter elements of the plan. Population, household and employment forecasts help to determine the demand for housing, jobs, infrastructure improvements and land development consistent with the goals and policies of the plan. The 2000 Census is the most recent data source used for much of this chapter. 2.2 Regional Context The City of North Augusta is located along on the Savannah River in the west central area of South Carolina. North Augusta s nearest neighbor, Augusta-Richmond County, Georgia, lies just across the river to the south. The City of North Augusta currently encompasses 19.5 square miles, most of which is located in Aiken County (97%). The city limits also include a small portion of southeastern Edgefield County (3%). The city is centrally located in the Augusta-Aiken, GA-SC Metropolitan Statistical Area (MSA), which is comprised of Columbia, McDuffie and Richmond counties in Georgia, and Aiken and Edgefield counties in South Carolina. The city limits of North Augusta virtually surround the unincorporated neighborhood known as Belvedere in Aiken County. Belvedere contains approximately 4.1 square miles and 5,631 residents. Because of its unique location and the rippling effect of changes in nearby communities, this comprehensive plan provides data, wherever possible, to allow for comparisons to the City of North Augusta. North Augusta s population and household characteristics reflect an expanding suburban city that has a strong influx of new single-family residential developments. Overall, the changes reflect the decentralization trend toward more suburbanization evident throughout the United States in the past several decades. 2.3 Population Trends Population growth rates can help track population activity by graphically showing surges and declines in the number of residents (Chart 2-1). For example, the percentage of population growth in the City of North Augusta over the past 50 years has been 380%, but much of that growth occurred during the decade of the 1950 s (182%). The primary reason for the influx of people at that time was the development of the Savannah River Site. More recently, over the past twenty years, the city s population growth rate has been relatively steady at between 1.2% and 1.5%. The population of the City of North Augusta was 17,574 in 2000, a 12.1% increase from 1990 and a 29.3% increase over the twentyyear period between 1980 and
2 Chart 2-1 Population City of North Augusta Population ,659 Source: US Census Bureau 10,348 12,883 13,593 17,574 15, Census Years Aiken County has seen a strong surge in population growth (168%), mainly as result of the explosive population growths of the City of North Augusta (263%) and the City of Aiken (257%), during the past 50 years. Aiken s population growth has been more pronounced in recent census counts with an annual average increase in population of 3.5% over the past twenty years. The population growth of Augusta-Richmond County, North Augusta s nearest Georgia neighbor, has declined steadily over the past 50 years, from a growth rate of 24.5% between 1950 and 1960, to a growth rate of about 5% per decade over the past 20 years. This is not an uncommon trend in central cities. As decentralization of city centers occurred, many suburban communities saw population increases. Columbia County, Georgia, just north and west of Augusta-Richmond County, experienced significant growth between 1950 and 2000, growing from a population of 9,525 in 1950 to almost 90,000 in This growth period peaked between 1970 and 1980 at almost 80%. In the 20 years between 1980 and 2000, Columbia County s population increased 122.6%. South Carolina s growth has remained steady with 15.1% growth between 1990 and 2000 and 11.7% growth from 1980 to 1990, consistent with the growth rates of both Aiken County and North Augusta. (Table 2-1 and Chart 2-2) 2.4 Population Characteristics The general characteristics of a population include age, gender and race. North Augusta is a first tier suburb of Augusta, Georgia. Unlike the center city characteristics of Augusta, North Augusta s population mix generally reflects typical suburban characteristics. 2-2

3
4 2.4.1 Age The City of North Augusta has a common distribution of ages among its population with a few exceptions. The population under the age of 25, (33.7%), is approximately two percentage points below the populations of the state, US and newer jurisdictions in the region. Only the City of Aiken has a smaller percentage of young people (32.7%). The City of North Augusta and the State of South Carolina are similar in overall age distribution with North Augusta being slightly older. Compared to the communities on the Georgia side of the Savannah River, North Augusta is older. North Augusta s population over the age of 65 is higher than all of our neighbors except Aiken. This very likely reflects the retirement community characteristics of the two cities. Table 2-1 Population Trends Community North Augusta 3,659 10,348 12,883 13,593 15,684 17,574 % Change Belvedere (CDP*) NA NA NA NA 6,133 5,631 % Change NA NA NA NA -8.1 Aiken City 7,083 11,243 13,436 14,978 20,386 25,337 % Change Aiken County 53,137 81,038 91, , , ,552 % Change Edgefield County 16,591 15,435 15,692 17,528 18,375 24,595 % Change Augusta-Richmond County 108, , , , , ,775 % Change Columbia County 9,525 13,423 22,327 40,118 66,031 89,288 % Change Augusta-Aiken MSA NA NA 306, , , ,441 % Change NA NA South Carolina 2,117,027 2,382,594 2,590,516 3,121,820 3,486,703 4,012,012 % Change Georgia 3,444,578 3,943,116 4,587,930 5,462,982 6,478,216 8,186,453 % Change United States 151,325,798179,323,175203,302,031266,542,199248,709, ,421,906 % Change Source: US Census; *Belvedere was classified as a Census Designated Place by the US Census Bureau in
5 Chart 2-2 Population Trends Change Ten Year Census Period North Augusta Belvedere Aiken City Aiken County Edgefield County Augusta-Richmond County Columbia County Augusta-Aiken MSA South Carolina Georgia United States Table Age Profile by Community Under Over 65 North Augusta Belvedere Aiken City Aiken County Edgefield County Augusta-Richmond County Columbia County Augusta-Aiken MSA South Carolina Georgia United States Source: US Census 2-4
6
7 Chart Age Profile by Under Over 65 Age North Augusta Belvedere Aiken City Aiken County Edgefield County Augusta-Richmond County Columbia County Augusta-Aiken MSA South Carolina Georgia United States The US Census Bureau predicts the 65 and older population will grow from one in eight Americans today to one in six by The mature adult population may total 53.7 million, representing a 53.8% increase over today s 34.9 million mature adult population. The city has a mature adult population (14.2%), higher than Aiken County (12.8%), the State of South Carolina (12.1%) and the United States (12.4%). This population is especially high compared to neighboring Georgia municipalities. An increasing mature adult population will require continual review of city policies to meet the needs of this demographic group. (Table 2-2 and Chart 2-3) The City of North Augusta median age (35.9) is slightly older than South Carolina (35.4) as a whole but slightly younger than Aiken County (36.4). The city s median age is also higher than the jurisdictions on the Georgia side of the Savannah River. As the baby boom generation reaches retirement age the percentage of older individuals in the population will increase substantially. (Table 2-3) 2-5
8 2.4.2 Race North Augusta s racial makeup is predominantly white, 77% in The figure in 2000 is a decrease of 6.5% from the 1990 census. The trend toward less homogeneity in the population is consistent with other jurisdictions in the metropolitan area. North Augusta s percentage of white population is higher than all of the neighboring jurisdictions except Columbia County, Georgia. Also consistent throughout the area is the increasing African American percentage of the population. In North Augusta, 13% of the population was black in 1980 and 15.6 % in There was a 20% increase between 1990 and 2000 to 18.8 %. Table Median Age Community Age North Augusta 35.9 Belvedere 35.8 Aiken City 39.5 Aiken County 36.4 Edgefield County 35.6 Augusta-Richmond County 32.3 Columbia County 35.4 Augusta-Aiken MSA 34.5 South Carolina 35.4 Georgia 33.4 United States 35.3 Source: US Census The Hispanic population has shown the most significant growth. Between 1990 and 2000 there was a population increase of more than 3,000%, from 0.07% to 2.4%. While the percentage increase is large, the number represents a little more than 400 individuals. The Hispanic population in North Augusta will continue to grow at a faster rate than other ethnic groups as it is across the state and around the country. These numbers represent an increasing diversity of the population base in North Augusta and this trend is likely to increase during the next ten years. The city should consider the differing needs of the continually diversifying population to keep the residents involved and informed to the city s activities and government. (Table 2-4) 2-6
9 2.4.3 Gender In 2000, North Augusta was 53% female and 47% male. The breakdown is consistent with other jurisdictions in the area. Generally, there is a correlation between the percentage of women in the population and the percentage of the population over the age of 65. Additionally, older women outnumber older men. There does not appear to be any easy indicators that point to certain factors related to the disparity. Generally, there are approximately ten percent more women than men past the age of 30 in the City of North Augusta. Past the age of 85, the difference is tripled reflecting the fact that women generally outlive men. As the baby boom generation reaches retirement age the percentage of older individuals will increase and the age group over 65 will be comprised of an increasing number of women. (Table 2-5) 2.5 Household Characteristics A household is defined as all persons who occupy a given housing unit such as a house, apartment, group of rooms, or single room occupied as separate living quarters. Characteristics of households including size, type, income, and education define the population of a community Household Size Since the 1980 s, there has been a national trend of increasingly smaller family households, more non-family households and single-parent households. These changes have resulted in a greater numbers of households for the same population. Statistics for the City of North Augusta and the Metropolitan Statistical Area (MSA) reflect this national trend. An average household in North Augusta in 2000 contained 2.35 persons, one of the lowest household sizes in the MSA. Columbia County, Georgia recorded the highest number of persons per household. Factors that contribute to this smaller household size number include a larger population of women, an increase in the number of single-parent households and a larger population of retirement age individuals and couples, often referred to as empty nesters. (Table 2-6) Household Type Although the average household size has been decreasing, the growth in household formation has kept pace with the growth in the total population. The traditional family of a husband, wife, and one or more children is less common today. Single-parent households (headed by either men or women), unmarried couples, and single individuals living alone make up more of the households in North Augusta than in previous census counts and result in the smaller average household size. The larger household size in Columbia County, Georgia is the result of a larger percentage of traditional family households. The demographic 2-7
10 shift toward smaller households nationally is the result of an increased divorce rate, more singles living alone, and a longer life expectancy. (Table 2-7) Income Median Household Income refers to the average of all household incomes within the community. The median household income for the City of North Augusta was $41,083 in 2000, an increase of 25% over the decade. The city s median household income has grown at a slower rate than in most of the jurisdictions in the area, yet continues to be one of the higher median income values. Higher household incomes generally reflect a higher number of wage earners per household. The higher the percentage of traditional family households generally reflects more than one wage earner per household. Higher median household incomes also generally reflect a higher level of education and a lower percentage of the population in poverty. Although the median income for North Augusta is higher than the state median and comparable to the national median, it is higher than the regional median by almost 8%. Income levels in the metropolitan area will likely remain lower than state and national averages. (Table 2-8) Education North Augusta s population is well educated. Over 86% of North Augusta residents aged 25 and over are high school graduates comparing favorably with the City of Aiken at 84.6% and Columbia County at 87.9%. Aiken County s and South Carolina, at 77.7% and 76.3% respectively, have not attained the same level of education. A little more than 28% of North Augusta s population over the age of 25 has obtained a bachelor s degree or higher. Aiken County and South Carolina lag behind in this figure with 19.9% and 20.4% respectively. While North Augusta s graduate percentages are generally higher than other jurisdictions, the percentage of high school graduates or higher grew at a substantially lower rate between 1990 and 2000 than in neighboring jurisdictions. The percentage of the population with a college degree also grew at a slower rate than in other jurisdictions. However, North Augusta s education level continues to be very high and higher than the national average. Other jurisdictions in the area are beginning to catch up. (Table 2-9) 2-8
11 Table 2-4 Community Census Year Population by Race or Ethnicity White Change Black or African American Change Other Change Total Hispanic or Latino and Race Change North Augusta Belvedere Aiken City Aiken County Edgefield County Augusta-Richmond County Columbia County Augusta-Aiken MSA South Carolina Georgia United States Source: US Census
12 Table Gender Breakdown by Community Male Female North Augusta Belvedere Aiken City Aiken County Edgefield County Augusta-Richmond County Columbia County Augusta-Aiken MSA South Carolina Georgia United States Source: US Census Table Poverty Household Size Community North Augusta Belvedere Aiken City Aiken County Edgefield County Augusta-Richmond County Columbia County Augusta-Aiken MSA South Carolina Georgia United States Source: US Census The average poverty threshold for a family of four persons in 1989 was $12,674. In 1999 it was $17,029. The percentage of households in the city living at or below the poverty level increased dramatically between 1990 and The percentage of poverty in North Augusta and Belvedere grew faster than in Augusta-Richmond County, the only other jurisdiction that experienced an increase in the percentage of families in poverty. 2-10
13 Table 2-7 Community 2000 Household Type by Owner-Occupied Households Married Couple Male Householder Female Householder Renter-Occupied Households Married Couple Male Householder Female Householder North Augusta Belvedere Aiken City Aiken County Edgefield County Augusta-Richmond County Columbia County Augusta-Aiken MSA South Carolina Georgia United States Source: US Census Table 2-8 Median Household Income Community Change North Augusta 32,877 41, Belvedere 33,878 36, Aiken City 33,273 44, Aiken County 29,994 37, Edgefield County 23,021 35, Augusta-Richmond County 25,265 33, Columbia County 40,122 55, Augusta-Aiken MSA 28,490 38, South Carolina 26,256 37, Georgia 29,021 42, United States 30,056 41, Source: US Census The percentage of increase in poverty in North Augusta and Belvedere is small in terms of real numbers but reflects a trend that is different than in other jurisdictions in the area. It could become an issue in the future. The percentage of 2-11
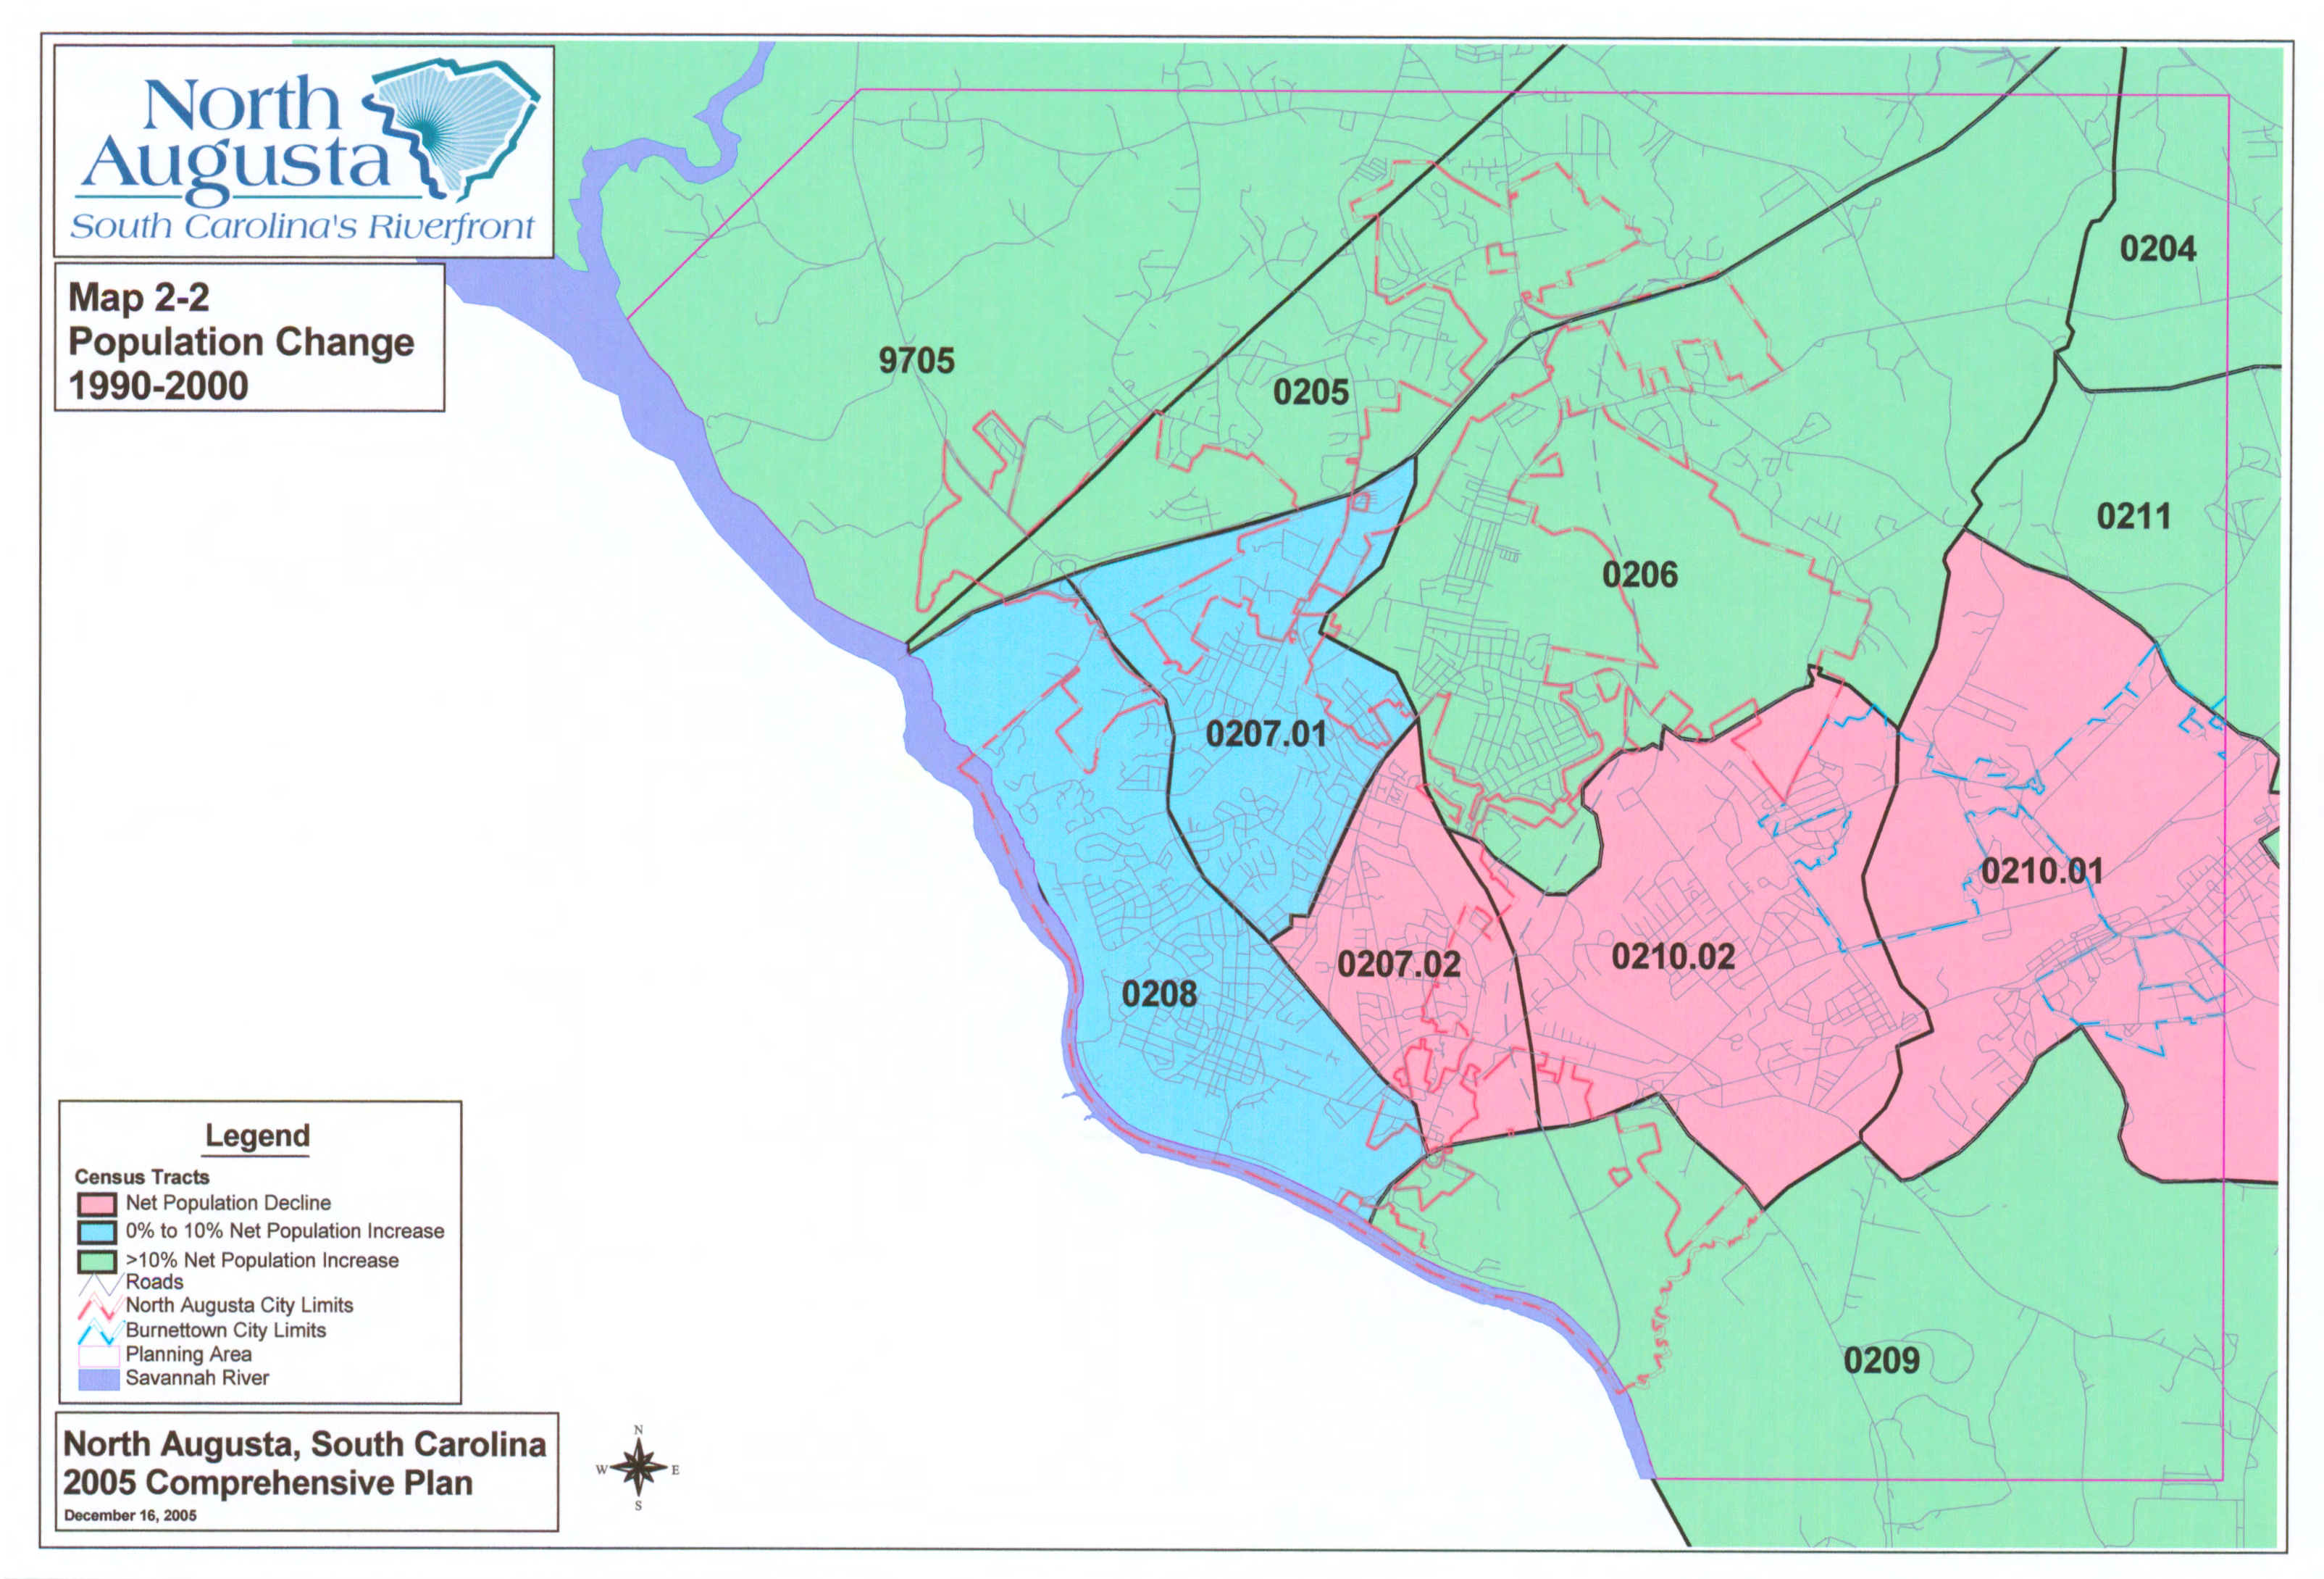
14 Table 2-9 Community North Augusta families living in poverty (less than 80% of median income) increased from 7.1% to 9.7% between 1990 and 2000, reflecting a 42.6% increase; the largest percentage increase of all the jurisdictions within the metropolitan area. (Tables 2-10 and 2-11) 2.6 Population by Census Tract Educational Attainment by HS Graduate or Higher Change Bachelor's HS Graduate Bachelor's HS Graduate or Higher or Higher or Higher or Higher Bachelor's or Higher North Augusta Belvedere Aiken City Aiken County Edgefield County Augusta-Richmond County Columbia County Augusta-Aiken MSA South Carolina Georgia United States Source: US Census Census tracts are small, relatively permanent statistical subdivisions of a county or city delineated for the purpose of presenting census data. Census tracts are designed to be relatively homogeneous units with regard to population characteristics, economic status, and to contain between 2,500 and 8,000 residents. For the 2000 census, North Augusta and Belvedere were divided into eleven census tracts. (Table 2-12) Census tracts and block group boundaries vary substantially in size based upon population density. Additionally, census tract boundaries and most block group boundaries are not coterminous with city limit boundaries. As a result, comparison of data between areas of the city for the purposes of targeting policies and programs is difficult. However, general characteristics of areas that overlap the city boundaries can be made when appropriate. The following data is provided for that purpose. (Table 2-13) 2-12
15 Table 2-10 of Families Living In Poverty Community Change North Augusta Belvedere Aiken City Aiken County Edgefield County Augusta-Richmond County Columbia County Augusta-Aiken MSA South Carolina Georgia United States Source: US Census 2.7 Population Projections The variables used in estimating future population growth include recent and potential future annexations, recent growth activity, natural increases in local population, net inmigration, the local and regional economy; and capital facilities plans. Some variables are dependent variables meaning that local policy decisions will directly influence growth. Annexation and public expenditures are two examples. Other variables are independent and largely beyond local control. The regional economy and national security and energy polices are examples of independent variables. If the Savannah River Site is assigned new missions or, conversely, experience additional lay-offs, as a result of adjustments in national defense and energy policies, growth will be affected. The information in Table 2-20 projects population growth in five year increments through Population is currently projected to increase at a rate consistent with rates over the past twenty-five years, approximately 1.44% per year. That projection is independent of the continued annexation of undeveloped land. However, any significant annexation of existing populations in previously developed neighborhoods or a significant increase in the amount of infill development in the city could result in a higher rate of population increase Recent Growth Activity Since 1980, the population of North Augusta grew by 36.9%. Population growth in North Augusta was relatively steady at approximately 1.4% to 1.5% per year between 1990 and 2000; however, indications are that it has been increasing steadily over the last ten years, most significantly since However, based on the 2000 census, North Augusta s population is not increasing as rapidly as in other parts of the metropolitan area, most notably the City of Aiken and Columbia County, Georgia. 2-13
16 Table 2-11 Community Poverty Female Householder, No Husband Present Change Below Poverty Level Change Female Householder as age of Families North Augusta 697 1, Belvedere Aiken City , Aiken County 5,255 7, ,921 2, Edgefield County 848 1, Augusta-Richmond County 12,365 15, ,981 5, Columbia County 1,994 3, Augusta-Aiken MSA 20,923 29, ,917 9, South Carolina 171, , ,878 67, Georgia 322, , , , United States 10,381,654 37,422, ,230,201 3,315, Source: US Census Change 2-14
17 Table 2-12 Population by Census Tract 1990 Census Tracts 1990 Study Area Tracts 2000 Census Tracts 2000 Study Area Tracts Tracts Change Study Area Change Census Tract Census Tract Census Tract Census Tract Census Tract Census Tract Census Tract Census Tract Census Tract Census Tract Census Tract Source: US Census Table 2-13 Population by Census Tract and Block Group 1990 Study Area 2000 Study Area Census Tract Block Group Block Group Block Group Block Group NA Block Group NA Block Group NA Census Tract Block Group Block Group Census Tract Block Group Block Group Block Group Block Group Block Group NA Block Group NA Census Tract Block Group 1 NA
18 Table 2-13, cont. Population by Census Tract and Block Group 1990 Study Area 2000 Study Area Block Group Block Group 3 NA 1312 Block Group Block Group NA Block Group NA Block Group NA Census Tract Block Group Block Group Block Group Block Group Block Group NA Block Group NA Census Tract Block Group Block Group Block Group Block Group Block Group Block Group Block Group NA Census Tract Block Group Census Tract Block Group Block Group Block Group Block Group Block Group NA Block Group NA Census Tract Block Group 1 NA 1877 Block Group 2 NA 1357 Block Group Block Group Block Group NA Block Group NA Block Group NA Block Group NA 2-16
19 Table 2-13, cont. Population by Census Tract and Block Group 1990 Study Area 2000 Study Area Block Group NA Census Tract Block Group Block Group Block Group Block Group Block Group Block Group Census Tract Block Group Source: US Census Since 1980 the land area of the city grew by 138.5% due to annexations (Tables 2-14, 2-15 and 2-16). The geographic growth of the city has fluctuated over time based on the demand of utilities and annexation opportunities. Annexations of undeveloped land that is now being developed and a steady increase in the number of residential building permits issued are the most significant indicators of an increasing growth rate. Residential real estate development activity varied between 90 and 100 units lots per year through 2000 (Table 2-17). Residential real estate development activity is now averaging approximately 150 to 160 lots per year (Tables 2-18 and 2-19). Table 2-15 Table 2-14 Population and Land Area Population Square Miles Acres , , , ,475 Change 36.9% 138.5% Source: US Census; City of North Augusta Change in Population and Land Area Population Change Square Miles Change , , % % , % % Source: US Census; City of North Augusta 2-17
20 Table 2-16 Recent Growth Population Square Miles , , , , , Source: US Census; City of North Augusta Table 2-17 Real Estate Developed Subdivisions 27 Lots Developed 1,770 Acres Developed 866 Source: North Augusta Department of Economic and Community Development Growth Projections The City contains several large tracts of vacant land with the potential for extended residential development. Many of the tracts may be developed as mixeduse projects with a combination of residential, commercial and open space uses. Additional annexation of undeveloped property will not necessarily increase the rate of population growth. Annexation will, however, postpone the ultimate buildout of the city by providing land for development. It is unlikely that any significant increase in population will result from an annexation given the current annexation laws in South Carolina. However, although unlikely at his time, the annexation of all or portions of the unincorporated Belvedere (Aiken County) or Merriwether (Edgefield County) areas would add substantial numbers to the population of the city. The growth rate in North Augusta, as evidenced by building permit activity, has increased in recent years. That may be due to the improved quality of life image the city enjoys as a result of a number of public investments including the Greeneway, Riverview Park Activities Center, streetscape projects, riverfront development, and others. However, a number of much larger variables will continue to influence the growth rate in the city. New housing demand generally in the region and home starts in North Augusta could decrease as interest rates rise. Housing prices are not likely to increase significantly because of weak 2-18
21

22
23 income growth in the area and because developers will likely attempt to compensate for the increased interest cost to buyers Table 2-18 Real Estate Developed Subdivisions Lots Acres Total Source: North Augusta Department of Economic and Community Development Table 2-19 Building Activity Units Value $16,258, $22,153, $23,583, $29,942, $28,538,588 Total 954 $120,477,220 Source: North Augusta Department of Building Standards Other trends that could affect the growth of the city are regional and national in scope. The median age in the city and the metropolitan area is increasing and household size is continuing to decrease, reflecting the influence of the baby boom generation. The percentage of the population in the labor force is decreasing and the number of retirees in the area is growing. Therefore because of recent trends and possible future influences the population of North Augusta is projected to increase at an annual rate of 1.4% to 1.5% (Table 2-20). 2-19
24 Table 2-20 Population Estimates Community North Augusta 17,635 17,758 18,117 18,494 19,095 % Change Aiken City 25,519 25,714 26,151 26,611 27,299 % Change Aiken County 142, , , , ,960 % Change Edgefield County 24,571 24,574 24,734 24,783 24,794 % Change Augusta-Richmond County 199, , , , ,265 % Change Columbia County 89,829 91,836 94,681 97, ,589 % Change South Carolina 4,023,548 4,061,209 4,105,848 4,148,744 4,198,068 % Change Georgia 8,230,087 8,391,282 8,539,735 8,676,460 8,829,383 % Change United States 282,192, ,102, ,941, ,788, ,655,404 % Change Source: US Census; Estimates are for July 1 of the dates shown. 2-20
25 Table 2-21 Population Projections Community North Augusta 18,790 20,080 21,470 22,950 24,530 26,220 % Change Aiken County 150, , , , , ,490 % Change Edgefield County 24,960 25,660 26,440 27,280 28,150 29,140 % Change Augusta Richmond County 199, , , , , ,070 % Change Columbia County 101, , , , , ,280 % Change Aiken Augusta MSA 520, , , , , ,560 % Change South Carolina 4,241,120 4,482,260 4,735,890 4,998,110 5,271,830 5,564,460 % Change Georgia 8,919,410 9,517,760 10,143,730 10,788,860 11,459,620 12,172,150 % Change United States 295,507, ,935, ,365, ,804, ,439, ,584,435 % Change Source: North Augusta Projections, Lower Savannah Council of Governments; United States Projections, US Census; All other projections, Woods & Poole, Goals, Objectives, Policies and Strategies Goals and objectives generally support a vision for the city and a framework for developing more specific strategies and policies to address the needs and opportunities. Goals related to population projections are sometimes difficult to articulate. Specific objectives, policies and strategies are also difficult because the city has little control over the larger economic and resource factors that influence significant changes in population. The comprehensive plan in its entirety is a plan for the growth and development of the city and deals with strategies and policies that the city can control. However, demographic information and population projections will influence goals, objectives, policies and strategies in all of the other elements in the plan Monitor demographic changes in the city to understand the continually changing trends related to the growth and increasing needs and demands of the minority Hispanic population and other changing demographic trends in the city Monitor demographic changes in the city to understand the increasing percentage of the population that is at the poverty level and develop growth related policies and programs to reverse the trend. 2-21
26 2.8.3 Expand the city s marketing programs to promote North Augusta as a community with a high quality of life and a unique place to relocate or retire Encourage infill residential development in undeveloped areas of the city, especially those areas that are near the original city limits. 2-22
CHAPTER ONE: DEMOGRAPHIC ELEMENT
 CHAPTER ONE: DEMOGRAPHIC ELEMENT INTRODUCTION One of the basic elements of this comprehensive plan is an analysis of the City of Beaufort s (the City) current and projected demographic makeup. The purpose
Technical Report 1: Regional Demographic Profile
 Technical Report 1: Regional Demographic Profile Compiled by the Piedmont Triad Regional Council January, 2013 Triad Tomorrow Figure 1. Piedmont Triad Region CONTEXT The Piedmont Triad region consists
CHAPTER 2 - Population and Economy
 CHAPTER 2 - Population and Economy Siler City is located in Western Chatham County West of Raleigh and the Triangle and South of Greensboro at the junction of US Highway 64 and US Highway 421. It was incorporated
The goal is to transform data into information, and information into insight. Carly Fiorina
 DEMOGRAPHICS & DATA The goal is to transform data into information, and information into insight. Carly Fiorina 11 MILWAUKEE CITYWIDE POLICY PLAN This chapter presents data and trends in the city s population
Women, Wages and Work A report prepared by the UNC Charlotte Urban Institute for the Women s Summit April 11, 2011
 A report prepared by the UNC Charlotte Urban Institute for the Women s Summit April 11, 2011 A report prepared for the Women s Summit by the UNC Charlotte Urban Institute 1 Table of Contents Table of Contents...
County Demographics, Economy & Housing Market
 County Demographics, Economy & Housing Market County Demographics Palm Beach County is Florida's third most populous county with 7% of Florida's population. The county's total estimated population for
Florida s Families and Children Below the Federal Poverty Level
 Florida s Families and Children Below the Federal Poverty Level Florida Senate Committee on Children, Families, and Elder Affairs Presented by: February 17, 2016 The Florida Legislature Office of Economic
Demographic Analysis of the Salt River Pima-Maricopa Indian Community Using 2010 Census and 2010 American Community Survey Estimates
 Demographic Analysis of the Salt River Pima-Maricopa Indian Community Using 2010 Census and 2010 American Community Survey Estimates Completed for: Grants & Contract Office The Salt River Pima-Maricopa
Georgia Coast 2030: Population Projections for the 10-county Coastal Region. For Coastal Georgia Regional Development Center
 Georgia Coast 2030: Population Projections for the 10-county Coastal Region For Coastal Georgia Regional Development Center Prepared by the CENTER FOR QUALITY GROWTH AND REGIONAL DEVELOPMENT at the GEORGIA
SUSTAINABLE HOUSTON: DEMOGRAPHIC TRENDS, IMPACTS, AND FUTURE PLANS
 SUSTAINABLE HOUSTON: DEMOGRAPHIC TRENDS, IMPACTS, AND FUTURE PLANS Dr. Philip Berke Professor, UNC Chapel Hill Department of City & Regional Planning Deputy Director, UNC Institute for the Environment
Lake County. Government Finance Study. Supplemental Material by Geography. Prepared by the Indiana Business Research Center
 County Government Finance Study Supplemental Material by Geography Prepared by the Indiana Business Research www.ibrc.indiana.edu for Sustainable Regional Vitality www.iun.edu/~csrv/index.shtml west Indiana
Wealth and Demographics: Demographics by Wealth and Wealth by Demographics using the Survey of Consumer Finances. *** DRAFT March 11, 2013 ***
 Wealth and Demographics: Demographics by Wealth and Wealth by Demographics using the Survey of Consumer Finances *** DRAFT March 11, 2013 *** Jeff Thompson* Economist Microeconomic Surveys Federal Reserve
PUBLIC DISCLOSURE COMMUNITY REINVESTMENT ACT PERFORMANCE EVALUATION
 PUBLIC DISCLOSURE February 22, 2010 COMMUNITY REINVESTMENT ACT PERFORMANCE EVALUATION Community Bank of Bergen County RSSD No. 275509 18 Railroad Avenue Rochelle Park, New Jersey 07662 FEDERAL RESERVE
Joint Warren County Comprehensive Plan 2005 2025
 Joint Warren County Comprehensive Plan 2005 2025 T ABLE OF CONTENTS Table of Contents Introduction. I-1 Population.P-1 Economic Development...ED11 Housing.H-1 Community Facilities.C-1 Natural and Cultural
Retirement Readiness in New York City: Trends in Plan Sponsorship, Participation and Income Security
 Retirement Readiness in New York City: Trends in Plan Sponsorship, Participation and Income Security Figures and Tables by the Schwartz Center for Economic Policy Analysis (SCEPA) Joelle Saad Lessler,
AUGUSTA-RICHMOND COUNTY COMPREHENSIVE PLAN UPDATE COMMUNITY ASSESSMENT
 AUGUSTA-RICHMOND COUNTY COMPREHENSIVE PLAN UPDATE COMMUNITY ASSESSMENT TABLE OF CONTENTS CHAPTER 1 INTRODUCTION CHAPTER 2 POPULATION CHAPTER 3 HOUSING CHAPTER 4 ECONOMIC DEVELOPMENT CHAPTER 5 TRANSPORTATION
Demographic Profile of Wichita Unemployment Insurance Beneficiaries Q2 2014
 Demographic Profile of Wichita Unemployment Insurance Beneficiaries Q2 2014 The Bureau of Labor Statistics defines an unemployed person as one 16 years and older having no employment and having made specific
SalarieS of chemists fall
 ACS news SalarieS of chemists fall Unemployment reaches new heights in 2009 as recession hits profession hard The economic recession has taken its toll on chemists. Despite holding up fairly well in previous
Demographic Profile of Wichita Unemployment Insurance Beneficiaries Q3 2015
 Demographic Profile of Wichita Unemployment Insurance Beneficiaries Q3 2015 The Bureau of Labor Statistics defines an unemployed person as one 16 years and older having no employment and having made specific
Lloyd Potter is the Texas State Demographer and the Director of the Texas State Data Center based at the University of Texas at San Antonio.
 Lloyd Potter is the Texas State Demographer and the Director of the Texas State Data Center based at the University of Texas at San Antonio. 1 2 Texas population in 2014 was just under 27 million and was
Employment in the United States is recovering slowly from the
 Employment Patterns During the Recovery: Who Are Getting the Jobs and Why? By Ayşegül Şahin and Jonathan L. Willis Employment in the United States is recovering slowly from the Great Recession. After declining
A Geographic Profile of. Chicago Lawn, Gage Park, West Elsdon and West Lawn. Neighborhoods Served by. The Southwest Organizing Project
 A Geographic Profile of Chicago Lawn, Gage Park, West Elsdon and West Lawn Neighborhoods Served by The Southwest Organizing Project The Southwest Organizing Project (SWOP) is a broad based community organization
Undergraduate Degree Completion by Age 25 to 29 for Those Who Enter College 1947 to 2002
 Undergraduate Degree Completion by Age 25 to 29 for Those Who Enter College 1947 to 2002 About half of those who start higher education have completed a bachelor's degree by the ages of 25 to 29 years.
Sweet Home School District Enrollment Forecast
 Sweet Home School District Enrollment Forecast Report: Prepared for: Sweet Home School District Sweet Home, Oregon Prepared by: Community Planning Workshop Community Service Center 1209 University of Oregon
Neighborhood Diversity Characteristics in Iowa and their Implications for Home Loans and Business Investment
 Neighborhood Diversity Characteristics in Iowa and their Implications for Home Loans and Business Investment Liesl Eathington Dave Swenson Regional Capacity Analysis Program ReCAP Department of Economics,
Demographic and Economic Profile. Mississippi. Updated May 2006
 Demographic and Economic Profile Mississippi Updated May 2006 Metro and Nonmetro Counties in Mississippi Based on the most recent listing of core based statistical areas by the Office of Management and
Educational Attainment of Veterans: 2000 to 2009
 Educational Attainment of Veterans: to 9 January 11 NCVAS National Center for Veterans Analysis and Statistics Data Source and Methods Data for this analysis come from years of the Current Population Survey
Pew Study: American Middle Class is Steadily Shrinking
 Pew Study: American Middle Class is Steadily Shrinking December 23, 2015 by Gary D. Halbert of ProFutures Investments IN THIS ISSUE: 1. Pew Research: American Middle Class is Steadily Shrinking 2. Pew
ECONOMIC FACTORS AFFECTING COMPENSATION
 Unit 4: Total Rewards 41 ECONOMIC FACTORS AFFECTING COMPENSATION Inflation Inflation has a substantial impact on compensation practices. Managing a compensation program is especially difficult during periods
Educational Attainment in the United States: 2015
 Educational Attainment in the United States: 215 Population Characteristics Current Population Reports By Camille L. Ryan and Kurt Bauman March 216 P2-578 This report provides a portrait of educational
The U.S. labor force the number of
 Employment outlook: 14 Labor force projections to 2014: retiring boomers The baby boomers exit from the prime-aged workforce and their movement into older age groups will lower the overall labor force
Race and Ethnicity. Racial and Ethnic Characteristics for Bellevue
 The Census contains a great deal of information that outlines the increasing level of diversity in our community. Among the demographic trends outlined in this section of the report will be race, ethnicity,
Young Black America Part Four: The Wrong Way to Close the Gender Wage Gap
 Issue Brief August 2015 Young Black America Part Four: The Wrong Way to Close the Gender Wage Gap By Cherrie Bucknor* Young blacks in America have had significant improvements in educational attainment
Moving Beyond the Gap
 Moving Beyond the Gap Racial Disparities in September 2014 Central Corridor St. Paul Hopkins Blake Rd Corridor Eastside St. Paul South Minneapolis September 2014 Overview This report is part of a larger
Migration Patterns and Mover Characteristics from the 2005 ACS Gulf Coast Area Special Products
 Migration Patterns and Mover Characteristics from the 2005 ACS Gulf Coast Area Special Products Kin Koerber Housing and Economic Household Statistics Division U.S. Census Bureau Presented at the Southern
A Portrait of Seattle s Low-Income Working Population
 A Portrait of Seattle s Low-Income Working Population December 2011 Support provided by the City of Seattle Office of Economic Development 1 INTRODUCTION The Great Recession, now over two years gone, has
A Cardinal That Does Not Look That Red: Analysis of a Political Polarization Trend in the St. Louis Area
 14 Missouri Policy Journal Number 3 (Summer 2015) A Cardinal That Does Not Look That Red: Analysis of a Political Polarization Trend in the St. Louis Area Clémence Nogret-Pradier Lindenwood University
Ireland and the EU 1973-2003 Economic and Social Change
 Ireland and the EU 1973-2003 Economic and Social Change Table 1 Population, 1971-2002 viii Table 2 Population of the provinces ix Table 3 Births, deaths and life expectancy ix Table 4 Numbers in education
The Gender Wage Gap by Occupation 2015
 IWPR #C440 April 2016 The Gender Wage Gap by Occupation 2015 and by Race and Ethnicity Women s median are lower than men s in nearly all s, whether they work in s predominantly done by women, s predominantly
New Mexico. Comparison Profile prepared by the New Mexico Economic Development Department State Data Center. Page 1 of 5
 DEMOGRAPHICS Population estimates, July 1, 2014 2,085,572 Population, percent change - April 1, 2010 to July 1, 2014 1.4% Population estimates, July 1, 2013 2,085,287 Population, percent change - April
Marriage and divorce: patterns by gender, race, and educational attainment
 ARTICLE OCTOBER 2013 Marriage and divorce: patterns by gender, race, and educational attainment Using data from the National Longitudinal Survey of Youth 1979 (NLSY79), this article examines s and divorces
The recession of 2007 2009, a
 Employment outlook: Labor force projections to : a more slowly growing workforce The projected labor force growth over the next 10 years will be affected by the aging of the baby-boom generation; as a
Comparison Profile prepared by the New Mexico Economic Development Department State Data Center. Page 1 of 5
 Comparing New Mexico to Colorado DEMOGRAPHICS Colorado New Mexico Population estimates, July 1, 2014 5,355,866 2,085,572 Population, percent change - April 1, 2010 to July 1, 2014 1.4% 1.4% Population
Demographic and Economic Profile. North Carolina. Updated June 2006
 Demographic and Economic Profile North Carolina Updated June 2006 Metro and Nonmetro Counties in North Carolina Based on the most recent listing of core based statistical areas by the Office of Management
An Equity Profile of the Kansas City Region. Summary. Overview. The Equity Indicators Framework. central to the region s economic success now and
 An Equity Profile of the Kansas City Region PolicyLink and PERE An Equity Profile of the Kansas City Region Summary Overview Across the country, regional planning organizations, community organizations
A SNAPSHOT OF ALPENA COUNTY
 A SNAPSHOT OF ALPENA COUNTY agbioresearch.msu.edu msue.msu.edu About the Data This County Profile is to be used with the 2015-2016 Issue Identification process for State University Extension. Unless otherwise
Logan City. Analysis of Impediments to Fair Housing
 Logan City Analysis of Impediments to Fair Housing 2009-13 Consolidated Plan Page 36 of 92 EXECUTIVE SUMMARY Analysis of Impediments The Analysis of Impediments (AI) is a comprehensive review of a jurisdiction
UWEP Utah Women and Education Project
 Research and Policy Brief UWEP Utah Women and Education Project May 25, 2010 UWEP 2010-204 Women and Higher Education in Utah: A Glimpse at the Past and Present According to Lumina Foundation researchers,
Ohio County Profiles Prepared by the Office of Research
 Ohio County Profiles Prepared by the Office of Research Established: Act - April 1, 182 214 Population: 28,462 Land Area: 41.1 square miles County Seat: Van Wert City Named for: Isaac Van Wert, Revolutionary
Age/sex/race in New York State
 Age/sex/race in New York State Based on Census 2010 Summary File 1 Jan K. Vink Program on Applied Demographics Cornell University July 14, 2011 Program on Applied Demographics Web: http://pad.human.cornell.edu
Recovery or Bust: Georgia s Poor Left Behind Melissa Johnson March 4, 2014. www.gbpi.org
 Recovery or Bust: Georgia s Poor Left Behind Melissa Johnson March 4, 2014 www.gbpi.org 1 50 th Anniversary of the War on Poverty in 2014 2 Why are Georgia s Poor Increasing in Number? 3 Agenda Who Georgia
Table of Contents. Florida Population Atlas 1
 Florida Population Atlas 1 Table of Contents About the Florida Population Atlas... 2 Explanation of Florida Population Characteristics and Trends..2-5 Figures & Maps... 6-30 Florida Population Characteristics
The Gender Wage Gap by Occupation 2014
 IWPR # C431 April 2015 The Gender Wage Gap by Occupation 2014 and by Race and Ethnicity Women s are lower than men s in nearly all s, whether they work in s predominantly done by women, s predominantly
Ohio County Profiles Prepared by the Office of Research
 Ohio County Profiles Prepared by the Office of Research Established: Act - May 1, 1803 2014 Population: 533,116 Land Area: 461.7 square miles County Seat: Dayton City Named for: General Richard Montgomery,
Housing Markets in Six Metropolitan Areas and their Main Central Cities
 Housing Markets in Six Metropolitan Areas and their Main Central Cities Rolf Pendall Director, Metropolitan Housing and Communities Policy Center, The Urban Institute Housing issues and opportunities at
2011 research report. Comparative Analysis of Prince George s Nonprofit Sector
 2011 research report Comparative Analysis of Prince George s Nonprofit Sector Nonprofi ts mission is to strengthen, educate, and engage nonprofi t organizations so they can successfully achieve their missions.
Adecade into the 21st century, Michigan s longbruised
 Michigan League FOR Human Services December 2010 Michigan's Economy Continues to Cause Pain: Communities of Color Take a Harder Hit Adecade into the 21st century, Michigan s longbruised economy continues
BY Maeve Duggan NUMBERS, FACTS AND TRENDS SHAPING THE WORLD FOR RELEASE AUGUST 19, 2015 FOR FURTHER INFORMATION ON THIS REPORT:
 NUMBERS, FACTS AND TRENDS SHAPING THE WORLD FOR RELEASE AUGUST 19, 2015 BY Maeve Duggan FOR FURTHER INFORMATION ON THIS REPORT: Maeve Duggan, Research Associate Dana Page, Senior Communications Manager
Selected Socio-Economic Data. Baker County, Florida
 Selected Socio-Economic Data African American and White, Not Hispanic www.fairvote2020.org www.fairdata2000.com 5-Feb-12 C03002. HISPANIC OR LATINO ORIGIN BY RACE - Universe: TOTAL POPULATION Population
Housing the Richmond Region s Future Workforce
 RICHMOND ASSOCIATION OF REALTORS PARTNERSHIP HOUSING AFFORDABILITY Housing the Richmond Region s Future Workforce Lisa A. Sturtevant, PhD Ryan Price George Mason University School of Public Policy Center
City of Lynchburg, VA: Housing Assessment
 City of Lynchburg, VA: Housing Assessment Prepared By: Housing Opportunities Made Equal of Virginia, Inc. for the City of Lynchburg CITY OF LYNCHBURG, VA: HOUSING ASSESSMENT 2011 1 List of Maps Map 1.
Planning for the Schools of Tomorrow
 Planning for the Schools of Tomorrow School Enrollment Projections Series January 2014 Page Intentionally Left Blank School Enrollment Projection Series: School District ii Table of Contents Introduction...
1960-61. United States
 61-61 United States By, the U.S. population had surpassed 179 million, a gain of 19.0 percent from. The median age had decreased to 29.5 (28.7 for men and.3 for women), the first decline since 1900. The
A CONTROLLED HOUSING UNIT METHOD FOR SMALL AREA POPULATION ESTIMATES
 Constance C. Blackmon Data Center Director Atlanta Regional Commission 230 Peachtree Street, NW Atlanta, Georgia 30303 A CONTROLLED HOUSING UNIT METHOD FOR SMALL AREA POPULATION ESTIMATES ABSTRACT. The
Residential Market. Downtown Houston
 Downtown Houston The Houston Market Houston s residential market represents one of the best values in the United States. The city ranks third in the 2010 Forbes list of best housing markets, and second
Air Travel Market Segments A New England Case Study
 PAPER Air Travel Market Segments A New England Case Study EVELYN ADDANTE MarketSense INTRODUCTION The 1995 American Travel Survey (ATS) is the first comprehensive survey of longdistance travel patterns
IOWA POPULATION TRENDS. Population Topics. Iowa Population: 1900-2010
 IOWA POPULATION TRENDS August 2011 Gary Krob, State Data Center Coordinator State Library of Iowa census@lib.state.ia.us www.iowadatacenter.org Population Topics 2 Past state trend How population changes
HEALTH INSURANCE COVERAGE STATUS. 2009-2013 American Community Survey 5-Year Estimates
 S2701 HEALTH INSURANCE COVERAGE STATUS 2009-2013 American Community Survey 5-Year Estimates Supporting documentation on code lists, subject definitions, data accuracy, and statistical testing can be found
Statistical Profile of Unmarried Women: North Carolina 1
 1 I. Population, 18 years and older, 2014 2 Total: 6.857 million Men: 3.204 million (46.7% of total) 3.654 million (53.3% of total) Married women: 3 1.850 million (27.0% of total; 50.6% of women) Unmarried
METRO ATLANTA STILL AMONG FASTEST-GROWING IN NATION
 October 2012 Despite the dour economic news of the past few years, metro Atlanta remains the key economic driver of the Southeast. But, as with all metro areas, challenges abound. One of those challenges
California Youth Crime Declines: The Untold Story
 CENTER ON JUVENILE AND CRIMINAL JUSTICE California Youth Crime Declines: The Untold Story Introduction Public perceptions about youth crime tend to imagine high incidents of violent crime and property
Demographic and Labor Market Profile of the city of Detroit - Michigan
 Demographic and Labor Market Profile of the city of Detroit - Michigan Leonidas Murembya, PhD Regional Coordinator murembyal@michigan.gov www.michigan.gov/lmi 517-241-6574 State of Michigan Department
Demographic Trends and Housing in the City of Newton, Massachusetts
 Demographic Trends and Housing in the City of Newton, Massachusetts Barry Bluestone Tracy A. Corley May 2014 Dukakis Center Report #1 Demographic Trends and Housing in the City of Newton, Massachusetts
Changes in the Demographic Characteristics of Texas High School Graduates. Key Findings
 Changes in the Demographic Characteristics of Texas High School Graduates 2003 2009 Key Findings The number of Texas high school graduates increased by 26,166 students, an 11 percent increase from 2003
THE EDUCATIONAL ATTAINMENT OF THE WORKFORCE
 THE EDUCATIONAL ATTAINMENT OF THE WORKFORCE March 2016 Dennis Hoffman, Ph.D. Professor, Department of Economics; Director, L. William Seidman Research Institute; and Director, Office of the University
Wealth Inequality and Racial Wealth Accumulation. Jessica Gordon Nembhard, Ph.D. Assistant Professor, African American Studies
 Wealth Inequality and Racial Wealth Accumulation Jessica Gordon Nembhard, Ph.D. Assistant Professor, African American Studies Wealth Inequality Increasing Media attention World wealth inequality (UNU-
FLORIDA TRANSPORTATION TRENDS AND CONDITIONS
 a report on FLORIDA TRANSPORTATION TRENDS AND CONDITIONS TRAVEL DEMAND Population Growth and Characteristics June 2014 Table of Contents Introduction... 1 Population Growth... 1 Density... 11 Demographic
THE U.S. BICYCLE MARKET A Trend Overview
 THE U.S. BICYCLE MARKET A Trend Overview Author: Brad Edmondson Table of Contents Introduction... 3 Executive Summary... 3 Bicycling Trends, 2000-2010... 3 Demographics of Bicyclists... 6 Conclusions...
The Changing Race and Ethnicity of Workers
 Chapter 2 The Changing Race and Ethnicity of Workers How can Texas balance cultural challenges? Introduction Texas is a state in transition. A fast-growing population and other key changes are combining
Content Creation Online
 44% of U.S. Internet users have contributed their thoughts and their files to the online world. Embargoed for release at 5pm, Sunday, February 29, 2004 Amanda Lenhart, Research Specialist John Horrigan,
Office of Institutional Research & Planning
 NECC Northern Essex Community College NECC College Math Tutoring Center Results Spring 2011 The College Math Tutoring Center at Northern Essex Community College opened its doors to students in the Spring
PUBLIC DISCLOSURE. April 4, 2012 MORTGAGE LENDER COMMUNITY INVESTMENT PERFORMANCE EVALUATION CRESCENT MORTGAGE COMPANY ML4247
 PUBLIC DISCLOSURE April 4, 2012 MORTGAGE LENDER COMMUNITY INVESTMENT PERFORMANCE EVALUATION CRESCENT MORTGAGE COMPANY ML4247 5901 Peachtree Dunwoody Road Suite 250, Bldg C Atlanta, GA 30328 DIVISION OF
FIRST-TIME HOMEBUYERS: UPDATE FROM THE 2005 AMERICAN HOUSING SURVEY
 FIRST-TIME HOMEBUYERS: UPDATE FROM THE 2005 AMERICAN HOUSING SURVEY In 2005, there were nearly 75 million homeowning households in the United States, representing nearly 69 percent of all households. During
Who lives in New Orleans and the metro area now? Based on 2012 U.S. Census Bureau data
 Who lives in New Orleans and the metro area now? Based on 2012 U.S. Census Bureau data Vicki Mack and Elaine Ortiz, Greater New Orleans Community Data Center September 26, 2013 This brief examines 2012
City of Toledo. Community Profile. Consolidated Plan FY2010-2015
 City of Toledo Consolidated Plan FY2010-2015 This section summarizes the basic demographic and employment characteristics of residents of the City of Toledo, drawing from statistics provided by the U.S.
Texas Homebuyers and Sellers Report Release date: March 1, 2016
 Texas Homebuyers and Sellers Report Release date: March 1, 2016 Contact: Danielle Urban Pierpont Communications 512-448-4950 durban@piercom.com About the Texas Homebuyers and Sellers Report The Texas Homebuyers
PUBLIC DISCLOSURE. January 22, 2007 COMMUNITY REINVESTMENT ACT PERFORMANCE EVALUATION. Virginia Heritage Bank. 11166 Fairfax Boulevard
 PUBLIC DISCLOSURE January 22, 2007 COMMUNITY REINVESTMENT ACT PERFORMANCE EVALUATION Virginia Heritage Bank 3374298 11166 Fairfax Boulevard Fairfax, Virginia 22030 Federal Reserve Bank of Richmond P. O.
Workforce Training Results Report December 2008
 Report December 2008 Community and Technical Colleges (CTC) Job Preparatory Training Washington s 34 community and technical colleges offer job preparatory training that provides students with skills required
Health and Social Services Needs in Whitman County. 2015 Community Needs Assessment Results General Report COMMUNITY REPORT OF RESULTS
 COMMUNITY REPORT OF RESULTS This report contains an overview of the results collected by the Health and Social Services Needs in Whitman County Survey. A description of Whitman County, the survey process,
POVERTY IN FLORIDA. POVERTY IN FLORIDA 1990 2000 1990 2000 Change. 2000 Census Reports. Florida Legislature. Office of Economic & Demographic Research
 2000 Census Reports Florida Legislature Office of Economic & Demographic Research POVERTY IN FLORIDA October 2002 The overall poverty rate for persons in Florida as measured in the 2000 Census was 12.5
1 PEW RESEARCH CENTER
 1 FOR RELEASE October, 29, 2015 BY Monica Anderson FOR FURTHER INFORMATION ON THIS REPORT: Monica Anderson, Research Analyst Lee Rainie, Director Internet, Science and Technology Research Dana Page, Senior
New Mexico 2014 State of the Workforce Report A Report Highlighting New Mexico s Current and Future Workforce
 New Mexico 2014 State of the Workforce Report A Report Highlighting New Mexico s Current and Future Workforce November 2013 www.dws.state.nm.us State of New Mexico Workforce Report 2014 Susana Martinez
A Primer on the Basic Allowance for Housing (BAH)
") DEFENSE TRAVEL MANAGEMENT OFFICE A Primer on the Basic Allowance for Housing (BAH) For the Uniformed Services The purpose of this Basic Allowance for Housing (BAH) primer is to explain to members how their
DEFENSE TRAVEL MANAGEMENT OFFICE A Primer on the Basic Allowance for Housing (BAH) For the Uniformed Services The purpose of this Basic Allowance for Housing (BAH) primer is to explain to members how their
The Economic Impact of the Senior Population on a State s Economy: The Case of North Dakota
 The Economic Impact of the Senior Population on a State s Economy: The Case of North Dakota RICHARD RATHGE January 2007 NORTH DAKOTA STATE DATA CENTER North Dakota State University, an Equal Opportunity
Institute for Financial Literacy
 Institute for Financial Literacy 200 Annual Consumer Bankruptcy Demographics Report A Five Year Perspective of the American Debtor A Report Published by the Institute for Financial Literacy, Inc. September,
UNINSURED ADULTS IN MAINE, 2013 AND 2014: RATE STAYS STEADY AND BARRIERS TO HEALTH CARE CONTINUE
 UNINSURED ADULTS IN MAINE, 2013 AND 2014: RATE STAYS STEADY AND BARRIERS TO HEALTH CARE CONTINUE December 2015 Beginning in January 2014, the federal Patient Protection and Affordable Care Act (ACA) has
E-reader Ownership Doubles in Six Months
 E-reader Ownership Doubles in Six Months Adoption rate of e-readers surges ahead of tablet computers Kristen Purcell, Associate Director for Research, Pew Internet Project June 27, 2011 Pew Research Center
The Home Mortgage Disclosure Act (HMDA) was passed by Congress in 1977. The goal of
 was passed by Congress in 1977. The goal of") Chapter 9 Home Mortgage Disclosure Act Data Analysis The Home Mortgage Disclosure Act (HMDA) was passed by Congress in 1977. The goal of this act is to make information available to community groups, government
Chapter 9 Home Mortgage Disclosure Act Data Analysis The Home Mortgage Disclosure Act (HMDA) was passed by Congress in 1977. The goal of this act is to make information available to community groups, government
Abilene, Texas. Summary. Housing Market Area. Market Details. Economy. Rental Market. Sales Market
 COMPREHENSIVE HOUSING MARKET ANALYSIS Abilene, Texas U.S. Department of Housing and Urban Development Office of Policy Development and Research As of July 1, 28 Summary Housing Market Area Stonewall Runnels
Patient Responsibility in Health Care: An AARP Bulletin Survey
 Patient Responsibility in Health Care: An AARP Bulletin Survey May 2011 Patient Responsibility in Health Care: An AARP Bulletin Survey Data Collected by SSRS Report Prepared by Teresa A. Keenan, Ph.D.