9. Experiments and quasi-experiments
|
|
|
- Kelly Norton
- 7 years ago
- Views:
Transcription
1 9. Experiments and quasi-experiments Up to now: Data sets analyzed were considered as given Now: We may collect data by conducting experiments Our aim is to estimate the causal effects of a treatment (e.g. the effect a policy program, of a job training program) randomized controlled experiment 251
2 Why should we study experiments: Ideal randomized experiments are the benchmark Experiments often are very influential Terminology: Experiment: is designed and implemented by the researcher Quasi-experiment (natural experiment): is based on a randomization that is not the result of a conscious design 252
3 9.1. Potential outcomes, causal effects, and idealized experiments Terminology: The potential outcome is the outcome for an observational unit (individual) under a potential treatment or potential non-treatment For an individual, the causal effect is the difference in potential outcomes, i.e. the difference between the potential outcome with the treatment minus the potential outcome without the treatment 253
4 Remark: Since you cannot observe both potential outcomes on the same individual, the individual causal effects are unobservable Terminology: [continued] The average treatment effect is the population mean value of the individual treatment effects Remark: Distinct individuals may have different treatment effects, but in what follows we assume causal effects that are identical across all individuals 254
5 Regression set-up: Let X i (i = 1,..., n) denote the binary treatment variable defined as { 1 if individual i receives the treatment X i = 0 if individual i does not receive the treatment Assume that individuals are randomly assigned to the treatment, i.e. X i are drawn from simple random sampling (we call X i randomized) Let Y i (i = 1,..., n) be the observed outcome of individual i 255
6 Regression set-up: [continued] We consider the regression model Y i = β 0 + β 1 X i + u i (9.1) Since X i is randomized, it is independent of the error term u i the OLS assumptions hold, and the OLS estimator ˆβ 1 is an unbiased and consistent estimator of the causal effect β 1 It can be shown that the OLS estimator ˆβ 1 can be computed as the difference between the sampling average of the Y i values of the treatment group (X i = 1) and the sampling average of the control (non-treatment) group (X i = 0): (see class) ˆβ 1 = Ȳ treatment Ȳ control (9.2) 256
7 Definition 9.1: (Differences estimator) We call the OLS estimator ˆβ 1 = Ȳ treatment Ȳ control the differences estimator of the causal effect β 1. Differences estimator with additional regressors: We may add a control variable W to Eq. (9.1), so that Y i = β 0 + β 1 X i + β 2 W i + u i (9.3) In general, including W i will result in smaller standard errors of ˆβ 1 257
8 Differences estimator with additional regressors: [continued] Omitted-variable bias is not an issue if X i is randomly assigned But, if the probability of assignment depends on W i, we need to include W i to avoid omitted-variable bias Conditional mean-independence: E(u i X i, W i ) = E(u i W i ) 258
9 Example: Men (W i = 0) and women (W i = 1) are randomly assigned to a course on table manners (X i ) Assume, that women are assigned with a higher probability than men (for whatever reason) Assume further that women have better table manners than men prior to the course Even, if the course has no effect, the treatment group will have better post-course table manners than the control group Reason: the treatment group has a higher fraction of women than the control group 259
10 Example: [continued] If W i is included as control variable, then ˆβ 1 is consistent and unbiased Conditional-mean independence means: Among women, treatment is randomly assigned, so among women, the error term u i is independent of the treatment X i The same applies for men Conclusion: if randomization is based on covariates, then conditionalmean independence holds 260
11 9.2. Threats to validity of experiments Threats to internal validity: Failure to randomize Example: In a job training program individuals are assigned to the treatment group depending on whether their last name falls in the 1st or the 2nd half of the alphabet Because of ethnic differences in last names, ethnicity could differ systematically between the treatment and the control groups Potential ethnic differences in labor market characteristics could imply systematic differences between the treatment and the control group 261
12 Threats to internal validity: [continued] Partial compliance Some members of the control group receive the treatment Some members of the treatment group do not Attrition Example: The most able trainees drop out of the training program due to their acquired job training skills (they get out-oftown jobs) Only the least able members of the treatment group remain 262
13 Threats to internal validity: [continued] Experimental effects In experiments with human subjects, merely because the subjects are in an experiment can change their behavior Hawthorne effect Remarks: A failure to randomize can be detected, if a (binary) regression of X on other variables has explanatory power (e.g. the treatment group has a significantly larger portion of men than the control group) 263
14 Remarks: [continued] Partial compliance is not always a severe problem: if actual treatment (X i ) and the initial (random) assignment (Z i ) are both observable, we can use Z i as an instrument If there is partial compliance, Z i is correlated with X i (relevance) and Z i is exogenous due to random assignment Threats to external validity: Non-representative sample Non-representative treatment General equilibrium effects (scale effects) 264
15 9.3. Experimental estimates of the effect of class size reduction Project STAR: (Student-Teacher-Achievement Ratio) 4-year study When entering the schooling system, a student was randomly assigned to one of three groups: regular class (22 to 25 students), regular class plus aide, small class (13 to 17 students) Regular class students were re-randomized after first year to regular or regular-plus-aide class Grades: Kindergarten, 1st, 2nd, 3rd year Dependent variable Y i : Stanford Achievement Test scores 265
16 Project STAR: [continued] Owing to the two treatment groups (small class, regular class plus aide), the differences regression model specification is where Y i = β 0 + β 1 SmallClass i + β 2 RegAide i + u i SmallClass i = { 1 if student i is in a small class 0 otherwise RegAide i = { 1 if student i is in a regular-plus-aide class 0 otherwise 266
17 Project STAR: [continued] Additional regressors Teacher experience Free lunch eligibility Gender Race Detailed discussion of results: see class 267
18 9.4. Quasi-experiments Definition 9.2: (Quasi-experiment) A quasi-experiment (or natural experiment) has a source of randomization that is as if randomly assigned, but this variation was not the result of an explicit randomized treatment and control design. Two types of quasi-experiments: The treatment X is as if randomly assigned (possibly conditional on control variables) (Type I) 268
19 Two types of quasi-experiments: [continued] A variable Z, which influences receipt of the treatment X, is as if randomly assigned, so that we can use Z as an instrument (Type II) Type I: Notation: Y before i = value of Y for unit i before the experiment Yi after = value of Y for unit i after the experiment Ȳ treatment, before = sample mean of Y of the treatment group before the experiment Ȳ treatment, after = sample mean of Y of the treatment group after the experiment 269
20 Notation: [continued] Ȳ control, before = sample mean of Y of the control group before the experiment Ȳ control, after = sample mean of Y of the control group after the experiment Remarks: If the treatment is as if randomly assigned, conditional on some oberserved variable W, then the treatment effect can in principle be estimated using the differences regression (9.3) on Slide 257 However, some adjustment appears to become necessary due to missing control over randomization differences-in-differences estimator 270
21 Definition 9.3: (Differences-in-differences estimator) The differences-in-differences estimator ˆβ diffs-in-diffs 1 is defined as the average change in Y for those in the treatment group, minus the average change in Y for those in the control group: ˆβ 1 diffs-in-diffs = (Ȳ treatment, after Ȳ treatment, before ) (Ȳ control, after Ȳ control, before ) = Ȳ treatment Ȳ control, where Ȳ treatment is the average change in Y in the treatment group and Ȳ control is the average change in Y in the control group. 271
22 Remarks: If the treatment is randomly assigned, then ˆβ diffs-in-diffs 1 is an unbiased and consistent estimator of the causal effect The differences-in-differences estimator ˆβ diffs-in-diffs 1 is equivalent to the OLS estimator of β 1 in the regression equation Y i = β 0 + β X i + u i, where Y i = Yi after Yi before and X i = 1, if the ith individual is treated (and 0 otherwise) The differences-indifferences estimator allows for systematic differences in pre-treatment characteristics, which may occur in a quasi-experiment, because treatment is not randomly assigned 272
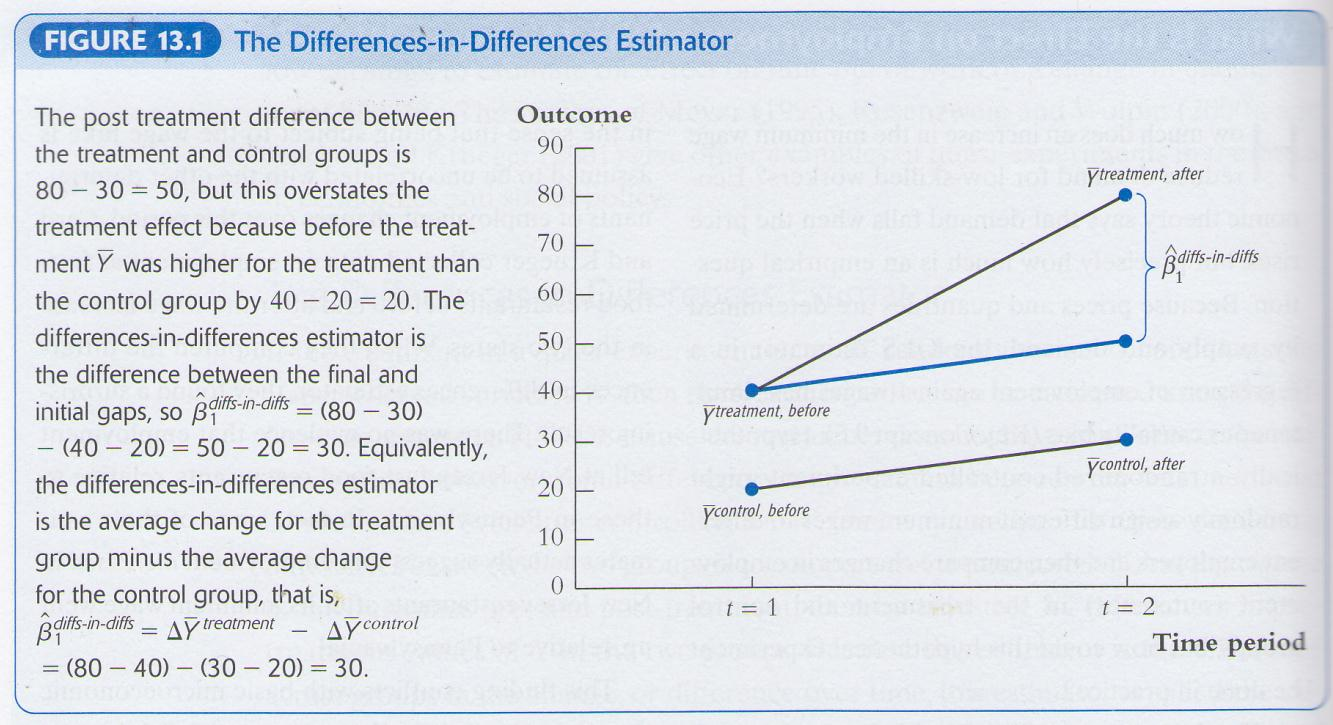
23 The differences-in-differences estimator 273
24 Remarks: If the treatment X is only as if randomly assigned given a control variable W, then conditional mean independence holds E(u i X i, W i ) = E(u i W i ) and the OLS estimator is unbiased and consistent Regression equation Y i = β 0 + β 1 X i + β 2 W i + u i Remember that β 2 has no causal interpretation Clearly, additional regressors W 1i,..., W ri (measuring individual characteristics prior to the experiment) could be included 274
25 Type II: Setting: If a variable Z, which influences treatment X, is as if randomly assigned (conditional on a control variable w), then Z can be used as an instrumental variable for X in an IV regression including the control variable W The instrument Z is exogenous (due to random assignment) The instrument Z is relevant as it is correlated with X 275
26 Example: Does treatment by a specialized stroke unit increase the chance to survive a stroke? Treatment X is non-random (it might depend on patient characteristics and the doctor) But the distance from the next stroke unit is as if randomly assigned and can thus be used as an instrument Remark: A deeper consideration of Type-II quasi-experiments is beyond the scope of this lecture 276
27 Regression discontinuity estimators: If treatment depends on when an observable variable W crosses a threshold value w 0, then you can estimate the treatment effect by comparing individuals just below the threshold (treated) to those just above the threshold (untreated) The treatment effect shows up as the jump in the outcome and the magnitude of this jump estimates the treatment effect In sharp regression discontinuity designs, everyone below the threshold receives treatment In fuzzy regression discontinuity designs, crossing the threshold only affects the probability of treatment 277

28 Regression discontinuity design scatterplot 278
29 Sharp regression discontinuity: Everybody with W < w 0 receives treatment: X i = { 1 if Wi < w 0 0 otherwise Estimate the treatment effect β 1 by OLS of the following regression specification: Y i = β 0 + β 1 X i + β 2 W i + u i If crossing the threshold affects Y i only through the treatment, then E(u i X i, W i ) = E(U i W i ), so that ˆβ 1 is unbiased 279
30 Fuzzy regression discontinuity: Suppose, the probability of treatment (X i = 1) depends on whether Z i = 1 or Z i = 0, where Z i = { 1 if Wi < w 0 0 otherwise Estimate the treatment effect β 1 by OLS of the following regression specification: Y i = β 0 + β 1 X i + β 2 W i + u i If crossing the threshold has no direct effect on Y i (but only affects Y i by influencing the probability of treatment), then Z i is a valid instrument for treatment X i Use IV estimation rather than OLS 280
31 9.5. Potential problems with quasi-experiments Threats to validity: Same threats to internal validity as for ideal experiments (failure to randomize, partial compliance) Note that experimental effects do not occur in quasi-experiments Same threats to external validity as for ideal experiments (non-representative sample or treatment, general equlilibrium effects) 281
Section 14 Simple Linear Regression: Introduction to Least Squares Regression
 Slide 1 Section 14 Simple Linear Regression: Introduction to Least Squares Regression There are several different measures of statistical association used for understanding the quantitative relationship
MULTIPLE REGRESSION WITH CATEGORICAL DATA
 DEPARTMENT OF POLITICAL SCIENCE AND INTERNATIONAL RELATIONS Posc/Uapp 86 MULTIPLE REGRESSION WITH CATEGORICAL DATA I. AGENDA: A. Multiple regression with categorical variables. Coding schemes. Interpreting
Empirical Methods in Applied Economics
 Empirical Methods in Applied Economics Jörn-Ste en Pischke LSE October 2005 1 Observational Studies and Regression 1.1 Conditional Randomization Again When we discussed experiments, we discussed already
Chapter 9 Assessing Studies Based on Multiple Regression
 Chapter 9 Assessing Studies Based on Multiple Regression Solutions to Empirical Exercises 1. Age 0.439** (0.030) Age 2 Data from 2004 (1) (2) (3) (4) (5) (6) (7) (8) Dependent Variable AHE ln(ahe) ln(ahe)
IAPRI Quantitative Analysis Capacity Building Series. Multiple regression analysis & interpreting results
 IAPRI Quantitative Analysis Capacity Building Series Multiple regression analysis & interpreting results How important is R-squared? R-squared Published in Agricultural Economics 0.45 Best article of the
Econometrics Simple Linear Regression
 Econometrics Simple Linear Regression Burcu Eke UC3M Linear equations with one variable Recall what a linear equation is: y = b 0 + b 1 x is a linear equation with one variable, or equivalently, a straight
2. Linear regression with multiple regressors
 2. Linear regression with multiple regressors Aim of this section: Introduction of the multiple regression model OLS estimation in multiple regression Measures-of-fit in multiple regression Assumptions
HOW EFFECTIVE IS TARGETED ADVERTISING?
 HOW EFFECTIVE IS TARGETED ADVERTISING? Ayman Farahat and Michael Bailey Marketplace Architect Yahoo! July 28, 2011 Thanks Randall Lewis, Yahoo! Research Agenda An Introduction to Measuring Effectiveness
Panel Data Econometrics
 Panel Data Econometrics Master of Science in Economics - University of Geneva Christophe Hurlin, Université d Orléans University of Orléans January 2010 De nition A longitudinal, or panel, data set is
ECON 142 SKETCH OF SOLUTIONS FOR APPLIED EXERCISE #2
 University of California, Berkeley Prof. Ken Chay Department of Economics Fall Semester, 005 ECON 14 SKETCH OF SOLUTIONS FOR APPLIED EXERCISE # Question 1: a. Below are the scatter plots of hourly wages
Statistics 2014 Scoring Guidelines
 AP Statistics 2014 Scoring Guidelines College Board, Advanced Placement Program, AP, AP Central, and the acorn logo are registered trademarks of the College Board. AP Central is the official online home
What s New in Econometrics? Lecture 8 Cluster and Stratified Sampling
 What s New in Econometrics? Lecture 8 Cluster and Stratified Sampling Jeff Wooldridge NBER Summer Institute, 2007 1. The Linear Model with Cluster Effects 2. Estimation with a Small Number of Groups and
Correlational Research. Correlational Research. Stephen E. Brock, Ph.D., NCSP EDS 250. Descriptive Research 1. Correlational Research: Scatter Plots
 Correlational Research Stephen E. Brock, Ph.D., NCSP California State University, Sacramento 1 Correlational Research A quantitative methodology used to determine whether, and to what degree, a relationship
Introduction to Fixed Effects Methods
 Introduction to Fixed Effects Methods 1 1.1 The Promise of Fixed Effects for Nonexperimental Research... 1 1.2 The Paired-Comparisons t-test as a Fixed Effects Method... 2 1.3 Costs and Benefits of Fixed
Difference in differences and Regression Discontinuity Design
 Difference in differences and Regression Discontinuity Design Majeure Economie September 2011 1 Difference in differences Intuition Identification of a causal effect Discussion of the assumption Examples
Solución del Examen Tipo: 1
 Solución del Examen Tipo: 1 Universidad Carlos III de Madrid ECONOMETRICS Academic year 2009/10 FINAL EXAM May 17, 2010 DURATION: 2 HOURS 1. Assume that model (III) verifies the assumptions of the classical
ECON 523 Applied Econometrics I /Masters Level American University, Spring 2008. Description of the course
 ECON 523 Applied Econometrics I /Masters Level American University, Spring 2008 Instructor: Maria Heracleous Lectures: M 8:10-10:40 p.m. WARD 202 Office: 221 Roper Phone: 202-885-3758 Office Hours: M W
Binary Adders: Half Adders and Full Adders
 Binary Adders: Half Adders and Full Adders In this set of slides, we present the two basic types of adders: 1. Half adders, and 2. Full adders. Each type of adder functions to add two binary bits. In order
Sampling. COUN 695 Experimental Design
 Sampling COUN 695 Experimental Design Principles of Sampling Procedures are different for quantitative and qualitative research Sampling in quantitative research focuses on representativeness Sampling
CALCULATIONS & STATISTICS
 CALCULATIONS & STATISTICS CALCULATION OF SCORES Conversion of 1-5 scale to 0-100 scores When you look at your report, you will notice that the scores are reported on a 0-100 scale, even though respondents
Chapter 10: Basic Linear Unobserved Effects Panel Data. Models:
 Chapter 10: Basic Linear Unobserved Effects Panel Data Models: Microeconomic Econometrics I Spring 2010 10.1 Motivation: The Omitted Variables Problem We are interested in the partial effects of the observable
AP STATISTICS REVIEW (YMS Chapters 1-8)
") AP STATISTICS REVIEW (YMS Chapters 1-8) Exploring Data (Chapter 1) Categorical Data nominal scale, names e.g. male/female or eye color or breeds of dogs Quantitative Data rational scale (can +,,, with
AP STATISTICS REVIEW (YMS Chapters 1-8) Exploring Data (Chapter 1) Categorical Data nominal scale, names e.g. male/female or eye color or breeds of dogs Quantitative Data rational scale (can +,,, with
IMPACT EVALUATION: INSTRUMENTAL VARIABLE METHOD
 REPUBLIC OF SOUTH AFRICA GOVERNMENT-WIDE MONITORING & IMPACT EVALUATION SEMINAR IMPACT EVALUATION: INSTRUMENTAL VARIABLE METHOD SHAHID KHANDKER World Bank June 2006 ORGANIZED BY THE WORLD BANK AFRICA IMPACT
1. Suppose that a score on a final exam depends upon attendance and unobserved factors that affect exam performance (such as student ability).
.") Examples of Questions on Regression Analysis: 1. Suppose that a score on a final exam depends upon attendance and unobserved factors that affect exam performance (such as student ability). Then,. When
Examples of Questions on Regression Analysis: 1. Suppose that a score on a final exam depends upon attendance and unobserved factors that affect exam performance (such as student ability). Then,. When
Welcome back to EDFR 6700. I m Jeff Oescher, and I ll be discussing quantitative research design with you for the next several lessons.
 Welcome back to EDFR 6700. I m Jeff Oescher, and I ll be discussing quantitative research design with you for the next several lessons. I ll follow the text somewhat loosely, discussing some chapters out
Earnings in private jobs after participation to post-doctoral programs : an assessment using a treatment effect model. Isabelle Recotillet
 Earnings in private obs after participation to post-doctoral programs : an assessment using a treatment effect model Isabelle Recotillet Institute of Labor Economics and Industrial Sociology, UMR 6123,
Statistics courses often teach the two-sample t-test, linear regression, and analysis of variance
 2 Making Connections: The Two-Sample t-test, Regression, and ANOVA In theory, there s no difference between theory and practice. In practice, there is. Yogi Berra 1 Statistics courses often teach the two-sample
Elementary Statistics
 Elementary Statistics Chapter 1 Dr. Ghamsary Page 1 Elementary Statistics M. Ghamsary, Ph.D. Chap 01 1 Elementary Statistics Chapter 1 Dr. Ghamsary Page 2 Statistics: Statistics is the science of collecting,
Financial Risk Management Exam Sample Questions/Answers
 Financial Risk Management Exam Sample Questions/Answers Prepared by Daniel HERLEMONT 1 2 3 4 5 6 Chapter 3 Fundamentals of Statistics FRM-99, Question 4 Random walk assumes that returns from one time period
Univariate Regression
 Univariate Regression Correlation and Regression The regression line summarizes the linear relationship between 2 variables Correlation coefficient, r, measures strength of relationship: the closer r is
Multiple Imputation for Missing Data: A Cautionary Tale
 Multiple Imputation for Missing Data: A Cautionary Tale Paul D. Allison University of Pennsylvania Address correspondence to Paul D. Allison, Sociology Department, University of Pennsylvania, 3718 Locust
Early Bird Catches the Worm: The Causal Impact of Pre-school Participation and Teacher Qualifications on Year 3 NAPLAN Outcomes
 Early Bird Catches the Worm: The Causal Impact of Pre-school Participation and Teacher Qualifications on Year 3 NAPLAN Outcomes This research looks at the causal impact of attendance at pre-school i in
problem arises when only a non-random sample is available differs from censored regression model in that x i is also unobserved
 4 Data Issues 4.1 Truncated Regression population model y i = x i β + ε i, ε i N(0, σ 2 ) given a random sample, {y i, x i } N i=1, then OLS is consistent and efficient problem arises when only a non-random
Lecture 15. Endogeneity & Instrumental Variable Estimation
 Lecture 15. Endogeneity & Instrumental Variable Estimation Saw that measurement error (on right hand side) means that OLS will be biased (biased toward zero) Potential solution to endogeneity instrumental
Linear Regression. Chapter 5. Prediction via Regression Line Number of new birds and Percent returning. Least Squares
 Linear Regression Chapter 5 Regression Objective: To quantify the linear relationship between an explanatory variable (x) and response variable (y). We can then predict the average response for all subjects
IPDET Module 6: Descriptive, Normative, and Impact Evaluation Designs
 IPDET Module 6: Descriptive, Normative, and Impact Evaluation Designs Intervention or Policy Evaluation Questions Design Questions Elements Types Key Points Introduction What Is Evaluation Design? Connecting
5.4 Solving Percent Problems Using the Percent Equation
 5. Solving Percent Problems Using the Percent Equation In this section we will develop and use a more algebraic equation approach to solving percent equations. Recall the percent proportion from the last
Inclusion and Exclusion Criteria
 Inclusion and Exclusion Criteria Inclusion criteria = attributes of subjects that are essential for their selection to participate. Inclusion criteria function remove the influence of specific confounding
Chapter 10. Key Ideas Correlation, Correlation Coefficient (r),
,") Chapter 0 Key Ideas Correlation, Correlation Coefficient (r), Section 0-: Overview We have already explored the basics of describing single variable data sets. However, when two quantitative variables
Chapter 0 Key Ideas Correlation, Correlation Coefficient (r), Section 0-: Overview We have already explored the basics of describing single variable data sets. However, when two quantitative variables
FIXED EFFECTS AND RELATED ESTIMATORS FOR CORRELATED RANDOM COEFFICIENT AND TREATMENT EFFECT PANEL DATA MODELS
 FIXED EFFECTS AND RELATED ESTIMATORS FOR CORRELATED RANDOM COEFFICIENT AND TREATMENT EFFECT PANEL DATA MODELS Jeffrey M. Wooldridge Department of Economics Michigan State University East Lansing, MI 48824-1038
In an experimental study there are two types of variables: Independent variable (I will abbreviate this as the IV)
") 1 Experimental Design Part I Richard S. Balkin, Ph. D, LPC-S, NCC 2 Overview Experimental design is the blueprint for quantitative research and serves as the foundation of what makes quantitative research
1 Experimental Design Part I Richard S. Balkin, Ph. D, LPC-S, NCC 2 Overview Experimental design is the blueprint for quantitative research and serves as the foundation of what makes quantitative research
Multiple Linear Regression in Data Mining
 Multiple Linear Regression in Data Mining Contents 2.1. A Review of Multiple Linear Regression 2.2. Illustration of the Regression Process 2.3. Subset Selection in Linear Regression 1 2 Chap. 2 Multiple
Simple Regression Theory II 2010 Samuel L. Baker
 SIMPLE REGRESSION THEORY II 1 Simple Regression Theory II 2010 Samuel L. Baker Assessing how good the regression equation is likely to be Assignment 1A gets into drawing inferences about how close the
Lecture 3: Differences-in-Differences
 Lecture 3: Differences-in-Differences Fabian Waldinger Waldinger () 1 / 55 Topics Covered in Lecture 1 Review of fixed effects regression models. 2 Differences-in-Differences Basics: Card & Krueger (1994).
Techniques of Statistical Analysis II second group
 Techniques of Statistical Analysis II second group Bruno Arpino Office: 20.182; Building: Jaume I bruno.arpino@upf.edu 1. Overview The course is aimed to provide advanced statistical knowledge for the
Estimating the returns to education using the newest current population survey education questions
 Economics Letters 78 (2003) 385 394 www.elsevier.com/ locate/ econbase Estimating the returns to education using the newest current population survey education questions David A. Jaeger* Department of
Pre-experimental Designs for Description. Y520 Strategies for Educational Inquiry
 Pre-experimental Designs for Description Y520 Strategies for Educational Inquiry Pre-experimental designs-1 Research Methodology Is concerned with how the design is implemented and how the research is
Conducting an empirical analysis of economic data can be rewarding and
 CHAPTER 10 Conducting a Regression Study Using Economic Data Conducting an empirical analysis of economic data can be rewarding and informative. If you follow some basic guidelines, it is possible to use
research/scientific includes the following: statistical hypotheses: you have a null and alternative you accept one and reject the other
 1 Hypothesis Testing Richard S. Balkin, Ph.D., LPC-S, NCC 2 Overview When we have questions about the effect of a treatment or intervention or wish to compare groups, we use hypothesis testing Parametric
Control Trials. variable Y. Paper Type I - Descriptive. Use estimates from the first two types of. For ex. Some studies find that insurance
 Empirical Research Causality and Randomized Control Trials Three broad types of Empirical papers Paper Type I Descriptive CVD mortality over time Regional differences in medical care How are health insurance
Evaluating and Reforming Urban Schools
 Evaluating and Reforming Urban Schools Holger Sieg University of Pennsylvania November 2, 2015 The U.S. Education System The U.S. system of public education is generally perceived as in need of some serious
Missing Data. A Typology Of Missing Data. Missing At Random Or Not Missing At Random
 [Leeuw, Edith D. de, and Joop Hox. (2008). Missing Data. Encyclopedia of Survey Research Methods. Retrieved from http://sage-ereference.com/survey/article_n298.html] Missing Data An important indicator
Eight things you need to know about interpreting correlations:
 Research Skills One, Correlation interpretation, Graham Hole v.1.0. Page 1 Eight things you need to know about interpreting correlations: A correlation coefficient is a single number that represents the
Mode and Patient-mix Adjustment of the CAHPS Hospital Survey (HCAHPS)
") Mode and Patient-mix Adjustment of the CAHPS Hospital Survey (HCAHPS) April 30, 2008 Abstract A randomized Mode Experiment of 27,229 discharges from 45 hospitals was used to develop adjustments for the
Mode and Patient-mix Adjustment of the CAHPS Hospital Survey (HCAHPS) April 30, 2008 Abstract A randomized Mode Experiment of 27,229 discharges from 45 hospitals was used to develop adjustments for the
Economics of Education Review
 Economics of Education Review 29 (2010) 566 575 Contents lists available at ScienceDirect Economics of Education Review journal homepage: www.elsevier.com/locate/econedurev Skipping class in college and
LAGUARDIA COMMUNITY COLLEGE CITY UNIVERSITY OF NEW YORK DEPARTMENT OF MATHEMATICS, ENGINEERING, AND COMPUTER SCIENCE
 LAGUARDIA COMMUNITY COLLEGE CITY UNIVERSITY OF NEW YORK DEPARTMENT OF MATHEMATICS, ENGINEERING, AND COMPUTER SCIENCE MAT 119 STATISTICS AND ELEMENTARY ALGEBRA 5 Lecture Hours, 2 Lab Hours, 3 Credits Pre-
Causal Infraction and Network Marketing - Trends in Data Science
 Causality and Treatment Effects Prof. Jacob M. Montgomery Quantitative Political Methodology (L32 363) October 21, 2013 Lecture 13 (QPM 2013) Causality and Treatment Effects October 21, 2013 1 / 19 Overview
Answer: C. The strength of a correlation does not change if units change by a linear transformation such as: Fahrenheit = 32 + (5/9) * Centigrade
 * Centigrade") Statistics Quiz Correlation and Regression -- ANSWERS 1. Temperature and air pollution are known to be correlated. We collect data from two laboratories, in Boston and Montreal. Boston makes their measurements
Statistics Quiz Correlation and Regression -- ANSWERS 1. Temperature and air pollution are known to be correlated. We collect data from two laboratories, in Boston and Montreal. Boston makes their measurements
Measurement and Measurement Scales
 Measurement and Measurement Scales Measurement is the foundation of any scientific investigation Everything we do begins with the measurement of whatever it is we want to study Definition: measurement
Probability Using Dice
 Using Dice One Page Overview By Robert B. Brown, The Ohio State University Topics: Levels:, Statistics Grades 5 8 Problem: What are the probabilities of rolling various sums with two dice? How can you
SAMPLE SELECTION BIAS IN CREDIT SCORING MODELS
 SAMPLE SELECTION BIAS IN CREDIT SCORING MODELS John Banasik, Jonathan Crook Credit Research Centre, University of Edinburgh Lyn Thomas University of Southampton ssm0 The Problem We wish to estimate an
Discrete Mathematics and Probability Theory Fall 2009 Satish Rao, David Tse Note 10
 CS 70 Discrete Mathematics and Probability Theory Fall 2009 Satish Rao, David Tse Note 10 Introduction to Discrete Probability Probability theory has its origins in gambling analyzing card games, dice,
CORRELATIONAL ANALYSIS: PEARSON S r Purpose of correlational analysis The purpose of performing a correlational analysis: To discover whether there
 CORRELATIONAL ANALYSIS: PEARSON S r Purpose of correlational analysis The purpose of performing a correlational analysis: To discover whether there is a relationship between variables, To find out the
Lecture 3: Models of Solutions
 Materials Science & Metallurgy Master of Philosophy, Materials Modelling, Course MP4, Thermodynamics and Phase Diagrams, H. K. D. H. Bhadeshia Lecture 3: Models of Solutions List of Symbols Symbol G M
Accounting for Time-Varying Unobserved Ability Heterogeneity within Education Production Functions
 Accounting for Time-Varying Unobserved Ability Heterogeneity within Education Production Functions Weili Ding Queen s University Steven F. Lehrer Queen s University and NBER July 2008 Abstract Traditional
An Investigation of the Statistical Modelling Approaches for MelC
 An Investigation of the Statistical Modelling Approaches for MelC Literature review and recommendations By Jessica Thomas, 30 May 2011 Contents 1. Overview... 1 2. The LDV... 2 2.1 LDV Specifically in
Why High-Order Polynomials Should Not be Used in Regression Discontinuity Designs
 Why High-Order Polynomials Should Not be Used in Regression Discontinuity Designs Andrew Gelman Guido Imbens 2 Aug 2014 Abstract It is common in regression discontinuity analysis to control for high order
Lecture Note: Self-Selection The Roy Model. David H. Autor MIT 14.661 Spring 2003 November 14, 2003
 Lecture Note: Self-Selection The Roy Model David H. Autor MIT 14.661 Spring 2003 November 14, 2003 1 1 Introduction A core topic in labor economics is self-selection. What this term means in theory is
6.4 Normal Distribution
 Contents 6.4 Normal Distribution....................... 381 6.4.1 Characteristics of the Normal Distribution....... 381 6.4.2 The Standardized Normal Distribution......... 385 6.4.3 Meaning of Areas under
The Impact of Retail Payment Innovations on Cash Usage
 1/23 The Impact of Retail Payment Innovations on Cash Usage Ben S.C. Fung a Kim P. Huynh a Leonard Sabetti b a Bank of Canada b George Mason University ECB-MNB Joint Conference Cost and efficiency of retail
Test Bias. As we have seen, psychological tests can be well-conceived and well-constructed, but
 Test Bias As we have seen, psychological tests can be well-conceived and well-constructed, but none are perfect. The reliability of test scores can be compromised by random measurement error (unsystematic
An Introduction to Regression Analysis
 The Inaugural Coase Lecture An Introduction to Regression Analysis Alan O. Sykes * Regression analysis is a statistical tool for the investigation of relationships between variables. Usually, the investigator
Study Guide for the Final Exam
 Study Guide for the Final Exam When studying, remember that the computational portion of the exam will only involve new material (covered after the second midterm), that material from Exam 1 will make
A LONGITUDINAL AND SURVIVAL MODEL WITH HEALTH CARE USAGE FOR INSURED ELDERLY. Workshop
 A LONGITUDINAL AND SURVIVAL MODEL WITH HEALTH CARE USAGE FOR INSURED ELDERLY Ramon Alemany Montserrat Guillén Xavier Piulachs Lozada Riskcenter - IREA Universitat de Barcelona http://www.ub.edu/riskcenter
Chapter 7 Sampling (Reminder: Don t forget to utilize the concept maps and study questions as you study this and the other chapters.
 Chapter 7 Sampling (Reminder: Don t forget to utilize the concept maps and study questions as you study this and the other chapters.) The purpose of Chapter 7 it to help you to learn about sampling in
Correlational Research
 Correlational Research Chapter Fifteen Correlational Research Chapter Fifteen Bring folder of readings The Nature of Correlational Research Correlational Research is also known as Associational Research.
Overview of Violations of the Basic Assumptions in the Classical Normal Linear Regression Model
 Overview of Violations of the Basic Assumptions in the Classical Normal Linear Regression Model 1 September 004 A. Introduction and assumptions The classical normal linear regression model can be written
On Marginal Effects in Semiparametric Censored Regression Models
 On Marginal Effects in Semiparametric Censored Regression Models Bo E. Honoré September 3, 2008 Introduction It is often argued that estimation of semiparametric censored regression models such as the
Chapter 1. Vector autoregressions. 1.1 VARs and the identi cation problem
 Chapter Vector autoregressions We begin by taking a look at the data of macroeconomics. A way to summarize the dynamics of macroeconomic data is to make use of vector autoregressions. VAR models have become
Basic Electronics Prof. Dr. Chitralekha Mahanta Department of Electronics and Communication Engineering Indian Institute of Technology, Guwahati
 Basic Electronics Prof. Dr. Chitralekha Mahanta Department of Electronics and Communication Engineering Indian Institute of Technology, Guwahati Module: 2 Bipolar Junction Transistors Lecture-2 Transistor
Point Biserial Correlation Tests
 Chapter 807 Point Biserial Correlation Tests Introduction The point biserial correlation coefficient (ρ in this chapter) is the product-moment correlation calculated between a continuous random variable
TIME SERIES ANALYSIS
 DEPARTMENT OF POLITICAL SCIENCE AND INTERNATIONAL RELATIONS Posc/Uapp 816 TIME SERIES ANALYSIS I. AGENDA: A. Correction B. Time series C. Reading: Agresti and Finlay Statistical Methods in the Social Sciences,
Statistics 151 Practice Midterm 1 Mike Kowalski
 Statistics 151 Practice Midterm 1 Mike Kowalski Statistics 151 Practice Midterm 1 Multiple Choice (50 minutes) Instructions: 1. This is a closed book exam. 2. You may use the STAT 151 formula sheets and
Analysis of Racial and Ethnic Disparities in Achievement. Test Scores 1
 Accounting for the Effect of Schooling and Abilities in the Analysis of Racial and Ethnic Disparities in Achievement Test Scores 1 James J. Heckman University of Chicago and Maria I. Larenas Center for
Correlation key concepts:
 CORRELATION Correlation key concepts: Types of correlation Methods of studying correlation a) Scatter diagram b) Karl pearson s coefficient of correlation c) Spearman s Rank correlation coefficient d)
1.5 Oneway Analysis of Variance
 Statistics: Rosie Cornish. 200. 1.5 Oneway Analysis of Variance 1 Introduction Oneway analysis of variance (ANOVA) is used to compare several means. This method is often used in scientific or medical experiments
Teacher Course Evaluations and Student Grades: An Academic Tango
 7/16/02 1:38 PM Page 9 Does the interplay of grading policies and teacher-course evaluations undermine our education system? Teacher Course Evaluations and Student s: An Academic Tango Valen E. Johnson
The performance of immigrants in the Norwegian labor market
 J Popul Econ (1998) 11:293 303 Springer-Verlag 1998 The performance of immigrants in the Norwegian labor market John E. Hayfron Department of Economics, University of Bergen, Fosswinckelsgt. 6, N-5007
Analyzing Intervention Effects: Multilevel & Other Approaches. Simplest Intervention Design. Better Design: Have Pretest
 Analyzing Intervention Effects: Multilevel & Other Approaches Joop Hox Methodology & Statistics, Utrecht Simplest Intervention Design R X Y E Random assignment Experimental + Control group Analysis: t
COMP6053 lecture: Relationship between two variables: correlation, covariance and r-squared. jn2@ecs.soton.ac.uk
 COMP6053 lecture: Relationship between two variables: correlation, covariance and r-squared jn2@ecs.soton.ac.uk Relationships between variables So far we have looked at ways of characterizing the distribution
University of Ljubljana Doctoral Programme in Statistics Methodology of Statistical Research Written examination February 14 th, 2014.
 University of Ljubljana Doctoral Programme in Statistics ethodology of Statistical Research Written examination February 14 th, 2014 Name and surname: ID number: Instructions Read carefully the wording
6/15/2005 7:54 PM. Affirmative Action s Affirmative Actions: A Reply to Sander
 Reply Affirmative Action s Affirmative Actions: A Reply to Sander Daniel E. Ho I am grateful to Professor Sander for his interest in my work and his willingness to pursue a valid answer to the critical
Estimating the Return to College Selectivity over the Career Using Administrative Earning Data. Stacy Dale Mathematica Policy Research.
 Estimating the Return to College Selectivity over the Career Using Administrative Earning Data Stacy Dale Mathematica Policy Research and Alan B. Krueger Princeton University February 16, 2011 Abstract
Simple linear regression
 Simple linear regression Introduction Simple linear regression is a statistical method for obtaining a formula to predict values of one variable from another where there is a causal relationship between
Trigonometric Functions and Triangles
 Trigonometric Functions and Triangles Dr. Philippe B. Laval Kennesaw STate University August 27, 2010 Abstract This handout defines the trigonometric function of angles and discusses the relationship between
Information Theory and Coding Prof. S. N. Merchant Department of Electrical Engineering Indian Institute of Technology, Bombay
 Information Theory and Coding Prof. S. N. Merchant Department of Electrical Engineering Indian Institute of Technology, Bombay Lecture - 17 Shannon-Fano-Elias Coding and Introduction to Arithmetic Coding
Lasso on Categorical Data
 Lasso on Categorical Data Yunjin Choi, Rina Park, Michael Seo December 14, 2012 1 Introduction In social science studies, the variables of interest are often categorical, such as race, gender, and nationality.
Do Supplemental Online Recorded Lectures Help Students Learn Microeconomics?*
 Do Supplemental Online Recorded Lectures Help Students Learn Microeconomics?* Jennjou Chen and Tsui-Fang Lin Abstract With the increasing popularity of information technology in higher education, it has
LOGIT AND PROBIT ANALYSIS
 LOGIT AND PROBIT ANALYSIS A.K. Vasisht I.A.S.R.I., Library Avenue, New Delhi 110 012 amitvasisht@iasri.res.in In dummy regression variable models, it is assumed implicitly that the dependent variable Y
Statistics E100 Fall 2013 Practice Midterm I - A Solutions
 STATISTICS E100 FALL 2013 PRACTICE MIDTERM I - A SOLUTIONS PAGE 1 OF 5 Statistics E100 Fall 2013 Practice Midterm I - A Solutions 1. (16 points total) Below is the histogram for the number of medals won