Probability and Probability Distributions
|
|
|
- Preston Sparks
- 7 years ago
- Views:
Transcription

1 Chapter 1-3 Probability and Probability Distributions 1-3-1
2 Probability The relative frequency of occurrence of an event is known as its probability. It is the ratio of the number of favorable events to the total number of possible events
3 Example An inspector checks a sample of 1000 parts for conformance to standard. 40 do not meet standard. What is the probability of a defect? P(d) = 40/1000 =
4 Probability Definitions Two events are mutually exclusive if they have no outcomes in common or if when one occurs the other cannot. Two events are non-mutually exclusive when they share a common area of occurrence or can both happen at the same time
5 Addition Rule for Mutually Exclusive Events P(A or B) = P(A) + P(B) 1-3-5
6 Example A sample of 100 employees is selected at random from the company. Within this sample are 61 males and 39 females. Find the probability of Finding a male Finding a female Finding a male or a female 1-3-6
7 Solution Male: 61/100 =.61 Female: 39/100 =.39 Male or Female = = 1.00 (Addition Rule) 1-3-7
8 Replacement Sampling A sample or group of samples is returned to the population after sampling so that the probabilities associated with selecting additional items are not changed
9 Multiplication Rule for Independent Events The probability that one event will occur and that a second independent event will also occur requires the use of the multiplication rule. P(A and B) = P(A)P(B) 1-3-9
10 Example What is the probability of selecting two clubs in two draws from a deck of cards if each card is replaced in the deck after it is drawn? P(club) = 13/52 P(club and club) = (13/52)(13/52) = (169)/(2704) =

11 Probability Distributions Complete listing of all possible outcomes along with the likelihood that each will occur. Discrete distribution is one in which the observed characteristics fit into a finite number of categories. Continuous distribution is one in which the observed characteristic may take on any value within a given range
12 Practical Uses of Probability Distributions Some practical uses of probability distributions are: To calculate confidence intervals for parameters and to calculate critical regions for hypothesis tests. For univariate data, it is often useful to determine a reasonable distributional model for the data. Statistical intervals and hypothesis tests are often based on specific distributional assumptions. Before computing an interval or test based on a distributional assumption, we need to verify that the assumption is justified for the given data set. In this case, the distribution does not need to be the best-fitting distribution for the data, but an adequate enough model so that the statistical technique yields valid conclusions. Simulation studies with random numbers generated from using a specific probability distribution are often needed
13 Probability Distributions The values of a probability distribution must be numbers on the interval from 0 to 1. The sum of all the values of a probability distribution must be equal to
14 Sample Probability Distribution Dice Outcome Ways to Achieve Ways Total: Data Set Relative Frequency
15 Binomial Distribution A discrete probability distribution used in defining the probability of favorable occurrences in a sample. Often used to define the probability of finding defects in a sample. Each event must have a constant probability of occurrence and each must be independent
16 Binomial Probability Formula n! P( x) x!( n x)! p Mean np Stdev np( 1 p) x ( p) nx 1 P(x) is the probability of a favorable event x n is the sample size p is probability of single favorable event! Is the symbol for factorial x is the favorable event
17 Example A component supplied by a certain vendor has a 10 percent chance of being defective. Upon receipt of a lot a sample of 10 is selected at random. What is the probability the sample will contain 2 defects 2 or fewer defects
18 Solution Part a Because an item can be good or defective this is binomial. n = 10 p =.1 x = 2 P(x) = ((n!)/x!(n-x)!)(p) x (1-p) n-x P(2) = ((10!)/(2!(10-2)!))(.1) 2 (.90) 8 P(2) = (45)(.010)(.4305) =
19 Solution Part b The probability of 2 or fewer is the probability of 2 or 1 or 0. P(2) =.1937 P(1) = ((10!)/(1!9!))(.1) 1 (.9) 9 =.3874 P(0) = ((10!)/(0!10!))(.1) 0 (.9) 10 =.3487 P(2 or less) = P(2 or less) =
20 Probability Table Values of the binomial probability distribution are included in the appendix to this training book and are found in Table A

21 1-3-21

22 1-3-22

23 SPCXL

24 1-3-24
25 Poisson Distribution The Poisson distribution is a discrete probability distribution used to determine the probability of x occurrences in a sample of n where the probability of a favorable event is constant, but relatively small. Often used when the probability is expressed as a rate
26 Poisson Probabilities P( x) Mean Stdev ( np) x x! np np e np P(x) is the probability of a favorable event x n is the sample size p is probability of single favorable event! Is the symbol for factorial x is the favorable event e =
27 Example Use the Poisson table (Table B) to answer the following: A textile manufacturer has kept records on the number of defects per yard of material. The probability has been.04. What is the probability that 20 yards of material will have 2 defects 3 or fewer defects
28 Excel
29 SPCXL
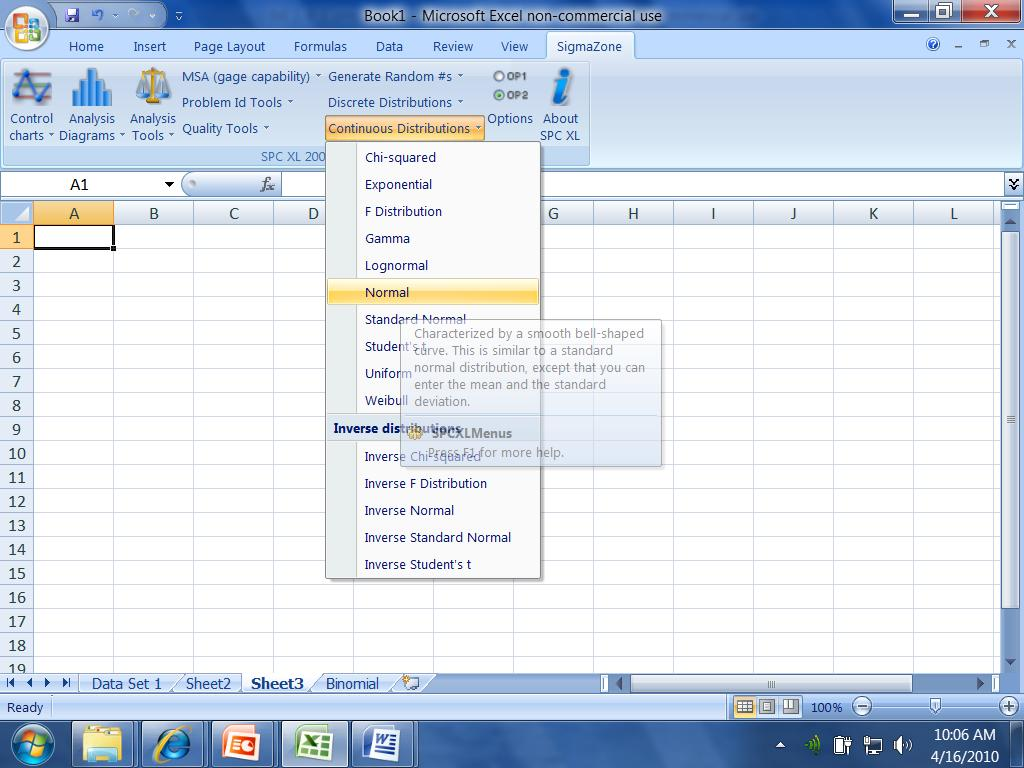
30 Normal Probability Distribution A continuous probability distribution used when there is a concentration of observations about the mean and equal likelihood that observations will occur above and below the mean
31 THE NORMAL LAW OF ERROR STANDS OUT IN THE EXPERIENCE OF MANKIND AS ONE OF THE BROADEST GENERALIZATIONS OF NATURAL PHILOSOPHY. IT SERVES AS THE GUIDING INSTRUMENT IN RESEARCHES IN THE PHYSICAL AND SOCIAL SCIENCES AND IN MEDICINE, AGRICULTURE, AND ENGINEERING. IT IS AN INDISPENSABLE TOOL FOR THE ANALYSIS AND THE INTERPRETATION OF THE BASIC DATA OBTAINED BY OBSERVATION
32 Normal Probability Distribution The mean and standard deviation are calculated with standard procedures. Distribution is symmetrical about the mean. y e 1 x ( ) 2 s s
33 Standard Normal Curve Normal probability distribution with a mean of 0 and a standard deviation of 1. Values tabulated z x s x (Table C) Table accessed with z transform (typical format shown)
34 Example Sixteen samples of product weight were measured. They averaged 80 with a standard deviation of 6. What is the probability that a sample taken at random from future production will be a. Greater than 83? b. Less than 78?
35 Example A product has specs of and A sample of 25 has an average of and a standard deviation of.1 What is the probability that an item will be a. Greater than 16.05? b. Less than 16.00? c. Between and 16.04?

36 1-3-36
37 1-3-37
38 Distribution of Sample Means z x - s n A population is normally distributed with a mean of 62 and a standard deviation of 3.5. What is the probability that a sample mean taken from a sample of size 16 will be larger than 60?
39 Chi Square Distribution The chi-square distribution results when independent variables with standard normal distributions are squared and summed. The formula for the probability density function of the chi-square distribution is f ( x) e 2 x 2 n 2 x n 1 2 n G( ) 2 for x 0 where n is the shape parameter and G is the gamma function. The formula for the gamma function is G( a) t 0 a1 e l dt
40 1-3-40
41 F Distribution The F distribution is the ratio of two chi-square distributions with degrees of freedom n 1 and n 2, respectively, where each chi-square has first been divided by its degrees of freedom. The formula for the probability density function of the F distribution is f n1 n 2 n1 G( )( ) 2 n n1 2 2 ( x) n1n 2 n1 n 2 n1x 2 G( ) G( )(1 ) 2 2 n where n 1 and n 2 are the shape parameters and G is the gamma function. 2 x n
42 1-3-42
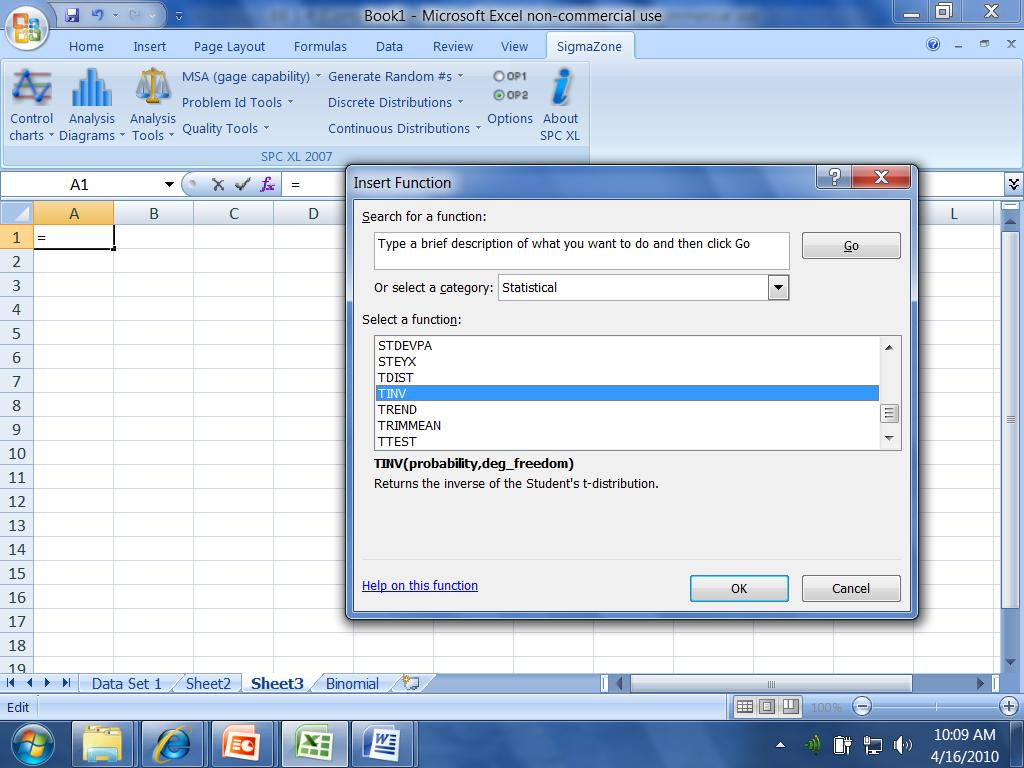
43 Student t Distribution The t distribution is used instead of the normal distribution whenever the standard deviation is estimated. The t distribution has relatively more scores in its tails than does the normal distribution. As the degrees of freedom increases, the t distribution approaches the normal distribution
44 Student t Distribution The formula for the probability density function of the t distribution is f ( x) 2 ( n 1) x 2 (1 ) n b (0.5,0.5n ) where b is the beta function and n is a positive integer shape parameter. The formula for the beta function is n b 1 b 1 (, b) t (1 t) dt
45 1-3-45
46 Hypergeometric Distribution A distribution closely related to the binomial that has a wide applicability in acceptance sampling. x is the number of favorable events N is the lot size n is the sample size D is the number of favorable events in the population P(x) D x N n N n D x [ ] Notation means combinations
47 Which Distribution to Use? The question continues to arise regarding which probability distribution should be used when. The following conditions, originally proposed by Burr in Elementary Statistical Quality Control address this issue. Conditions for a Binomial Distribution Constant probability of a defective on each draw of a piece is established. Results on drawings are independent of preceding results. n draws of a piece are taken. Number of defectives in the n draws are counted. Either/Or
48 Conditions for a Poisson Distribution Samples provide equal areas of opportunity for defects (the same size of unit, subassembly, length, area, or quantity.) Defects occur randomly and independently of each other. The average number remains constant. The possible number of defects is far greater than the average number of defects. Rate
49 Properties of a Standard Normal Distribution The total area lying between the curve and the horizontal z axis is 1, representing a total probability of 1. The height of the curve represents relative frequency. The relative frequency is greatest at z = 0. Relative frequencies steadily decrease as z moves away from 0 in either direction. The relative frequency rapidly approaches 0 in both directions. The curve is symmetrical around z = 0. Desired probabilities for ranges of z may be found from published tables of normal curve areas
50 Some Common Applications of Distributions Distribution Uses Hypergeometric Sampling Binomial Go-No Go Sampling Confidence Intervals - Proportions Control Charts-Proportion Defective Poisson Sampling Queueing - Arrival Rates Control Charts-Defects per Unit Normal Process Capability Tests of Hypothesis-Means, Correlation Coefficients Confidence Intervals - Means Student t Tests of Hypothesis Means Confidence Intervals - Means Chi Square Goodness of Fit Testing Confidence Intervals Standard Deviations F Tests of Hypothesis Standard Deviations Analysis of Variance Exponential Reliability Queueing - Service Rates Weibull Reliability
51 Descriptive Statistics Distribution Mean Standard Deviation Binomial np np(1 - p) Poisson np np Normal Student t x n x n (x n (x n x ) x ) 2 2 Exponential x n x n
52 Practice Problems In problems 1-3, use a binomially distributed sample with p =.2 and n = 14 to determine the probability of each event. 1. x is equal to x is less than x is greater than x is between 2 and Calculate the mean and the standard deviation for a binomially distributed sample with p =.2 and n =
53 Practice Problems In problems 6-10 use a binomially distributed sample with p =.6 and n = 10 to determine the probability of each event. 6. x is equal to x is greater than x is less than x is greater than x is between 0 and
54 Practice Problems In problems use a binomially distributed sample with p =.45 and n = 20 to determine the probability of each event. 11. x is greater than x is less than x is equal to x is between 2 and 7. In problems given that a sample follows the Poisson distribution and has a mean of.95, determine the requested value. 15. The standard deviation. 16. The probability that x is greater than The probability that x is less than The probability that x is between 1 and
55 Practice Problems 19. Given a normal probability distribution with a mean of 79 and a standard deviation of 4, at what value would we expect to find at least as large as 70? 20. Given a normal probability distribution with a mean of 20 and a standard deviation of.5. If we want to have 99% of all the process output between symmetrical specifications what should those specifications be? 21. What z value corresponds to having a probability between the point and minus infinity of.025? 22. What z value corresponds to have a probaiblity between the point and positive infinity of.100?
56 Practice Problems In problems 23-32, determine the probability of each event for a normally distributed process with a mean of 120 and a standard deviation of x is greater than x is less than x is greater than x is less than x is greater than x is between 90 and x is between 125 and x is between 128 and x is between 116 and x is equal to
6.4 Normal Distribution
 Contents 6.4 Normal Distribution....................... 381 6.4.1 Characteristics of the Normal Distribution....... 381 6.4.2 The Standardized Normal Distribution......... 385 6.4.3 Meaning of Areas under
STT315 Chapter 4 Random Variables & Probability Distributions KM. Chapter 4.5, 6, 8 Probability Distributions for Continuous Random Variables
 Chapter 4.5, 6, 8 Probability Distributions for Continuous Random Variables Discrete vs. continuous random variables Examples of continuous distributions o Uniform o Exponential o Normal Recall: A random
Statistics I for QBIC. Contents and Objectives. Chapters 1 7. Revised: August 2013
 Statistics I for QBIC Text Book: Biostatistics, 10 th edition, by Daniel & Cross Contents and Objectives Chapters 1 7 Revised: August 2013 Chapter 1: Nature of Statistics (sections 1.1-1.6) Objectives
Institute of Actuaries of India Subject CT3 Probability and Mathematical Statistics
 Institute of Actuaries of India Subject CT3 Probability and Mathematical Statistics For 2015 Examinations Aim The aim of the Probability and Mathematical Statistics subject is to provide a grounding in
Probability and Statistics Prof. Dr. Somesh Kumar Department of Mathematics Indian Institute of Technology, Kharagpur
 Probability and Statistics Prof. Dr. Somesh Kumar Department of Mathematics Indian Institute of Technology, Kharagpur Module No. #01 Lecture No. #15 Special Distributions-VI Today, I am going to introduce
Week 4: Standard Error and Confidence Intervals
 Health Sciences M.Sc. Programme Applied Biostatistics Week 4: Standard Error and Confidence Intervals Sampling Most research data come from subjects we think of as samples drawn from a larger population.
STAT 35A HW2 Solutions
 STAT 35A HW2 Solutions http://www.stat.ucla.edu/~dinov/courses_students.dir/09/spring/stat35.dir 1. A computer consulting firm presently has bids out on three projects. Let A i = { awarded project i },
Normal distribution. ) 2 /2σ. 2π σ
 2 /2σ. 2π σ") Normal distribution The normal distribution is the most widely known and used of all distributions. Because the normal distribution approximates many natural phenomena so well, it has developed into a
Normal distribution The normal distribution is the most widely known and used of all distributions. Because the normal distribution approximates many natural phenomena so well, it has developed into a
Chapter 3 RANDOM VARIATE GENERATION
 Chapter 3 RANDOM VARIATE GENERATION In order to do a Monte Carlo simulation either by hand or by computer, techniques must be developed for generating values of random variables having known distributions.
E3: PROBABILITY AND STATISTICS lecture notes
 E3: PROBABILITY AND STATISTICS lecture notes 2 Contents 1 PROBABILITY THEORY 7 1.1 Experiments and random events............................ 7 1.2 Certain event. Impossible event............................
Summary of Formulas and Concepts. Descriptive Statistics (Ch. 1-4)
") Summary of Formulas and Concepts Descriptive Statistics (Ch. 1-4) Definitions Population: The complete set of numerical information on a particular quantity in which an investigator is interested. We assume
Summary of Formulas and Concepts Descriptive Statistics (Ch. 1-4) Definitions Population: The complete set of numerical information on a particular quantity in which an investigator is interested. We assume
Random variables, probability distributions, binomial random variable
 Week 4 lecture notes. WEEK 4 page 1 Random variables, probability distributions, binomial random variable Eample 1 : Consider the eperiment of flipping a fair coin three times. The number of tails that
Study Guide for the Final Exam
 Study Guide for the Final Exam When studying, remember that the computational portion of the exam will only involve new material (covered after the second midterm), that material from Exam 1 will make
4. Continuous Random Variables, the Pareto and Normal Distributions
 4. Continuous Random Variables, the Pareto and Normal Distributions A continuous random variable X can take any value in a given range (e.g. height, weight, age). The distribution of a continuous random
Chapter 4. Probability Distributions
 Chapter 4 Probability Distributions Lesson 4-1/4-2 Random Variable Probability Distributions This chapter will deal the construction of probability distribution. By combining the methods of descriptive
Probability Calculator
 Chapter 95 Introduction Most statisticians have a set of probability tables that they refer to in doing their statistical wor. This procedure provides you with a set of electronic statistical tables that
Section 5 Part 2. Probability Distributions for Discrete Random Variables
 Section 5 Part 2 Probability Distributions for Discrete Random Variables Review and Overview So far we ve covered the following probability and probability distribution topics Probability rules Probability
Statistical Functions in Excel
 Statistical Functions in Excel There are many statistical functions in Excel. Moreover, there are other functions that are not specified as statistical functions that are helpful in some statistical analyses.
Math 58. Rumbos Fall 2008 1. Solutions to Review Problems for Exam 2
 Math 58. Rumbos Fall 2008 1 Solutions to Review Problems for Exam 2 1. For each of the following scenarios, determine whether the binomial distribution is the appropriate distribution for the random variable
An Introduction to Basic Statistics and Probability
 An Introduction to Basic Statistics and Probability Shenek Heyward NCSU An Introduction to Basic Statistics and Probability p. 1/4 Outline Basic probability concepts Conditional probability Discrete Random
CHAPTER 6: Continuous Uniform Distribution: 6.1. Definition: The density function of the continuous random variable X on the interval [A, B] is.
![CHAPTER 6: Continuous Uniform Distribution: 6.1. Definition: The density function of the continuous random variable X on the interval [A, B] is.](/thumbs/40/21160284.jpg "CHAPTER 6: Continuous Uniform Distribution: 6.1. Definition: The density function of the continuous random variable X on the interval [A, B] is.") Some Continuous Probability Distributions CHAPTER 6: Continuous Uniform Distribution: 6. Definition: The density function of the continuous random variable X on the interval [A, B] is B A A x B f(x; A,
Some Continuous Probability Distributions CHAPTER 6: Continuous Uniform Distribution: 6. Definition: The density function of the continuous random variable X on the interval [A, B] is B A A x B f(x; A,
The Procedures of Monte Carlo Simulation (and Resampling)
") 154 Resampling: The New Statistics CHAPTER 10 The Procedures of Monte Carlo Simulation (and Resampling) A Definition and General Procedure for Monte Carlo Simulation Summary Until now, the steps to follow
154 Resampling: The New Statistics CHAPTER 10 The Procedures of Monte Carlo Simulation (and Resampling) A Definition and General Procedure for Monte Carlo Simulation Summary Until now, the steps to follow
Characteristics of Binomial Distributions
 Lesson2 Characteristics of Binomial Distributions In the last lesson, you constructed several binomial distributions, observed their shapes, and estimated their means and standard deviations. In Investigation
UNIVERSITY of MASSACHUSETTS DARTMOUTH Charlton College of Business Decision and Information Sciences Fall 2010
 UNIVERSITY of MASSACHUSETTS DARTMOUTH Charlton College of Business Decision and Information Sciences Fall 2010 COURSE: POM 500 Statistical Analysis, ONLINE EDITION, Fall 2010 Prerequisite: Finite Math
Important Probability Distributions OPRE 6301
 Important Probability Distributions OPRE 6301 Important Distributions... Certain probability distributions occur with such regularity in real-life applications that they have been given their own names.
4. Distribution (DIST)
") 4 4. Distribution (DIST) There is a variety of different types of distribution, but the most well-known is normal distribution, which is essential for performing statistical calculations. Normal distribution
4 4. Distribution (DIST) There is a variety of different types of distribution, but the most well-known is normal distribution, which is essential for performing statistical calculations. Normal distribution
Choosing Probability Distributions in Simulation
 MBA elective - Models for Strategic Planning - Session 14 Choosing Probability Distributions in Simulation Probability Distributions may be selected on the basis of Data Theory Judgment a mix of the above
Simple Random Sampling
 Source: Frerichs, R.R. Rapid Surveys (unpublished), 2008. NOT FOR COMMERCIAL DISTRIBUTION 3 Simple Random Sampling 3.1 INTRODUCTION Everyone mentions simple random sampling, but few use this method for
Notes on Continuous Random Variables
 Notes on Continuous Random Variables Continuous random variables are random quantities that are measured on a continuous scale. They can usually take on any value over some interval, which distinguishes
Fairfield Public Schools
 Mathematics Fairfield Public Schools AP Statistics AP Statistics BOE Approved 04/08/2014 1 AP STATISTICS Critical Areas of Focus AP Statistics is a rigorous course that offers advanced students an opportunity
EMPIRICAL FREQUENCY DISTRIBUTION
 INTRODUCTION TO MEDICAL STATISTICS: Mirjana Kujundžić Tiljak EMPIRICAL FREQUENCY DISTRIBUTION observed data DISTRIBUTION - described by mathematical models 2 1 when some empirical distribution approximates
Chapter 5. Discrete Probability Distributions
 Chapter 5. Discrete Probability Distributions Chapter Problem: Did Mendel s result from plant hybridization experiments contradicts his theory? 1. Mendel s theory says that when there are two inheritable
MATH 10: Elementary Statistics and Probability Chapter 5: Continuous Random Variables
 MATH 10: Elementary Statistics and Probability Chapter 5: Continuous Random Variables Tony Pourmohamad Department of Mathematics De Anza College Spring 2015 Objectives By the end of this set of slides,
Quantitative Methods for Finance
 Quantitative Methods for Finance Module 1: The Time Value of Money 1 Learning how to interpret interest rates as required rates of return, discount rates, or opportunity costs. 2 Learning how to explain
PROBABILITY AND SAMPLING DISTRIBUTIONS
 PROBABILITY AND SAMPLING DISTRIBUTIONS SEEMA JAGGI AND P.K. BATRA Indian Agricultural Statistics Research Institute Library Avenue, New Delhi - 0 0 seema@iasri.res.in. Introduction The concept of probability
Descriptive Statistics. Purpose of descriptive statistics Frequency distributions Measures of central tendency Measures of dispersion
 Descriptive Statistics Purpose of descriptive statistics Frequency distributions Measures of central tendency Measures of dispersion Statistics as a Tool for LIS Research Importance of statistics in research
Probability Distributions
 Learning Objectives Probability Distributions Section 1: How Can We Summarize Possible Outcomes and Their Probabilities? 1. Random variable 2. Probability distributions for discrete random variables 3.
Bowerman, O'Connell, Aitken Schermer, & Adcock, Business Statistics in Practice, Canadian edition
 Bowerman, O'Connell, Aitken Schermer, & Adcock, Business Statistics in Practice, Canadian edition Online Learning Centre Technology Step-by-Step - Excel Microsoft Excel is a spreadsheet software application
MEASURES OF VARIATION
 NORMAL DISTRIBTIONS MEASURES OF VARIATION In statistics, it is important to measure the spread of data. A simple way to measure spread is to find the range. But statisticians want to know if the data are
Curriculum Map Statistics and Probability Honors (348) Saugus High School Saugus Public Schools 2009-2010
 Saugus High School Saugus Public Schools 2009-2010") Curriculum Map Statistics and Probability Honors (348) Saugus High School Saugus Public Schools 2009-2010 Week 1 Week 2 14.0 Students organize and describe distributions of data by using a number of different
Curriculum Map Statistics and Probability Honors (348) Saugus High School Saugus Public Schools 2009-2010 Week 1 Week 2 14.0 Students organize and describe distributions of data by using a number of different
MATH 140 Lab 4: Probability and the Standard Normal Distribution
 MATH 140 Lab 4: Probability and the Standard Normal Distribution Problem 1. Flipping a Coin Problem In this problem, we want to simualte the process of flipping a fair coin 1000 times. Note that the outcomes
Mathematics (Project Maths)
") Pre-Leaving Certificate Examination Mathematics (Project Maths) Paper 2 Higher Level February 2010 2½ hours 300 marks Running total Examination number Centre stamp For examiner Question Mark 1 2 3 4 5
Pre-Leaving Certificate Examination Mathematics (Project Maths) Paper 2 Higher Level February 2010 2½ hours 300 marks Running total Examination number Centre stamp For examiner Question Mark 1 2 3 4 5
A POPULATION MEAN, CONFIDENCE INTERVALS AND HYPOTHESIS TESTING
 CHAPTER 5. A POPULATION MEAN, CONFIDENCE INTERVALS AND HYPOTHESIS TESTING 5.1 Concepts When a number of animals or plots are exposed to a certain treatment, we usually estimate the effect of the treatment
Without data, all you are is just another person with an opinion.
 OCR Statistics Module Revision Sheet The S exam is hour 30 minutes long. You are allowed a graphics calculator. Before you go into the exam make sureyou are fully aware of the contents of theformula booklet
BINOMIAL DISTRIBUTION
 MODULE IV BINOMIAL DISTRIBUTION A random variable X is said to follow binomial distribution with parameters n & p if P ( X ) = nc x p x q n x where x = 0, 1,2,3..n, p is the probability of success & q
SCHOOL OF ENGINEERING & BUILT ENVIRONMENT. Mathematics
 SCHOOL OF ENGINEERING & BUILT ENVIRONMENT Mathematics Probability and Probability Distributions 1. Introduction 2. Probability 3. Basic rules of probability 4. Complementary events 5. Addition Law for
Probability Distributions
 CHAPTER 6 Probability Distributions Calculator Note 6A: Computing Expected Value, Variance, and Standard Deviation from a Probability Distribution Table Using Lists to Compute Expected Value, Variance,
Exploratory Data Analysis
 Exploratory Data Analysis Johannes Schauer johannes.schauer@tugraz.at Institute of Statistics Graz University of Technology Steyrergasse 17/IV, 8010 Graz www.statistics.tugraz.at February 12, 2008 Introduction
Chapter 8 Hypothesis Testing Chapter 8 Hypothesis Testing 8-1 Overview 8-2 Basics of Hypothesis Testing
 Chapter 8 Hypothesis Testing 1 Chapter 8 Hypothesis Testing 8-1 Overview 8-2 Basics of Hypothesis Testing 8-3 Testing a Claim About a Proportion 8-5 Testing a Claim About a Mean: s Not Known 8-6 Testing
Chapter 4. Probability and Probability Distributions
 Chapter 4. robability and robability Distributions Importance of Knowing robability To know whether a sample is not identical to the population from which it was selected, it is necessary to assess the
Simple Linear Regression Inference
 Simple Linear Regression Inference 1 Inference requirements The Normality assumption of the stochastic term e is needed for inference even if it is not a OLS requirement. Therefore we have: Interpretation
Introduction to Quantitative Methods
 Introduction to Quantitative Methods October 15, 2009 Contents 1 Definition of Key Terms 2 2 Descriptive Statistics 3 2.1 Frequency Tables......................... 4 2.2 Measures of Central Tendencies.................
Probability density function : An arbitrary continuous random variable X is similarly described by its probability density function f x = f X
 Week 6 notes : Continuous random variables and their probability densities WEEK 6 page 1 uniform, normal, gamma, exponential,chi-squared distributions, normal approx'n to the binomial Uniform [,1] random
The Math. P (x) = 5! = 1 2 3 4 5 = 120.
 = 5! = 1 2 3 4 5 = 120.") The Math Suppose there are n experiments, and the probability that someone gets the right answer on any given experiment is p. So in the first example above, n = 5 and p = 0.2. Let X be the number of correct
The Math Suppose there are n experiments, and the probability that someone gets the right answer on any given experiment is p. So in the first example above, n = 5 and p = 0.2. Let X be the number of correct
AP STATISTICS 2010 SCORING GUIDELINES
 2010 SCORING GUIDELINES Question 4 Intent of Question The primary goals of this question were to (1) assess students ability to calculate an expected value and a standard deviation; (2) recognize the applicability
Chi Square Tests. Chapter 10. 10.1 Introduction
 Contents 10 Chi Square Tests 703 10.1 Introduction............................ 703 10.2 The Chi Square Distribution.................. 704 10.3 Goodness of Fit Test....................... 709 10.4 Chi Square
Simple Regression Theory II 2010 Samuel L. Baker
 SIMPLE REGRESSION THEORY II 1 Simple Regression Theory II 2010 Samuel L. Baker Assessing how good the regression equation is likely to be Assignment 1A gets into drawing inferences about how close the
Probability and Statistics Vocabulary List (Definitions for Middle School Teachers)
") Probability and Statistics Vocabulary List (Definitions for Middle School Teachers) B Bar graph a diagram representing the frequency distribution for nominal or discrete data. It consists of a sequence
Probability and Statistics Vocabulary List (Definitions for Middle School Teachers) B Bar graph a diagram representing the frequency distribution for nominal or discrete data. It consists of a sequence
Lecture 14. Chapter 7: Probability. Rule 1: Rule 2: Rule 3: Nancy Pfenning Stats 1000
 Lecture 4 Nancy Pfenning Stats 000 Chapter 7: Probability Last time we established some basic definitions and rules of probability: Rule : P (A C ) = P (A). Rule 2: In general, the probability of one event
Applied Reliability ------------------------------------------------------------------------------------------------------------ Applied Reliability
 Applied Reliability Techniques for Reliability Analysis with Applied Reliability Tools (ART) (an EXCEL Add-In) and JMP Software AM216 Class 6 Notes Santa Clara University Copyright David C. Trindade, Ph.
Aachen Summer Simulation Seminar 2014
 Aachen Summer Simulation Seminar 2014 Lecture 07 Input Modelling + Experimentation + Output Analysis Peer-Olaf Siebers pos@cs.nott.ac.uk Motivation 1. Input modelling Improve the understanding about how
STA-201-TE. 5. Measures of relationship: correlation (5%) Correlation coefficient; Pearson r; correlation and causation; proportion of common variance
 Correlation coefficient; Pearson r; correlation and causation; proportion of common variance") Principles of Statistics STA-201-TE This TECEP is an introduction to descriptive and inferential statistics. Topics include: measures of central tendency, variability, correlation, regression, hypothesis
Principles of Statistics STA-201-TE This TECEP is an introduction to descriptive and inferential statistics. Topics include: measures of central tendency, variability, correlation, regression, hypothesis
business statistics using Excel OXFORD UNIVERSITY PRESS Glyn Davis & Branko Pecar
 business statistics using Excel Glyn Davis & Branko Pecar OXFORD UNIVERSITY PRESS Detailed contents Introduction to Microsoft Excel 2003 Overview Learning Objectives 1.1 Introduction to Microsoft Excel
Normality Testing in Excel
 Normality Testing in Excel By Mark Harmon Copyright 2011 Mark Harmon No part of this publication may be reproduced or distributed without the express permission of the author. mark@excelmasterseries.com
Point Biserial Correlation Tests
 Chapter 807 Point Biserial Correlation Tests Introduction The point biserial correlation coefficient (ρ in this chapter) is the product-moment correlation calculated between a continuous random variable
University of Chicago Graduate School of Business. Business 41000: Business Statistics Solution Key
 Name: OUTLINE SOLUTIONS University of Chicago Graduate School of Business Business 41000: Business Statistics Solution Key Special Notes: 1. This is a closed-book exam. You may use an 8 11 piece of paper
Descriptive Statistics
 Descriptive Statistics Primer Descriptive statistics Central tendency Variation Relative position Relationships Calculating descriptive statistics Descriptive Statistics Purpose to describe or summarize
Chapter 5. Random variables
 Random variables random variable numerical variable whose value is the outcome of some probabilistic experiment; we use uppercase letters, like X, to denote such a variable and lowercase letters, like
Business Statistics. Successful completion of Introductory and/or Intermediate Algebra courses is recommended before taking Business Statistics.
 Business Course Text Bowerman, Bruce L., Richard T. O'Connell, J. B. Orris, and Dawn C. Porter. Essentials of Business, 2nd edition, McGraw-Hill/Irwin, 2008, ISBN: 978-0-07-331988-9. Required Computing
A Tutorial on Probability Theory
 Paola Sebastiani Department of Mathematics and Statistics University of Massachusetts at Amherst Corresponding Author: Paola Sebastiani. Department of Mathematics and Statistics, University of Massachusetts,
The Normal Distribution
 The Normal Distribution Continuous Distributions A continuous random variable is a variable whose possible values form some interval of numbers. Typically, a continuous variable involves a measurement
Confidence Intervals in Public Health
 Confidence Intervals in Public Health When public health practitioners use health statistics, sometimes they are interested in the actual number of health events, but more often they use the statistics
6 3 The Standard Normal Distribution
 290 Chapter 6 The Normal Distribution Figure 6 5 Areas Under a Normal Distribution Curve 34.13% 34.13% 2.28% 13.59% 13.59% 2.28% 3 2 1 + 1 + 2 + 3 About 68% About 95% About 99.7% 6 3 The Distribution Since
UNIT I: RANDOM VARIABLES PART- A -TWO MARKS
 UNIT I: RANDOM VARIABLES PART- A -TWO MARKS 1. Given the probability density function of a continuous random variable X as follows f(x) = 6x (1-x) 0
CHI-SQUARE: TESTING FOR GOODNESS OF FIT
 CHI-SQUARE: TESTING FOR GOODNESS OF FIT In the previous chapter we discussed procedures for fitting a hypothesized function to a set of experimental data points. Such procedures involve minimizing a quantity
MULTIPLE CHOICE. Choose the one alternative that best completes the statement or answers the question.
 MULTIPLE CHOICE. Choose the one alternative that best completes the statement or answers the question. 1) If two events are mutually exclusive, what is the probability that one or the other occurs? A)
II. DISTRIBUTIONS distribution normal distribution. standard scores
 Appendix D Basic Measurement And Statistics The following information was developed by Steven Rothke, PhD, Department of Psychology, Rehabilitation Institute of Chicago (RIC) and expanded by Mary F. Schmidt,
99.37, 99.38, 99.38, 99.39, 99.39, 99.39, 99.39, 99.40, 99.41, 99.42 cm
 Error Analysis and the Gaussian Distribution In experimental science theory lives or dies based on the results of experimental evidence and thus the analysis of this evidence is a critical part of the
MATH4427 Notebook 2 Spring 2016. 2 MATH4427 Notebook 2 3. 2.1 Definitions and Examples... 3. 2.2 Performance Measures for Estimators...
 MATH4427 Notebook 2 Spring 2016 prepared by Professor Jenny Baglivo c Copyright 2009-2016 by Jenny A. Baglivo. All Rights Reserved. Contents 2 MATH4427 Notebook 2 3 2.1 Definitions and Examples...................................
Basic Probability. Probability: The part of Mathematics devoted to quantify uncertainty
 AMS 5 PROBABILITY Basic Probability Probability: The part of Mathematics devoted to quantify uncertainty Frequency Theory Bayesian Theory Game: Playing Backgammon. The chance of getting (6,6) is 1/36.
The Binomial Probability Distribution
 The Binomial Probability Distribution MATH 130, Elements of Statistics I J. Robert Buchanan Department of Mathematics Fall 2015 Objectives After this lesson we will be able to: determine whether a probability
MBA 611 STATISTICS AND QUANTITATIVE METHODS
 MBA 611 STATISTICS AND QUANTITATIVE METHODS Part I. Review of Basic Statistics (Chapters 1-11) A. Introduction (Chapter 1) Uncertainty: Decisions are often based on incomplete information from uncertain
9. Sampling Distributions
 9. Sampling Distributions Prerequisites none A. Introduction B. Sampling Distribution of the Mean C. Sampling Distribution of Difference Between Means D. Sampling Distribution of Pearson's r E. Sampling
3.4. The Binomial Probability Distribution. Copyright Cengage Learning. All rights reserved.
 3.4 The Binomial Probability Distribution Copyright Cengage Learning. All rights reserved. The Binomial Probability Distribution There are many experiments that conform either exactly or approximately
CA200 Quantitative Analysis for Business Decisions. File name: CA200_Section_04A_StatisticsIntroduction
 CA200 Quantitative Analysis for Business Decisions File name: CA200_Section_04A_StatisticsIntroduction Table of Contents 4. Introduction to Statistics... 1 4.1 Overview... 3 4.2 Discrete or continuous
Normal Distribution as an Approximation to the Binomial Distribution
 Chapter 1 Student Lecture Notes 1-1 Normal Distribution as an Approximation to the Binomial Distribution : Goals ONE TWO THREE 2 Review Binomial Probability Distribution applies to a discrete random variable
Section 6.2 Definition of Probability
 Section 6.2 Definition of Probability Probability is a measure of the likelihood that an event occurs. For example, if there is a 20% chance of rain tomorrow, that means that the probability that it will
A Primer on Mathematical Statistics and Univariate Distributions; The Normal Distribution; The GLM with the Normal Distribution
 A Primer on Mathematical Statistics and Univariate Distributions; The Normal Distribution; The GLM with the Normal Distribution PSYC 943 (930): Fundamentals of Multivariate Modeling Lecture 4: September
TEACHER NOTES MATH NSPIRED
 Math Objectives Students will understand that normal distributions can be used to approximate binomial distributions whenever both np and n(1 p) are sufficiently large. Students will understand that when
How To Write A Data Analysis
 Mathematics Probability and Statistics Curriculum Guide Revised 2010 This page is intentionally left blank. Introduction The Mathematics Curriculum Guide serves as a guide for teachers when planning instruction
Probability and statistical hypothesis testing. Holger Diessel holger.diessel@uni-jena.de
 Probability and statistical hypothesis testing Holger Diessel holger.diessel@uni-jena.de Probability Two reasons why probability is important for the analysis of linguistic data: Joint and conditional
Association Between Variables
 Contents 11 Association Between Variables 767 11.1 Introduction............................ 767 11.1.1 Measure of Association................. 768 11.1.2 Chapter Summary.................... 769 11.2 Chi
MAT 155. Key Concept. September 27, 2010. 155S5.5_3 Poisson Probability Distributions. Chapter 5 Probability Distributions
 MAT 155 Dr. Claude Moore Cape Fear Community College Chapter 5 Probability Distributions 5 1 Review and Preview 5 2 Random Variables 5 3 Binomial Probability Distributions 5 4 Mean, Variance and Standard
The Standard Normal distribution
 The Standard Normal distribution 21.2 Introduction Mass-produced items should conform to a specification. Usually, a mean is aimed for but due to random errors in the production process we set a tolerance
CHAPTER 7 SECTION 5: RANDOM VARIABLES AND DISCRETE PROBABILITY DISTRIBUTIONS
 CHAPTER 7 SECTION 5: RANDOM VARIABLES AND DISCRETE PROBABILITY DISTRIBUTIONS TRUE/FALSE 235. The Poisson probability distribution is a continuous probability distribution. F 236. In a Poisson distribution,
Pr(X = x) = f(x) = λe λx
 = f(x) = λe λx") Old Business - variance/std. dev. of binomial distribution - mid-term (day, policies) - class strategies (problems, etc.) - exponential distributions New Business - Central Limit Theorem, standard error
Old Business - variance/std. dev. of binomial distribution - mid-term (day, policies) - class strategies (problems, etc.) - exponential distributions New Business - Central Limit Theorem, standard error
Advanced Statistical Analysis of Mortality. Rhodes, Thomas E. and Freitas, Stephen A. MIB, Inc. 160 University Avenue. Westwood, MA 02090
 Advanced Statistical Analysis of Mortality Rhodes, Thomas E. and Freitas, Stephen A. MIB, Inc 160 University Avenue Westwood, MA 02090 001-(781)-751-6356 fax 001-(781)-329-3379 trhodes@mib.com Abstract