Extended Eye Analysis Methods see Methods, Eye-movement recordings for summary
|
|
|
- Tobias Beasley
- 7 years ago
- Views:
Transcription
1 Extended Eye Analysis Methods see Methods, Eye-movement recordings for summary Eye tracking data analysis Several analyses of the eye tracking data were performed using ILAB software (Gitelman, 2002), Matlab 7.9 R2009b (The Mathworks Inc., Natick MA), and Microsoft Excel 2004 (Microsoft Corp., Redmond WA) to confirm (1) that the animals maintained fixation for the majority of the time during the scanning runs, and (2) that there were no systematic differences in the eye position, in the amount of eye movement, and in the frequency of saccades, while different portions of the visual field were stimulated. Eye blinks were removed using the ILAB software which performs the filtering by combining two methods: (1) filtering data by incorrect eye position information and (2) filtering by 0 pupil size (Gitelman, 2002). Eye data samples removed by the blink filter along with 25 samples before and after the interval were replaced via nearest neighbor interpolation. In each monkey, eye positions, amounts of eye movement, and frequency of saccades were compared using repeatedmeasures ANOVAs to test for main effects of stimulus location on these measures. Individual comparisons between the stimulus locations were performed using matched paired t-tests. Significant pairwise comparisons (p < 0.05) are reported prior to correction for multiple comparisons, and comparisons that remained significant after Bonferroni correction (alpha level of 0.01) are also reported). Effect sizes for significant pairwise comparisons are reported using Cohen s d. Analysis of eye position To investigate the possibility that eye position shifted systematically to different locations depending on the location of the visual stimulus, we calculated mean horizontal (X) and vertical (Y) eye positions during stimulation of different portions of the visual field. The eye positions in each monkey were compared using repeated-measures ANOVAs to test for main effects of stimulus location on eye position. Polar angle experiment Frequency histograms of horizontal and vertical eye position during stimulation of each visual quadrant (i.e. right lower visual field (Q1), left lower visual field (Q2), left upper visual field (Q3), right upper visual field (Q4)) were derived for each monkey (Supplementary Figure 1 A). For both monkeys, the vast majority of all horizontal and vertical eye position samples (M1: Q1: X = 99.27%, Y = 98.92%; Q2: X = 99.01%, Y = 99.20%; Q3: X = 99.44%, Y = 99.48%; Q4: X = 99.36%, Y = 99.10%; M2: Q1: X = 98.92%, Y = 98.44%; Q2: X = 99.00%, Y = 98.44%; Q3: X = 97.71%, Y = 97.38%; Q4: X = 98.07%, Y = 97.66%) fell within the specified window around the fixation point (+/- 2 from fixation point). The mean eye position for each visual quadrant was compared. For monkey M1, mean horizontal eye positions (Q1: M = 0.08, SD = 0.27; Q2: M = 0.01, SD = 0.31; Q3: M = -0.03, SD = 0.27; Q4: M = 0.18, SD = 1.21) were not significantly different [M1: X: F(3,95) = 2.17, p = 0.09]. Mean vertical eye positions (Q1: M = -0.36, SD = 0.31; Q2: M = -0.45, SD = 0.30; Q3: M = 0.35, SD = 0.26; Q4: M = -0.37, SD = 0.33) showed a main effect of stimulus location [M1: Y: F(3,95) = 3.53, p = 0.02]. Pairwise comparisons revealed that vertical eye position shifted slightly downward during stimulation of the lower left visual field [Q1 vs. Q2: t(95) = 2.57, p = 0.01, d = 0.26; Q2 vs Q3: t(95) = 2.92, p = 0.004, d = 0.30; Q2 vs Q4: t(95) = 4.45, p < 0.001, d = 0.45]. However, the largest distance between mean vertical eye positions was 0.09, and none of the pairwise comparisons remained significant after Bonferroni correction. Similarly, for monkey M2, neither mean horizontal (Q1: M = 0.08, SD = 0.37; Q2: M = 0.11, SD = 0.38; Q3: M = 0.17, SD = 0.45; Q4: M = 0.15, SD = 0.53) nor mean vertical (Q1: M = 0.02,
2 SD = 0.39; Q2: M = 0.00, SD = 0.32; Q3: M = -0.01, SD = 0.61; Q4: M = -0.02, SD = 0.56) eye positions were significantly different for each of the four visual quadrants [M2: X: F(3,91) = 0.95, p = 0.42; Y: F(3,91) = 0.12, p = 0.95]. These results indicate that both monkeys kept their gaze within the specified fixation window, and there was not a tendency to shift gaze either horizontally or vertically with the stimulus position during the mapping of polar angle. Eccentricity experiment Frequency histograms of horizontal and vertical eye position during stimulation of four bands of visual eccentricity (i.e. 0-2 (E1), 2-4 (E2), (E3), (E4)) of equal time durations (10 s) were derived for each monkey (Supplementary Figure 1 B). For both monkeys, almost all the horizontal and vertical eye positions samples (M1: E1: X = 97.74%, Y = 98.27%; E2: X = 99.50%, Y = 99.46%; E3: X = 99.22%, Y = 99.10%; E4: X = 98.89%, Y = 98.81%; M2: E1: X = 98.50%, Y = 98.24%; E2: X = 98.61%, Y = 98.55%; E3: X = 99.44%, Y = 99.45%; E4: X = 98.21%, Y = 98.21%) fell within the fixation window. The mean eye positions at the four eccentricity bands were compared. For monkey M1, mean horizontal eye positions showed a main effect of stimulus location, where the mean eye positions during stimulation of the central portions of the visual field were farther to the left (E1: M = 0.17, SD = 0.24; E2: M = 0.16, SD = 0.27) compared to the mean eye positions during stimulation of more peripheral stimulus locations (E3: M = 0.26, SD = 0.24; E4: M = 0.23, SD = 0.31) [M1: X: F(3,55) = 3.18, p = 0.03; Significant pairwise comparisons: E1 vs. E3: t(55) = 4.59, p < 0.001, d = 0.61; E2 vs E3: t(55) = 3.24, p = 0.002, d = 0.43]. However, none of the significant pairwise comparisons remained significant after applying the Bonferroni correction. Mean vertical eye positions at each stimulus eccentricity band (E1: M = -0.19, SD = 0.27; E2: M = -0.12, SD = 0.21; E3: M = -0.17, SD = 0.28; E4: M = -0.17, SD = 0.25) did not show a main effect of stimulus location [M1: Y: F(3,55) = 1.64, p = 0.18]. Similar to monkey M1, the mean horizontal eye positions for monkey M2 showed a main effect of stimulus location, where the mean eye positions during stimulation of more central portions of the visual field were farther to the left (E1: M = -0.07, SD = 0.37; E2: M = -0.06, SD = 0.34) compared to the mean eye positions during stimulation of more peripheral portions of the visual field (E3: M = 0.04, SD = 0.27; E4: M = 0.04, SD = 0.30) [M2: X: F(3,103) = 5.07, p = 0.002; Significant pairwise comparisons: E1 vs. E3: t(103) = 2.67, p = 0.01, d = 0.27; E1 vs. E4: t(103) = 2.59, p = 0.01, d = 0.25; E2 vs. E3: t(103) = 3.05, p = 0.003, d = 0.30; E2 vs. E4: t(103) = 2.68, p = 0.01, d = 0.26]. However, none of the pairwise comparisons remained significant after Bonferroni correction. Mean vertical eye positions at each stimulus eccentricity band (E1: M = 0.17, SD = 0.48; E2: M = 0.16, SD = 0.39; E3: M = 0.11, SD = 0.26; E4: M = 0.14, SD = 0.40) did not show a main effect of stimulus location [M2: Y: F(3,103) = 0.682, p = 0.56]. These results indicate that during eccentricity mapping, neither monkey showed a tendency to shift gaze vertically, but there was a tendency to shift horizontal eye position slightly to the left by approximately a tenth of a visual degree during stimulation of the central visual field compared to stimulation of the periphery. This tendency, however, was not significant after correcting for multiple comparisons, and the calculated effect sizes were small. Furthermore, it is not expected that such a shift would affect topographic eccentricity maps given the small distance of the shift. Analysis of amount of eye movement Because the fixation window was large enough to allow for small saccadic eye movements less than or equal to 4, a measure of eye movements was calculated based on the total amount of horizontal and vertical eye movements during stimulation of different portions of the visual field. The distance the eye traveled between each camera cycle (60 Hz) was summed to obtain this
3 measure, which captured all eye movements, regardless of whether they were within the fixation window or not, that may have contributed to eye movement related confounds. Amounts of eye movement in each monkey were compared using repeated-measures ANOVAs to test for main effects of stimulus location. Polar angle experiment The amount of eye movement during stimulation of each visual quadrant was compared. For monkey M1, the amount of horizontal (Q1: M = 17.58, SD = 13.58; Q2: M = 21.62, SD = 23.82; Q3: M = 17.84, SD = 13.12; Q4: M = 19.97, SD = 46.62) and vertical (Q1: M = 20.68, SD = 10.78; Q2: M = 21.10, SD = 19.53; Q3: M = 19.05, SD = 8.93; Q4: M = 19.49, SD = 19.98) eye movement between the four quadrants was not significantly different [M1: X: F(3,95) = 0.92, p = 0.43; Y: F(3,95) = 0.76, p = 0.52]. Similarly, for monkey M2, the amount of horizontal (Q1: M = 13.25, SD = 6.38; Q2: M = 12.50, SD = 5.75; Q3: M = 13.75, SD = 9.46; Q4: M = 13.71, SD = 9.96) and vertical (Q1: M = 21.63, SD = 8.18; Q2: M = 19.69, SD = 6.83; Q3: M = 21.63, SD = 10.07; Q4: M = 21.08, SD = 10.66) eye movement between the four quadrants was not significantly different [M2: X: F(3,91) = 0.67, p = 0.57; Y: F(3,91) = 1.54, p = 0.20]. These results indicate that there was not a tendency in either monkey to make more eye movements for any particular stimulus position during the mapping of polar angle. Eccentricity experiment The amount of eye movement during the stimulation of four bands of visual eccentricity was compared. For monkey M1, the amount of horizontal eye movement (E1: M = 22.66, SD = 23.10; E2: M = 15.64, SD = 10.77; E3: M = 17.88, SD = 11.13; E4: M = 23.48, SD = 27.85) showed a main effect of stimulus location [X: F(3,55) = 2.89, p = 0.04]. Pairwise comparisons revealed significantly more horizontal eye movements during stimulation of the most central (i.e. 0-2 ) and the most peripheral (i.e ) portions of the visual field compared to stimulation of the intermediate portion of the visual field (i.e. 2-4 ) [Q1 vs. Q2: t(55) = 3.01, p = 0.004, d = 0.40; Q4 vs. Q2: t(55) = 2.20, p = 0.03, d = 0.29]. Neither of these pairwise comparisons remained significant, however, after Bonferroni correction. The amount of vertical eye movement (E1: M = 24.23, SD = 17.70; E2: M = 20.22, SD = 8.03; E3: M = 22.34, SD = 10.58; E4: M = 26.38, SD = 17.92) between the four eccentricity bands was not significantly different in M1 [Y: F(3,55) = 2.57, p = 0.06]. For monkey M2, the amount of horizontal eye movement (E1: M = 14.08, SD = 9.93; E2: M = 14.36, SD = 8.49; E3: M = 13.43, SD = 8.16; E4: M = 15.90, SD = 13.91) did not show a main effect of stimulus location [X: F(3,103) = 1.93, p = 0.13]. However, vertical eye movements (E1: M = 15.17, SD = 9.82; E2: M = 16.76, SD = 9.45; E3: M = 13.64, SD = 5.96; E4: M = 15.05, SD = 10.90) did show a main effect of stimulus location, where eye movements differed between the two intermediate eccentricity bands [Y: F(3,103) = 2.89, p = 0.04; E2 vs. E3: t(103) = 4.32, p < 0.001, d = 0.42], an effect that remained significant after Bonferroni correction. Taken together, the small differences in amounts of eye movements at different eccentricity bands between monkeys were not consistent, and generally did not remain significant after correction for multiple comparisons (except for one comparison in M2). These small individual differences are likely to reduce the sensitivity in detecting eccentricity maps, but are not likely to affect the large-scale layout of the topographic organization. Analysis of eye fixation maintenance
4 Saccades were defined as eye movements that exceeded the boundaries of the 4 fixation window and were not removed by the blink filter. During the course of a 3-minute scan, the animals made relatively few saccades. For the polar angle mapping experiment, monkey M1 had an average of 6.54 ±5.69 saccades per scan, and monkey M2 had an average of 5.33 ±4.29 saccades per scan. For the eccentricity mapping experiment, M1 and M2 had an average of 8.14 ±7.69 and 4.96 ±4.35 saccades per scan, respectively. The frequency of saccades in each monkey were compared using repeated-measures ANOVAs to test for main effects of stimulus location. Polar angle experiment For monkey M1, the frequency of saccades (Q1: M = 1.04, SD = 1.43; Q2: M = 1.63, SD = 1.93; Q3: M = 1.92, SD = 2.45; Q4: M = 1.96, SD = 2.16) did not show a main effect of stimulus location [M1: F(3,23) = 1.55, p = 0.21]. Similarly, the frequency of saccades in monkey M2 did not differ by visual quadrant (Q1: M = 1.24, SD = 1.41; Q2: M = 1.05, SD = 1.77; Q3: M = 1.29, SD = 1.10; Q4: M = 1.76, SD = 2.07)[M2: F(3,20) = 0.96, p = 0.42]. Eccentricity experiment For monkey M1, the frequency of saccades (Q1: M = 3.07, SD = 3.27; Q2: M = 0.57, SD = 1.40; Q3: M = 1.36, SD = 1.45; Q4: M = 3.14, SD = 3.04) showed a main effect of stimulus location [M1: F(3,13) = 7.51, p < 0.001]. Pairwise comparisons revealed significantly more saccades during stimulation of the most foveal and the most peripheral eccentricity bands compared to the two intermediate bands [E1 vs. E2: t(13) = 3.49, p = 0.004, d = 0.93; E1 vs. E3: t(13) = 2.22, p = 0.05, d = 0.59; E4 vs. E2: t(13) = 3.71, p = 0.003, d = 0.99; E4 vs. E3: t(13) = 2.96, p = 0.01, d = 0.79]. None of the pairwise comparisons remained significant after Bonferroni correction. For monkey M2, the frequency of saccades (Q1: M = 1.46, SD = 1.77; Q2: M = 1.46, SD = 1.97; Q3: M = 0.86, SD = 1.08; Q4: M = 1.18, SD = 1.31) did not show a main effect of stimulus location [M2: F(3,27) = 1.36, p = 0.26]. Taken together, the analysis of saccade frequency in both experiments shows that neither monkey made saccades very often, and when they did make saccades, there were no systematic differences in their frequency for any particular stimulus location. References Gitelman, D. R. (2002) Behav. Res. Methods Instrum. Comput. 34,
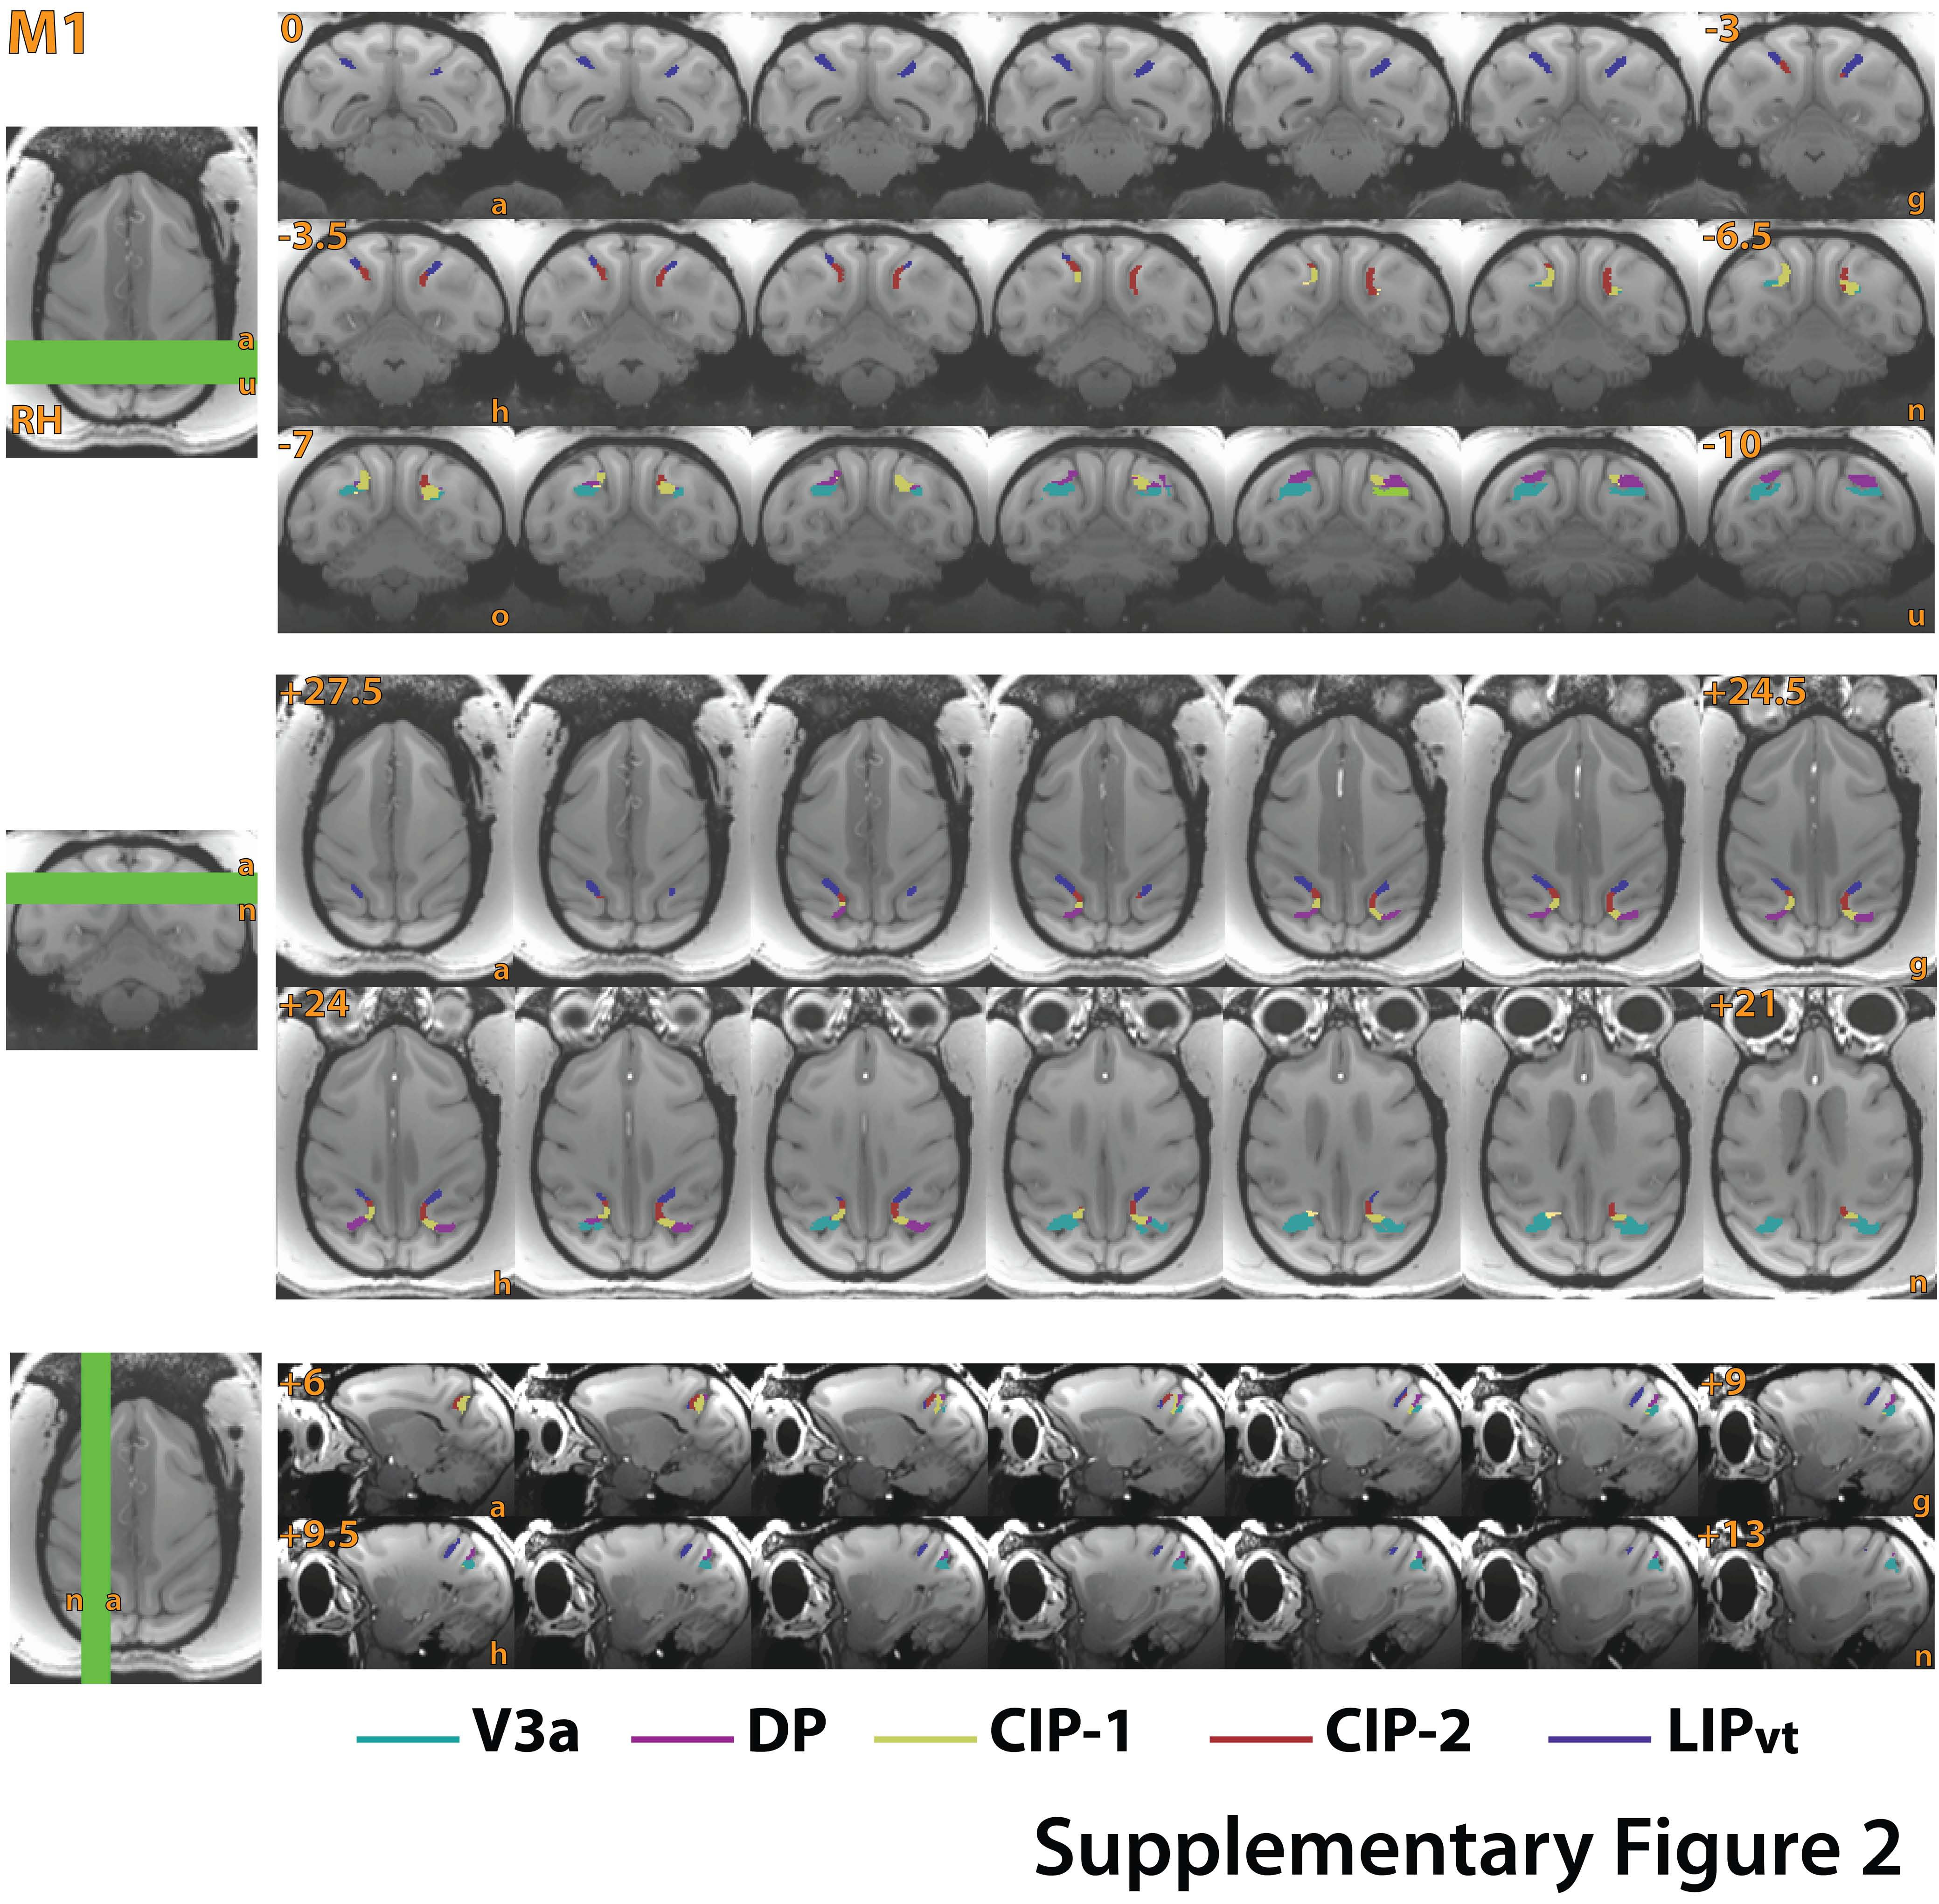
5 Supplementary Figure Legends Supplementary Figure 1: Frequency histograms of horizontal (X) and vertical (Y) eye position for the polar angle and eccentricity mapping scanning sessions. Monkey subjects (M1 and M2) maintained their gaze on a small fixation spot (0.5 diameter) within a 4 square window. (A) Frequency histograms of eye position for the polar angle experiment where colored lines indicate periods of stimulation for each visual quadrant (right LVF, left LVF, left UVF, right UVF). (B) Frequency histograms of eye position for the eccentricity mapping experiment where colored lines indicate periods of stimulation for four eccentricity bands (0-2, 2-4, 4-7.5, ). Both horizontal and vertical eye position were centered on the fixation spot at zero degrees. Positive values indicate rightward or upward deviations from fixation. The inner red vertical dashed lines indicate the +/- 2 fixation window boundary. Methods for further details. Supplementary Figure 2: Volume boundaries of V3a, DP, CIP-1, CIP-2, LIP vt of M1 in coronal, axial, and sagittal sections. Coronal (top), axial (middle), and sagittal (bottom) plane sections for monkey M1 in.5mm slice segments. All conventions and abbreviations as in Figure 3. Supplementary Figure 3: Volume boundaries of V3a, DP, CIP-1, CIP-2, LIP vt of M2 in coronal, axial, and sagittal sections. Coronal (top), axial (middle), and sagittal (bottom) plane sections for monkey M2 in.5mm slice segments. All conventions and abbreviations as in Figure 3.
6 Supplementary Figure 4: Time series of fmri signals at borders between V3a, DP, CIP-1, CIP-2, and LIP vt. (a) Time series of fmri signals at the UVF (red line) and LVF (blue line) polar angle phase reversals that were defined from the phase progression analysis in monkey M1. (b) Time series of fmri signals of individual cycles averaged between monkeys M1 and M2 for the borders between V3a and CIP-1 (dark red), CIP-1 and CIP-2 (light blue), CIP-2 and LIP vt (light red), and the anterior border of LIP vt (dark blue). Supplementary Figure 5: Reproducibility of polar angle maps in dorsal visual cortex. Data were split into clockwise (a) and counterclockwise (b) runs for right and left hemispheres of M1& M2. Inflated surface reconstructions of dorsal and parietal cortex. Maps were thresholded at 3 s per cycle S.E.M. variance (see Methods). All other conventions and abbreviations as in Figure 1A. Supplementary Figure 6: Average alignment indices between clockwise and counterclockwise runs for V1, V3a, CIP-1, CIP-2, LIP vt, and DP. Histograms of alignment indices (AI = 1 - Δφ / π). The index values peak around an index value close to 1, which indicates good alignment between clockwise and counterclockwise polar phase estimates. The red line illustrates a distribution for uncorrelated data. Supplementary Figure 7: Average alignment indices between M1 and M2 for polar angle and eccentricity phase estimates for V1, V3a, CIP-1, CIP-2, LIP vt, and DP.
7 Histograms of alignment indices (AI = 1 - Δφ / π) for phase estimates from standard mesh surfaces between M1 and M2. (a) Histograms for polar angle phase estimates between monkeys M1 and M2. All conventions as in Supplementary Figure 6. (b) Histograms for eccentricity phase estimates between M1 and M2. All conventions as in Supplementary Figure 6.
8
9

10
11

12
13
14
Video-Based Eye Tracking
 Video-Based Eye Tracking Our Experience with Advanced Stimuli Design for Eye Tracking Software A. RUFA, a G.L. MARIOTTINI, b D. PRATTICHIZZO, b D. ALESSANDRINI, b A. VICINO, b AND A. FEDERICO a a Department
Subjects: Fourteen Princeton undergraduate and graduate students were recruited to
 Supplementary Methods Subjects: Fourteen Princeton undergraduate and graduate students were recruited to participate in the study, including 9 females and 5 males. The mean age was 21.4 years, with standard
Physics 25 Exam 3 November 3, 2009
 1. A long, straight wire carries a current I. If the magnetic field at a distance d from the wire has magnitude B, what would be the the magnitude of the magnetic field at a distance d/3 from the wire,
Double Integrals in Polar Coordinates
 Double Integrals in Polar Coordinates. A flat plate is in the shape of the region in the first quadrant ling between the circles + and +. The densit of the plate at point, is + kilograms per square meter
Fundus Photograph Reading Center
 Modified 7-Standard Field Digital Color Fundus Photography (7M-D) 8010 Excelsior Drive, Suite 100, Madison WI 53717 Telephone: (608) 410-0560 Fax: (608) 410-0566 Table of Contents 1. 7M-D Overview... 2
DESCRIPTIVE STATISTICS. The purpose of statistics is to condense raw data to make it easier to answer specific questions; test hypotheses.
 DESCRIPTIVE STATISTICS The purpose of statistics is to condense raw data to make it easier to answer specific questions; test hypotheses. DESCRIPTIVE VS. INFERENTIAL STATISTICS Descriptive To organize,
EXPLORING SPATIAL PATTERNS IN YOUR DATA
 EXPLORING SPATIAL PATTERNS IN YOUR DATA OBJECTIVES Learn how to examine your data using the Geostatistical Analysis tools in ArcMap. Learn how to use descriptive statistics in ArcMap and Geoda to analyze
3D Viewer. user's manual 10017352_2
 EN 3D Viewer user's manual 10017352_2 TABLE OF CONTENTS 1 SYSTEM REQUIREMENTS...1 2 STARTING PLANMECA 3D VIEWER...2 3 PLANMECA 3D VIEWER INTRODUCTION...3 3.1 Menu Toolbar... 4 4 EXPLORER...6 4.1 3D Volume
How To Check For Differences In The One Way Anova
 MINITAB ASSISTANT WHITE PAPER This paper explains the research conducted by Minitab statisticians to develop the methods and data checks used in the Assistant in Minitab 17 Statistical Software. One-Way
Principles of Good Screen Design in Websites
 Principles of Good Screen Design in Websites N. Uday Bhaskar udaynagella@gmail.com Department CSE, RGMCET, Nandyal, 518501,INDIA P. Prathap Naidu prathap_nd@yahoo.co.in Department CSE, RGMCET, Nandyal,
Eye-tracking. Benjamin Noël
 Eye-tracking Benjamin Noël Basics Majority of all perceived stimuli through the eyes Only 10% through ears, skin, nose Eye-tracking measuring movements of the eyes Record eye movements to subsequently
Reduction of the flash-lag effect in terms of active observation
 Attention, Perception, & Psychophysics 2010, 72 (4), 1032-1044 doi:10.3758/app.72.4.1032 Reduction of the flash-lag effect in terms of active observation MAKOTO ICHIKAWA Chiba University, Chiba, Japan
Alignement of a ring cavity laser
 Alignement of a ring cavity laser 1 Introduction This manual describes a procedure to align the cavity of our Ti:Sapphire ring laser and its injection with an Argon-Ion pump laser beam. The setup is shown
Processing the Image or Can you Believe what you see? Light and Color for Nonscientists PHYS 1230
 Processing the Image or Can you Believe what you see? Light and Color for Nonscientists PHYS 1230 Optical Illusions http://www.michaelbach.de/ot/mot_mib/index.html Vision We construct images unconsciously
Fixplot Instruction Manual. (data plotting program)
") Fixplot Instruction Manual (data plotting program) MANUAL VERSION2 2004 1 1. Introduction The Fixplot program is a component program of Eyenal that allows the user to plot eye position data collected with
Fixplot Instruction Manual (data plotting program) MANUAL VERSION2 2004 1 1. Introduction The Fixplot program is a component program of Eyenal that allows the user to plot eye position data collected with
Quick Start Tutorials
 Quick Start Tutorials Imaris 6.3 Bitplane AG Badenerstrasse 682 CH-8048 Zurich www.bitplane.com eusupport@bitplane.com Table of Contents 1 Introduction 1 1 1.1 Reference Manual... 3 2 Visualize Data Set
Jitter Measurements in Serial Data Signals
 Jitter Measurements in Serial Data Signals Michael Schnecker, Product Manager LeCroy Corporation Introduction The increasing speed of serial data transmission systems places greater importance on measuring
RESEARCH ON SPOKEN LANGUAGE PROCESSING Progress Report No. 29 (2008) Indiana University
 Indiana University") RESEARCH ON SPOKEN LANGUAGE PROCESSING Progress Report No. 29 (2008) Indiana University A Software-Based System for Synchronizing and Preprocessing Eye Movement Data in Preparation for Analysis 1 Mohammad
RESEARCH ON SPOKEN LANGUAGE PROCESSING Progress Report No. 29 (2008) Indiana University A Software-Based System for Synchronizing and Preprocessing Eye Movement Data in Preparation for Analysis 1 Mohammad
Imaris Quick Start Tutorials
 Imaris 1 Introduction Why should you read and practice the Imaris? They provide you with the basic information how-to-use Imaris but may also show yet unrecognized new features of the software to the advanced
Fixation Biases towards the Index Finger in Almost-Natural Grasping
 RESEARCH ARTICLE Fixation Biases towards the Index Finger in Almost-Natural Grasping Dimitris Voudouris 1,2 *, Jeroen B. J. Smeets 1, Eli Brenner 1 1 Department of Human Movement Sciences, VU University
1) Write the following as an algebraic expression using x as the variable: Triple a number subtracted from the number
 Write the following as an algebraic expression using x as the variable: Triple a number subtracted from the number") 1) Write the following as an algebraic expression using x as the variable: Triple a number subtracted from the number A. 3(x - x) B. x 3 x C. 3x - x D. x - 3x 2) Write the following as an algebraic expression
1) Write the following as an algebraic expression using x as the variable: Triple a number subtracted from the number A. 3(x - x) B. x 3 x C. 3x - x D. x - 3x 2) Write the following as an algebraic expression
Designing eye tracking experiments to measure human behavior
 Designing eye tracking experiments to measure human behavior Eindhoven, The Netherlands August, 2010 Ricardo Matos Tobii Technology Steps involved in measuring behaviour 1. Formulate and initial question
Topographic Change Detection Using CloudCompare Version 1.0
 Topographic Change Detection Using CloudCompare Version 1.0 Emily Kleber, Arizona State University Edwin Nissen, Colorado School of Mines J Ramón Arrowsmith, Arizona State University Introduction CloudCompare
Hydrogeological Data Visualization
 Conference of Junior Researchers in Civil Engineering 209 Hydrogeological Data Visualization Boglárka Sárközi BME Department of Photogrammetry and Geoinformatics, e-mail: sarkozi.boglarka@fmt.bme.hu Abstract
How to test ocular movements in PSP Jan Kassubek
 How to test ocular movements in PSP Jan Kassubek Universitätsklinik für Neurologie, Ulm Bedside Screening: PSP initially slowing of vertical saccades slowing of downward saccades is considered the hallmark
Burgers vector, Burgers circuit, and Dislocation Line Direction
 Burgers vector, Burgers circuit, and Dislocation Line Direction Keonwook Kang and Wei Cai November 21, 2007 The 1st version of this white paper was written after the online discussion between Keonwook
104 Practice Exam 2-3/21/02
 104 Practice Exam 2-3/21/02 1. Two electrons are located in a region of space where the magnetic field is zero. Electron A is at rest; and electron B is moving westward with a constant velocity. A non-zero
Petrel TIPS&TRICKS from SCM
 Petrel TIPS&TRICKS from SCM Knowledge Worth Sharing Histograms and SGS Modeling Histograms are used daily for interpretation, quality control, and modeling in Petrel. This TIPS&TRICKS document briefly
A Guided User Experience Using Subtle Gaze Direction
 A Guided User Experience Using Subtle Gaze Direction Eli Ben-Joseph and Eric Greenstein Stanford University {ebj, ecgreens}@stanford.edu 1 Abstract This paper demonstrates how illumination modulation can
Welcome to Anatomy & Physiology
 Welcome to Anatomy & Physiology Chapter 1 -Human Organization What do you need to do to pass this class? MEMORIZE! The Scope of Human Anatomy Human anatomy is the study of the structure of the human body.
EMR-9 Quick Start Guide (00175)D 1
D 1") NAC Eye Mark Recorder EMR-9 Quick Start Guide May 2009 NAC Image Technology Inc. (00175)D 1 Contents 1. System Configurations 1.1 Standard configuration 1.2 Head unit variations 1.3 Optional items 2. Basic
NAC Eye Mark Recorder EMR-9 Quick Start Guide May 2009 NAC Image Technology Inc. (00175)D 1 Contents 1. System Configurations 1.1 Standard configuration 1.2 Head unit variations 1.3 Optional items 2. Basic
An Introduction to Point Pattern Analysis using CrimeStat
 Introduction An Introduction to Point Pattern Analysis using CrimeStat Luc Anselin Spatial Analysis Laboratory Department of Agricultural and Consumer Economics University of Illinois, Urbana-Champaign
Eye Tracker System Manual. ASL EyeTrac 6
 Eye Tracker System Manual ASL EyeTrac 6 EyeNal Analysis Software MANUAL VERSION 1.41 19 January 2007 Applied Science Laboratories An Applied Science Group Company 175 Middlesex Turnpike Bedford, MA 01730
VISUALIZING HIERARCHICAL DATA. Graham Wills SPSS Inc., http://willsfamily.org/gwills
 VISUALIZING HIERARCHICAL DATA Graham Wills SPSS Inc., http://willsfamily.org/gwills SYNONYMS Hierarchical Graph Layout, Visualizing Trees, Tree Drawing, Information Visualization on Hierarchies; Hierarchical
PHY121 #8 Midterm I 3.06.2013
 PHY11 #8 Midterm I 3.06.013 AP Physics- Newton s Laws AP Exam Multiple Choice Questions #1 #4 1. When the frictionless system shown above is accelerated by an applied force of magnitude F, the tension
Tobii Technology AB. Accuracy and precision Test report. X2-60 fw 1.0.5. Date: 2013-08-16 Methodology/Software version: 2.1.7
 Tobii Technology AB Accuracy and precision Test report X2-60 fw 1.0.5 Date: 2013-08-16 Methodology/Software version: 2.1.7 1. Introduction This document provides an overview of tests in terms of accuracy
Scanners and How to Use Them
 Written by Jonathan Sachs Copyright 1996-1999 Digital Light & Color Introduction A scanner is a device that converts images to a digital file you can use with your computer. There are many different types
Eyetracker Output Utility
 Eyetracker Output Utility Latest version: 1.27, 22 July 2016 Walter van Heuven Please note that this program is still under development Email: walter.vanheuven@nottingham.ac.uk Website: http://www.psychology.nottingham.ac.uk/staff/wvh/eou
COMPONENTS OF VECTORS
 COMPONENTS OF VECTORS To describe motion in two dimensions we need a coordinate sstem with two perpendicular aes, and. In such a coordinate sstem, an vector A can be uniquel decomposed into a sum of two
Micro-CT for SEM Non-destructive Measurement and Volume Visualization of Specimens Internal Microstructure in SEM Micro-CT Innovation with Integrity
 Micro-CT for SEM Non-destructive Measurement and Volume Visualization of Specimens Internal Microstructure in SEM Innovation with Integrity Micro-CT 3D Microscopy Using Micro-CT for SEM Micro-CT for SEM
Sound absorption and acoustic surface impedance
 Sound absorption and acoustic surface impedance CHRISTER HEED SD2165 Stockholm October 2008 Marcus Wallenberg Laboratoriet för Ljud- och Vibrationsforskning Sound absorption and acoustic surface impedance
A new & widely applicable bedform tracking tool
 A new & widely applicable bedform tracking tool C.F. van der Mark & A. Blom University of Twente Faculty of Engineering Technology Department of Water Engineering and Management P.O. Box 217, 75 AE Enschede,
Eye tracking in usability research: What users really see
 Printed in: Empowering Software Quality: How Can Usability Engineering Reach These Goals? Usability Symposium 2005: pp 141-152, OCG publication vol. 198. Eye tracking in usability research: What users
MATHEMATICAL TRADING INDICATORS
 MATHEMATICAL TRADING INDICATORS The mathematical trading methods provide an objective view of price activity. It helps you to build up a view on price direction and timing, reduce fear and avoid overtrading.
Modelling, Extraction and Description of Intrinsic Cues of High Resolution Satellite Images: Independent Component Analysis based approaches
 Modelling, Extraction and Description of Intrinsic Cues of High Resolution Satellite Images: Independent Component Analysis based approaches PhD Thesis by Payam Birjandi Director: Prof. Mihai Datcu Problematic
Agent Simulation of Hull s Drive Theory
 Agent Simulation of Hull s Drive Theory Nick Schmansky Department of Cognitive and Neural Systems Boston University March 7, 4 Abstract A computer simulation was conducted of an agent attempting to survive
International Year of Light 2015 Tech-Talks BREGENZ: Mehmet Arik Well-Being in Office Applications Light Measurement & Quality Parameters
 www.led-professional.com ISSN 1993-890X Trends & Technologies for Future Lighting Solutions ReviewJan/Feb 2015 Issue LpR 47 International Year of Light 2015 Tech-Talks BREGENZ: Mehmet Arik Well-Being in
Encoded Phased Array Bridge Pin Inspection
 Encoded Phased Array Bridge Pin Inspection James S. Doyle Baker Testing Services, Inc. 22 Reservoir Park Dr. Rockland, MA 02370 (781) 871-4458; fax (781) 871-0123; e-mail jdoyle@bakertesting.com Product
LBS-300 Beam Sampler for C-mount Cameras. YAG Focal Spot Analysis Adapter. User Notes
 LBS-300 Beam Sampler for C-mount Cameras P/N SP90183, SP90184, SP90185 and SP90186 YAG Focal Spot Analysis Adapter P/N SP90187, SP90188, SP90189, SP90190, SP90191 User Notes Ophir-Spiricon Inc. 60 West
207-2. Selective Saccadic Palsy
 207-2 Selective Saccadic Palsy Selective Saccadic Palsy after Cardiac Surgery Selective loss of all forms of saccades (voluntary and reflexive quick phases of nystagmus) with sparing of other eye movements.
Selecting Receiving Antennas for Radio Tracking
 Selecting Receiving Antennas for Radio Tracking Larry B Kuechle, Advanced Telemetry Systems, Inc. Isanti, Minnesota 55040 lkuechle@atstrack.com The receiving antenna is an integral part of any radio location
CASE HISTORY #2. APPLICATION: Piping Movement Survey using Permalign Laser Measurement System
 CASE HISTORY #2 APPLICATION: Piping Movement Survey using Permalign Laser Measurement System EQUIPMENT: Dresser-Clark Hot Gas Expander (Turbine), 60-inch Inlet Flange HISTORY: Piping support modifications
Exercise 1.12 (Pg. 22-23)
") Individuals: The objects that are described by a set of data. They may be people, animals, things, etc. (Also referred to as Cases or Records) Variables: The characteristics recorded about each individual.
Individuals: The objects that are described by a set of data. They may be people, animals, things, etc. (Also referred to as Cases or Records) Variables: The characteristics recorded about each individual.
Direct and Reflected: Understanding the Truth with Y-S 3
 Direct and Reflected: Understanding the Truth with Y-S 3 -Speaker System Design Guide- December 2008 2008 Yamaha Corporation 1 Introduction Y-S 3 is a speaker system design software application. It is
Tobii AB. Accuracy and precision Test report. Tobii Pro X3-120 fw 1.7.1. Date: 2015-09-14 Methodology/Software version: 2.1.7*
 Tobii AB Accuracy and precision Test report Tobii Pro X3-120 fw 1.7.1 Date: 2015-09-14 Methodology/Software version: 2.1.7* 1. Introduction This document provides an overview of tests in terms of accuracy
Data Analysis Methods: Net Station 4.1 By Peter Molfese
 Data Analysis Methods: Net Station 4.1 By Peter Molfese Preparing Data for Statistics (preprocessing): 1. Rename your files to correct any typos or formatting issues. a. The General format for naming files
Introduction to Lensometry Gregory L. Stephens, O.D., Ph.D. College of Optometry, University of Houston 2010
 Introduction to Lensometry Gregory L. Stephens, O.D., Ph.D. College of Optometry, University of Houston 2010 I. Introduction The focimeter, lensmeter, or Lensometer is the standard instrument used to measure
Inductive Reasoning Free Sample Test 1
 Inductive Reasoning Free Sample Test 1 Solutions Booklet Difficulty Rating: Difficult Instructions This inductive reasoning test comprises 22 questions. You will have 25 minutes in which to correctly answer
MEASURING THE TRUE VALUE OF ADVERTISING IN PRINT AGAINST ONLINE - AN EYE TRACKING EXPERIMENT
 Worldwide Readership Research Symposium 2009 Session 7.2 MEASURING THE TRUE VALUE OF ADVERTISING IN PRINT AGAINST ONLINE - AN EYE TRACKING EXPERIMENT Leendert van Meerem, Intomart GfK Costa Tchaoussoglou,
Solving Simultaneous Equations and Matrices
 Solving Simultaneous Equations and Matrices The following represents a systematic investigation for the steps used to solve two simultaneous linear equations in two unknowns. The motivation for considering
SAM PuttLab. Reports Manual. Version 5
 SAM PuttLab Reports Manual Version 5 Reference The information contained in this document is subject to change without notice. The software described in this document is furnished under a license agreement.
Classic EEG (ERPs)/ Advanced EEG. Quentin Noirhomme
/ Advanced EEG. Quentin Noirhomme") Classic EEG (ERPs)/ Advanced EEG Quentin Noirhomme Outline Origins of MEEG Event related potentials Time frequency decomposition i Source reconstruction Before to start EEGlab Fieldtrip (included in spm)
Classic EEG (ERPs)/ Advanced EEG Quentin Noirhomme Outline Origins of MEEG Event related potentials Time frequency decomposition i Source reconstruction Before to start EEGlab Fieldtrip (included in spm)
Chapter 10. Key Ideas Correlation, Correlation Coefficient (r),
,") Chapter 0 Key Ideas Correlation, Correlation Coefficient (r), Section 0-: Overview We have already explored the basics of describing single variable data sets. However, when two quantitative variables
Chapter 0 Key Ideas Correlation, Correlation Coefficient (r), Section 0-: Overview We have already explored the basics of describing single variable data sets. However, when two quantitative variables
Reflection and Refraction
 Equipment Reflection and Refraction Acrylic block set, plane-concave-convex universal mirror, cork board, cork board stand, pins, flashlight, protractor, ruler, mirror worksheet, rectangular block worksheet,
Doppler. Doppler. Doppler shift. Doppler Frequency. Doppler shift. Doppler shift. Chapter 19
 Doppler Doppler Chapter 19 A moving train with a trumpet player holding the same tone for a very long time travels from your left to your right. The tone changes relative the motion of you (receiver) and
INTERPRETING THE ONE-WAY ANALYSIS OF VARIANCE (ANOVA)
") INTERPRETING THE ONE-WAY ANALYSIS OF VARIANCE (ANOVA) As with other parametric statistics, we begin the one-way ANOVA with a test of the underlying assumptions. Our first assumption is the assumption of
INTERPRETING THE ONE-WAY ANALYSIS OF VARIANCE (ANOVA) As with other parametric statistics, we begin the one-way ANOVA with a test of the underlying assumptions. Our first assumption is the assumption of
Tracking Project Progress
 L E S S O N 2 Tracking Project Progress Suggested lesson time 45-55 minutes Lesson objectives To begin tracking an active project, you will: a b c Modify the environment for tracking. You will use the
REPORT ITU-R BO.2029. Broadcasting-satellite service earth station antenna pattern measurements and related analyses
 Rep. ITU-R BO.229 1 REPORT ITU-R BO.229 Broadcasting-satellite service earth station antenna pattern measurements and related analyses (Question ITU-R 93/11) (22) 1 Introduction Recommendation ITU-R BO.1443
The Tobii I-VT Fixation Filter
 The Tobii I-VT Fixation Filter Algorithm description March 2, 212 Anneli Olsen This document describes the general principles behind an I-VT fixation filter and they are implemented in the Tobii I-VT Fixation
January 26, 2009 The Faculty Center for Teaching and Learning
 THE BASICS OF DATA MANAGEMENT AND ANALYSIS A USER GUIDE January 26, 2009 The Faculty Center for Teaching and Learning THE BASICS OF DATA MANAGEMENT AND ANALYSIS Table of Contents Table of Contents... i
Lesson 3 - Processing a Multi-Layer Yield History. Exercise 3-4
 Lesson 3 - Processing a Multi-Layer Yield History Exercise 3-4 Objective: Develop yield-based management zones. 1. File-Open Project_3-3.map. 2. Double click the Average Yield surface component in the
Common 16:9 or 4:3 aspect ratio digital television reference test pattern
 Recommendation ITU-R BT.1729 (2005) Common 16:9 or 4:3 aspect ratio digital television reference test pattern BT Series Broadcasting service (television) ii Rec. ITU-R BT.1729 Foreword The role of the
Diffraction of a Circular Aperture
 Diffraction of a Circular Aperture Diffraction can be understood by considering the wave nature of light. Huygen's principle, illustrated in the image below, states that each point on a propagating wavefront
TRIMBLE TX5 3D LASER SCANNER QUICK START GUIDE
 TRIMBLE TX5 3D LASER SCANNER QUICK START GUIDE Equipment 1 8 9 5 6 7 4 3 2 The TX5 laser scanner ships with the following equipment: 1 Scanner transport and carry case 6 USB memory card reader 2 AC power
SPSS Manual for Introductory Applied Statistics: A Variable Approach
 SPSS Manual for Introductory Applied Statistics: A Variable Approach John Gabrosek Department of Statistics Grand Valley State University Allendale, MI USA August 2013 2 Copyright 2013 John Gabrosek. All
How To Run Statistical Tests in Excel
 How To Run Statistical Tests in Excel Microsoft Excel is your best tool for storing and manipulating data, calculating basic descriptive statistics such as means and standard deviations, and conducting
Heart Rate Data Collection Software Application User Guide
 Y O R K B I O F E E D B A C K w w w. y o r k - b i o f e e d b a c k. c o. u k G l y n B l a c k e t t Heart Rate Data Collection Software Application User Guide Table of Contents 1 Introduction...1 2
Antenna Diversity in Wireless Local Area Network Devices
 Antenna Diversity in Wireless Local Area Network Devices Frank M. Caimi, Ph.D. Kerry L. Greer Jason M. Hendler January 2002 Introduction Antenna diversity has been used in wireless communication systems
6.4 Normal Distribution
 Contents 6.4 Normal Distribution....................... 381 6.4.1 Characteristics of the Normal Distribution....... 381 6.4.2 The Standardized Normal Distribution......... 385 6.4.3 Meaning of Areas under
Interactive Logging with FlukeView Forms
 FlukeView Forms Technical Note Fluke developed an Event Logging function allowing the Fluke 89-IV and the Fluke 189 models to profile the behavior of a signal over time without requiring a great deal of
What is a piper plot?
 What is a piper plot? A piper plot is a way of visualizing the chemistry of a rock, soil, or water sample. It s comprised of three pieces: a ternary diagram in the lower left representing the cations,
Eye Tracking Instructions
 Eye Tracking Instructions [1] Check to make sure that the eye tracker is properly connected and plugged in. Plug in the eye tracker power adaptor (the green light should be on. Make sure that the yellow
Vestibular Assessment
 Oculomotor Examination A. Tests performed in room light Vestibular Assessment 1. Spontaneous nystagmus 2. Gaze holding nystagmus 3. Skew deviation 4. Vergence 5. Decreased vestibular ocular reflex i. Head
Using Pupil Size as a Measure of Cognitive Workload in Video-Based Eye-Tracking Studies
 Using Pupil Size as a Measure of Cognitive Workload in Video-Based Eye-Tracking Studies Marc Pomplun*, Sindhura Sunkara, Alexander V. Fairley, and Mei Xiao Department of Computer Science, University of
1. Units of a magnetic field might be: A. C m/s B. C s/m C. C/kg D. kg/c s E. N/C m ans: D
 Chapter 28: MAGNETIC FIELDS 1 Units of a magnetic field might be: A C m/s B C s/m C C/kg D kg/c s E N/C m 2 In the formula F = q v B: A F must be perpendicular to v but not necessarily to B B F must be
Classroom Tips and Techniques: The Student Precalculus Package - Commands and Tutors. Content of the Precalculus Subpackage
 Classroom Tips and Techniques: The Student Precalculus Package - Commands and Tutors Robert J. Lopez Emeritus Professor of Mathematics and Maple Fellow Maplesoft This article provides a systematic exposition
Introduction to the Smith Chart for the MSA Sam Wetterlin 10/12/09 Z +
 Introduction to the Smith Chart for the MSA Sam Wetterlin 10/12/09 Quick Review of Reflection Coefficient The Smith chart is a method of graphing reflection coefficients and impedance, and is often useful
TS-E24mm f/3.5l TS-E45mm f/2.8 TS-E90mm f/2.8 Instructions
 TS-E24mm f/3.5l TS-E45mm f/2.8 TS-E90mm f/2.8 ENG Instructions Thank you for purchasing a Canon product. Canon s TS-E lenses are tilt-shift lenses designed for EOS cameras. The tilt-shift mechanism enables
The Effects of Reading Speed on Visual Search Task
 The Effects of Reading Speed on Visual Search Task Masaharu Kato (pieko@abmes.twmu.ac.jp) Tokyo Women s Medical University 8-1, Kawada-cho, Shinjuku-ku, Tokyo162-8666, JAPAN Mitsugu Kuriyama (kuri@cs.c.u-tokyo.ac.jp)
Personal Identity Verification (PIV) IMAGE QUALITY SPECIFICATIONS FOR SINGLE FINGER CAPTURE DEVICES
 IMAGE QUALITY SPECIFICATIONS FOR SINGLE FINGER CAPTURE DEVICES") Personal Identity Verification (PIV) IMAGE QUALITY SPECIFICATIONS FOR SINGLE FINGER CAPTURE DEVICES 1.0 SCOPE AND PURPOSE These specifications apply to fingerprint capture devices which scan and capture
Personal Identity Verification (PIV) IMAGE QUALITY SPECIFICATIONS FOR SINGLE FINGER CAPTURE DEVICES 1.0 SCOPE AND PURPOSE These specifications apply to fingerprint capture devices which scan and capture
Application note for listmode scanning
 Application note for listmode scanning This application note explains what listmode acquisition is, how a listmode scan is done and how to process a listmode scan with SkyScan software. What is listmode?
Q1. The graph below shows how a sinusoidal alternating voltage varies with time when connected across a resistor, R.
 Q1. The graph below shows how a sinusoidal alternating voltage varies with time when connected across a resistor, R. (a) (i) State the peak-to-peak voltage. peak-to-peak voltage...v (1) (ii) State the
Plot the following two points on a graph and draw the line that passes through those two points. Find the rise, run and slope of that line.
 Objective # 6 Finding the slope of a line Material: page 117 to 121 Homework: worksheet NOTE: When we say line... we mean straight line! Slope of a line: It is a number that represents the slant of a line
Measuring Line Edge Roughness: Fluctuations in Uncertainty
 Tutor6.doc: Version 5/6/08 T h e L i t h o g r a p h y E x p e r t (August 008) Measuring Line Edge Roughness: Fluctuations in Uncertainty Line edge roughness () is the deviation of a feature edge (as
Tizian TM Creativ RT. Abutment Designer. for the CAD-software version 3.932. Instruction Manual
 Tizian TM Creativ RT Abutment Designer for the CAD-software version 3.932 Instruction Manual Schütz Dental GmbH 61191 Rosbach, Germany Tel.: +49 6003 / 814-0 Fax: +49 6003 / 814-906 Version: 12/2010 Contents
Template-based Eye and Mouth Detection for 3D Video Conferencing
 Template-based Eye and Mouth Detection for 3D Video Conferencing Jürgen Rurainsky and Peter Eisert Fraunhofer Institute for Telecommunications - Heinrich-Hertz-Institute, Image Processing Department, Einsteinufer
Chapter 3 Falling Objects and Projectile Motion
 Chapter 3 Falling Objects and Projectile Motion Gravity influences motion in a particular way. How does a dropped object behave?!does the object accelerate, or is the speed constant?!do two objects behave
Effective Use of Android Sensors Based on Visualization of Sensor Information
 , pp.299-308 http://dx.doi.org/10.14257/ijmue.2015.10.9.31 Effective Use of Android Sensors Based on Visualization of Sensor Information Young Jae Lee Faculty of Smartmedia, Jeonju University, 303 Cheonjam-ro,
Pro/ENGINEER Wildfire 5.0 Introduction to Surface Modeling
 Introduction Several advanced surface types are available as listed below. Variable Section Sweep Boundary Blend Section to Surfaces Blend Surface to Surface Blend A surface is created by sweeping a single
M A R C O. CP-670 AUTOMATIC CHART PROJECTOR Instruction Manual
 M A R C O CP-670 AUTOMATIC CHART PROJECTOR Instruction Manual CONTENTS GENERAL DESCRIPTION............... 1 INSTALLATION...................... 2 Mounting the Projector Positioning the Projector Positioning