(Other than Muslims)
|
|
|
- Carmel Henderson
- 7 years ago
- Views:
Transcription

1 (Other than Muslims) Report Submitted to: National Commission for Minorities (NCM) Preet Rustagi Abhay Kumar Balwant Singh Mehta Sunil Kumar Mishra Payel Dutta Mazumdar March 2008 INSTITUTE FOR HUMAN DEVELOPMENT NIDM Building, 3 rd Floor, IIPA Campus, I.P Estate, New Delhi Ph: , ; Fax: ; ihd@vsnl.com;
2 Preet Rustagi, Ph.D March 25, 2008 Senior Fellow Subject: Project Report Submission Socio-Economic Status of the Notified Minority Communities (Other than Muslims) Dear Shri Qureshi, We are happy that the National Commission for Minorities (NCM), Government of India gave us this opportunity to conduct a study based on secondary data sources regarding the socioeconomic profile of the four notified minority communities. As agreed upon in our discussions with the NCM prior to the initiation of the study, the report provides a detailed quantitative account of the four notified minority communities Sikhs, Christians, Buddhists and Parsis using all available information. The terms of reference for the study were as follows: 1. The Socio-economic study will be done in respect of the four notified minority communities i.e. Christians, Sikhs, Buddhists, including Neo Buddhists and Parsis. 2. The study will cover the educational, economic and social status of the four minority communities apart from their hygiene, health and religion related problems. 3. The study will take into account the three strata of the four minority communities for the assessment of their socio-economic and religious status i.e. the elites, the middle class and lowest strata including artisans and labourers. 4. The study will highlight the problematic areas and suggest viable measures to resolve the problems of the minorities so that the minorities can walk abreast with other privileged communities in all walks of life in due course. 5. The study will include detailed recommendations based on their findings on the socioeconomic and educational backwardness of the minorities. The Institute for Human Development (IHD) research team attempted to provide a comprehensive account and address all the above stated dimensions subject to the data availability. Information has been collated and analysed from unit records of National Sample Survey (NSS), Census and National Family Health Survey (NFHS). We hope that the report will be useful for the NCM in taking its mandate further. We look forward to your comments and suggestions on the report. With warm regards, Yours sincerely, Shri Mohamed Shafi Qureshi Chairperson National Commission for Minorities (NCM) Lok Nayak Bhavan (Fifth Floor), Khan Market New Delhi Copy to: 1. Smt. Deepa Jain Singh, Secretary, NCM 2. Shri S.K. Swami, Joint Secretary, NCM (Preet Rustagi) Enclosed: Eight copies of the Report
3 ACKNOWLEDGEMENTS We wish to thank the National Commission for Minorities (NCM), Government of India for sponsoring this study on the Socio-Economic Status of the Notified Minority Communities (other than Muslims). Particularly, we are extremely thankful to Prof. Zoya Hasan, Member of the NCM for providing us the opportunity to undertake this study. We also benefited tremendously through the several detailed discussions with her. Thanks are also due to Dr. Mehroo Dhunjisha Bengalee, Member of the NCM for sharing time and information in the course of the meetings we held with her at the inception of the study. Prof. Alakh N. Sharma, Director, Institute for Human Development (IHD) has been a constant source of inspiration and support in all our research endeavours and we wish to extend our thanks to him for always being there when we needed him. Senior visiting faculty and colleagues at IHD have shared ideas and held discussions making all our research pursuits pleasurable. Research assistance ably provided by Mr. Pinaki Joddar at the early stages of the project (after which he left IHD) and Dr. Rajani Menon towards the final stages of the study when she joined the IHD team deserve to be acknowledged. Thanks are also due to Mr. Prem Chandra, Administrative Manager along with his team for extending their support in all administrative matters and Shri S.P. Sharma for responsibly undertaking the typing, page setting and related tasks within a short time period. Ms. Shashikala Menon undertook the copyediting of the report and her help in this direction is acknowledged. The rich data available from different secondary sources makes it feasible to undertake very interesting analysis. Given the short period of four months, we have been able to only undertake an all India profiling of the four notified minority communities Sikhs, Christians, Buddhists and Parsis/Zoroastrians which provides some very insightful findings. We hope this study will pave the way for further state and region level explorations on the minority communities. - IHD Research Team Preet Rustagi Abhay Kumar Balwant Singh Mehta Sunil Kumar Mishra Payel Dutta Mazumdar
4 CONTENTS Acknowledgements i Contents ii-iii List of Tables, Figures and Appendices iv-vii Main Highlights of the Report viii-xxii CHAPTER I: INTRODUCTION Chapter Structure Data Sources and Limitations Share of Notified Minority Communities Geographical Profile Christians Sikhs Buddhists Parsis/Zoroastrians CHAPTER II: DEMOGRAPHIC PROFILE Number and Percentage Share Distribution of Population by State and Social Groups Rate of Urbanisation Household and household Size Head of the Household Marital Status Age at Marriage Sex- Ratio and the Child Sex Ratio Literacy Rate Number of Literates per household Work Participation Rate CHAPTER III: EDUCATIONAL ATTAINMENT Age-wise Literacy Rate Age-wise Female Literacy Rate Literacy Rate of the Different Social Groups Percentage Change in the Literacy Rate of the Notified Minority Communities (Other than Muslims) during and Educational levels among the Notified Minority Communities Graduates and above Currently Enrolled Children (5-14 years) Currently Enrolled Children (15-29 years) Never Enrolled Children (5-14 years) Never Enrolled Children (15-29 years) Dropout Children (5-14 years) Out of School Children (5-14 years) CHAPTER IV: HEALTH ATTAINMENT Nutritional Status Mortality Rates Prevalence of Anaemia Immunization
5 5. Son Preference Fertility Rates Contraception Maternal Health Teenage Pregnancies CHAPTER V: LAND AND POVERTY Operational Landholding Trends in Operational Landholding Poverty level Trends in Poverty ( to ) Education and Employment Statuses Across MPCE Quintiles Rural Profile Urban Profile CHAPTER VI: EMPLOYMENT AND UNEMPLOYMENT Labour force Participation Rates (LFPR) Work Participation Rates (WPR) Unemployment Rate Employment Status Industrial Distribution of Workers Occupational Distribution Age wise LFPR Educational Status (5-9 Groups) Distribution of Tertiary Sector (Urban) Rural Buddhists Employment Status Employment Status of Urban Christians and Sikhs Distribution of Primary Sector Employment in Rural Areas by MPCE Quintiles Conclusion CHAPTER VII: CONCLUDING RERMARKS & RECOMMENDATIONS R APPENDIX TABLE
6 LIST OF TABLES, FIGURES AND APPENDICES LIST OF TABLES & APPENDICES Tables & Appendix No Title Page Nos Table 1.1 Share and Growth Rate of Three NMCs Over Last Two Decades 4 Table 1.2 State-wise Percentage of Minority Population in India, Table 1.3 Distribution of Districts by NMC Concentration Levels 5 Appendix 1.1 Districtwise Concentration of Christian Population in India, 2001( Rural+urban) 14 Appendix 1.2 Districtwise Concentration of Sikh Population in India, 2001 (Rural+Urban) 15 Appendix 1.3 Districtwise Concentration of Buddhist Population in India, 2001 (Rural+urban) 16 Appendix 1.4 Statewise Number of Christian Concentrated District in India, Appendix 1.5 Statewise Number of Sikh Concentrated District in India, Appendix 1.6 Statewise Number of Buddhist Concentrated District in India, Table 2.1 Number and Percentage Share of the Four Notified Minority Communities 21 Table 2.2 Percentage Share of the Four Notified Minority Communities in their Total 21 Population Table 2.3 States with Significant Share of Minority Population 22 Table 2.4 States with Major Proportion of Minority Population 23 Table 2.5 Share of Minorities by Social Groups Table 2.6 Rate of Urbanisation for the Four Notified Minority Communities 24 Table 2.7 Household Size of the Minority Communities (Other than Muslims) 25 Table 2.8 Male and Female headed Households in Notified Minority Communities Other 26 than Muslims Table 2.9 Marital Status of the Different Religious Communities 27 Table 2.10 Sex-Ratio for the Four Notified Minority Communities 29 Table 2.11 Child Sex-Ratio in Notified Minority Communities 30 Table 2.12 Literacy Rate for the Four Notified Minority communities 31 Table 2.13 Percentage of Households and Number of Literate members in Notified Minority 32 communities Table 2.14 Work Participation Rate for the Notified Minority communities 33 Table 3.1 Age-wise Literacy Rate of the Notified Minority Notified communities, Table 3.2 Age-wise Female Literacy Rate of the Notified Minority communities, Table 3.3 Educational Level of the Notified Minority Communities (Other than Muslims) by 40 Sex and Residence Table 3.4 Percentage of Graduates and Above of the Educated Population in the Notified 40 Minority Communities (Other than Muslims), 2001 Table 3.5 Percentage of Currently Enrolled Children (5-14) 41 Table 3.6 Percentage Change of Currently Enrolled Children (5-14) among the Notified 42 Minority Communities from to Table 3.7 Percentage of Currently Enrolled Children (15-29) in the Notified Minority 42 Communities, Table 3.8 Percentage Change of Currently Enrolled Children (15-29) among the Notified 43 Minority Communities during and Table 3.9 Percentage of Never Enrolled Children (5-14) in the Notified Minority 43 Communities, Table 3.10 Percentage Change of Never Enrolled Children (5-14) among the Notified 44 Minority Communities during and Table 3.11 Percentage of Never Enrolled Children (15-29 yrs) in the Notified Minority Communities,
7 Tables & Appendix No Title Page Nos Table 3.12 Percentage Change of Never Enrolled Children (15-29 yrs) among the Notified 45 Minority Communities during and Table 3.13 Percentage of Dropout Children (5-14) in the Notified Minority Communities, Table 3.14 Percentage Change of Dropout Children (5-14) among the Notified Minority 46 communities during and Table 3.15 Percentage Change of Out of School Children (5-14) among the Notified 47 Minority Communities during and Table 4.1 Nutritional Status of Children among the Notified minority Communities 48 Table 4.2 Early Childhood Mortality Rates among the Notified Minority Communities (lives 51 per 1000 births) Table 4.3 Anaemia Status of the Children in Notified Minority Communities 54 Table 4.4 Prevalence of Anaemia among Women in the Notified Minority Communities 55 Table 4.5 Prevalence of Anaemia among Men in the Notified Minority Communities ( ) Table 4.6 Immunization among Children in the Notified Minority Communities 56 Table 4.7 Son Preference in the Notified Minority Communities 58 Table 4.8 Total fertility Rate of Women in the Notified Minority Communities 59 Table 4.9 Women s Exposure to Family Planning Messages in the Notified Minority 60 Communities (%) Table 4.10 Current Use of Contraception by Women of the Notified Minority Communities 60 (%) Table 4.11 Usage of Various Methods of Contraception in the Notified Minority communities 61 (%) Table 4.12 Discussion of Family Planning in the Notified Minority Communities ( (%) Table 4.13 Place of Delivery in the Notified Minority Communities (%) 62 Table 4.14 Assistance during Delivery ( ) (%) 63 Table 4.15 Teenage Pregnancies in the Notified Minority Communities 64 Table 5.1 Operational Landholding Size Among Notified Minority Communities 66 Table 5.2 Literacy Level of NMCs by Quintiles (%) 73 Table 5.3 Educational Level Upto Secondary level of NMCs in the Rural Areas (%) 73 Table 5.4 Educational Level Above Secondary of NMCs in the Rural Areas (%) 74 Table 5.5 Educational level Upto Secondary Level of NMCs in the Urban Areas (%) 74 Table 5.6 Educational Level Above Secondary Level of NMCs in the Urban areas (%) 74 Table 5.7 Self-Employed in different NMCs by MPCE Quintiles (%) 75 Table 5.8 Regular Employment in different NMCs by MPCE Quintiles (%) 76 Table 5.9 Casual Employment in different NMCs by MPCE Quintiles 76 Table 6.1 Labour Force Participation Rates for Persons for Notified Minority Groups during (UPSS) (%) Table 6.2 Worker Participation Rates for Notified Minority Community Groups during (UPSS) (%) Table 6.3 Unemployment Rate for the Other Notified Minority Communities in (UPSS) (%) Table 6.4 Percentage of Usual Principal and Subsidiary Status of Employed Persons for 82 Notified Minority Groups during ( ) (%) Table 6.5 Major Industrial Distribution of Workers by Notified Minority Communities in (%) Table 6.6 Occupational Distribution of Major Notified Minority Community Group, Table 6.7 Occupational Distribution, persons ( ) (%) 86 Table 6.8 Age-wise Labour Force Participation Rates (%) 87 Tables & Title Page
8 Appendix No Nos Table 6.9 Educational Status of 5-19 years Age Group (%) 88 Table 6.10 Distribution of Tertiary Sector in Urban Areas (%) 89 Table 6.11 Employment Status of Rural Buddhists (%) 90 Table 6.12 Employment Status of Urban Christians and Sikhs (%) 91 Table 6.13 Distribution of Primary Sector in Rural Areas by MPCE Quintile (%) 92 Annexure 1 Labour Force Participation Rates (%) 94 Annexure 2 Work Force Participation Rates (%) 94 Annexure 3 Unemployment (%) 95 Annexure 4 Employment Status (%) 95 Annexure 5a Major Industrial Distribution of Workers by Notified Minority Communities in (%) Annexure 5b Major Industrial Distribution of Workers by Notified Communities in (%) 96 LIST OF FIGURES Fig. No. Title Page Nos Fig. 2.1 Percentage Share of the Four Minority Communities in Their Total 22 Population Fig. 2.2 Average Household Size of Different Religious Communities 25 Fig. 2.3 Age at Marriage of the Females among the Notified Minority 28 Communities (Other than Muslims) Fig. 2.4 Age at Marriage of the Males among the Notified Minority 28 Communities (other than Muslims) Fig. 3.1 Literacy Rate for the Social Categories of Notified Minority communities 37 (Other than Muslims), Fig. 3.2 Percentage Change in the Literacy Rate of the Notified Minority 38 communities (Other than Muslims) during and Fig. 3.3 Educational Level among the Notified Minority communities (other than 39 Muslims) 2001 Fig. 3.4 Percentage of Out of School Children (5-14 years) in the Notified 47 Minority Communities (other than Muslims), Fig. 4.1 Percentage of Underweight Children (Weight-for-Age) among the 49 Notified Minority communities Fig. 4.2 Percentage of Stunted Children (Height-for-Age) among the Notified 49 Minority Communities Fig. 4.3 Percentage of Wasting Children (Weight-for-Height) among Notified 50 Minority Communities Fig. 4.4 Child Mortality among the Notified Minority communities (other than 51 Muslims) Fig. 4.5 Child Mortality among the Buddhist Community 52 Fig. 4.6 Incidence of Anemia among Children in the Minority Communities 53 (Other than Muslims) Fig. 4.7 Incidence of Anemia among Women in the Notified Minority 53 communities (Other than Muslims) Fig. 4.8 Immunization of the Children among the Notified Minority Communities 57 Fig. 4.9 Usage of Contraception among the Notified Minority Communities 61 (other than Muslims) Fig 5.1a Landless 66 `Fig. No. Title Page Nos Fig 5.1b Below Marginal ( ha) 66
9 Fig 5.1c Small Landholding ( ha) 66 Fig. 5.1d Medium Landholding ( ha) 66 Fig. 5.1e Large Landholding (4.01 +) 66 Fig 5.2 Percentage of Population Below Poverty Line among the Major 70 Religious Communities, Fig 5.3 Population Below Poverty Line among Notified Minority Communities, to Fig 5.4 Rural Population Below Poverty Line among Notified Minority 72 Communities to Fig 5.5 Urban Population Below Poverty Line among Notified Minority 71 Communities, to Fig 6.1 Work Participation Rates - Rural Male 80 Fig 6.2 Work Participation Rates - Rural Female 80 Fig 6.3 Work Participation Rates Urban Male 80 Fig 6.4 Work Participation Rates Urban Females 80 LIST OF MAPS Map No Title Page Nos Map. 1.1 Districtwise Share of Christian Population in India, Map. 1.2 Districtwise Share of Sikh Population in India, Map. 1.3 Districtwise Share of Buddhist Population in India, Map. 1.4 Statewise Share of Christian Population in India, Map. 1.5 Statewise Share of Sikh Population in India, Map. 1.6 Statewise Share of Buddhist Population in India, Map. 1.7 Statewise Number of Parsi Population in India,
10 MAIN HIGHLIGHTS OF THE REPORT DEMOGRAPHY Number & Percentage Share The 4 minorities (Christians, Sikhs, Buddhists and Parsis (Zoroastrians) constitute 5 per cent of the total population of India; together their total population is million). Of this, Christians are 2.3 per cent of the population, Sikhs are 1.9 per cent, Buddhists are 8 per cent and the Parsis are just per cent. Though the proportion of Parsis is negligible, they are one of the most developed communities in India. Among these 4 minorities, males constitute per cent and females per cent. A major proportion 68 per cent of the four minority communities lives in rural areas. Among the 4 minorities, Christians constitute per cent, Sikhs per cent, Buddhists 15.5 per cent and Parsis 14 per cent. Distribution of Population The minority populations are concentrated in a few states: - 25 per cent of the Christian community is in Kerala, and 16 per cent is in Tamil Nadu per cent of the Sikhs are found in Punjab and 6 per cent in Haryana per cent of the Buddhist population is located in Maharashtra and 6 per cent in Karnataka per cent of the Parsis are in Maharashtra and 17 per cent are in Gujarat. States with Significant share of Minority Population The minorities are so concentrated in some states that they come close to becoming a majority. In the northeastern states, Christians account for as much as 90 per cent in Nagaland, 87 per cent in Mizoram and 70 per cent in Meghalaya. Sikhs constitute 60 per cent of the population in Punjab.
11 The Buddhists in Sikkim constitute 28 per cent of the population. Rate of Urbanization The rate of urbanization for the four minority communities is 32 per cent. Parsis are the most urbanized community with per cent of them inhabiting urban areas, while Sikhs are the least urbanized with only per cent in urban areas. Households & Household Size Of the total households in India, per cent are rural. Of the total households in India, Christians account for 2.6 per cent, Sikhs are 1.77 per cent, and Buddhists are 0.83 per cent. Statistics on Parsis households is not available. Sikhs have the highest average household size of 5.6, which is greater than the average household size for India (5.3). Christians have the lowest average household size of 4.8. Household Head Of the minorities, Christians have the highest proportion of female-headed households, greater than the national average, and Sikhs have the least at 9.3 per cent. For all the communities, the proportion of female-headed households is higher in the urban areas. Marital Status The highest proportion of Christians is in the never married category i.e per cent, followed by Buddhists with per cent, and Sikhs with per cent. Age at Marriage In India, per cent of married females are married off below the legal age of marriage, especially in the rural areas. Early marriages are found to be highest among Buddhist females (41.04 per cent) and lowest among Christians (16.46 per cent), followed by Sikhs (17.02 per cent). Sex-Ratio
12 There is a wide variation in sex ratio among the minorities i.e among Parsis, 1009 among Christians, 953 among Buddhists and the lowest at 893 among Sikhs, compared to the national figure of 955. Child Sex-Ratio The child sex-ratio is low for all the four minority communities. The very low sex-ratio among the 0-4 age group of the Sikh community seems to be alarming, with a huge deficit of 220 female children per thousand male children. Except for the Christian community, the child sex-ratio is lower in the urban areas, particularly for the Sikhs, indicating a high level of sex determination and female foeticide being practiced especially among the Sikhs in the urban areas. Literacy Rate The minority communities have a literacy rate higher than the average literacy rate for India at 64.8 per cent, though females, especially in the rural areas, have a lower literacy rate than their male counterparts. Parsis have a very high literacy rate of 97.9 per cent, followed by Christians with 80.3 per cent, Buddhists with 72.7 per cent and Sikhs with 69.4 per cent. The female literacy rate is relatively high among the Christian community with 76.2 per cent, and lowest among Buddhists i.e 61.7 per cent. The male-female literacy gap is the highest among Buddhists and the lowest among the Parsis. Number of Literates per Household Across the country, 14.4 per cent of the households have no literate members. This proportion of households is lower among the minority communities, at less than 10 per cent. It is lowest among the Christians (7.1 per cent) followed by Sikhs (9.2 per cent) and Buddhists (9.1 per cent). Across all communities, households with illiterate members are higher in rural areas than in urban areas. This is also true for the minority communities. Work Participation Rate The WPR for the nation is 39.1 per cent; per cent for females and per cent for males.. The WPR among Buddhist females is very high at 32 per cent, making the overall WPR for the community highest among the NMCs.
13 The male-female gap in the WPR is high among Sikhs i.e , and even wider in urban areas i.e per cent. Only 9.96 per cent of females from Sikh community in the urban areas are economically active. The low level of sex-ratios, low level of WPR, and low level of literacy among Sikh females all indicate gender discrimination, which requires urgent attention by policy makers. EDUCATIONAL ATTAINMENT Age-wise literacy rates The literacy rate for the four minority communities is invariably higher than the national average. Age-wise Female Literacy Rate The female literacy rate is lower than the male literacy rate, and is lower than the total literacy levels for all age-groups. Buddhist females record the maximum literacy for children and adolescents, whereas Christian females record maximum literacy among subsequent age groups. Literacy Rate among Different Social Groups The NMCs report a relatively higher literacy rate compared to the all India scenario, except for the general category of Buddhists. Irrespective of social category, the Buddhists have very little variation in the literacy rates. Among the Sikhs, the SCs and OBCs have the lowest literacy rate compared to all other social categories across the NMCs. The Christians have better literacy rates compared to Sikhs and Buddhists, but among the Christian community, the Scheduled Tribes have a lower literacy rate Percentage Change in the Literacy Rate A decline in the literacy rate is observed over to in the case of the Other Backward Classes of Christians and Sikhs, and also among the General category of Buddhists. Education Level among Notified Minorities Christians have the highest proportion of population with a higher level of education (10.89 per cent), and the Buddhists have the lowest proportion of higher educated population (6.04 per cent). Education Levels of Females
14 The national figures show that a lower proportion of females pursue higher levels of education and the minority communities also exhibit the same pattern, with higher levels of elementary education and lower levels of higher education among females in the rural areas. The Christian community has the highest proportion of higher educated females (10.47 per cent) and the Buddhist community has the lowest proportion (3.94 per cent). Graduates and Above Of the total literate population of India, 6.72 per cent is educated to the graduate and above level. The male-female gap in the proportion of graduates is in favour of males, except for the Sikh women in the urban areas. Among the urban Sikh community, females with graduation and above are in a higher proportion than their male counterparts. The proportion of total female graduates is highest among the Christian community. Currently Enrolled Children (5-14 years) per cent of the children in the age group of 5-14 years are currently enrolled in some school in India, and the enrolment rate of children in the age group 5-14 years among the minority communities is well above the national average. The percentage of currently enrolled children (5-14 years) is lowest among the Sikh community, while the Parsi community has recorded universal enrolment. During the period from and , the proportion of currently enrolled children (5-14 years) among the minority communities is lower than the national average, except for the rural females of the Buddhist community where enrolment is higher. However, the number of enrolled Buddhist children (both male and female) in the urban areas has actually declined, as has the enrolment rate among the urban males of the Sikh community. Currently Enrolled Children (15-29 years) Except for the Parsi community, the enrolment rate for adolescents and youths among the minority communities is higher than the national average, though the enrolment rate for the urban females of this category is higher. For the period and , a mass decline is witnessed in the enrolment rate for the age group years at the national level, and also among the minority communities, except for the Parsi community (particularly the males) and for the males of the Buddhist community, for whom the enrolment rate went up.
15 Never Enrolled Children (5-14 years) The proportion of never enrolled children among the minority communities is far below the national average. The Sikh community has the highest proportion of never enrolled children (8.35 per cent), followed by the Buddhists (6.08 per cent) and Christians (6.3 per cent). Unlike the national pattern, the Buddhist community has a larger proportion of never enrolled males than females, and also a higher proportion of never enrolled children in the urban areas than the rural areas. A decline in children never enrolled is visible for a greater proportion of the males rather than females of the Christian and Sikh communities, and for the females rather than males of the Buddhist community. Never Enrolled Children (15-29 years) The proportion of never enrolled children (15-29 years) among the minority communities is far below the national average. The proportion is higher among the females than the males, and in the rural areas rather than the urban areas. It is highest among the Sikhs (15.98 per cent), followed by the Christians (10.57 per cent) and the Buddhists (7.71 per cent). The proportion of never enrolled children declined over the years, more among the females than the males, and in the rural areas compared to the urban areas, especially among the Christian children. A remarkable decline in the rate (by per cent) is witnessed among the rural Buddhist females during the last five years. Dropout Children (5-14 years) The dropout rate among the minority communities is lower than that at the national level. Except for Christian males, the dropout rate (5-14 years) is higher among the females, and in the rural areas. There is only a minor decline in dropout rate among the minority communities, except for the Buddhist females in the rural areas. Out of School Children (5-14 years) The proportion of out of school children (5-14 years) among the minority communities is lower than the national average. Except for the rural males of the Buddhist community, the percentage of out of school children is higher among the females, and in the rural areas. The proportion of out of school children is the highest among the females of the Sikh community, especially the rural females.
16 During the last five years, a greater decline in the proportion of out of school children is witnessed among the Buddhists, and there is a major decline in out of school Buddhist females, especially in the rural areas. HEALTH AND NUTRITION Nutritional Status of children Among the minorities, the proportion of undernourished children is the highest among the Buddhists i.e per cent in and 39.2 per cent in It is the lowest among the Sikhs i.e per cent in and 22 per cent in For the period to , there is a marginal increase in the proportion of stunted and wasted children at the national level and also among the minorities, except for the Sikh community where it has declined. The comparative overall nutritional status of children reveals the status of Buddhist infants to be the worst. In all the three nutritional indicators - stunting, wasting and underweight children belonging to Buddhist households report higher percentages below the set standards, followed by Christians. Mortality Rates The infant mortality rate, childhood mortality rates, neonatal mortality rate, postneonatal rate, as well as the under-5 child mortality rates at the national level all show a declining trend. However, this is not necessarily the case with all the minority communities. The neonatal mortality rates have fallen for all communities except Buddhists, for whom they have risen, from 39.5/1000 in to 43/1000 live births in The scenario is the same for the child mortality rate, as well as the under-five mortality rates, with Buddhists showing an increase in both rates for the period, from 14.1/1000 to 17.1/1000 in the case of the former, and from 69/1000 to 66.9/ 1000 live births in the latter. Anaemia among Children The proportion of children suffering from anaemia declined from 74.2 per cent in to 69.5 per cent in However, the prevalence of anaemia among children still remains a matter of general concern. Except for the Buddhists, mild anaemia among children increased at the national level and also among the minorities, while moderate anaemia declined. Severe anaemia also declined, except for the Sikhs. A significant improvement is witnessed in the case of Buddhists, where the incidence of severe anaemia declined from 3.5 per cent in to 0.2 per cent in
17 Anaemia among Women Among the minorities also, the incidence of anaemia has shown an increase, except for a marginal decline among the Sikh women from 39.6 per cent in to 39.2 per cent in The Buddhist women who were severely anaemic in (3.1 per cent) seem to have attained a better health status in , with a lower incidence of anaemia (1.9 per cent), which may be considered a good sign of improvement. Prevalence of Anaemia among Men While the incidence of anaemia is more among women than men, the incidence of anaemia is the maximum among the Buddhist men, and the incidence is less among Sikh men (15.9 per cent). Immunization The rate of immunization of children among the minority communities is well above the national rate of immunization. The percentage of children with all vaccinations have declined for all communities, for the period from to The proportion of children who have not received any vaccination is the greatest among the Christians i.e. 9.4 per cent in , and the least among the Buddhists, at 0.7 per cent in Son Preference Among the minority communities, the majority of the Sikh women (18 per cent) want more sons than daughters and only a very low proportion of them (1.4 per cent) want daughters rather than sons. The Buddhist women have a similar view, as 17.2 per cent want more sons than daughters and only 3.6 per cent of them want more daughters than sons. Among Christians, a majority of them being tribal populations, a different picture emerged, with men exhibiting more of a son preference compared to the women, in wanting more sons than daughters. Fertility Rates All the minority communities, except the Buddhists (whose rate of growth is very low), experienced a fall in fertility rates. The rate of fall in fertility rate is the highest among the Sikh community. Contraception The Sikh community (75.6 per cent in and 69 per cent in ) and the Buddhist community (61.8 per cent in and 55.9 per cent in )
18 gather knowledge on family planning methods mainly through television, but dependence on television is less among the Christians. Dependence on newspapers (3.3 per cent in and 34.4 per cent in ) and wall paintings (48 per cent in and 32.3 per cent in ) as a source of awareness on family planning methods is the maximum among the Christians. Dependence on newspapers is comparatively the least among the Buddhists (21.8 per cent in and 29.8 per cent in ). Use of Contraceptives The proportion of currently married women using contraceptives is the highest among the Buddhists (64.7 per cent in and 67.7 per cent in ) followed by Sikhs (65.3 per cent in and 66.5 per cent in ), but contraceptive use among Christian women is less. Among the various methods of contraception used, female sterilization is highest among the Buddhists (54 per cent), while it is the lowest among the Sikhs (31.4 per cent). The use of pills, condoms and IUDs is quite high among the Sikhs, compared to other minorities. Compared to the women of other minority communities, the percentage of women who discussed family planning with others is higher among the Sikh community. 41 per cent of Sikh women discussed family planning with their husbands and 21.3 per cent discussed it with their friends. Maternal Health The Sikh community shows the maximum preference for deliveries in private hospitals. Their proportion is 35.3 per cent in and 42 per cent in Only 46.6 per cent of deliveries in India are attended by a health professional, including 35 per cent by doctors and 10.3 per cent by an ANM/nurse or midwife. The Buddhist community shows the maximum proportion of deliveries being attended by friends or relatives who are non-health professionals (18.8 per cent). Yet, more, than half of their deliveries are attended by doctors per cent of Sikh deliveries are attended by Dais. This position is high compared to other minorities. Compared to the national average of 46.6 per cent, the proportion of deliveries assisted by skilled health care professionals is high among all the minority communities. Teenage Pregnancies
19 Among the minority communities, the level of teenage pregnancy and motherhood is high among the Buddhists, i.e. 7.6 per cent of the teenagers have had a live birth, 3 per cent are pregnant with their first child and 10.6 per cent have begun child bearing. LAND AND POVERTY per cent of the total population of India is landless. Among the minority communities, the Christian community is the least landless (54.81 per cent), who also have the highest percentage of population with below marginal (20.51 per cent) and marginal operational holdings (14.30 per cent). The proportion of medium (8.72 per cent) and large farmers (7.13 per cent) is the maximum among the Sikh community. Trends in Operational Landholdings Among the minority communities, the proportion of landless among the Christians declined sharply from per cent in to per cent in The Sikhs and the Buddhists exhibited fluctuating trends. The proportion of landless among the Sikhs declined from per cent in to per cent in and then increased to per cent in Among the Buddhists, the proportion of landless declined from per cent in to per cent in , and then increased to per cent in The proportion of minority communities holding marginal operational land also declined over the years for all the three communities, and especially for the Sikhs and the Buddhists. There was a notable increase in their proportion smallholdings during the second duration ( to ), especially among the Christian community (increased from 0.48 per cent to per cent in ). The proportion of medium and small farmers showed a significant increase, particularly among the Buddhists (medium farmers) (increased from 0.01 per cent to 8.62 per cent), and also among the Sikhs (small farmers) (increased from 0.15 per cent 8.72 per cent) per cent of the rural Sikhs are the only notable proportion of large farmers among the minority communities. Poverty 19.8 per cent of the total population of India lives below the poverty line, and the minority communities have a greater incidence of urban poverty than rural poverty.
20 The Buddhist community is the poorest of the minority communities, having a poverty level (29.86 per cent) greater than the national average (19.80 per cent). Trends in Poverty ( to ) The poverty rate in India generally showed a declining trend, especially in the case of the Christian and Buddhist communities, showing a decline from per cent to per cent, and from per cent to per cent respectively. A similar trend was seen for both urban and rural areas. The poverty ratio for the Sikh community remained constant at around 6 per cent. Literacy by MPCE quintiles Among the lowest strata of the minorities, the literacy rate is the lowest among the Sikhs (44.09 per cent) and the highest among the Buddhists (61.79 per cent). Among the richer sections of the minorities also the Sikh community has a lower literacy rate of per cent, while the Parsi with per cent are the highest. For the lowest strata, upto secondary level of education is lowest among the Sikhs (42.60 per cent), and high among the Buddhists (56.42 per cent). Among the richest sections of the minorities, the Buddhist community (54.24 per cent) has the lowest proportion while the Christian community has the highest. The above secondary level of education for all the strata (only exception being the urban rich) is very low among the Sikh community, and is also far below the national average for all the strata. Above secondary education among all strata of the minorities is highest among the Parsi community, followed by the Buddhist community. Employment by MPCE quintiles The proportion of self-employed workers increases as we move from the poorest to the richest. Among the lowest strata of the minority communities, the Christian community (48.28 per cent) has largest proportion of self-employed workers, and Buddhists (16.02 per cent) are the least self-employed. Among the rich, self-employment is high among the Sikhs (75.74 per cent) and least among the Parsis (44.09 per cent). Except for the Sikhs, there is an increase in the proportion of regularly employment. In the rural areas, a major proportion of regularly employed persons among all strata are from the Christian community. The proportion of self-employed, regularly employed and casual workers among the rich rural Buddhists showed a decline, but the proportion of regularly employed and casual workers among the poor rural Buddhists increased. Further, per cent of the richer rural Buddhists are regular workers; where as the proportion of regular workers among the poorest is only 6.96 per cent.
21 EMPLOYMENT AND UNEMPLOYMENT Labour Force Participation Rates Rural areas have a better LFPR (44.62 per cent) than urban areas (38.25 per cent), and the LFPR among the minorities has increased among both the males and females of rural and urban areas. The Buddhist community has the highest LFPR (48.85 per cent) and the Parsi community has the lowest LFPR (44.56%). The LFPR is highest among Parsi males (60.04 per cent), and Sikh females have the lowest (32.74 per cent), while Buddhist women showed the maximum LFPR of per cent. Work Participation Rates The proportion of workers increased over the period from to , and is higher in the rural areas, except for the Sikhs. The Buddhists community have the highest WPR among the minorities (47.22 per cent). Among the males, the Sikh men (55.14 per cent) have the highest work participation rate, especially the urban men (55.55 per cent.) Buddhist women (40.53 per cent) showed a high WPR among the females, especially the rural women (50.54 per cent). In urban areas, Sikh women have the lowest WPR (15.30 per cent), while it is highest among Parsi women (33.82 per cent). Unemployment The unemployment rate is higher in urban India (5.21 per cent) than in rural India (1.80 per cent). The rate declined for the period to and then rose in Among the minority communities the Christian community has the highest unemployment rate of 6.32 per cent. The Sikh community has the lowest unemployment rate among the males (1.62 per cent) and a relatively high unemployment rate among females (7.05 per cent). The unemployment rate is highest among Christian males (4.70%) and females (5.79 per cent and per cent in urban and rural areas respectively.) There was a major increase in the unemployment rate among Christian women from 8.10 per cent to per cent, and among Sikh women from 5.08 per cent to 9 per cent. Employment Status
22 The proportion of self-employed persons is relatively higher than other categories, especially for the Sikhs (63.65 per cent) and Christians (53.60 per cent) per cent of the workers among Parsis are regularly employed and per cent among the Buddhists are casual workers. Among the minorities, the proportion of self employed and casual workers (males as well as females) are higher in rural areas, while the proportion of them regularly employed is greater in the urban areas. There is a drastic fall from per cent to per cent in the percentage of Sikh female self-employed workers, while the proportion of regularly employed Sikh females increased from 5.92 per cent to per cent. Industrial Distribution of Workers The majority of all workers in rural areas, among Buddhists (63.73 per cent), Sikhs (64.03 per cent) and Christians (53.34 per cent) are engaged in the primary sector. A major part of the workforce among the Parsis (76.03 per cent) is involved in the tertiary sector, especially in the urban areas. Occupational Distribution The majority of the population in India, except the Parsis, work as farmers, fishermen, hunters, loggers and other related works which are mainly primary in nature. The Parsi community is more involved in tertiary activities like administrative, executive and managerial occupations, services and sales, professional and technical occupations, especially in urban areas. However, the proportion of workers engaged in primary activities has declined over the years, while there was a significant improvement in the share of workers engaged in production related works. Rural areas in India have more proportion in primary occupations (72.48 per cent). Urban areas engage per cent of workers in production and related workers and more than half of the workers in service sector. In the rural areas, the majority of the workers in primary activities are from the Buddhist community (82.13 per cent), while the Christian community forms the major proportion of workers in production-related works and other services. Age-Wise Labour Force Participation Rate Labour force participation rate has declined at the national level and also among the minority communities, due to the decline in LFPR among the lower age groups (children) as well as the decline in the LFPR among the elderly, especially in the urban areas.
23 The main reason for fall in the LFPR among children is that a majority of these children are enjoying the privilege of schooling and formal education. The decline in child labour force participation rate is more pronounced in the rural areas, but among the minority communities, the Sikh community reports an increase in the child LFPR in the urban areas. Distribution of Tertiary Sector per cent of the total male labour force is engaged in the tertiary sector of trade, hotels and restaurants. Public administration, education, health and others engage per cent of the male labour force in India. The Sikh and Christian males in the tertiary sector are mainly occupied in trade, hotels and restaurants. Both these communities also show new entries to this field for the period from to Buddhists form the major work seekers in transport, storage and communication. The proportion of males entering public administration, education and health has declined, especially among the Christian males (from per cent to per cent). Two thirds of the total tertiary sector female labour force is engaged in public administration, education, health and others, but this proportion has declined over the period. Urban Christians & Sikhs A major proportion of urban Christians in the richest strata are regularly employed, and Christian women of the elite strata are more regularly employed (44.73 per cent) than the males (41.93 per cent) of the group. Further, the proportion of casual labourers is very low among this group, while 31 per cent of them are self-employed per cent of the poor Sikh females work as casual labourers in the urban areas, the next strata (25.65 per cent) seems to seek some sort of selfemployment, while the richest strata (53.64 per cent) outshine their male counterparts (38.08) by getting into regular employment. Distribution of Primary Sector in Rural Areas by MPCE Quintile The poorest of Christians and Sikhs show a withdrawal from the primary sector over the years, while there is a major increase is visible among affluent of these communities who are seen entering the primary sector. The Buddhist community, which engages a major share of its population in the primary sector, maintains the same trend over the period. MAIN HIGHLIGHTS OF THE REPORT
24 DEMOGRAPHY Number & Percentage Share The 4 minorities (Christians, Sikhs, Buddhists and Parsis (Zoroastrians) constitute 5 per cent of the total population of India; together their total population is million). Of this, Christians are 2.3 per cent of the population, Sikhs are 1.9 per cent, Buddhists are 8 per cent and the Parsis are just per cent. Though the proportion of Parsis is negligible, they are one of the most developed communities in India. Among these 4 minorities, males constitute per cent and females per cent. A major proportion 68 per cent of the four minority communities lives in rural areas. Among the 4 minorities, Christians constitute per cent, Sikhs per cent, Buddhists 15.5 per cent and Parsis 14 per cent. Distribution of Population The minority populations are concentrated in a few states: - 25 per cent of the Christian community is in Kerala, and 16 per cent is in Tamil Nadu per cent of the Sikhs are found in Punjab and 6 per cent in Haryana per cent of the Buddhist population is located in Maharashtra and 6 per cent in Karnataka per cent of the Parsis are in Maharashtra and 17 per cent are in Gujarat. States with Significant share of Minority Population The minorities are so concentrated in some states that they come close to becoming a majority. In the northeastern states, Christians account for as much as 90 per cent in Nagaland, 87 per cent in Mizoram and 70 per cent in Meghalaya. Sikhs constitute 60 per cent of the population in Punjab.
25 The Buddhists in Sikkim constitute 28 per cent of the population. Rate of Urbanization The rate of urbanization for the four minority communities is 32 per cent. Parsis are the most urbanized community with per cent of them inhabiting urban areas, while Sikhs are the least urbanized with only per cent in urban areas. Households & Household Size Of the total households in India, per cent are rural. Of the total households in India, Christians account for 2.6 per cent, Sikhs are 1.77 per cent, and Buddhists are 0.83 per cent. Statistics on Parsis households is not available. Sikhs have the highest average household size of 5.6, which is greater than the average household size for India (5.3). Christians have the lowest average household size of 4.8. Household Head Of the minorities, Christians have the highest proportion of female-headed households, greater than the national average, and Sikhs have the least at 9.3 per cent. For all the communities, the proportion of female-headed households is higher in the urban areas. Marital Status The highest proportion of Christians is in the never married category i.e per cent, followed by Buddhists with per cent, and Sikhs with per cent. Age at Marriage In India, per cent of married females are married off below the legal age of marriage, especially in the rural areas. Early marriages are found to be highest among Buddhist females (41.04 per cent) and lowest among Christians (16.46 per cent), followed by Sikhs (17.02 per cent). Sex-Ratio
26 There is a wide variation in sex ratio among the minorities i.e among Parsis, 1009 among Christians, 953 among Buddhists and the lowest at 893 among Sikhs, compared to the national figure of 955. Child Sex-Ratio The child sex-ratio is low for all the four minority communities. The very low sex-ratio among the 0-4 age group of the Sikh community seems to be alarming, with a huge deficit of 220 female children per thousand male children. Except for the Christian community, the child sex-ratio is lower in the urban areas, particularly for the Sikhs, indicating a high level of sex determination and female foeticide being practiced especially among the Sikhs in the urban areas. Literacy Rate The minority communities have a literacy rate higher than the average literacy rate for India at 64.8 per cent, though females, especially in the rural areas, have a lower literacy rate than their male counterparts. Parsis have a very high literacy rate of 97.9 per cent, followed by Christians with 80.3 per cent, Buddhists with 72.7 per cent and Sikhs with 69.4 per cent. The female literacy rate is relatively high among the Christian community with 76.2 per cent, and lowest among Buddhists i.e 61.7 per cent. The male-female literacy gap is the highest among Buddhists and the lowest among the Parsis. Number of Literates per Household Across the country, 14.4 per cent of the households have no literate members. This proportion of households is lower among the minority communities, at less than 10 per cent. It is lowest among the Christians (7.1 per cent) followed by Sikhs (9.2 per cent) and Buddhists (9.1 per cent). Across all communities, households with illiterate members are higher in rural areas than in urban areas. This is also true for the minority communities. Work Participation Rate The WPR for the nation is 39.1 per cent; per cent for females and per cent for males.. The WPR among Buddhist females is very high at 32 per cent, making the overall WPR for the community highest among the NMCs.
27 The male-female gap in the WPR is high among Sikhs i.e , and even wider in urban areas i.e per cent. Only 9.96 per cent of females from Sikh community in the urban areas are economically active. The low level of sex-ratios, low level of WPR, and low level of literacy among Sikh females all indicate gender discrimination, which requires urgent attention by policy makers. EDUCATIONAL ATTAINMENT Age-wise literacy rates The literacy rate for the four minority communities is invariably higher than the national average. Age-wise Female Literacy Rate The female literacy rate is lower than the male literacy rate, and is lower than the total literacy levels for all age-groups. Buddhist females record the maximum literacy for children and adolescents, whereas Christian females record maximum literacy among subsequent age groups. Literacy Rate among Different Social Groups The NMCs report a relatively higher literacy rate compared to the all India scenario, except for the general category of Buddhists. Irrespective of social category, the Buddhists have very little variation in the literacy rates. Among the Sikhs, the SCs and OBCs have the lowest literacy rate compared to all other social categories across the NMCs. The Christians have better literacy rates compared to Sikhs and Buddhists, but among the Christian community, the Scheduled Tribes have a lower literacy rate Percentage Change in the Literacy Rate A decline in the literacy rate is observed over to in the case of the Other Backward Classes of Christians and Sikhs, and also among the General category of Buddhists. Education Level among Notified Minorities Christians have the highest proportion of population with a higher level of education (10.89 per cent), and the Buddhists have the lowest proportion of higher educated population (6.04 per cent). Education Levels of Females
28 The national figures show that a lower proportion of females pursue higher levels of education and the minority communities also exhibit the same pattern, with higher levels of elementary education and lower levels of higher education among females in the rural areas. The Christian community has the highest proportion of higher educated females (10.47 per cent) and the Buddhist community has the lowest proportion (3.94 per cent). Graduates and Above Of the total literate population of India, 6.72 per cent is educated to the graduate and above level. The male-female gap in the proportion of graduates is in favour of males, except for the Sikh women in the urban areas. Among the urban Sikh community, females with graduation and above are in a higher proportion than their male counterparts. The proportion of total female graduates is highest among the Christian community. Currently Enrolled Children (5-14 years) per cent of the children in the age group of 5-14 years are currently enrolled in some school in India, and the enrolment rate of children in the age group 5-14 years among the minority communities is well above the national average. The percentage of currently enrolled children (5-14 years) is lowest among the Sikh community, while the Parsi community has recorded universal enrolment. During the period from and , the proportion of currently enrolled children (5-14 years) among the minority communities is lower than the national average, except for the rural females of the Buddhist community where enrolment is higher. However, the number of enrolled Buddhist children (both male and female) in the urban areas has actually declined, as has the enrolment rate among the urban males of the Sikh community. Currently Enrolled Children (15-29 years) Except for the Parsi community, the enrolment rate for adolescents and youths among the minority communities is higher than the national average, though the enrolment rate for the urban females of this category is higher. For the period and , a mass decline is witnessed in the enrolment rate for the age group years at the national level, and also among the minority communities, except for the Parsi community (particularly the males) and for the males of the Buddhist community, for whom the enrolment rate went up.
29 Never Enrolled Children (5-14 years) The proportion of never enrolled children among the minority communities is far below the national average. The Sikh community has the highest proportion of never enrolled children (8.35 per cent), followed by the Buddhists (6.08 per cent) and Christians (6.3 per cent). Unlike the national pattern, the Buddhist community has a larger proportion of never enrolled males than females, and also a higher proportion of never enrolled children in the urban areas than the rural areas. A decline in children never enrolled is visible for a greater proportion of the males rather than females of the Christian and Sikh communities, and for the females rather than males of the Buddhist community. Never Enrolled Children (15-29 years) The proportion of never enrolled children (15-29 years) among the minority communities is far below the national average. The proportion is higher among the females than the males, and in the rural areas rather than the urban areas. It is highest among the Sikhs (15.98 per cent), followed by the Christians (10.57 per cent) and the Buddhists (7.71 per cent). The proportion of never enrolled children declined over the years, more among the females than the males, and in the rural areas compared to the urban areas, especially among the Christian children. A remarkable decline in the rate (by per cent) is witnessed among the rural Buddhist females during the last five years. Dropout Children (5-14 years) The dropout rate among the minority communities is lower than that at the national level. Except for Christian males, the dropout rate (5-14 years) is higher among the females, and in the rural areas. There is only a minor decline in dropout rate among the minority communities, except for the Buddhist females in the rural areas. Out of School Children (5-14 years) The proportion of out of school children (5-14 years) among the minority communities is lower than the national average. Except for the rural males of the Buddhist community, the percentage of out of school children is higher among the females, and in the rural areas. The proportion of out of school children is the highest among the females of the Sikh community, especially the rural females.
30 During the last five years, a greater decline in the proportion of out of school children is witnessed among the Buddhists, and there is a major decline in out of school Buddhist females, especially in the rural areas. HEALTH AND NUTRITION Nutritional Status of children Among the minorities, the proportion of undernourished children is the highest among the Buddhists i.e per cent in and 39.2 per cent in It is the lowest among the Sikhs i.e per cent in and 22 per cent in For the period to , there is a marginal increase in the proportion of stunted and wasted children at the national level and also among the minorities, except for the Sikh community where it has declined. The comparative overall nutritional status of children reveals the status of Buddhist infants to be the worst. In all the three nutritional indicators - stunting, wasting and underweight children belonging to Buddhist households report higher percentages below the set standards, followed by Christians. Mortality Rates The infant mortality rate, childhood mortality rates, neonatal mortality rate, postneonatal rate, as well as the under-5 child mortality rates at the national level all show a declining trend. However, this is not necessarily the case with all the minority communities. The neonatal mortality rates have fallen for all communities except Buddhists, for whom they have risen, from 39.5/1000 in to 43/1000 live births in The scenario is the same for the child mortality rate, as well as the under-five mortality rates, with Buddhists showing an increase in both rates for the period, from 14.1/1000 to 17.1/1000 in the case of the former, and from 69/1000 to 66.9/ 1000 live births in the latter. Anaemia among Children The proportion of children suffering from anaemia declined from 74.2 per cent in to 69.5 per cent in However, the prevalence of anaemia among children still remains a matter of general concern. Except for the Buddhists, mild anaemia among children increased at the national level and also among the minorities, while moderate anaemia declined. Severe anaemia also declined, except for the Sikhs. A significant improvement is witnessed in the case of Buddhists, where the incidence of severe anaemia declined from 3.5 per cent in to 0.2 per cent in
31 Anaemia among Women Among the minorities also, the incidence of anaemia has shown an increase, except for a marginal decline among the Sikh women from 39.6 per cent in to 39.2 per cent in The Buddhist women who were severely anaemic in (3.1 per cent) seem to have attained a better health status in , with a lower incidence of anaemia (1.9 per cent), which may be considered a good sign of improvement. Prevalence of Anaemia among Men While the incidence of anaemia is more among women than men, the incidence of anaemia is the maximum among the Buddhist men, and the incidence is less among Sikh men (15.9 per cent). Immunization The rate of immunization of children among the minority communities is well above the national rate of immunization. The percentage of children with all vaccinations have declined for all communities, for the period from to The proportion of children who have not received any vaccination is the greatest among the Christians i.e. 9.4 per cent in , and the least among the Buddhists, at 0.7 per cent in Son Preference Among the minority communities, the majority of the Sikh women (18 per cent) want more sons than daughters and only a very low proportion of them (1.4 per cent) want daughters rather than sons. The Buddhist women have a similar view, as 17.2 per cent want more sons than daughters and only 3.6 per cent of them want more daughters than sons. Among Christians, a majority of them being tribal populations, a different picture emerged, with men exhibiting more of a son preference compared to the women, in wanting more sons than daughters. Fertility Rates All the minority communities, except the Buddhists (whose rate of growth is very low), experienced a fall in fertility rates. The rate of fall in fertility rate is the highest among the Sikh community. Contraception The Sikh community (75.6 per cent in and 69 per cent in ) and the Buddhist community (61.8 per cent in and 55.9 per cent in )
32 gather knowledge on family planning methods mainly through television, but dependence on television is less among the Christians. Dependence on newspapers (3.3 per cent in and 34.4 per cent in ) and wall paintings (48 per cent in and 32.3 per cent in ) as a source of awareness on family planning methods is the maximum among the Christians. Dependence on newspapers is comparatively the least among the Buddhists (21.8 per cent in and 29.8 per cent in ). Use of Contraceptives The proportion of currently married women using contraceptives is the highest among the Buddhists (64.7 per cent in and 67.7 per cent in ) followed by Sikhs (65.3 per cent in and 66.5 per cent in ), but contraceptive use among Christian women is less. Among the various methods of contraception used, female sterilization is highest among the Buddhists (54 per cent), while it is the lowest among the Sikhs (31.4 per cent). The use of pills, condoms and IUDs is quite high among the Sikhs, compared to other minorities. Compared to the women of other minority communities, the percentage of women who discussed family planning with others is higher among the Sikh community. 41 per cent of Sikh women discussed family planning with their husbands and 21.3 per cent discussed it with their friends. Maternal Health The Sikh community shows the maximum preference for deliveries in private hospitals. Their proportion is 35.3 per cent in and 42 per cent in Only 46.6 per cent of deliveries in India are attended by a health professional, including 35 per cent by doctors and 10.3 per cent by an ANM/nurse or midwife. The Buddhist community shows the maximum proportion of deliveries being attended by friends or relatives who are non-health professionals (18.8 per cent). Yet, more, than half of their deliveries are attended by doctors per cent of Sikh deliveries are attended by Dais. This position is high compared to other minorities. Compared to the national average of 46.6 per cent, the proportion of deliveries assisted by skilled health care professionals is high among all the minority communities. Teenage Pregnancies
33 Among the minority communities, the level of teenage pregnancy and motherhood is high among the Buddhists, i.e. 7.6 per cent of the teenagers have had a live birth, 3 per cent are pregnant with their first child and 10.6 per cent have begun child bearing. LAND AND POVERTY per cent of the total population of India is landless. Among the minority communities, the Christian community is the least landless (54.81 per cent), who also have the highest percentage of population with below marginal (20.51 per cent) and marginal operational holdings (14.30 per cent). The proportion of medium (8.72 per cent) and large farmers (7.13 per cent) is the maximum among the Sikh community. Trends in Operational Landholdings Among the minority communities, the proportion of landless among the Christians declined sharply from per cent in to per cent in The Sikhs and the Buddhists exhibited fluctuating trends. The proportion of landless among the Sikhs declined from per cent in to per cent in and then increased to per cent in Among the Buddhists, the proportion of landless declined from per cent in to per cent in , and then increased to per cent in The proportion of minority communities holding marginal operational land also declined over the years for all the three communities, and especially for the Sikhs and the Buddhists. There was a notable increase in their proportion smallholdings during the second duration ( to ), especially among the Christian community (increased from 0.48 per cent to per cent in ). The proportion of medium and small farmers showed a significant increase, particularly among the Buddhists (medium farmers) (increased from 0.01 per cent to 8.62 per cent), and also among the Sikhs (small farmers) (increased from 0.15 per cent 8.72 per cent) per cent of the rural Sikhs are the only notable proportion of large farmers among the minority communities. Poverty 19.8 per cent of the total population of India lives below the poverty line, and the minority communities have a greater incidence of urban poverty than rural poverty.
34 The Buddhist community is the poorest of the minority communities, having a poverty level (29.86 per cent) greater than the national average (19.80 per cent). Trends in Poverty ( to ) The poverty rate in India generally showed a declining trend, especially in the case of the Christian and Buddhist communities, showing a decline from per cent to per cent, and from per cent to per cent respectively. A similar trend was seen for both urban and rural areas. The poverty ratio for the Sikh community remained constant at around 6 per cent. Literacy by MPCE quintiles Among the lowest strata of the minorities, the literacy rate is the lowest among the Sikhs (44.09 per cent) and the highest among the Buddhists (61.79 per cent). Among the richer sections of the minorities also the Sikh community has a lower literacy rate of per cent, while the Parsi with per cent are the highest. For the lowest strata, upto secondary level of education is lowest among the Sikhs (42.60 per cent), and high among the Buddhists (56.42 per cent). Among the richest sections of the minorities, the Buddhist community (54.24 per cent) has the lowest proportion while the Christian community has the highest. The above secondary level of education for all the strata (only exception being the urban rich) is very low among the Sikh community, and is also far below the national average for all the strata. Above secondary education among all strata of the minorities is highest among the Parsi community, followed by the Buddhist community. Employment by MPCE quintiles The proportion of self-employed workers increases as we move from the poorest to the richest. Among the lowest strata of the minority communities, the Christian community (48.28 per cent) has largest proportion of self-employed workers, and Buddhists (16.02 per cent) are the least self-employed. Among the rich, self-employment is high among the Sikhs (75.74 per cent) and least among the Parsis (44.09 per cent). Except for the Sikhs, there is an increase in the proportion of regularly employment. In the rural areas, a major proportion of regularly employed persons among all strata are from the Christian community. The proportion of self-employed, regularly employed and casual workers among the rich rural Buddhists showed a decline, but the proportion of regularly employed and casual workers among the poor rural Buddhists increased. Further, per cent of the richer rural Buddhists are regular workers; where as the proportion of regular workers among the poorest is only 6.96 per cent.
35 EMPLOYMENT AND UNEMPLOYMENT Labour Force Participation Rates Rural areas have a better LFPR (44.62 per cent) than urban areas (38.25 per cent), and the LFPR among the minorities has increased among both the males and females of rural and urban areas. The Buddhist community has the highest LFPR (48.85 per cent) and the Parsi community has the lowest LFPR (44.56%). The LFPR is highest among Parsi males (60.04 per cent), and Sikh females have the lowest (32.74 per cent), while Buddhist women showed the maximum LFPR of per cent. Work Participation Rates The proportion of workers increased over the period from to , and is higher in the rural areas, except for the Sikhs. The Buddhists community have the highest WPR among the minorities (47.22 per cent). Among the males, the Sikh men (55.14 per cent) have the highest work participation rate, especially the urban men (55.55 per cent.) Buddhist women (40.53 per cent) showed a high WPR among the females, especially the rural women (50.54 per cent). In urban areas, Sikh women have the lowest WPR (15.30 per cent), while it is highest among Parsi women (33.82 per cent). Unemployment The unemployment rate is higher in urban India (5.21 per cent) than in rural India (1.80 per cent). The rate declined for the period to and then rose in Among the minority communities the Christian community has the highest unemployment rate of 6.32 per cent. The Sikh community has the lowest unemployment rate among the males (1.62 per cent) and a relatively high unemployment rate among females (7.05 per cent). The unemployment rate is highest among Christian males (4.70%) and females (5.79 per cent and per cent in urban and rural areas respectively.) There was a major increase in the unemployment rate among Christian women from 8.10 per cent to per cent, and among Sikh women from 5.08 per cent to 9 per cent. Employment Status
36 The proportion of self-employed persons is relatively higher than other categories, especially for the Sikhs (63.65 per cent) and Christians (53.60 per cent) per cent of the workers among Parsis are regularly employed and per cent among the Buddhists are casual workers. Among the minorities, the proportion of self employed and casual workers (males as well as females) are higher in rural areas, while the proportion of them regularly employed is greater in the urban areas. There is a drastic fall from per cent to per cent in the percentage of Sikh female self-employed workers, while the proportion of regularly employed Sikh females increased from 5.92 per cent to per cent. Industrial Distribution of Workers The majority of all workers in rural areas, among Buddhists (63.73 per cent), Sikhs (64.03 per cent) and Christians (53.34 per cent) are engaged in the primary sector. A major part of the workforce among the Parsis (76.03 per cent) is involved in the tertiary sector, especially in the urban areas. Occupational Distribution The majority of the population in India, except the Parsis, work as farmers, fishermen, hunters, loggers and other related works which are mainly primary in nature. The Parsi community is more involved in tertiary activities like administrative, executive and managerial occupations, services and sales, professional and technical occupations, especially in urban areas. However, the proportion of workers engaged in primary activities has declined over the years, while there was a significant improvement in the share of workers engaged in production related works. Rural areas in India have more proportion in primary occupations (72.48 per cent). Urban areas engage per cent of workers in production and related workers and more than half of the workers in service sector. In the rural areas, the majority of the workers in primary activities are from the Buddhist community (82.13 per cent), while the Christian community forms the major proportion of workers in production-related works and other services. Age-Wise Labour Force Participation Rate Labour force participation rate has declined at the national level and also among the minority communities, due to the decline in LFPR among the lower age groups (children) as well as the decline in the LFPR among the elderly, especially in the urban areas.
37 The main reason for fall in the LFPR among children is that a majority of these children are enjoying the privilege of schooling and formal education. The decline in child labour force participation rate is more pronounced in the rural areas, but among the minority communities, the Sikh community reports an increase in the child LFPR in the urban areas. Distribution of Tertiary Sector per cent of the total male labour force is engaged in the tertiary sector of trade, hotels and restaurants. Public administration, education, health and others engage per cent of the male labour force in India. The Sikh and Christian males in the tertiary sector are mainly occupied in trade, hotels and restaurants. Both these communities also show new entries to this field for the period from to Buddhists form the major work seekers in transport, storage and communication. The proportion of males entering public administration, education and health has declined, especially among the Christian males (from per cent to per cent). Two thirds of the total tertiary sector female labour force is engaged in public administration, education, health and others, but this proportion has declined over the period. Urban Christians & Sikhs A major proportion of urban Christians in the richest strata are regularly employed, and Christian women of the elite strata are more regularly employed (44.73 per cent) than the males (41.93 per cent) of the group. Further, the proportion of casual labourers is very low among this group, while 31 per cent of them are self-employed per cent of the poor Sikh females work as casual labourers in the urban areas, the next strata (25.65 per cent) seems to seek some sort of selfemployment, while the richest strata (53.64 per cent) outshine their male counterparts (38.08) by getting into regular employment. Distribution of Primary Sector in Rural Areas by MPCE Quintile The poorest of Christians and Sikhs show a withdrawal from the primary sector over the years, while there is a major increase is visible among affluent of these communities who are seen entering the primary sector. The Buddhist community, which engages a major share of its population in the primary sector, maintains the same trend over the period.
38 Chapter - I INTRODUCTION Five religious communities have been notified as minority communities under Section 2(c) of the National Commission for Minorities Act, These are: Muslims, Sikhs, Christians, Buddhists and Zoroastrians (Parsis). A comprehensive account of the social, economic and educational status of the Muslim community in India has been provided in the Sachar Committee Report (GOI, 2006). The mandate of the present report is to focus on the socio-economic status of the other four minorities, excluding the Muslims, that is, the Sikhs, Christians, Buddhists (including Neo Buddhists) and Zoroastrians (Parsis). The report analyzes secondary sources of data such as the Census and NSS, in addition to information from the National Family Health Survey (NFHS) at the all-india level, to provide a profile of the educational, social and economic status of these four minority communities. 1. CHAPTER STRUCTURE After this introduction, which also provides the geographical spread of the four notified minorities presented in maps, the chapters in the report cover the general demographic profile in the second chapter. The third chapter covers the educational status and attainment levels of the notified minorities, while their health and nutritional status is dealt with in the fourth chapter. Land operation and poverty among the NMCs and changes over time are discussed in the fifth chapter. The educational attainment and employment status across MPCE quintiles as a proxy for socio-economic class categories is provided in this and the following chapter. A detailed analysis of the employment and unemployment profile of the four minority communities is undertaken in the Sixth Chapter. The rural-urban scenario with respect to the status of employment among the Christians, Sikhs and Buddhists is provided, and differences in the profile of labour market participation among the women and men are also highlighted, with changes over time being discussed as well. 2. Data Sources and Limitations
39 The Census of India 2001 for the first time provided relatively detailed tables on religion- based statistics. Until the 1991 Census, only the proportion of the population in the different communities was published. All other data was available only with the Registrar General s Office. Some specific Muslim-related statistics were generated for the Sachar Committee Report in response to a special request. The current report has limited the analysis to 2001 data from the Census, as was available. The Zoroastrian/Parsi community has been clubbed with the other religious communities, in the Census data, and very little information is available separately on the community from the Census due to this. All Census-based tables hence are limited to the three notified minority communities (NMCs), that is, Christians, Sikhs and Buddhists. The Registrar General s Census data is used for a range of demographic variables such as proportion of NMC population, urbanization rates, household size and head of the household, marital status, age at marriage, sex ratios, literacy rates, work participation rates and so on. The NMCs have been compared among themselves as well as in relation to the all-india scenario in most cases. Ideally, an exercise that uses all the notified minorities including Muslims should have been undertaken, in comparison to the rest of the population excluding these minorities, for a clearer comparative picture of the minorities as opposed. The National Sample Survey (NSS) constitutes the other significant secondary data source on which this report is based. This data source provides information on all the four notified minorities, although the sample for the Parsis is relatively very small 1. The use of unit level data from the NSS allows analysis from social groups such as the Scheduled Castes, Scheduled Tribes, Other Backward Classes and Others. It has also been used to generate information across the five consumption expenditure-based quintiles. The monthly per capita consumption expenditure is the best proxy available for class-based analysis in the country. Quintile 1 is the lowest and constitutes the poorest segment of the households, while the topmost quintile, Q5 refers to the relatively better off sections of the population. These factors aid in assessing whether behaviour or achievements among different communities vary across the socio-economic indicators, and thereby help in identifying in what ways and in which dimensions any given community is affected. 1 The smaller the sample for any category, the more difficult it is to generate information on indicators pertaining to that component. At times, the data generated based on small samples can be unreliable as well. The rural sample size of Parsis is very small and therefore cannot be considered reliable.
40 The NSS data has also been used for employment-unemployment, poverty and landownership analysis. The employment status of different communities in terms of selfemployment, regular and casual employment as well as their industrial and occupational profiles are also discussed. This provides a clear indication of the nature of labour market participation of men and women belonging to the different NMCs in rural and urban locations. Poverty calculations that estimate the proportion of population below a poverty line defined as per the Planning Commission estimations are provided here. In addition, the extent of land operational holdings among the NMCs is estimated to reflect on the changes therein over time. Amidst overall growth in landlessness, there is a tendency of increasing operational holdings, especially among the larger land operating households. The other useful source which also provides information along religious communities is the NFHS data. The all-india profile of the health status and performance on different indicators from the NFHS-3 has been taken. Wherever comparable indicators were available from the earlier rounds of the NFHS, these have also been analyzed to show the trends and changes over time. An entire range of health and nutrition indicators are analyzed from this source of information across the three NMCs (since Parsis are not included in this source). 3. SHARE OF NOTIFIED MINORITY COMMUNITIES The share of the notified minorities that are included in this study is quite minuscule in the entire population, close to 5 per cent. However, given the population of the country as a whole, this amounts to million persons, of which 24 million are Christians, 19 million are Sikhs and close to 8 million are Buddhists as per the 2001 Census. Over time, the proportion of the NMCs in the total population has been relatively stagnant for most communities, if not declining, except for the Christians who have experienced a marginal increase in the growth rate over the last two decades, that is, to The share of the population even of the Christians however, remains at 2.3 per cent of the entire population, while the Sikhs and Buddhists constitute 1.9 per cent and 0.8 per cent respectively (see Table 1.1). Table 1.1: Share and Growth Rate of Three NMCs Over Last Two Decades Community Share of Population Growth Rate NMCs
41 Christians Sikhs Buddhists Note and Source: Adjusted Census 2001 figures; 4. GEOGRAPHICAL PROFILE Where are all the NMCs located and concentrated across the states and districts of India? Table 1.2 reveals the state-wise NMC concentration by proportion of population. Table 1.2: Statewise Percentage of Minority Population in India, 2001 State Christian Sikhs Buddhists Parsis* JAMMU & KASHMIR HIMACHAL PRADESH PUNJAB CHANDIGARH UTTARANCHAL HARYANA DELHI RAJASTHAN UTTAR PRADESH BIHAR SIKKIM ARUNACHAL PRADESH NAGALAND MANIPUR MIZORAM TRIPURA MEGHALAYA ASSAM WEST BENGAL JHARKHAND ORISSA CHHATTISGARH MADHYA PRADESH GUJARAT DAMAN & DIU DADRA & NAGAR HAVELI MAHARASHTRA ANDHRA PRADESH KARNATAKA GOA LAKSHADWEEP KERALA TAMIL NADU PONDICHERRY ANDAMAN & NICOBAR ISLANDS * Total number of persons from Parsi community. The maps show a concentration of the different minorities across districts, as per the 2001 Census. State-level shares of Christian, Sikh and Buddhist population are shown in
42 separate maps, along with the actual numbers of persons among the Parsi/Zoroastrian population. Table 1.3 shows the distribution of the notified minority communities in the districts of India, highlighting the few numbers of districts with significant proportions of each of the NMCs. For instance, there are only 33 districts with more than 40 per cent concentration of Christians within the population of the respective districts, while there are only 14 and 6 districts for Sikhs and Buddhists respectively, with similar levels of concentration (above 40 per cent). A large majority of the districts have less than 1 per cent of NMC population. Table 1.3: Distribution of Districts by NMC Concentration Levels Percentage Range Sikhs Buddhists Christians > < Total Source: Calculated from the Census of India, CHRISTIANS The Christians are located in the northeastern states of Nagaland (90 per cent), Mizoram (87 per cent), Meghalaya (70 per cent), Manipur (34 per cent); and the states of Goa (27 per cent), Andaman and Nicobar Islands (22 per cent), Kerala (19 per cent) and Arunachal Pradesh (19 per cent). A list of the districts with higher concentration of Christian population is provided in Appendix Table 1.1, which is also reflected in the Map 1.1. The number of districts by the range of concentration levels as per the percentage share of Christians in the total population of the district is given in Appendix Table 1.4. Map 1.4 shows the state-wise distribution of Christians in the country. 6. SIKHS The Sikh population is concentrated in Punjab (60 per cent), Chandigarh (16 per cent), Haryana (6 per cent) and Delhi (4 per cent). A list of the districts with higher concentrations of Sikh population is provided in Appendix Table 1.2, and is also reflected in the Map 1.2. The number of districts by the range of concentration levels in terms of the percentage share of Sikhs in the total population of the district is given in Appendix Table 1.5. Map 1.5 shows the state-wise distribution of Sikhs in the country. 7. BUDDHISTS
43 The bulk of the Buddhist population of the entire country (73 per cent) is concentrated in the state of Maharashtra. However, their share in the population within the state is only 6 per cent. Across the country, Sikkim with 28 per cent, Arunachal Pradesh with 13 per cent and Mizoram with 8 per cent report higher proportions of Buddhists in the respective states. A list of the districts with higher concentrations of Buddhist population is provided in Appendix Table 1.3, which is also reflected in the Map 1.3. The number of districts by the range of concentration levels as per the percentage share of Buddhists in the total population of the district is given in Appendix Table 1.6. Map 1.6 shows the state-wise distribution of Buddhists in the country. 8. PARSIS/ZOROASTRIANS The Parsi community is dwindling over the years, with only 69,601 persons recorded as per the 2001 Census. The states in which the community is located are Maharashtra and Gujarat, which is clearly visible in Map 1.7.
44 Map 1.1
45 Map 1.2
46 Map 1.3

47 Map 1.4
48 Map 1.5
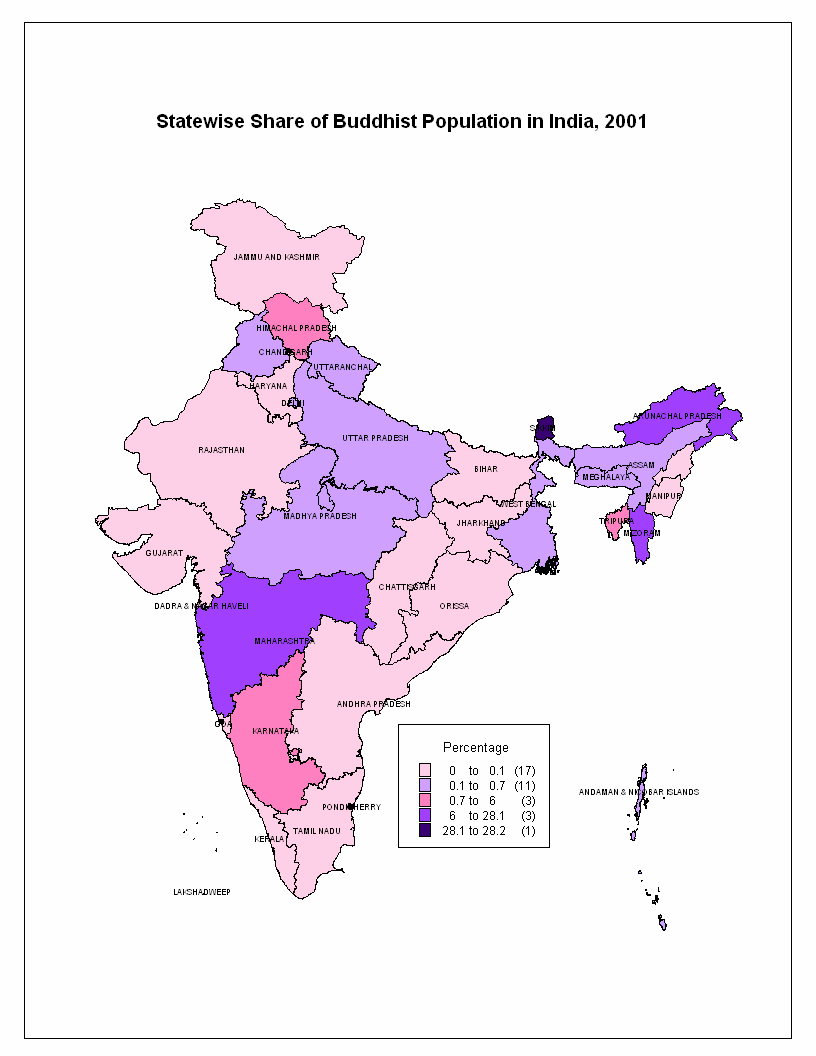
49 Map 1.6

50 Map 1.7
Press Note on Poverty Estimates, 2009-10
 Press Note on Poverty Estimates, 2009-10 Government of India Planning Commission March 2012 GOVERNMENT OF INDIA PRESS INFORMATION BUREAU ***** POVERTY ESTIMATES FOR 2009-10 New Delhi, 19 th March, 2012
Distribution of Population by Religions
 Drop-in-Article on Census - No.4 Distribution of Population by Religions Religious profile of the populace is an important socio-cultural and demographic feature noticeable from the first Census in 1872
ESTIMATES OF MORTALITY INDICATORS
 CHAPTER 4 ESTIMATES OF MORTALITY INDICATORS Mortality is one of the basic components of population change and related data is essential for demographic studies and public health administration. It is the
Tamil Nadu DATA HIGHLIGHTS : THE SCHEDULED CASTES Census of India 2001
 Tamil Nadu DATA HIGHLIGHTS : THE SCHEDULED CASTES Census of India 2001 The total population of Tamil Nadu, as per the 2001 Census is 62,405,679. Of this, 11,857,504 (19 per cent) are Scheduled Castes (SCs).
SOCIAL BACKGROUND OF OFFICERS IN THE INDIAN ADMINISTRATIVE SERVICE SANTOSH GOYAL
 SOCIAL BACKGROUND OF OFFICERS IN THE INDIAN ADMINISTRATIVE SERVICE SANTOSH GOYAL The Indian Administrative Service (IAS) is the highest cadre of the civil services in India and is the successor to the
MALAWI YOUTH DATA SHEET 2014
 MALAWI YOUTH DATA SHEET 2014 2 of Every 3 People in Malawi Are Under Age 25 Age 80+ 75-79 70-74 65-69 60-64 55-59 50-54 45-49 40-44 35-39 30-34 25-29 Male Female 20-24 POPULATION 700,000 700,000 0 POPULATION
Summary of Sachar Committee Report
 Summary of Sachar Committee Report Background On March 9, 2005 the Prime Minister issued a Notification for the constitution of a High Level Committee to prepare a report on the social, economic and educational
Chapter 3 LITERACY AND EDUCATION
 Chapter 3 LITERACY AND EDUCATION Coverage Literacy Rates in Post-Independence India Literacy Rates of SC/ST by Sex and Urban-Rural Distribution State-wise Literacy Rates in last 3 decades State-wise Gap
Primary School Net and Gross Attendance Rates, India. Primary School Net Attendance Rate in Urban and Rural Areas, India
 Primary School Net and Gross Attendance Rates, India About one-fourth of school age children in India do not attend primary school on time although of children attend primary school at some time in. of
Maternal & Child Mortality and Total Fertility Rates. Sample Registration System (SRS) Office of Registrar General, India 7th July 2011
 Office of Registrar General, India 7th July 2011") Maternal & Child Mortality and Total Fertility Rates Sample Registration System (SRS) Office of Registrar General, India 7th July 2011 Sample Registration System (SRS) An Introduction Sample Registration
Maternal & Child Mortality and Total Fertility Rates Sample Registration System (SRS) Office of Registrar General, India 7th July 2011 Sample Registration System (SRS) An Introduction Sample Registration
Malawi Population Data Sheet
 Malawi Population Data Sheet 2012 Malawi s Population Is Growing Rapidly Malawi Population (Millions) 26.1 19.1 13.1 9.9 8.0 4.0 5.5 1966 1977 1987 1998 2008 2020 2030 Malawi s population is growing rapidly,
Youth development in India: does poverty matter?
 DOI 10.1186/s40064-015-1410-z RESEARCH Open Access Youth development in India: does poverty matter? Bijaya Kumar Malik * Abstract This paper explores the differentials in youth development patterns determined
GENDERED VULNERABILITY
 GENDERED VULNERABILITY AN ACCOUNT OF FEMALE HEADED HOUSEHOLDS IN INDIA Achala Gupta St. John s College, University of Cambridge, United Kingdom Nandan Kumar International Institute for Population Sciences,
Internal Migration and Regional Disparities in India
 Internal Migration and Regional Disparities in India Introduction Internal migration is now recognized as an important factor in influencing social and economic development, especially in developing countries.
INDICATOR REGION WORLD
 SUB-SAHARAN AFRICA INDICATOR REGION WORLD Demographic indicators Total population (2006) 748,886,000 6,577,236,000 Population under 18 (2006) 376,047,000 2,212,024,000 Population under 5 (2006) 125,254,000
India Human Development Report 2011: Towards Social Inclusion
 i India Human Development Report 2011: Towards Social Inclusion I n s t i t u t e o f A p p l i e d M a n p o w e r R e s e a r c h, P l a n n i n g C o m m i s s i o n, G o v e r n m e n t o f I n d i
CORRELATIONAL ANALYSIS BETWEEN TEENAGE PREGNANCY AND MATERNAL MORTALITY IN MALAWI
 CORRELATIONAL ANALYSIS BETWEEN TEENAGE PREGNANCY AND MATERNAL MORTALITY IN MALAWI Abiba Longwe-Ngwira and Nissily Mushani African Institute for Development Policy (AFIDEP) P.O. Box 31024, Lilongwe 3 Malawi
Employment and Poverty in Jharkhand and India Dr. Balwant Singh Mehta Dr. Bharat Singh Abstract
 International Journal of Humanities & Social Science Studies (IJHSSS) A Peer-Reviewed Bi-monthly Bi-lingual Research Journal ISSN: 2349-6959 (Online), ISSN: 2349-6711 (Print) Volume-II, Issue-V, March
INDICATOR REGION WORLD
 SUB-SAHARAN AFRICA INDICATOR REGION WORLD Demographic indicators Total population (2005) 713,457,000 6,449,371,000 Population under 18 (2005) 361,301,000 2,183,143,000 Population under 5 (2005) 119,555,000
CHAPTER I INTRODUCTION. Here in the Philippines, we believe in the saying of our national hero Dr.
 1 CHAPTER I INTRODUCTION Background of the Study Here in the Philippines, we believe in the saying of our national hero Dr. Jose P. Rizal that Youth is the hope of our Mother land. In their hand lies the
Press Note on Poverty Estimates, 2011-12
 Press Note on Poverty Estimates, 2011-12 Government of India Planning Commission July 2013 GOVERNMENT OF INDIA PRESS INFORMATION BUREAU ***** POVERTY ESTIMATES FOR 2011-12 New Delhi: 22 July, 2013 The
Levels, trends and patterns of age difference among the couples in India
 Levels, trends and patterns of age difference among the couples in India Key words: Age, difference, husband, wife, couple, India. Abstract: Age of the couples is one of the most basic and important information
117 4,904,773 -67-4.7 -5.5 -3.9. making progress
 Per 1 LB Eastern Mediterranean Region Maternal and Perinatal Health Profile Department of Maternal, Newborn, Child and Adolescent Health (MCA/WHO) Demographics and Information System Health status indicators
Over-Age, Under-Age, and On-Time Students in Primary School, Tanzania
 Primary School Net and Gross Attendance Rates, Tanzania More than three quarters of primary school age children in Tanzania attend school and gender parity in attendance has been achieved. 1 of children
68 3,676,893 86.7 -49-2.9 -3.2 -2.5. making progress
 Per 1 LB African Region Maternal and Perinatal Health Profile Department of Maternal, Newborn, Child and Adolescent Health (MCA/WHO) Demographics and Information System Health status indicators Maternal
Primary School Net and Gross Attendance Rates, Kenya. Over-Age, Under-Age, and On-Time Students in Primary School, Kenya
 Primary School Net and Gross Attendance Rates, Kenya Nearly of primary school age children in Kenya attend school with slightly more females than males attending. of children ages - attend primary school.
Women, work, and employment outcomes in rural India
 Women, work, and employment outcomes in rural India Nisha Srivastava University of Allahabad, India Ravi Srivastava Jawaharlal Nehru University, India Paper presented at the FAO-IFAD-ILO Workshop on Gaps,
30% Opening Prayer. Introduction. About 85% of women give birth at home with untrained attendants; the number is much higher in rural areas.
 This is the second of four studies on maternal health M AT E R N A L a n d C H I L D H E A LT H : A f g h a n i s t a n b y K a r e n B o k m a About 85% of women give birth at home with untrained attendants;
Statement by Dr. Sugiri Syarief, MPA
 Check against delivery_ Commission on Population and Development 45th Session Economic and Social Council Statement by Dr. Sugiri Syarief, MPA Chairperson of the National Population and Family Planning
150 7,114,974 75.8 -53-3.2 -3.6 -2.9. making progress
 Per 1 LB African Region Maternal and Perinatal Health Profile Department of Maternal, Newborn, Child and Adolescent Health (MCA/WHO) Demographics and Information System Health status indicators - Maternal
Goal 1: Eradicate extreme poverty and hunger. 1. Proportion of population below $1 (PPP) per day a
 per day a") Annex II Revised Millennium Development Goal monitoring framework, including new targets and indicators, as recommended by the Inter-Agency and Expert Group on Millennium Development Goal Indicators At
Annex II Revised Millennium Development Goal monitoring framework, including new targets and indicators, as recommended by the Inter-Agency and Expert Group on Millennium Development Goal Indicators At
HEALTH TRANSITION AND ECONOMIC GROWTH IN SRI LANKA LESSONS OF THE PAST AND EMERGING ISSUES
 HEALTH TRANSITION AND ECONOMIC GROWTH IN SRI LANKA LESSONS OF THE PAST AND EMERGING ISSUES Dr. Godfrey Gunatilleke, Sri Lanka How the Presentation is Organized An Overview of the Health Transition in Sri
Measuring Women Status And Gender Statistics in Cambodia Through the Surveys and Census
 Global Forum on Gender Statistics 27 29 March 2012, Dead Sea, Jordan Measuring Women Status And Gender Statistics in Cambodia Through the Surveys and Census By Mrs. Hang Lina, Deputy Director General National
Population, Health, and Human Well-Being-- Benin
 Population, Health, and Human Well-Being-- Benin Demographic and Health Indicators Benin Sub- Saharan Africa World Total Population (in thousands of people) 1950 2,046 176,775 2,519,495 2002 6,629 683,782
Over-Age, Under-Age, and On-Time Students in Primary School, Uganda
 Primary School Net and Gross Attendance Rates, Uganda More than three quarters of primary school age children in Uganda attend school and gender parity in attendance has been achieved. of children ages
Awareness among Family Members of Children with Intellectual Disability on Relevant Legislations in India
 92 BRIEF REPORTS Awareness among Family Members of Children with Intellectual Disability on Relevant Legislations in India Bala Baskar Kuppusamy 1*, Jayanthi Narayan N. 2, Deepa Nair N. 3 1. Lecturer and
The Training Needs of Older Workers
 The Training Needs of Older Workers Katrina Ball, Josie Misko and Andrew Smith National Centre for Vocational Education Research ABSTRACT The nature of work has been the subject of significant change in
Trends in part-time and temporary work
 Trends in part-time and temporary work This analysis has been carried out using the latest available quarterly data from the Labour Force Survey. This was used to examine trends in temporary and part-time
SRI LANKA SRI LANKA 187
 SRI LANKA 187 List of Country Indicators Selected Demographic Indicators Selected demographic indicators Child Mortality and Nutritional Status Neonatal, infant and under-five mortality rates: trends Distribution
Are Lifestyle Diseases a Matter of Concern for Elderly Women: A Study of Older Old and Oldest Old Population of India
 Are Lifestyle Diseases a Matter of Concern for Elderly Women: A Study of Older Old and Oldest Old Population of India Abstract: The elderly women are more vulnerable in India due to the patriarchal nature
GROWTH, DEVELOPMENT AND POVERTY IN INDIA AND NEPAL
 GROWTH, DEVELOPMENT AND POVERTY IN INDIA AND NEPAL BY DR. P. ABDUL KAREEM SENIOR LECTURER DEPARTMENT OF ECONOMICS, UNIVERSITY OF CALICUT, KERALA, INDIA 680 618 2 ABSTRACT Economic growth and development
Gender Country Profile
 Gender Country Profile Maldives By Erin MacDonald and Rosanne Wong Edited by Dania Sheldon Contents General... 1 Health... 2 Education... 2 Economic Activity... 3 Decision-Making... 3 Human Rights... 3
Parental Occupation Coding
 Parental Occupation Coding A report submitted to the Performance Measurement and Reporting Taskforce of the Ministerial Council on Education, Employment Training and Youth Affairs by Dr Roger Jones Quantitative
Gender inequalities in South African society
 Volume One - Number Six - August 2001 Gender inequalities in South African society South Africa's national policy framework for women's empowerment and gender equality, which was drafted by the national
Eligibility for Scholarship: If a candidate is selected, the scholarship shall be paid for pursuing studies in India only.
 National Talent Search Examination National Council of Educational Research and Training Sri Aurobindo Marg, New Delhi 110016 (ONLY FOR THE INDIAN NATIONAL STUDENTS STUDYING ABROAD IN CLASS X) THE NATIONAL
Demographic Analysis of the Salt River Pima-Maricopa Indian Community Using 2010 Census and 2010 American Community Survey Estimates
 Demographic Analysis of the Salt River Pima-Maricopa Indian Community Using 2010 Census and 2010 American Community Survey Estimates Completed for: Grants & Contract Office The Salt River Pima-Maricopa
The Puzzling Decline in Rural Women s Labor Force Participation in India: A Reexamination
 GIGA Research Unit: Institute of Asian Studies The Puzzling Decline in Rural Women s Labor Force Participation in India: A Reexamination Daniel Neff, Kunal Sen and Veronika Kling No 196 May 2012 GIGA Working
ESTIMATION OF LIFE EXPECTANCY AT BIRTH
 CHAPTER V ESTIMATION OF LIFE EXPECTANCY AT BIRTH 5.1 Introduction Life expectancy at birth (e 0 0) is one of the most preferred indicators in demographic and health analysis. Life expectancy at birth reflects
Socio-economic and demographic characteristics of alcohol and other substance abusers, undergoing treatment in Sikkim, a north east state of India
 Available online at www.scholarsresearchlibrary.com Archives of Applied Science Research, 2014, 6 (2):106-110 (http://scholarsresearchlibrary.com/archive.html) ISSN 0975-508X CODEN (USA) AASRC9 Socio-economic
(T. C. A. Anant) Chief Statistician and Secretary Ministry of Statistics and Programme Implementation. New Delhi October 2013
 Chief Statistician and Secretary Ministry of Statistics and Programme Implementation. New Delhi October 2013") Women and Men in India 2013 15 th Issue Central Statistics Office National Statistical Organisation Ministry of Statistics and Programme Implementation Government of India Sardar Patel Bhavan, Sansad Marg,
Women and Men in India 2013 15 th Issue Central Statistics Office National Statistical Organisation Ministry of Statistics and Programme Implementation Government of India Sardar Patel Bhavan, Sansad Marg,
SUMMARY- REPORT on CAUSES of DEATH: 2001-03 in INDIA
 SUMMARY- REPORT on CAUSES of DEATH: 2001-03 in INDIA Background: Long-term mortality measurement by cause, gender and geographic area has been the requirement of every country. With this in view, Medical
Summary. Accessibility and utilisation of health services in Ghana 245
 Summary The thesis examines the factors that impact on access and utilisation of health services in Ghana. The utilisation behaviour of residents of a typical urban and a typical rural district are used
ADULT LITERACY AND LIFELONG LEARNING IN INDIA
 Management of Elementary Education EDUCATION FOR ALL MID DECADE ASSESSMENT ADULT LITERACY AND LIFELONG LEARNING IN INDIA Ila Patel NATIONAL UNIVERSITY OF EDUCATIONAL PLANNING AND ADMINISTRATION NEW DELHI
1 The total values reported in the tables and
 1 Recruiting is increasingly social and Adecco wants to know how it works. An international survey, that involved over 17.272 candidates and 1.502 Human Resources managers between March 18 and June 2,
The trend of Vietnamese household size in recent years
 2011 International Conference on Humanities, Society and Culture IPEDR Vol.20 (2011) (2011) IACSIT Press, Singapore The trend of Vietnamese household size in recent years Nguyen, Thanh Binh 1 Free University
2. Incidence, prevalence and duration of breastfeeding
 2. Incidence, prevalence and duration of breastfeeding Key Findings Mothers in the UK are breastfeeding their babies for longer with one in three mothers still breastfeeding at six months in 2010 compared
Sexual and reproductive health challenges facing young people
 Sexual and reproductive health challenges facing young people Shireen J Jejeebhoy, KG Santhya and R Acharya Population Council, New Delhi Lea Hegg Independent consultant, Reproductive Health United Nations
SOCIAL DEVELOPMENT. Social Development is equality of social opportunities - Amartya Sen, 1995
 SOCIAL DEVELOPMENT Social Development is the promotion of a sustainable society that is worthy of human dignity by empowering marginalised groups, women and men, to undertake their own development, to
A REPORT CARD OF ADOLESCENTS IN ZAMBIA REPORT CARD 1
 A REPORT CARD OF ADOLESCENTS IN ZAMBIA REPORT CARD 1 2 A REPORT CARD OF ADOLESCENTS IN ZAMBIA CONTENTS TABLE OF CONTENTS Table of contents 4 List of figures 6 List of abbreviations 7 Summary 9 Chapter
2.1 Net enrolment ratio in primary education
 2.1 Net enrolment ratio in primary education GOAL AND TARGET ADDRESSED Goal 2: Achieve universal primary education Target 2.A: Ensure that, by 2015, children everywhere, boys and girls alike, will be able
Girls education the facts
 Education for All Global Monitoring Report Fact Sheet October 2013 Girls education the facts Millions of girls around the world are still being denied an education PRIMARY SCHOOL: There are still 31 million
research brief A Profile of the Middle Class in Latin American Countries 2001 2011 by Leopoldo Tornarolli
 research brief The International Policy Centre for Inclusive Growth is jointly supported by the United Nations Development Programme and the Government of Brazil. August/2014no. 47 A Profile of the Middle
This briefing is divided into themes, where possible 2001 data is provided for comparison.
 Information Action 2011 Census Second Release December 2012 Consultation The Office for National Statistics (ONS) has now begun the Second Release of outputs from the 2011 Census at local authority level.
Progress and prospects
 Ending CHILD MARRIAGE Progress and prospects UNICEF/BANA213-182/Kiron The current situation Worldwide, more than 7 million women alive today were married before their 18th birthday. More than one in three
Convention on the Elimination of All Forms of Discrimination against Women
 United Nations CEDAW/C/ETH/Q/6-7 Convention on the Elimination of All Forms of Discrimination against Women Distr.: General 4 November 2010 Original: English Committee on the Elimination of Discrimination
RR887. Changes in shift work patterns over the last ten years (1999 to 2009)
") Health and Safety Executive Changes in shift work patterns over the last ten years (999 to 009) Prepared by Office for National Statistics for the Health and Safety Executive 0 RR887 Research Report Crown
Health and Safety Executive Changes in shift work patterns over the last ten years (999 to 009) Prepared by Office for National Statistics for the Health and Safety Executive 0 RR887 Research Report Crown
Income, Poverty, and Inequality
 2 Income, Poverty, and Inequality As we discuss different dimensions of human development such as access to education, health care, and the well-being of vulnerable populations like children and the elderly
ELDER ABUSE IN INDIA
 REPORT ON ELDER ABUSE IN INDIA Don t Ignore it. Prevent it. HelpAge India (headoffice): C 14, Qutab Institutional Area. New Delhi 110016. Ph: 011-41688955 56. www.helpageindia.org Consultant: Sigma Research
Briefing note for countries on the 2015 Human Development Report. Philippines
 Human Development Report 2015 Work for human development Briefing note for countries on the 2015 Human Development Report Philippines Introduction The 2015 Human Development Report (HDR) Work for Human
34-1/2013/DAF Dr. Ambedkar Foundation Ministry of Social Justice & Empowerment
 34-1/2013/DAF Dr. Ambedkar Foundation Ministry of Social Justice & Empowerment 27.04.2015 (I) Background Dr. Ambedkar Scheme for Social Integration through Inter-Caste Marriages 1. Sociologists have argued
Nepal. Country coverage and the methodology of the Statistical Annex of the 2015 HDR
 Human Development Report 2015 Work for human development Briefing note for countries on the 2015 Human Development Report Nepal Introduction The 2015 Human Development Report (HDR) Work for Human Development
Prof. Avinash K. Singh
 Local Management of Schools : Evidence From a Field Based Study Prof. Avinash K. Singh Department of Foundations of Education National University of Educational Planning and Administration 17-B, Sri Aurobindo
India Human Development Survey Technical Paper No. 1
 India Human Development Survey: Design and Data Quality Sonalde Desai Amaresh Dubey B.L. Joshi Mitali Sen Abusaleh Shariff Reeve Vanneman India Human Development Survey Technical Paper No. 1 India Human
GOVERNMENT OF INDIA PRESS INFORMATION BUREAU *****
 GOVERNMENT OF INDIA PRESS INFORMATION BUREAU ***** POVERTY ESTIMATES FOR 2004-05 New Delhi, March, 2007 The Planning Commission as the Nodal agency in the Government of India for estimation of poverty
Sierra Leone. Country coverage and the methodology of the Statistical Annex of the 2015 HDR
 Human Development Report 2015 Work for human development Briefing note for countries on the 2015 Human Development Report Sierra Leone Introduction The 2015 Human Development Report (HDR) Work for Human
Briefing note for countries on the 2015 Human Development Report. Niger
 Human Development Report 2015 Work for human development Briefing note for countries on the 2015 Human Development Report Niger Introduction The 2015 Human Development Report (HDR) Work for Human Development
PROFILE OF THE SINGAPORE CHINESE DIALECT GROUPS
 PROFILE OF THE SINGAPORE CHINESE DIALECT GROUPS by Edmond Lee Eu Fah Social Statistics Section Singapore Department of Statistics INTRODUCTION The Singapore society is made up of different ethnic groups
Briefing note for countries on the 2015 Human Development Report. Burkina Faso
 Human Development Report 2015 Work for human development Briefing note for countries on the 2015 Human Development Report Burkina Faso Introduction The 2015 Human Development Report (HDR) Work for Human
MATERNAL AND CHILD HEALTH 9
 MATERNAL AND CHILD HEALTH 9 Ann Phoya and Sophie Kang oma This chapter presents the 2004 MDHS findings on maternal and child health in Malawi. Topics discussed include the utilisation maternal and child
MDG INDONESIA: STATUS AND THE WAY FORWARD
 MDG INDONESIA: STATUS AND THE WAY FORWARD Endah Murniningtyas-National Development Planning Agency Widyono University of Indonesia Presented at the UN-DESA UN-ESCAP MDG Workshop Bangkok, 20-22 August 2008
Thailand. Country coverage and the methodology of the Statistical Annex of the 2015 HDR
 Human Development Report 2015 Work for human development Briefing note for countries on the 2015 Human Development Report Thailand Introduction The 2015 Human Development Report (HDR) Work for Human Development
Brazil. Country coverage and the methodology of the Statistical Annex of the 2015 HDR
 Human Development Report 2015 Work for human development Briefing note for countries on the 2015 Human Development Report Brazil Introduction The 2015 Human Development Report (HDR) Work for Human Development
Research into Issues Surrounding Human Bones in Museums Prepared for
 Research into Issues Surrounding Human Bones in Museums Prepared for 1 CONTENTS 1. OBJECTIVES & RESEARCH APPROACH 2. FINDINGS a. Visits to Museums and Archaeological Sites b. Interest in Archaeology c.
COI Research Management Summary on behalf of the Department of Health
 COI Research Management Summary on behalf of the Department of Health Title: Worth Talking About Campaign Evaluation 2010 / 2011 Quantitative research conducted by TNS-BMRB COI Reference number: 114770
TERI ENVIRONMENTAL SURVEY- 2012 DELHI NCR AND KARNATKA
 TERI ENVIRONMENTAL SURVEY- 2012 DELHI NCR AND KARNATKA 2 1. Introduction The Energy and Resources Institute (TERI) conducted an online Environmental Survey in two selected geographical areas of India the
GUIDE. MENA Gender Equality Profile Status of Girls and Women in the Middle East and North Africa
 GUIDE MENA Gender Equality Profile Status of Girls and Women in the Middle East and North Africa 1 IntroductIon The objective of the Middle East and North Africa (MENA) Gender Equality Profiles is to
How s Life in the United States?
 October 2015 How s Life in the United States? Additional information, including the data used in this country note, can be found at: www.oecd.org/statistics/hows-life-2015-country-notes-data.xlsx HOW S
El Salvador. Country coverage and the methodology of the Statistical Annex of the 2015 HDR
 Human Development Report 2015 Work for human development Briefing note for countries on the 2015 Human Development Report El Salvador Introduction The 2015 Human Development Report (HDR) Work for Human
Briefing note for countries on the 2015 Human Development Report. Mozambique
 Human Development Report 2015 Work for human development Briefing note for countries on the 2015 Human Development Report Mozambique Introduction The 2015 Human Development Report (HDR) Work for Human
Tanzania (United Republic of)
") Human Development Report 2015 Work for human development Briefing note for countries on the 2015 Human Development Report Tanzania (United Introduction The 2015 Human Development Report (HDR) Work for
Human Development Report 2015 Work for human development Briefing note for countries on the 2015 Human Development Report Tanzania (United Introduction The 2015 Human Development Report (HDR) Work for
TWIN E-LEARNING PROGRAMME: SKILLS FOR EMPLOYABILITY OF THE UNDERPRIVILEDGED YOUTH IN MANIPUR WHAT MAKES TWIN E-LEARNING PROGRAMME A BEST PRACTICE
 TWIN E-LEARNING PROGRAMME: SKILLS FOR EMPLOYABILITY OF THE UNDERPRIVILEDGED YOUTH IN MANIPUR WHAT MAKES TWIN E-LEARNING PROGRAMME A BEST PRACTICE The Twin E-Learning Programme began in 2007. However within
International Journal Advances in Social Science and Humanities Available online at: www.ijassh.com
 ISSN: 2347-7474 International Journal Advances in Social Science and Humanities Available online at: www.ijassh.com RESEARCH ARTICLE Job Satisfaction among Library and Information Science Faculty Members
Patient Responsibility in Health Care: An AARP Bulletin Survey
 Patient Responsibility in Health Care: An AARP Bulletin Survey May 2011 Patient Responsibility in Health Care: An AARP Bulletin Survey Data Collected by SSRS Report Prepared by Teresa A. Keenan, Ph.D.
Development of Social Statistics in Indonesia: a brief note
 Development of Social Statistics in Indonesia: a brief note Wynandin Imawan wynandin@bps.go.id BPS Statistics Indonesia 29 September 2011 1 Legal Setting Institutional: Statistics Law No 16 1997; BPS Statistics
State of Working Britain
 State of Working Britain Aim is to Gives an up to date assessment of the performance of UK labour market, to highlight recent important developments seeks to describe and understand the major long-term
Russian Federation. Country coverage and the methodology of the Statistical Annex of the 2015 HDR
 Human Development Report 2015 Work for human development Briefing note for countries on the 2015 Human Development Report Russian Federation Introduction The 2015 Human Development Report (HDR) Work for
Brief Overview of MIRA Channel (Women Mobile Lifeline Channel)
") Brief Overview of MIRA Channel (Women Mobile Lifeline Channel) MIRA Channel or Women Mobile Lifeline Channel - is an integrated mobile phone channel to provide healthcare information and services to rural
Brief Overview of MIRA Channel (Women Mobile Lifeline Channel) MIRA Channel or Women Mobile Lifeline Channel - is an integrated mobile phone channel to provide healthcare information and services to rural
Poverty Indicators Household Income and Expenditure Survey - 2006/07 Department of Census and Statistics Ministry of Finance and Planning Sri Lanka
 ISSN 1391-4695 March 2008 Poverty Indicators Household Income and Expenditure Survey - 2006/07 Department of Census and Statistics Ministry of Finance and Planning Sri Lanka Introduction The Household
Briefing note for countries on the 2015 Human Development Report. Palestine, State of
 Human Development Report 2015 Work for human development Briefing note for countries on the 2015 Human Development Report Palestine, State of Introduction The 2015 Human Development Report (HDR) Work for
Malawi. Country coverage and the methodology of the Statistical Annex of the 2015 HDR
 Human Development Report 2015 Work for human development Briefing note for countries on the 2015 Human Development Report Malawi Introduction The 2015 Human Development Report (HDR) Work for Human Development