Economics 345 Applied Econometrics. From:
|
|
|
- Eustace Townsend
- 7 years ago
- Views:
Transcription
1 Economics 345 Applied Econometrics Lab 2: Simple Linear Regression Prof: Martin Farnham TAs: Rebecca Wortzman Review from last lab From:

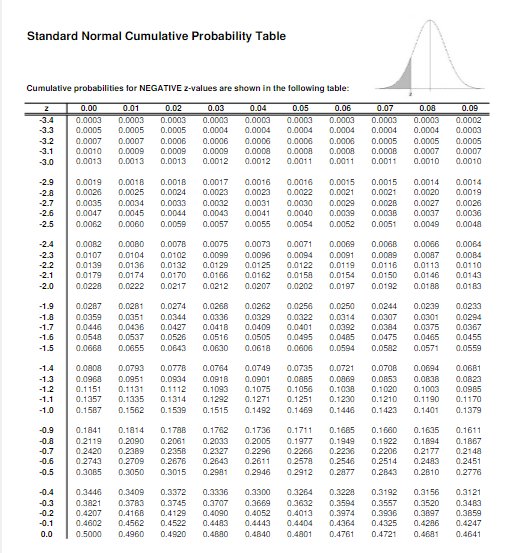
2 From: = 0.975
3 = From:
4 LAB 2: Looking at measurable student outcomes and school district expenditure. DATA: alabama.wf1. FOUND IN: sfgclients on uvic\storage (S:) Browse to this drive and to the folder \social sciences\economics\econ 345\Wooldridge Eviews Files\ Introduction: A perennial question among social scientists in general, and economists focusing on education in particular, is what effect school spending has on student outcomes. Measurable student outcomes we could focus on include test scores, dropout rates, wages upon graduation, college attendance rates, etc. In this lab we will focus on standardized test scores for reading and math administered to students in grades 8-9. Recall from class, OLS estimation: Important for empirical work: - How can we interpret these estimates (what do estimates of Beta mean)? - Does our data satisfy the assumptions we make when we do OLS?

5 Data: Number of School Districts: 127 in the State of Alabama in the late 1980s. Focusing on 3 variables today: score89 Average reading and math standardized test score y=score89 our dependent variable for 8-9th grade students. (In standard deviation units. e.g. each student s score is expressed as a number of standard deviations from the mean. In other words, the score has been standardized (as we saw in lecture) to have a mean of zero and a standard deviation of 1). exppup Average expenditure per pupil in the district. X=exppup our independent variable (or our explanatory variable pcy Per capita income in the district. X=our control variable i.e. what is the effect of expenditure, holding per capita income fixed
 and average expenditure per pupil (exppup) o RECALL, you can group these two variables and look at")
6 Some Descriptive Statistics: Means, medians and histograms 1. What are the mean and median test score (score89) and average expenditure per pupil (exppup) o RECALL, you can group these two variables and look at the statistics at the same time What does a large difference between mean and median imply?

7 2. What is the distribution for test scores and expenditure per pupil? o (i.e. create a histogram for both of these variables) What can we say about the respective distributions? How do they differ?
8 TWO WAYS TO RESTRICT YOUR SAMPLE Sample only values above the mean 3. Create a histograms of test scores for districts with per pupil expenditures that are greater than or equal to the statewide average. - QUICK>SAMPLE>IF conditional: exppup>=@mean(exppup) - Now create a histogram for Test scores Does it differ? o How many observations are in this sample? Series: SCORE89 Sample IF EXPPUP> =@MEAN(EXPPUP,"@all") Observations 51 Mean Median Maximum Minimum Std. Dev Skewness Kurtosis Jarque-Bera Probability Return to looking at the full sample
9 Create a dummy variable, and sample only observations where dummy=1 4. Separately examine the histogram of test scores for districts that have per pupil expenditures above the statewide median, and then for districts below the statewide median. - Create a dummy variable that seperates high and low spending school districts - In the Command bar: genr highspend=(exppup>=@median(exppup)) - Now, restrict our sample to include only high-spending schools i.e. those above the statewide median - QUICK>SAMPLE>IF conditional: - In the Command bar highspend=1 OR if exppup>=@median(exppup)

10 5. What is the mean value of score89? Looking at the histogram, is most of the sample distribution lying above or below zero? 6. Compare this to the bottom half of the district... - Change sample: QUICK>SAMPLE>IF: highspend=0 7. What is the mean value of score89? Looking at the histogram, is most of the sample distribution lying above or below zero? What might this imply about expenditure in school districts? Is this the result you expected? Return to the full sample

11 Descriptive Statistics Continued: Correlation 1. What is the correlation between exppup and score89? Is the correlation higher or lower than you expected? - Make sure you have the entire sample - Click exxpup, and CTRL + CLICK score89 - SHOW> OK - VIEW>COVARIANCE ANALYSIS> check the CORRELATIONS box - The off-diagonal elements give the correlations between exppup and score89. Recall from class:

12 2. To generate a simple scatter plot of exppup and score89. - Click exxpup, and CTRL + CLICK score89: SHOW - VIEW>GRAPH>SCATTER>SIMPLE SCATTER 3. Do you observe a positive or a negative relationship between the two variables of interest? Is this consistent with the correlation coefficient you obtained above? 4. Think back now over what you ve done so far in this lab. What appears to be the relationship between per pupil spending and standardized test scores? Does what you ve observed thus far tell you anything about the direction of causality between these two variables?
13 Regression Analysis of the Effect of School Spending on Test Scores: 1. Write out the population regression function for a regression of test scores on per pupil expenditures. 2. Run a regression of test scores on per pupil expenditures. - In the Command bar: ls score89 c exppup c: is for constant. If you leave out the c, EViews will fit a line that passes through the origin. The c is needed to tell EViews to estimate an intercept term ls: tells eviews we want to do an ordinary least squares regression We re interested in the effect that spending has on scores, so the SCORE is the dependent variable here
14 Interpreting Output: Dependent Variable: SCORE89 Method: Least Squares Date: 09/26/16 Time: 16:55 Sample: Included observations: 127 Variable Coefficient Std. Error t-statistic Prob. C EXPPUP R-squared Mean dependent var Adjusted R-squared S.D. dependent var S.E. of regression Akaike info criterion Sum squared resid Schwarz criterion Log likelihood Hannan-Quinn criter F-statistic Durbin-Watson stat Prob(F-statistic) Of particular interest is the estimate produced of the slope coefficient. What is the coefficient? 4. What is the R-Squared and the Sum of Squared Residuals (SSR)? 5. Can you determine total sum of squares (SST) from this information? What is SSE? Recall from class
15 Regression Analysis controlling for Income: 1. Now include a second variable on the right-hand-side (RHS) of the regression model (rewrite the population model). - The second RHS variable will be pcy. - COMMAND: ls score89 c exppup pcy 2. Has the R-squared increased? 3. Did you expect that the R-squared would increase? Explain. What has happened to the coefficient on average expenditure per pupil? Interpret this result. Dependent Variable: SCORE89 Method: Least Squares Date: 09/26/16 Time: 17:04 Sample: Included observations: 127 Variable Coefficient Std. Error t-statistic Prob. C EXPPUP PCY E R-squared Mean dependent var Adjusted R-squared S.D. dependent var S.E. of regression Akaike info criterion Sum squared resid Schwarz criterion Log likelihood Hannan-Quinn criter F-statistic Durbin-Watson stat Prob(F-statistic)

16 Regression Analysis, do the assumptions hold up? 4. Prior to the inclusion of pcy do you think the assumption that the x s and the u s were uncorrelated was realistic? - i.e. are there things that could be correlated with expenditure in a district that also might affect test scores 5. Explain the likely relationship between pcy and exppup and how the omission of pcy would be likely to affect the relationship between exppup and u. - i.e. do you think this relationship would hold? 6. In light of this discussion, do you think the original estimate of the slope coefficient you obtained (when only exppup was on the RHS) was unbiased?
17 7. How does the ability to control for something like pcy improve your insight into the relationship between spending and test scores, when compared with the starting analysis in this lab, where you just looked at correlations, scatterplots, etc. 8. Remember that the error term captures the effect of all other factors that affect score89. Can you think of some other factors that might affect score89? 9. Are any of these likely to be correlated with exppup? 10. If so, then does the coefficient estimate on exppup capture the true CAUSAL relationship between spending and test scores? 11. What could you do to get a better estimate of that causal relationship? Next week we are going to talk about hypothesis testing, and whether these relationship are statistically significant.
2. Linear regression with multiple regressors
 2. Linear regression with multiple regressors Aim of this section: Introduction of the multiple regression model OLS estimation in multiple regression Measures-of-fit in multiple regression Assumptions
Forecasting the US Dollar / Euro Exchange rate Using ARMA Models
 Forecasting the US Dollar / Euro Exchange rate Using ARMA Models LIUWEI (9906360) - 1 - ABSTRACT...3 1. INTRODUCTION...4 2. DATA ANALYSIS...5 2.1 Stationary estimation...5 2.2 Dickey-Fuller Test...6 3.
Simple linear regression
 Simple linear regression Introduction Simple linear regression is a statistical method for obtaining a formula to predict values of one variable from another where there is a causal relationship between
Chapter 7: Simple linear regression Learning Objectives
 Chapter 7: Simple linear regression Learning Objectives Reading: Section 7.1 of OpenIntro Statistics Video: Correlation vs. causation, YouTube (2:19) Video: Intro to Linear Regression, YouTube (5:18) -
Module 3: Correlation and Covariance
 Using Statistical Data to Make Decisions Module 3: Correlation and Covariance Tom Ilvento Dr. Mugdim Pašiƒ University of Delaware Sarajevo Graduate School of Business O ften our interest in data analysis
Chapter 13 Introduction to Linear Regression and Correlation Analysis
 Chapter 3 Student Lecture Notes 3- Chapter 3 Introduction to Linear Regression and Correlation Analsis Fall 2006 Fundamentals of Business Statistics Chapter Goals To understand the methods for displaing
SPSS Guide: Regression Analysis
 SPSS Guide: Regression Analysis I put this together to give you a step-by-step guide for replicating what we did in the computer lab. It should help you run the tests we covered. The best way to get familiar
HYPOTHESIS TESTING: CONFIDENCE INTERVALS, T-TESTS, ANOVAS, AND REGRESSION
 HYPOTHESIS TESTING: CONFIDENCE INTERVALS, T-TESTS, ANOVAS, AND REGRESSION HOD 2990 10 November 2010 Lecture Background This is a lightning speed summary of introductory statistical methods for senior undergraduate
Module 5: Multiple Regression Analysis
 Using Statistical Data Using to Make Statistical Decisions: Data Multiple to Make Regression Decisions Analysis Page 1 Module 5: Multiple Regression Analysis Tom Ilvento, University of Delaware, College
Course Objective This course is designed to give you a basic understanding of how to run regressions in SPSS.
 SPSS Regressions Social Science Research Lab American University, Washington, D.C. Web. www.american.edu/provost/ctrl/pclabs.cfm Tel. x3862 Email. SSRL@American.edu Course Objective This course is designed
Bill Burton Albert Einstein College of Medicine william.burton@einstein.yu.edu April 28, 2014 EERS: Managing the Tension Between Rigor and Resources 1
 Bill Burton Albert Einstein College of Medicine william.burton@einstein.yu.edu April 28, 2014 EERS: Managing the Tension Between Rigor and Resources 1 Calculate counts, means, and standard deviations Produce
Determinants of Stock Market Performance in Pakistan
 Determinants of Stock Market Performance in Pakistan Mehwish Zafar Sr. Lecturer Bahria University, Karachi campus Abstract Stock market performance, economic and political condition of a country is interrelated
IMPACT OF WORKING CAPITAL MANAGEMENT ON PROFITABILITY
 IMPACT OF WORKING CAPITAL MANAGEMENT ON PROFITABILITY Hina Agha, Mba, Mphil Bahria University Karachi Campus, Pakistan Abstract The main purpose of this study is to empirically test the impact of working
5. Multiple regression
 5. Multiple regression QBUS6840 Predictive Analytics https://www.otexts.org/fpp/5 QBUS6840 Predictive Analytics 5. Multiple regression 2/39 Outline Introduction to multiple linear regression Some useful
Introduction to Regression and Data Analysis
 Statlab Workshop Introduction to Regression and Data Analysis with Dan Campbell and Sherlock Campbell October 28, 2008 I. The basics A. Types of variables Your variables may take several forms, and it
Data analysis and regression in Stata
 Data analysis and regression in Stata This handout shows how the weekly beer sales series might be analyzed with Stata (the software package now used for teaching stats at Kellogg), for purposes of comparing
Exercise 1.12 (Pg. 22-23)
") Individuals: The objects that are described by a set of data. They may be people, animals, things, etc. (Also referred to as Cases or Records) Variables: The characteristics recorded about each individual.
Individuals: The objects that are described by a set of data. They may be people, animals, things, etc. (Also referred to as Cases or Records) Variables: The characteristics recorded about each individual.
Price volatility in the silver spot market: An empirical study using Garch applications
 Price volatility in the silver spot market: An empirical study using Garch applications ABSTRACT Alan Harper, South University Zhenhu Jin Valparaiso University Raufu Sokunle UBS Investment Bank Manish
2. Simple Linear Regression
 Research methods - II 3 2. Simple Linear Regression Simple linear regression is a technique in parametric statistics that is commonly used for analyzing mean response of a variable Y which changes according
Causal Forecasting Models
 CTL.SC1x -Supply Chain & Logistics Fundamentals Causal Forecasting Models MIT Center for Transportation & Logistics Causal Models Used when demand is correlated with some known and measurable environmental
European Journal of Business and Management ISSN 2222-1905 (Paper) ISSN 2222-2839 (Online) Vol.5, No.30, 2013
 ISSN 2222-2839 (Online) Vol.5, No.30, 2013") The Impact of Stock Market Liquidity on Economic Growth in Jordan Shatha Abdul-Khaliq Assistant Professor,AlBlqa Applied University, Jordan * E-mail of the corresponding author: yshatha@gmail.com Abstract
The Impact of Stock Market Liquidity on Economic Growth in Jordan Shatha Abdul-Khaliq Assistant Professor,AlBlqa Applied University, Jordan * E-mail of the corresponding author: yshatha@gmail.com Abstract
Doing Multiple Regression with SPSS. In this case, we are interested in the Analyze options so we choose that menu. If gives us a number of choices:
 Doing Multiple Regression with SPSS Multiple Regression for Data Already in Data Editor Next we want to specify a multiple regression analysis for these data. The menu bar for SPSS offers several options:
The Relationship between Life Insurance and Economic Growth: Evidence from India
 Global Journal of Management and Business Studies. ISSN 2248-9878 Volume 3, Number 4 (2013), pp. 413-422 Research India Publications http://www.ripublication.com/gjmbs.htm The Relationship between Life
Outline. Topic 4 - Analysis of Variance Approach to Regression. Partitioning Sums of Squares. Total Sum of Squares. Partitioning sums of squares
 Topic 4 - Analysis of Variance Approach to Regression Outline Partitioning sums of squares Degrees of freedom Expected mean squares General linear test - Fall 2013 R 2 and the coefficient of correlation
A Guide to Using EViews with Using Econometrics: A Practical Guide
 A Guide to Using EViews with Using Econometrics: A Practical Guide In the Introduction: 1. Purpose of this guide 2. EViews help 3. EViews basics and objects 4. Mathematical expressions in EViews 5. Areas
Chapter 23. Inferences for Regression
 Chapter 23. Inferences for Regression Topics covered in this chapter: Simple Linear Regression Simple Linear Regression Example 23.1: Crying and IQ The Problem: Infants who cry easily may be more easily
KSTAT MINI-MANUAL. Decision Sciences 434 Kellogg Graduate School of Management
 KSTAT MINI-MANUAL Decision Sciences 434 Kellogg Graduate School of Management Kstat is a set of macros added to Excel and it will enable you to do the statistics required for this course very easily. To
Simple Linear Regression Inference
 Simple Linear Regression Inference 1 Inference requirements The Normality assumption of the stochastic term e is needed for inference even if it is not a OLS requirement. Therefore we have: Interpretation
Chicago Booth BUSINESS STATISTICS 41000 Final Exam Fall 2011
 Chicago Booth BUSINESS STATISTICS 41000 Final Exam Fall 2011 Name: Section: I pledge my honor that I have not violated the Honor Code Signature: This exam has 34 pages. You have 3 hours to complete this
Using Excel for Statistical Analysis
 Using Excel for Statistical Analysis You don t have to have a fancy pants statistics package to do many statistical functions. Excel can perform several statistical tests and analyses. First, make sure
Unit 31 A Hypothesis Test about Correlation and Slope in a Simple Linear Regression
 Unit 31 A Hypothesis Test about Correlation and Slope in a Simple Linear Regression Objectives: To perform a hypothesis test concerning the slope of a least squares line To recognize that testing for a
NCSS Statistical Software Principal Components Regression. In ordinary least squares, the regression coefficients are estimated using the formula ( )
") Chapter 340 Principal Components Regression Introduction is a technique for analyzing multiple regression data that suffer from multicollinearity. When multicollinearity occurs, least squares estimates
Chapter 340 Principal Components Regression Introduction is a technique for analyzing multiple regression data that suffer from multicollinearity. When multicollinearity occurs, least squares estimates
Econometrics Simple Linear Regression
 Econometrics Simple Linear Regression Burcu Eke UC3M Linear equations with one variable Recall what a linear equation is: y = b 0 + b 1 x is a linear equation with one variable, or equivalently, a straight
Forecasting Using Eviews 2.0: An Overview
 Forecasting Using Eviews 2.0: An Overview Some Preliminaries In what follows it will be useful to distinguish between ex post and ex ante forecasting. In terms of time series modeling, both predict values
Simple Linear Regression, Scatterplots, and Bivariate Correlation
 1 Simple Linear Regression, Scatterplots, and Bivariate Correlation This section covers procedures for testing the association between two continuous variables using the SPSS Regression and Correlate analyses.
Exploring Changes in the Labor Market of Health Care Service Workers in Texas and the Rio Grande Valley I. Introduction
 Ina Ganguli ENG-SCI 103 Final Project May 16, 2007 Exploring Changes in the Labor Market of Health Care Service Workers in Texas and the Rio Grande Valley I. Introduction The shortage of healthcare workers
UK GDP is the best predictor of UK GDP, literally.
 UK GDP IS THE BEST PREDICTOR OF UK GDP, LITERALLY ERIK BRITTON AND DANNY GABAY 6 NOVEMBER 2009 UK GDP is the best predictor of UK GDP, literally. The ONS s preliminary estimate of UK GDP for the third
Overview of Violations of the Basic Assumptions in the Classical Normal Linear Regression Model
 Overview of Violations of the Basic Assumptions in the Classical Normal Linear Regression Model 1 September 004 A. Introduction and assumptions The classical normal linear regression model can be written
Logs Transformation in a Regression Equation
 Fall, 2001 1 Logs as the Predictor Logs Transformation in a Regression Equation The interpretation of the slope and intercept in a regression change when the predictor (X) is put on a log scale. In this
OLS Examples. OLS Regression
 OLS Examples Page 1 Problem OLS Regression The Kelley Blue Book provides information on wholesale and retail prices of cars. Following are age and price data for 10 randomly selected Corvettes between
Section 14 Simple Linear Regression: Introduction to Least Squares Regression
 Slide 1 Section 14 Simple Linear Regression: Introduction to Least Squares Regression There are several different measures of statistical association used for understanding the quantitative relationship
Univariate Regression
 Univariate Regression Correlation and Regression The regression line summarizes the linear relationship between 2 variables Correlation coefficient, r, measures strength of relationship: the closer r is
Lesson 4 Measures of Central Tendency
 Outline Measures of a distribution s shape -modality and skewness -the normal distribution Measures of central tendency -mean, median, and mode Skewness and Central Tendency Lesson 4 Measures of Central
The relationship between stock market parameters and interbank lending market: an empirical evidence
 Magomet Yandiev Associate Professor, Department of Economics, Lomonosov Moscow State University mag2097@mail.ru Alexander Pakhalov, PG student, Department of Economics, Lomonosov Moscow State University
Session 9 Case 3: Utilizing Available Software Statistical Analysis
 Session 9 Case 3: Utilizing Available Software Statistical Analysis Michelle Phillips Economist, PURC michelle.phillips@warrington.ufl.edu With material from Ted Kury Session Overview With Data from Cases
Answer: C. The strength of a correlation does not change if units change by a linear transformation such as: Fahrenheit = 32 + (5/9) * Centigrade
 * Centigrade") Statistics Quiz Correlation and Regression -- ANSWERS 1. Temperature and air pollution are known to be correlated. We collect data from two laboratories, in Boston and Montreal. Boston makes their measurements
Statistics Quiz Correlation and Regression -- ANSWERS 1. Temperature and air pollution are known to be correlated. We collect data from two laboratories, in Boston and Montreal. Boston makes their measurements
2013 MBA Jump Start Program. Statistics Module Part 3
 2013 MBA Jump Start Program Module 1: Statistics Thomas Gilbert Part 3 Statistics Module Part 3 Hypothesis Testing (Inference) Regressions 2 1 Making an Investment Decision A researcher in your firm just
Analyzing Intervention Effects: Multilevel & Other Approaches. Simplest Intervention Design. Better Design: Have Pretest
 Analyzing Intervention Effects: Multilevel & Other Approaches Joop Hox Methodology & Statistics, Utrecht Simplest Intervention Design R X Y E Random assignment Experimental + Control group Analysis: t
1) Write the following as an algebraic expression using x as the variable: Triple a number subtracted from the number
 Write the following as an algebraic expression using x as the variable: Triple a number subtracted from the number") 1) Write the following as an algebraic expression using x as the variable: Triple a number subtracted from the number A. 3(x - x) B. x 3 x C. 3x - x D. x - 3x 2) Write the following as an algebraic expression
1) Write the following as an algebraic expression using x as the variable: Triple a number subtracted from the number A. 3(x - x) B. x 3 x C. 3x - x D. x - 3x 2) Write the following as an algebraic expression
Air passenger departures forecast models A technical note
 Ministry of Transport Air passenger departures forecast models A technical note By Haobo Wang Financial, Economic and Statistical Analysis Page 1 of 15 1. Introduction Sine 1999, the Ministry of Business,
MULTIPLE REGRESSION EXAMPLE
 MULTIPLE REGRESSION EXAMPLE For a sample of n = 166 college students, the following variables were measured: Y = height X 1 = mother s height ( momheight ) X 2 = father s height ( dadheight ) X 3 = 1 if
DEPARTMENT OF PSYCHOLOGY UNIVERSITY OF LANCASTER MSC IN PSYCHOLOGICAL RESEARCH METHODS ANALYSING AND INTERPRETING DATA 2 PART 1 WEEK 9
 DEPARTMENT OF PSYCHOLOGY UNIVERSITY OF LANCASTER MSC IN PSYCHOLOGICAL RESEARCH METHODS ANALYSING AND INTERPRETING DATA 2 PART 1 WEEK 9 Analysis of covariance and multiple regression So far in this course,
Chapter 6: Multivariate Cointegration Analysis
 Chapter 6: Multivariate Cointegration Analysis 1 Contents: Lehrstuhl für Department Empirische of Wirtschaftsforschung Empirical Research and und Econometrics Ökonometrie VI. Multivariate Cointegration
Testing for Granger causality between stock prices and economic growth
 MPRA Munich Personal RePEc Archive Testing for Granger causality between stock prices and economic growth Pasquale Foresti 2006 Online at http://mpra.ub.uni-muenchen.de/2962/ MPRA Paper No. 2962, posted
Technical Efficiency Accounting for Environmental Influence in the Japanese Gas Market
 Technical Efficiency Accounting for Environmental Influence in the Japanese Gas Market Sumiko Asai Otsuma Women s University 2-7-1, Karakida, Tama City, Tokyo, 26-854, Japan asai@otsuma.ac.jp Abstract:
Chapter 15. Mixed Models. 15.1 Overview. A flexible approach to correlated data.
 Chapter 15 Mixed Models A flexible approach to correlated data. 15.1 Overview Correlated data arise frequently in statistical analyses. This may be due to grouping of subjects, e.g., students within classrooms,
The Impact of Privatization in Insurance Industry on Insurance Efficiency in Iran
 The Impact of Privatization in Insurance Industry on Insurance Efficiency in Iran Shahram Gilaninia 1, Hosein Ganjinia, Azadeh Asadian 3 * 1. Department of Industrial Management, Islamic Azad University,
Descriptive Statistics
 Descriptive Statistics Descriptive statistics consist of methods for organizing and summarizing data. It includes the construction of graphs, charts and tables, as well various descriptive measures such
2. Filling Data Gaps, Data validation & Descriptive Statistics
 2. Filling Data Gaps, Data validation & Descriptive Statistics Dr. Prasad Modak Background Data collected from field may suffer from these problems Data may contain gaps ( = no readings during this period)
MULTIPLE CHOICE. Choose the one alternative that best completes the statement or answers the question.
 Module 7 Test Name MULTIPLE CHOICE. Choose the one alternative that best completes the statement or answers the question. You are given information about a straight line. Use two points to graph the equation.
Competition as an Effective Tool in Developing Social Marketing Programs: Driving Behavior Change through Online Activities
 Competition as an Effective Tool in Developing Social Marketing Programs: Driving Behavior Change through Online Activities Corina ŞERBAN 1 ABSTRACT Nowadays, social marketing practices represent an important
On the Degree of Openness of an Open Economy Carlos Alfredo Rodriguez, Universidad del CEMA Buenos Aires, Argentina
 On the Degree of Openness of an Open Economy Carlos Alfredo Rodriguez, Universidad del CEMA Buenos Aires, Argentina car@cema.edu.ar www.cema.edu.ar\~car Version1-February 14,2000 All data can be consulted
This chapter will demonstrate how to perform multiple linear regression with IBM SPSS
 CHAPTER 7B Multiple Regression: Statistical Methods Using IBM SPSS This chapter will demonstrate how to perform multiple linear regression with IBM SPSS first using the standard method and then using the
" Y. Notation and Equations for Regression Lecture 11/4. Notation:
 Notation: Notation and Equations for Regression Lecture 11/4 m: The number of predictor variables in a regression Xi: One of multiple predictor variables. The subscript i represents any number from 1 through
Linear Regression. Chapter 5. Prediction via Regression Line Number of new birds and Percent returning. Least Squares
 Linear Regression Chapter 5 Regression Objective: To quantify the linear relationship between an explanatory variable (x) and response variable (y). We can then predict the average response for all subjects
The Dummy s Guide to Data Analysis Using SPSS
 The Dummy s Guide to Data Analysis Using SPSS Mathematics 57 Scripps College Amy Gamble April, 2001 Amy Gamble 4/30/01 All Rights Rerserved TABLE OF CONTENTS PAGE Helpful Hints for All Tests...1 Tests
Forecasting in STATA: Tools and Tricks
 Forecasting in STATA: Tools and Tricks Introduction This manual is intended to be a reference guide for time series forecasting in STATA. It will be updated periodically during the semester, and will be
CALCULATIONS & STATISTICS
 CALCULATIONS & STATISTICS CALCULATION OF SCORES Conversion of 1-5 scale to 0-100 scores When you look at your report, you will notice that the scores are reported on a 0-100 scale, even though respondents
SIMPLE LINEAR CORRELATION. r can range from -1 to 1, and is independent of units of measurement. Correlation can be done on two dependent variables.
 SIMPLE LINEAR CORRELATION Simple linear correlation is a measure of the degree to which two variables vary together, or a measure of the intensity of the association between two variables. Correlation
Moderator and Mediator Analysis
 Moderator and Mediator Analysis Seminar General Statistics Marijtje van Duijn October 8, Overview What is moderation and mediation? What is their relation to statistical concepts? Example(s) October 8,
Basic Statistics and Data Analysis for Health Researchers from Foreign Countries
 Basic Statistics and Data Analysis for Health Researchers from Foreign Countries Volkert Siersma siersma@sund.ku.dk The Research Unit for General Practice in Copenhagen Dias 1 Content Quantifying association
Binary Logistic Regression
 Binary Logistic Regression Main Effects Model Logistic regression will accept quantitative, binary or categorical predictors and will code the latter two in various ways. Here s a simple model including
Using An Ordered Logistic Regression Model with SAS Vartanian: SW 541
 Using An Ordered Logistic Regression Model with SAS Vartanian: SW 541 libname in1 >c:\=; Data first; Set in1.extract; A=1; PROC LOGIST OUTEST=DD MAXITER=100 ORDER=DATA; OUTPUT OUT=CC XBETA=XB P=PROB; MODEL
1. What is the critical value for this 95% confidence interval? CV = z.025 = invnorm(0.025) = 1.96
 = 1.96") 1 Final Review 2 Review 2.1 CI 1-propZint Scenario 1 A TV manufacturer claims in its warranty brochure that in the past not more than 10 percent of its TV sets needed any repair during the first two years
1 Final Review 2 Review 2.1 CI 1-propZint Scenario 1 A TV manufacturer claims in its warranty brochure that in the past not more than 10 percent of its TV sets needed any repair during the first two years
Lecture 15. Endogeneity & Instrumental Variable Estimation
 Lecture 15. Endogeneity & Instrumental Variable Estimation Saw that measurement error (on right hand side) means that OLS will be biased (biased toward zero) Potential solution to endogeneity instrumental
Chapter 10. Key Ideas Correlation, Correlation Coefficient (r),
,") Chapter 0 Key Ideas Correlation, Correlation Coefficient (r), Section 0-: Overview We have already explored the basics of describing single variable data sets. However, when two quantitative variables
Chapter 0 Key Ideas Correlation, Correlation Coefficient (r), Section 0-: Overview We have already explored the basics of describing single variable data sets. However, when two quantitative variables
Multiple Linear Regression
 Multiple Linear Regression A regression with two or more explanatory variables is called a multiple regression. Rather than modeling the mean response as a straight line, as in simple regression, it is
Institute of Actuaries of India Subject CT3 Probability and Mathematical Statistics
 Institute of Actuaries of India Subject CT3 Probability and Mathematical Statistics For 2015 Examinations Aim The aim of the Probability and Mathematical Statistics subject is to provide a grounding in
5 Correlation and Data Exploration
 5 Correlation and Data Exploration Correlation In Unit 3, we did some correlation analyses of data from studies related to the acquisition order and acquisition difficulty of English morphemes by both
Some Essential Statistics The Lure of Statistics
 Some Essential Statistics The Lure of Statistics Data Mining Techniques, by M.J.A. Berry and G.S Linoff, 2004 Statistics vs. Data Mining..lie, damn lie, and statistics mining data to support preconceived
11. Analysis of Case-control Studies Logistic Regression
 Research methods II 113 11. Analysis of Case-control Studies Logistic Regression This chapter builds upon and further develops the concepts and strategies described in Ch.6 of Mother and Child Health:
False. Model 2 is not a special case of Model 1, because Model 2 includes X5, which is not part of Model 1. What she ought to do is estimate
 Sociology 59 - Research Statistics I Final Exam Answer Key December 6, 00 Where appropriate, show your work - partial credit may be given. (On the other hand, don't waste a lot of time on excess verbiage.)
The Basic Two-Level Regression Model
 2 The Basic Two-Level Regression Model The multilevel regression model has become known in the research literature under a variety of names, such as random coefficient model (de Leeuw & Kreft, 1986; Longford,
Data Analysis. Using Excel. Jeffrey L. Rummel. BBA Seminar. Data in Excel. Excel Calculations of Descriptive Statistics. Single Variable Graphs
 Using Excel Jeffrey L. Rummel Emory University Goizueta Business School BBA Seminar Jeffrey L. Rummel BBA Seminar 1 / 54 Excel Calculations of Descriptive Statistics Single Variable Graphs Relationships
Source engine marketing: A preliminary empirical analysis of web search data
 Source engine marketing: A preliminary empirical analysis of web search data ABSTRACT Bruce Q. Budd Alfaisal University The purpose of this paper is to empirically investigate a website performance and
Solución del Examen Tipo: 1
 Solución del Examen Tipo: 1 Universidad Carlos III de Madrid ECONOMETRICS Academic year 2009/10 FINAL EXAM May 17, 2010 DURATION: 2 HOURS 1. Assume that model (III) verifies the assumptions of the classical
Copyright 2013 by Laura Schultz. All rights reserved. Page 1 of 7
 Using Your TI-83/84/89 Calculator: Linear Correlation and Regression Dr. Laura Schultz Statistics I This handout describes how to use your calculator for various linear correlation and regression applications.
Multiple Linear Regression in Data Mining
 Multiple Linear Regression in Data Mining Contents 2.1. A Review of Multiple Linear Regression 2.2. Illustration of the Regression Process 2.3. Subset Selection in Linear Regression 1 2 Chap. 2 Multiple
Scatter Plot, Correlation, and Regression on the TI-83/84
 Scatter Plot, Correlation, and Regression on the TI-83/84 Summary: When you have a set of (x,y) data points and want to find the best equation to describe them, you are performing a regression. This page
Multiple Regression in SPSS This example shows you how to perform multiple regression. The basic command is regression : linear.
 Multiple Regression in SPSS This example shows you how to perform multiple regression. The basic command is regression : linear. In the main dialog box, input the dependent variable and several predictors.
Regression III: Advanced Methods
 Lecture 16: Generalized Additive Models Regression III: Advanced Methods Bill Jacoby Michigan State University http://polisci.msu.edu/jacoby/icpsr/regress3 Goals of the Lecture Introduce Additive Models
How To Run Statistical Tests in Excel
 How To Run Statistical Tests in Excel Microsoft Excel is your best tool for storing and manipulating data, calculating basic descriptive statistics such as means and standard deviations, and conducting
Formula for linear models. Prediction, extrapolation, significance test against zero slope.
 Formula for linear models. Prediction, extrapolation, significance test against zero slope. Last time, we looked the linear regression formula. It s the line that fits the data best. The Pearson correlation
THE IMPACT OF COMPANY INCOME TAX AND VALUE-ADDED TAX ON ECONOMIC GROWTH: EVIDENCE FROM NIGERIA
 THE IMPACT OF COMPANY INCOME TAX AND VALUE-ADDED TAX ON ECONOMIC GROWTH: EVIDENCE FROM NIGERIA Dr. Lyndon M. Etale and Dr. Paymaster F. Bingilar Department of Finance and Accountancy, Faculty of Management
A Short Introduction to Eviews
 A Short Introduction to Eviews Note You are responsible to get familiar with Eviews as soon as possible. All homeworks are likely to contain questions for which you will need to use this software package.
The importance of graphing the data: Anscombe s regression examples
 The importance of graphing the data: Anscombe s regression examples Bruce Weaver Northern Health Research Conference Nipissing University, North Bay May 30-31, 2008 B. Weaver, NHRC 2008 1 The Objective
Predicting The Outcome Of NASCAR Races: The Role Of Driver Experience Mary Allender, University of Portland
 Predicting The Outcome Of NASCAR Races: The Role Of Driver Experience Mary Allender, University of Portland ABSTRACT As national interest in NASCAR grows, the field of sports economics is increasingly
Directions for using SPSS
 Directions for using SPSS Table of Contents Connecting and Working with Files 1. Accessing SPSS... 2 2. Transferring Files to N:\drive or your computer... 3 3. Importing Data from Another File Format...
THE INTERNATIONAL JOURNAL OF BUSINESS & MANAGEMENT
 THE INTERNATIONAL JOURNAL OF BUSINESS & MANAGEMENT Human Capital Efficiency and Corporate Performance: The Nigerian Perspective Kwarbai Jerry Danjuma Ph.D. Student, Department of Accounting, Babcock University,