Nebraska Historical Population Report
|
|
|
- Kelly Homer Baker
- 7 years ago
- Views:
Transcription
1 University of Nebraska Omaha Publications since 2000 Center for Public Affairs Research Nebraska Historical Population Report David J. Drozd University of Nebraska at Omaha, Jerry Deichert University of Nebraska at Omaha, Follow this and additional works at: Part of the Public Affairs Commons Recommended Citation Drozd, David J. and Deichert, Jerry, "Nebraska Historical Population Report" (2007). Publications since Paper This Report is brought to you for free and open access by the Center for Public Affairs Research at It has been accepted for inclusion in Publications since 2000 by an authorized administrator of For more information, please contact
2 Nebraska Historical Population Report Annual State Population Counts since 1900 Annual State Components of Population Change since 1930 Decennial State Sex and Age Pyramids: 1900 to 2000 plus 2006 County and Place Year of Highest Census Decennial Sex and Age Subgroup Populations: 1950 to 2000 Annual County Births, Deaths, and Natural Change 1949 to 2005 Prepared By: David Drozd, Jerry Deichert The Center for Public Affairs Research University of Nebraska at Omaha 6001 Dodge Street Omaha, NE September 2007
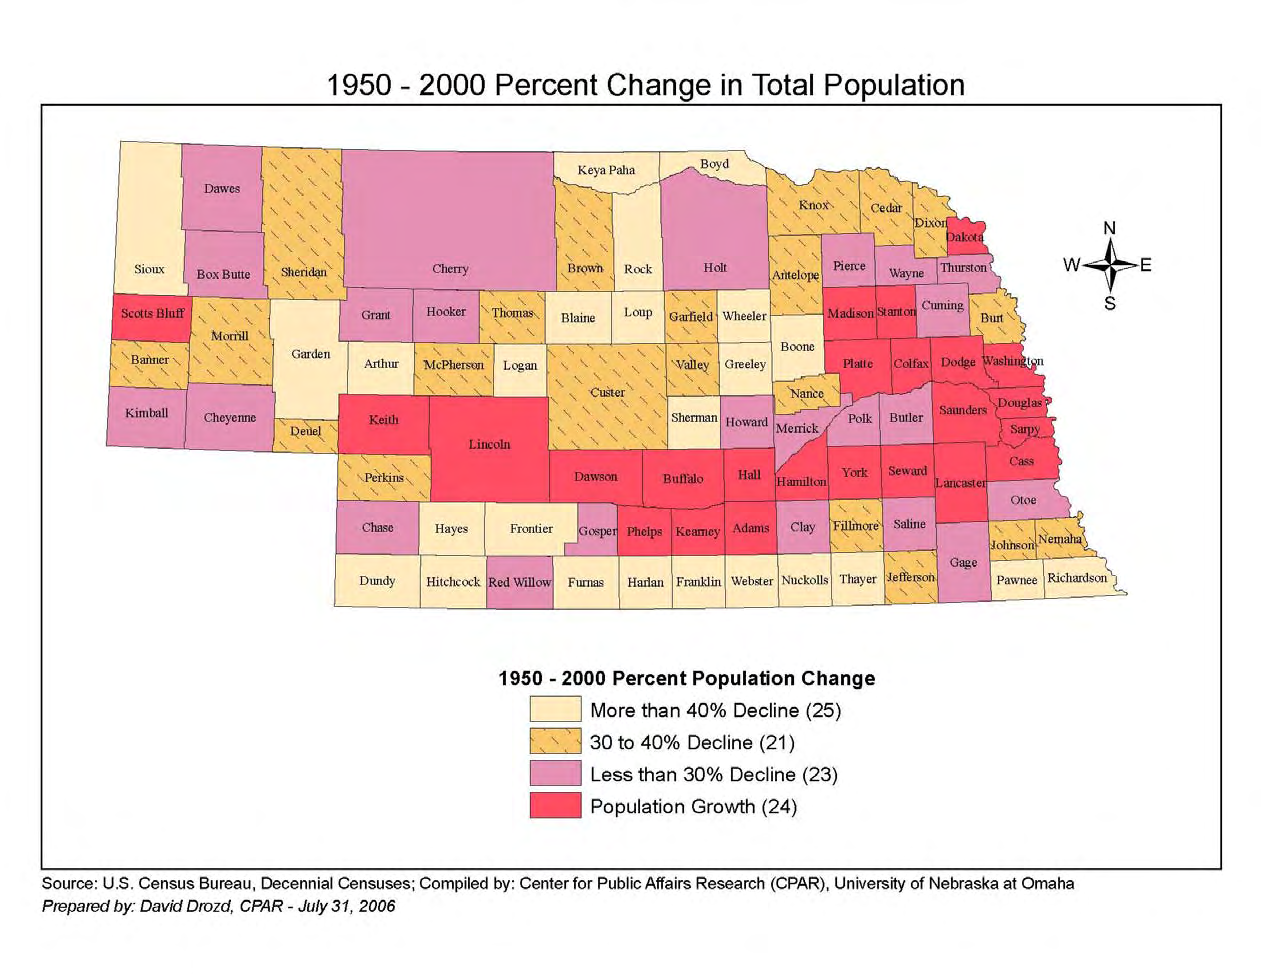
3 TABLE OF CONTENTS Highlights...4 Table 1: Annual Population Estimates and Changes from Previous Year: U.S. and Nebraska...6 Figure 1: July 1 Annual U.S. and Nebraska Population: 1900 to Figure 2: Nebraska Population and Population Change: 1900 to Figure 3: Annual U.S. and Nebraska Percent Population Change: 1900 to Table 2: Nebraska Population and Components of Change: 1930 to Figure 4: Nebraska Births, Deaths, and Natural Change: 1930 to Figure 5: Nebraska Components of Population Change: 1930 to Table 3: Nebraska Population by Sex and Age: Decennial Censuses and July 1, 2006 Estimate...13 Table 4: Nebraska Population Percentages by Sex and Age: Decennial Censuses and July 1, 2006 Estimate...14 Nebraska Population Pyramids by Sex and Five-Year Age Group: 1900 to Table 5: Nebraska County Populations: 1860 to Table 5b: Ranking of Nebraska s 93 Counties by Highest Population: 1860 to 2000 Censuses...24 Table 6: Listing of Nebraska Counties by Year of Highest Census Population...27 Year of Highest Census Population for Nebraska Counties (Map)...28 Table 7: Comparison of 2000 County Population to Population in Highest Census Year Population as a Percentage of the Population in the Highest Census Year (Map)...31 Figure 6: Percentage of Aggregate Population of Nebraska Counties Sorted by Size: Various Censuses Percent Change in Total Population (Map)...33 Table 8: Population Under Age 18 and Percent of the Total Population: 1950 to Table 9: Population Age 65 or Older and Percent of the Total Population: 1950 to
4 Table 10: Females Age 15 to 44 and Percent of the Total Population: 1950 to Table 11: Number of Births and Fertility Rates per 1,000 Women Age 15 to 44: 1950 to Table 12: Number of Births for Nebraska and Its Counties: Table 13: Number of Deaths for Nebraska and Its Counties: Table 14: Natural Change in Nebraska and Its Counties: Table 15: Nebraska Place Populations: Table 16: Number and Percentage of Places, Total Population and Percentage of Population in Places by Size of Place: Figure 7: Percentage of Cities and Towns by Size Category: Various Censuses...99 Figure 8: Percentage of the Population Residing in Cities and Towns by Size Category: Various Censuses
5 HIGHLIGHTS This report shows decennial census counts and annual estimates of the population for Nebraska and its counties and cities. Demographic patterns and trends, including changes in the components of population change, are illustrated. An evaluation of where we have been demographically over time may show us where we are headed as a state. It is important to see how changes have been occurring at both the local and statewide level. A summary of important aspects to note as one peruses the tables and figures in this report follows below: The state s population has grown in 82 of the 106 years between 1900 and Most of the years having population declines occurred during World Wars I and II or during or immediately following the Great Depression. The state s population has grown every year since (Figure 2) The rate of population growth within Nebraska since 2000 has averaged about 0.5 percent annually. This growth rate is similar to the mid 1970s to mid 1980s while annual growth rates were around 1.0 percent during the 1990s. The current rate of growth within Nebraska is about half of the overall U.S. growth rate. The last time the annual growth rate in Nebraska was higher than the overall U.S. average was (Table 1, Figure 3) Nebraska continues to gain population through natural increase the annual number of births being larger than the annual number of deaths. Net migration has tended to vary, with some years having net inmigration, while net outmigration has occurred in other years. The level of net migration is typically lower than that of natural change. (Table 2, Figures 4 and 5) When looking at the percentage of the population of males and females by 5-year age groups, Nebraska had a linear age pyramid in 1900 and 1920, where the percentage declined for increasingly older age groups (lifespan effect). The base of the pyramid started to invert due to lower births during the 1930s before the base was broadened during the baby boom ( ). (Age pyramids) Older age categories (70+) have a larger percentage of the Nebraska population than in past decades. A look at the current 2006 age pyramid shows how the depression cohorts, leading and training edges of the baby boom, and baby boom echo (kids of baby boomers born ) effect these older age groups as well as other groups such as kids under 5 and prospective college students. (Age pyramids) Rankings of Nebraska counties by population show dramatic shifts over the decades. Sarpy County, the third most population county in 2000, only ranked as the 55th most populous county in Conversely, Gage County consistently ranked third highest in the early 20th Century but ranked 14th in Many counties in the western part of the state had low rankings in the early 1900s but increased as the area was settled further. These rankings depict migration and settlement patterns within Nebraska. (Table 5b) A plurality of Nebraska counties peaked in population in either 1920 or 1930, with another third of the counties peaking prior to Only 14 counties grew to have their largest ever population in Each of these counties was either part of a metropolitan area or was considered micropolitan (non-metropolitan with a city of at least 10,000 residents). (Table 6) 4
6 In 2000, 38 counties had less than half of their peak Census population. These counties tended to be located along Nebraska s southern border as well as in the Sand Hills. Additionally, 2000 population counts show about two-thirds of Nebraska counties (63) had less than 70 percent of their peak population. (Table 7 and County Map) One-third of Nebraska s population lived in its 60 smallest counties in 1920, versus only 15 percent in Likewise, the percentage of the population living in the 80 smallest counties went from about 60 percent in 1920 to just over 30 percent in Nebraska s three largest counties (Douglas, Lancaster, and Sarpy) were home to about half of Nebraska residents in 2000, versus only about a quarter residing in the three most populous counties in (Figure 6) Half of Nebraska s counties have lost 30 percent or more of their population since (County Map) All 93 Nebraska counties had a natural increase (births greater than deaths) in calendar years 1950 and 1960 (baby boom). This number dipped to 65 counties in 1970 before rebounding to 84 in 1980 (baby boom echo). More recently, 50 counties had a natural increase in 2000 and less than half of the counties (45) did in (Table 14) One in six Nebraska towns had less than 100 persons in 2000, versus one of every 100 towns being this size in 1910 and (Table 16 and Figure 7) More than 90 percent of Nebraska cities and towns have had fewer than 2,500 residents every decade since However, while these small towns comprised roughly 40 percent of the population residing in towns between 1880 and 1920, they only make up 17.4 percent of citydwellers in (Table 16) The shift to living in larger cities is apparent in the percentage of the city-dwelling population living in towns with 10,000 or more persons having steadily risen since 1920 while steadily falling in towns with fewer than 2,500 residents. (Figure 8) 5
7 Table 1: Annual Population Estimates and Changes from Previous Year: U.S. and Nebraska Population Actual Change Percent Change Year United States Nebraska United States Nebraska United States Nebraska July 1, ,094,000 1,067, July 1, ,585,000 1,078,000 1,491,000 11, July 1, ,160,000 1,089,000 1,575,000 11, July 1, ,632,000 1,104,000 1,472,000 15, July 1, ,165,000 1,119,000 1,533,000 15, July 1, ,820,000 1,129,000 1,655,000 10, July 1, ,437,000 1,138,000 1,617,000 9, July 1, ,000,000 1,149,000 1,563,000 11, July 1, ,709,000 1,161,000 1,709,000 12, July 1, ,492,000 1,177,000 1,783,000 16, July 1, ,407,000 1,198,000 1,915,000 21, July 1, ,868,000 1,216,000 1,461,000 18, July 1, ,331,000 1,232,000 1,463,000 16, July 1, ,227,000 1,246,000 1,896,000 14, July 1, ,118,000 1,264,000 1,891,000 18, July 1, ,549,000 1,272,000 1,431,000 8, July 1, ,966,000 1,275,000 1,417,000 3, July 1, ,266,000 1,285,000 1,300,000 10, July 1, ,203,000 1,266,000-63,000-19, July 1, ,512,000 1,290,000 1,309,000 24, July 1, ,466,000 1,300,000 1,954,000 10, July 1, ,541,000 1,309,000 2,075,000 9, July 1, ,055,000 1,312,000 1,514,000 3, July 1, ,950,000 1,321,000 1,895,000 9, July 1, ,113,000 1,333,000 2,163,000 12, July 1, ,832,000 1,343,000 1,719,000 10, July 1, ,399,000 1,353,000 1,567,000 10, July 1, ,038,000 1,365,000 1,639,000 12, July 1, ,501,000 1,371,000 1,463,000 6, July 1, ,770,000 1,375,000 1,269,000 4, July 1, ,075,000 1,380,000 1,305,000 5, July 1, ,038,000 1,384, ,000 4, July 1, ,839,000 1,386, ,000 2, July 1, ,580,000 1,385, ,000-1, July 1, ,372,000 1,382, ,000-3, July 1, ,251,000 1,375, ,000-7, July 1, ,054,000 1,358, ,000-17, July 1, ,822,000 1,339, ,000-19, July 1, ,824,000 1,326,000 1,002,000-13, July 1, ,884,000 1,318,000 1,060,000-8, July 1, ,955,000 1,316,000 1,071,000-2, July 1, ,417,000 1,272,000 1,462,000-44, July 1, ,670,000 1,245,000 1,253,000-27, July 1, ,697,000 1,235,000 27,000-10, July 1, ,075,000 1,214, ,000-21, July 1, ,387,000 1,210, ,000-4, July 1, ,638,000 1,256,000 7,251,000 46, July 1, ,665,000 1,266,000 3,027,000 10, July 1, ,091,000 1,265,000 2,426,000-1, July 1, ,666,000 1,302,000 2,575,000 37,
8 Population Actual Change Percent Change Year United States Nebraska United States Nebraska United States Nebraska July 1, ,871,000 1,327,000 3,205,000 25, July 1, ,970,000 1,316,000 2,099,000-11, July 1, ,369,000 1,311,000 2,399,000-5, July 1, ,946,000 1,318,000 2,577,000 7, July 1, ,881,000 1,340,000 2,935,000 22, July 1, ,058,000 1,374,000 3,177,000 34, July 1, ,078,000 1,397,000 3,020,000 23, July 1, ,178,000 1,394,000 3,100,000-3, July 1, ,153,000 1,383,000 2,975,000-11, July 1, ,136,000 1,397,000 2,983,000 14, July 1, ,972,000 1,417,000 2,836,000 20, July 1, ,976,000 1,446,000 3,004,000 29, July 1, ,739,000 1,464,000 2,763,000 18, July 1, ,434,000 1,476,000 2,695,000 12, July 1, ,085,000 1,482,000 2,651,000 6, July 1, ,457,000 1,471,000 2,372,000-11, July 1, ,499,000 1,456,000 2,042,000-15, July 1, ,375,000 1,457,000 1,876,000 1, July 1, ,312,000 1,467,000 1,937,000 10, July 1, ,298,000 1,474,000 1,986,000 7, July 1, ,798,722 1,487,963 2,500,722 13, July 1, ,817,509 1,504,208 3,018,787 16, July 1, ,274,882 1,518,293 2,457,373 14, July 1, ,349,205 1,528,517 2,074,323 10, July 1, ,333,635 1,537,809 1,984,430 9, July 1, ,456,585 1,541,440 2,122,950 3, July 1, ,553,859 1,548,901 2,097,274 7, July 1, ,760,875 1,554,466 2,207,016 5, July 1, ,098,244 1,560,826 2,337,369 6, July 1, ,568,579 1,564,356 2,470,335 3, July 1, ,224,719 1,572,296 2,656,140 7, July 1, ,465,744 1,578,517 2,241,025 6, July 1, ,664,432 1,581,776 2,198,688 3, July 1, ,792,014 1,584,293 2,127,582 2, July 1, ,824,907 1,588,638 2,032,893 4, July 1, ,923,734 1,584,661 2,098,827-3, July 1, ,132,831 1,574,328 2,209,097-10, July 1, ,288,936 1,566,544 2,156,105-7, July 1, ,499,004 1,571,477 2,210,068 4, July 1, ,819,222 1,574,858 2,320,218 3, July 1, ,622,814 1,581,660 2,803,592 6, July 1, ,980,941 1,595,919 3,358,127 14, July 1, ,514,224 1,611,687 3,533,283 15, July 1, ,918,588 1,625,590 3,404,364 13, July 1, ,125,821 1,639,041 3,207,233 13, July 1, ,278,393 1,656,992 3,152,572 17, July 1, ,394,284 1,673,740 3,115,891 16, July 1, ,646,925 1,686,418 3,252,641 12, July 1, ,854,104 1,695,816 3,207,179 9, July 1, ,040,168 1,704,764 3,186,064 8,
9 Population Actual Change Percent Change Year United States Nebraska United States Nebraska United States Nebraska July 1, ,216,952 1,713,426 3,176,784 8, July 1, ,226,284 1,719,315 3,009,332 5, July 1, ,125,973 1,727,040 2,899,689 7, July 1, ,796,023 1,737,017 2,670,050 9, July 1, ,638,158 1,746,980 2,842,135 9, July 1, ,507,061 1,758,163 2,868,903 11, July 1, ,398,484 1,768,331 2,891,423 10, Sources: Historical Annual Time Series of State Population Estimates 1900 to 1990: Total Population Internet Release February 1996; Regional Economic Information System, Bureau of Economic Analysis, U.S. Department of Commerce Data as of March 28, 2006: Table 1: Annual Estimates of the Population for the United States and States: April 1, 2000 to July 1, 2006 Population Division, U.S. Census Bureau; Released December 22, United States (millions) Figure 1: July 1 Annual U.S. and Nebraska Population: 1900 to 2006 Nebraska (millions) Sources: Annual Population Estimates, U.S. Census Bureau; REIS, Bureau of Economic Analysis United States Nebraska 8
10 Figure 2: Nebraska Population and Population Change: 1900 to 2006 Population 2,000,000 Population Change 50,000 1,800,000 40,000 1,600,000 30,000 1,400,000 20,000 1,200,000 10,000 1,000, ,000-10, , , ,000-30, ,000-40, , Sources: Annual Population Estimates, U.S. Census Bureau; REIS, Bureau of Economic Analysis Population Change Population Figure 3: Annual U.S. and Nebraska Percent Population Change: 1900 to Percent Change Sources: Annual Population Estimates, U.S. Census Bureau; REIS, Bureau of Economic Analysis Nebraska Year United States 9
11 Table 2: Nebraska Population and Components of Change: Sources: Regional Economic Information System, Bureau of Economic Analysis Vital Statistics, Nebraska Health and Human Services Annual Estimates of the Population, U.S. Census Bureau, Released Estimated July 1 Natural Actual Net Year Population Births Deaths Increase Change Migration Number of Persons ,380,000 27,006 13,280 13,726 5,000-8, ,384,000 26,610 12,905 13,705 4,000-9, ,386,000 25,160 12,923 12,237 2,000-10, ,385,000 24,187 12,925 11,262-1,000-12, ,382,000 25,087 13,372 11,715-3,000-14, ,375,000 23,326 13,179 10,147-7,000-17, ,358,000 23,799 13,756 10,043-17,000-27, ,339,000 22,256 13,200 9,056-19,000-28, ,326,000 22,402 11,960 10,442-13,000-22, ,318,000 22,326 12,188 10,138-8,000-18, ,316,000 22,153 12,593 9,560-2,000-11, ,272,000 22,186 12,203 9,983-44,000-53, ,245,000 23,950 12,293 11,657-27,000-37, ,235,000 25,091 12,956 12,135-10,000-21, ,214,000 24,694 12,560 12,134-21,000-33, ,210,000 24,292 12,446 11,846-4,000-15, ,256,000 27,753 12,365 15,388 46,000 32, ,266,000 32,018 12,823 19,195 10,000-7, ,265,000 31,066 12,569 18,497-1,000-19, ,302,000 31,482 12,607 18,875 37,000 18, ,327,000 31,713 12,548 19,165 25,000 5, ,316,000 33,595 12,880 20,715-11,000-30, ,311,000 33,809 13,056 20,753-5,000-25, ,318,000 32,633 13,298 19,335 7,000-13, ,340,000 33,617 12,741 20,876 22,000 1, ,374,000 34,087 13,001 21,086 34,000 13, ,397,000 33,855 13,161 20,694 23,000 2, ,394,000 33,161 13,797 19,364-3,000-23, ,383,000 32,935 13,680 19,255-11,000-30, ,397,000 34,162 13,887 20,275 14,000-5, ,417,000 34,257 14,071 20,186 20, ,446,000 34,544 13,812 20,732 29,000 8, ,464,000 33,886 14,305 19,581 18,000-2, ,476,000 32,624 14,657 17,967 12,000-6, ,482,000 30,727 14,758 15,969 6,000-10, ,471,000 27,829 14,799 13,030-11,000-25, ,456,000 25,618 14,799 10,819-15,000-26, ,457,000 24,259 14,465 9,794 1,000-9, ,467,000 24,236 15,017 9,219 10, ,474,000 24,801 14,898 9,903 7,000-2,561 10
12 Estimated July 1 Natural Actual Net Year Population Births Deaths Increase Change Migration Number of Persons ,487,963 25,877 15,016 10,861 13,963 3, ,504,208 25,507 15,182 10,325 16,245 5, ,518,293 23,473 15,540 7,933 14,085 4, ,528,517 22,771 14,977 7,794 10,224 2, ,537,809 23,695 15,016 8,679 9,292 1, ,541,440 23,658 14,569 9,089 3,631-5, ,548,901 23,767 14,536 9,231 7,461-1, ,554,466 25,158 14,316 10,842 5,565-4, ,560,826 25,103 14,408 10,695 6,360-4, ,564,356 26,199 14,228 11,971 3,530-7, ,572,296 27,335 14,465 12,870 7,940-4, ,578,517 27,164 14,580 12,584 6,221-6, ,581,776 26,954 14,567 12,387 3,259-9, ,584,293 26,254 14,695 11,559 2,517-9, ,588,638 26,099 14,633 11,466 4,345-7, ,584,661 25,540 14,895 10,645-3,977-15, ,574,328 24,425 14,662 9,763-10,333-20, ,566,544 23,813 14,820 8,993-7,784-17, ,571,477 23,904 14,858 9,046 4,933-4, ,574,858 24,205 14,776 9,429 3,381-5, ,581,660 24,362 14,751 9,611 6,802-2, ,595,919 23,947 14,647 9,300 14,259 4, ,611,687 23,336 14,577 8,759 15,768 6, ,625,590 23,196 14,967 8,229 13,903 5, ,639,041 23,131 14,974 8,157 13,451 5, ,656,992 23,221 15,216 8,005 17,951 9, ,673,740 23,271 15,435 7,836 16,748 8, ,686,418 23,313 15,271 8,042 12,678 4, ,695,816 23,533 15,181 8,352 9,398 1, ,704,764 23,900 15,580 8,320 8, ,713,426 24,643 14,979 9,664 8, ,719,315 24,818 15,171 9,647 5,889-3, ,727,040 25,381 15,721 9,660 7,725-1, ,737,017 25,900 15,439 10,461 9, ,746,980 26,324 14,647 11,677 9,963-1, ,758,163 26,142 14,938 11,204 11,
13 Number Figure 4: Nebraska Births, Deaths, and Natural Change: ,000 35,000 30,000 25,000 20,000 15,000 10,000 5, Source: Vital Statistics, Nebraska Health and Human Services System Births Deaths Natural Change Number Figure 5: Nebraska Components of Population Change: ,000 30,000 20,000 10, , ,000-30,000-40,000-50,000-60, Source: Vital Statistics, Nebraska Health and Human Services System; Annual Estimates, U.S. Census Bureau Net Migration Natural Change 12
14 Table 3: Nebraska Population by Sex and Age: Decennial Censuses and July 1, 2006 Estimate Sources: Decennial Censuses; Annual Estimates of the Population by Sex and Age (released ), U.S. Census Bureau Male All ages 564, , , , , , , , , , , ,754 Under 5 67,836 71,148 73,017 66,742 53,511 71,463 81,711 61,188 62,703 61,407 59,681 65,313 5 to 9 67,291 64,928 71,498 71,931 55,268 56,549 74,761 74,811 60,399 64,659 63,001 60, to 14 61,690 61,594 66,992 69,173 60,398 50,332 65,472 78,362 61,803 60,239 66,180 62, to 19 55,742 63,188 59,625 66,788 63,304 48,605 50,130 71,377 74,437 57,530 69,235 67, to 24 53,374 64,722 58,451 60,298 52,418 49,437 40,513 55,167 74,697 54,477 61,301 69, to 29 47,657 56,370 57,863 52,163 49,358 50,478 41,112 44,302 67,366 62,702 57,373 60, to 34 40,930 46,122 52,355 50,023 47,518 44,877 43,529 38,583 57,398 66,117 56,673 56, to 39 38,246 40,301 48,252 50,976 44,236 44,730 44,088 38,224 44,229 61,638 65,339 57, to 44 33,722 34,077 38,489 46,652 43,017 42,741 40,929 40,439 37,445 52,541 67,281 62, to 49 25,569 30,807 34,617 40,125 42,757 38,761 39,518 40,444 36,065 40,180 61,050 66, to 54 22,302 28,814 29,779 34,386 40,001 37,897 37,378 36,967 37,910 33,733 51,556 61, to 59 17,168 20,326 24,653 27,577 33,023 35,724 33,768 34,605 36,566 32,400 38,280 52, to 64 12,396 15,980 20,864 22,815 26,405 31,322 30,766 31,737 31,490 32,481 30,771 36, to 69 9,079 12,438 14,239 18,632 21,276 25,164 27,872 25,511 27,847 29,799 27,728 28, to 74 5,501 7,813 10,025 13,993 15,433 17,683 22,196 21,252 22,608 22,811 25,337 23, to 79 3,045 4,707 6,385 7,825 9,932 11,800 14,424 15,849 15,678 17,380 20,320 20, to 84 1,371 2,040 2,821 3,944 5,475 6,385 7,551 9,605 9,836 11,287 12,683 14, ,255 1,872 2,458 3,384 4,308 6,032 7,417 8,058 9,562 11,697 Unknown 1,160 1,465 1, Female All ages 501, , , , , , , , , , , ,577 Under 5 65,911 68,948 70,223 63,595 51,035 68,706 78,496 59,034 60,243 58,199 57,367 62,352 5 to 9 65,507 63,158 69,082 69,556 53,284 54,256 72,650 72,417 57,646 61,742 60,444 57, to 14 60,053 60,188 65,116 67,166 58,035 47,378 62,735 74,607 59,104 57,144 62,754 59, to 19 54,535 61,330 59,427 65,312 61,797 48,660 50,153 71,798 72,812 55,330 65,674 63, to 24 48,879 58,382 58,364 60,490 54,921 49,440 42,461 59,520 74,037 54,172 59,030 66, to 29 40,497 49,202 55,625 52,207 50,687 48,657 41,513 44,751 67,428 62,516 54,676 56, to 34 34,185 40,014 48,408 49,578 48,035 45,752 43,290 39,348 57,009 65,873 54,551 53, to 39 30,080 34,823 41,866 48,835 44,506 44,931 43,751 39,550 44,195 62,140 64,688 55, to 44 25,866 28,922 34,486 43,204 42,925 42,420 41,875 40,868 37,905 52,493 66,526 61, to 49 20,329 25,111 29,493 36,690 41,321 38,746 40,176 40,558 37,732 40,488 61,664 66, to 54 17,017 21,775 24,516 30,305 37,718 37,950 38,358 38,994 38,946 34,988 51,484 61, to 59 13,370 16,150 19,869 24,464 30,222 35,066 35,065 37,183 38,538 34,881 39,304 53, to 64 9,732 13,094 16,555 19,968 24,502 30,253 32,976 35,133 36,038 35,247 33,185 38, to 69 6,755 10,022 11,881 15,799 19,976 24,823 30,602 30,849 33,634 34,264 31,663 31, to 74 4,430 6,304 8,404 11,532 14,131 17,990 24,479 27,609 29,932 30,769 30,971 28, to 79 2,417 3,742 5,484 7,009 9,119 12,207 17,045 22,189 24,309 26,845 27,671 26, to 84 1,137 1,830 2,562 3,639 5,152 6,791 9,523 14,321 18,096 20,711 21,869 22, ,285 1,949 2,680 4,152 6,156 10,309 16,327 21,144 24,391 27,431 Unknown Total All ages 1,066,300 1,192,214 1,296,372 1,377,963 1,315,834 1,325,510 1,411,330 1,483,493 1,569,825 1,578,385 1,711,263 1,768,331 Under 5 133, , , , , , , , , , , ,665 5 to 9 132, , , , , , , , , , , , to , , , , ,433 97, , , , , , , to , , , , ,101 97, , , , , , , to , , , , ,339 98,877 82, , , , , , to 29 88, , , , ,045 99,135 82,625 89, , , , , to 34 75,115 86, ,763 99,601 95,553 90,629 86,819 77, , , , , to 39 68,326 75,124 90,118 99,811 88,742 89,661 87,839 77,774 88, , , , to 44 59,588 62,999 72,975 89,856 85,942 85,161 82,804 81,307 75, , , , to 49 45,898 55,918 64,110 76,815 84,078 77,507 79,694 81,002 73,797 80, , , to 54 39,319 50,589 54,295 64,691 77,719 75,847 75,736 75,961 76,856 68, , , to 59 30,538 36,476 44,522 52,041 63,245 70,790 68,833 71,788 75,104 67,281 77, , to 64 22,128 29,074 37,419 42,783 50,907 61,575 63,742 66,870 67,528 67,728 63,956 75, to 69 15,834 22,460 26,120 34,431 41,252 49,987 58,474 56,360 61,481 64,063 59,391 60, to 74 9,931 14,117 18,429 25,525 29,564 35,673 46,675 48,861 52,540 53,580 56,308 52, to 79 5,462 8,449 11,869 14,834 19,051 24,007 31,469 38,038 39,987 44,225 47,991 46, to 84 2,508 3,870 5,383 7,583 10,627 13,176 17,074 23,926 27,932 31,998 34,552 36, ,019 1,875 2,540 3,821 5,138 7,536 10,464 16,341 23,744 29,202 33,953 39,128 Unknown 1,662 1,969 2,
15 Table 4: Nebraska Population Percentages by Sex and Age: Decennial Censuses and July 1, 2006 Estimate Sources: Decennial Censuses; Annual Estimates of the Population by Sex and Age (released ), U.S. Census Bureau Male All ages Under to to to to to to to to to to to to to to to to Female All ages Under to to to to to to to to to to to to to to to to Total All ages Under to to to to to to to to to to to to to to to to
16 Age Group to to Nebraska Population by Sex and Five-Year Age Group 70 to to to to to to to to to to to to to 14 5 to 9 Under 5 Male Female Source: Decennial Census, U.S. Census Bureau Percent of Total Population Age Group to to Nebraska Population by Sex and Five-Year Age Group 70 to to to to to to to to to to to to to 14 5 to 9 Under 5 Male Female Source: Decennial Census, U.S. Census Bureau Percent of Total Population 15
17 Age Group to to Nebraska Population by Sex and Five-Year Age Group 70 to to to to to to to to to to to to to 14 5 to 9 Under 5 Male Female Source: Decennial Census, U.S. Census Bureau Percent of Total Population Age Group to to Nebraska Population by Sex and Five-Year Age Group 70 to to to to to to to to to to to to to 14 5 to 9 Under 5 Male Female Source: Decennial Census, U.S. Census Bureau Percent of Total Population 16
18 1940 Nebraska Population by Sex and Five-Year Age Group Age Group to to to to to to to to to to to to to to to 14 5 to 9 Under 5 Male Female Percent of Total Population Source: Decennial Census, U.S. Census Bureau Green lines depict the depression cohort. Age Group to to to Nebraska Population by Sex and Five-Year Age Group 65 to to to to to to to to to to to to 14 5 to 9 Under 5 Male Female Percent of Total Population Green lines depict the depression cohort; Source: Decennial Census, U.S. Census Bureau red checker shows the "baby boom". 17
19 1960 Nebraska Population by Sex and Five-Year Age Group Age Group to to to to to to to to to to to to to to to 14 5 to 9 Under 5 Male Female Source: Decennial Census, U.S. Census Bureau Percent of Total Population Green lines depict the depression cohort; red checker shows the "baby boom". Age Group to to to Nebraska Population by Sex and Five-Year Age Group 65 to to to to to to to to to to to to 14 5 to 9 Under 5 Male Female Percent of Total Population Green lines depict the depression cohort; Source: Decennial Census, U.S. Census Bureau red checker shows the "baby boom". 18
20 Age Group to to Nebraska Population by Sex and Five-Year Age Group 70 to to to to to to to to to to to to to 14 5 to 9 Under 5 Male Female Source: Decennial Census, U.S. Census Bureau Percent of Total Population Green lines depict the depression cohort; red checker shows the "baby boom"; pink represents the "baby boom echo". Age Group to to Nebraska Population by Sex and Five-Year Age Group 70 to to to to to to to to to to to to to 14 5 to 9 Under 5 Male Female Percent of Total Population Green lines depict the depression cohort; red checker shows Source: Decennial Census, U.S. Census Bureau the "baby boom"; pink represents the "baby boom echo". 19
21 Age Group to to Nebraska Population by Sex and Five-Year Age Group 70 to to to to to to to to to to to to to 14 5 to 9 Under 5 Male Female Source: Decennial Census, U.S. Census Bureau Percent of Total Population Green lines depict the depression cohort; red checker shows the "baby boom"; pink represents the "baby boom echo". Age Group to to Nebraska Population by Sex and Five-Year Age Group 70 to to to to to to to to to to to to to 14 5 to 9 Under 5 Male Female Percent of Total Population Green lines depict the depression cohort; red checker shows Source: Annual Estimates Program, Decennial Census, U.S. Census Bureau the "baby boom"; pink represents the "baby boom echo". 20
22 Table 5: Nebraska County Populations: 1860 to 2000 Source: Decennial Censuses, U.S. Census Bureau State/ County Nebraska 1 1,711,265 1,578,417 1,569,825 1,485,333 1,411,330 1,325,510 1,315,834 1,377,963 1,296,372 1,192,214 1,066,300 1,058, , ,993 28,841 Adams 31,151 29,625 30,656 30,553 28,944 28,855 24,576 26,275 22,621 20,900 18,840 24,303 10, Antelope 7,452 7,965 8,675 9,047 10,176 11,624 13,289 15,206 15,243 14,003 11,344 10,399 3, Arthur ,045 1,344 1, Banner ,034 1,269 1,325 1,403 1,676 1,435 1,444 1,114 2, Blaine ,016 1,203 1,538 1,584 1,778 1, , Boone 6,259 6,667 7,391 8,190 9,134 10,721 12,127 14,738 14,146 13,145 11,689 8,683 4, Box Butte 12,158 13,130 13,696 10,094 11,688 12,279 10,736 11,861 8,407 6,131 5,572 5, Boyd 2,438 2,835 3,331 3,752 4,513 4,911 6,060 7,169 8,243 8,826 7, Brown 3,525 3,657 4,377 4,021 4,436 5,164 5,962 5,772 6,749 6,083 3,470 4, Buffalo 42,259 37,447 34,797 31,222 26,236 25,134 23,655 24,338 23,787 21,907 20,254 22,162 7, Burt 7,791 7,868 8,813 9,247 10,192 11,536 12,546 13,062 12,559 12,726 13,040 11,069 6,937 2, Butler 4 8,767 8,601 9,330 9,461 10,312 11,432 13,106 14,410 14,606 15,403 15,703 15,454 9,194 1, Cass 24,334 21,318 20,297 18,076 17,821 16,361 16,992 17,684 18,029 19,786 21,330 24,080 16,683 8,151 3,369 Cedar 9,615 10,131 11,375 12,192 13,368 13,843 15,126 16,427 16,225 15,191 12,467 7,028 2,899 1, Chase 4,068 4,381 4,758 4,129 4,317 5,176 5,310 5,484 4,939 3,613 2,559 4, Cherry 6,148 6,307 6,758 6,846 8,218 8,397 9,637 10,898 11,753 10,414 6,541 6, Cheyenne 9,830 9,494 10,057 10,778 14,828 12,081 9,505 10,187 8,405 4,551 5,570 5,693 1, Clay 7,039 7,123 8,106 8,266 8,717 8,700 10,445 13,571 14,486 15,729 15,735 16,310 11, Colfax 10,441 9,139 9,890 9,498 9,595 10,010 10,627 11,434 11,624 11,610 11,211 10,453 6,588 1,424 0 Cuming 10,203 10,117 11,664 12,034 12,435 12,994 13,562 14,327 13,769 13,782 14,584 12,265 5,569 2, Custer 11,793 12,270 13,877 14,092 16,517 19,170 22,591 26,189 26,407 25,668 19,758 21,677 2, Dakota 20,253 16,742 16,573 13,137 12,168 10,401 9,836 9,505 7,694 6,564 6,286 5,386 3,213 2, Dawes 9,060 9,021 9,609 9,761 9,536 9,708 10,128 11,493 10,160 8,254 6,215 9, Dawson 24,365 19,940 22,304 19,771 19,405 19,393 17,890 17,875 16,004 15,961 12,214 10,129 2, Deuel 2,098 2,237 2,462 2,717 3,125 3,330 3,580 3,992 3,282 1,786 2,630 2, Dixon 6,339 6,143 7,137 7,453 8,106 9,129 10,413 11,586 11,815 11,477 10,535 8,084 4,177 1, Dodge 36,160 34,500 35,847 34,782 32,471 26,265 23,799 25,273 23,197 22,145 22,298 19,260 11,263 4, Douglas 463, , , , , , , , , , , ,008 37,645 19,982 4,328 Dundy 2,292 2,582 2,861 2,926 3,570 4,354 5,122 5,610 4,869 4,098 2,434 4, Fillmore 6,634 7,103 7,920 8,137 9,425 9,610 11,417 12,971 13,671 14,674 15,087 16,022 10, Franklin 3,574 3,938 4,377 4,566 5,449 7,096 7,740 9,094 10,067 10,303 9,455 7,693 5, Frontier 3,099 3,101 3,647 3,982 4,311 5,282 6,417 8,114 8,540 8,572 8,781 8,
23 State/ County Furnas 5,324 5,553 6,486 6,897 7,711 9,385 10,098 12,140 11,657 12,083 12,373 9,840 6, Gage 22,993 22,794 24,456 25,731 26,818 28,052 29,588 30,242 29,721 30,325 30,051 36,344 13,164 3, Garden 2,292 2,460 2,802 2,929 3,472 4,114 4,680 5,099 4,572 3, Garfield 1,902 2,141 2,363 2,411 2,699 2,912 3,444 3,207 3,496 3,417 2,127 1, Gosper 2,143 1,928 2,140 2,178 2,489 2,734 3,687 4,287 4,669 4,933 5,301 4,816 1, Grant ,019 1,009 1,057 1,327 1,427 1,486 1, Greeley 2,714 3,006 3,462 4,000 4,595 5,575 6,845 8,442 8,685 8,047 5,691 4,869 1, Hall 53,534 48,925 47,690 42,851 35,757 32,186 27,523 27,117 23,720 20,361 17,206 16,513 8,572 1, Hamilton 9,403 8,862 9,301 8,867 8,714 8,778 9,982 12,159 13,237 13,459 13,330 14,096 8, Harlan 3,786 3,810 4,292 4,357 5,081 7,189 7,130 8,957 9,220 9,578 9,370 8,158 6, Hayes 1,068 1,222 1,356 1,530 1,919 2,404 2,958 3,603 3,327 3,011 2,708 3, Hitchcock 3,111 3,750 4,079 4,051 4,829 5,867 6,404 7,269 6,045 5,415 4,409 5,799 1, Holt 11,551 12,599 13,552 12,933 13,722 14,859 16,552 16,509 17,151 15,545 12,224 13,672 3, Hooker ,130 1,061 1,253 1,180 1, Howard 2 6,567 6,057 6,773 6,807 6,541 7,226 8,422 10,020 10,739 10,783 10,343 9,430 4, Jefferson 8,333 8,759 9,817 10,436 11,620 13,623 15,532 16,409 16,140 16,852 15,196 14,850 8,096 2,440 0 Johnson 4,488 4,673 5,285 5,743 6,281 7,251 8,662 9,157 8,940 10,187 11,197 10,333 7,595 3, Kearney 6,882 6,629 7,053 6,707 6,580 6,409 6,854 8,094 8,583 9,106 9,866 9,061 4, Keith 8,875 8,584 9,364 8,487 7,958 7,449 8,333 6,721 5,294 3,692 1,951 2, Keya Paha 983 1,029 1,301 1,340 1,672 2,160 3,235 3,203 3,594 3,452 3,076 3, Kimball 4,089 4,108 4,882 6,009 7,975 4,283 3,913 4,675 4,498 1, Knox 2 9,374 9,564 11,457 11,723 13,300 14,820 16,478 19,110 18,894 18,358 14,343 8,582 3, Lancaster 250, , , , , , , ,324 85,902 73,793 64,835 76,395 28,090 7, Lincoln 34,632 32,508 36,455 29,538 28,491 27,380 25,425 25,627 23,420 15,684 11,416 10,441 3, Logan ,108 1,357 1,742 2,014 1,596 1, , Loup ,097 1,348 1,777 1,818 1,946 2,188 1,305 1, McPherson ,175 1,358 1,692 2, Madison 35,226 32,655 31,382 27,402 25,145 24,338 24,269 26,037 22,511 19,101 16,976 13,669 5,589 1,133 0 Merrick 2 8,204 8,049 8,945 8,751 8,363 8,812 9,354 10,619 10,763 10,379 9,255 8,758 5, Morrill 5,440 5,423 6,085 5,813 7,057 8,263 9,436 9,950 9,151 4, Nance 4,038 4,275 4,740 5,142 5,635 6,512 7,653 8,718 8,712 8,926 8,222 5,773 1, Nemaha 7,576 7,980 8,367 8,976 9,099 10,973 12,781 12,356 12,547 13,095 14,952 12,930 10,451 7,593 3,139 Nuckolls 5,057 5,786 6,726 7,404 8,217 9,609 10,446 12,629 13,236 13,019 12,414 11,417 4, Otoe 15,396 14,252 15,183 15,576 16,503 17,056 18,994 19,901 19,494 19,323 22,288 25,403 15,727 12,345 4,211 Pawnee 3,087 3,317 3,937 4,473 5,356 6,744 8,514 9,423 9,578 10,582 11,770 10,340 6,920 4, Perkins 3,200 3,367 3,637 3,423 4,189 4,809 5,197 5,834 3,967 2,570 1,702 4, Phelps 9,747 9,715 9,769 9,553 9,800 9,048 8,452 9,261 9,900 10,451 10,772 9,869 2,
24 State/ County Pierce 7,857 7,827 8,481 8,493 8,722 9,405 10,211 11,080 10,681 10,122 8,445 4,864 1, Platte 4 31,662 29,820 28,852 26,544 23,992 19,910 20,191 21,181 19,464 19,006 17,747 15,437 9,511 1, Polk 2 5,639 5,668 6,320 6,468 7,210 8,044 8,748 10,092 10,714 10,521 10,542 10,817 6, Red Willow 4 11,450 11,705 12,615 12,191 12,940 12,977 11,951 13,859 11,434 11,056 9,604 8,837 3, Richardson 9,531 9,937 11,315 12,277 13,903 16,886 19,178 19,826 18,968 17,448 19,614 17,574 15,031 9,780 2,835 Rock 1,756 2,019 2,383 2,231 2,554 3,026 3,977 3,366 3,703 3,627 2,809 3, Saline 13,843 12,715 13,131 12,809 12,542 14,046 15,010 16,356 16,514 17,866 18,252 20,097 14,491 3, Sarpy 122, ,583 86,015 66,200 31,281 15,693 10,835 10,402 9,370 9,274 9,080 6,875 4,481 2,913 1,201 Saunders 19,830 18,285 18,716 17,018 17,270 16,923 17,892 20,167 20,589 21,179 22,085 21,577 15,810 4,547 0 Scotts Bluff 36,951 36,025 38,344 36,432 33,809 33,939 33,917 28,644 20,710 8,355 2,552 1, Seward 16,496 15,450 15,789 14,460 13,581 13,155 14,167 15,938 15,867 15,895 15,690 16,140 11,147 2,953 0 Sheridan 6,198 6,750 7,544 7,285 9,049 9,539 9,869 10,793 9,625 7,328 6,033 8, Sherman 3,318 3,718 4,226 4,725 5,382 6,421 7,764 9,122 8,877 8,278 6,550 6,399 2, Sioux 1,475 1,549 1,845 2,034 2,575 3,124 4,001 4,667 4,528 5,599 2,055 2, Stanton 6,455 6,244 6,549 5,758 5,783 6,387 6,887 7,809 7,756 7,542 6,959 4,619 1, Thayer 6,055 6,635 7,582 7,779 9,118 10,563 12,262 13,684 13,976 14,775 14,325 12,738 6, Thomas ,078 1,206 1,553 1,510 1,773 1, Thurston 7,171 6,936 7,186 6,942 7,237 8,590 10,243 10,462 9,589 8,704 6,517 3, Valley 4,647 5,169 5,633 5,783 6,590 7,252 8,163 9,533 9,823 9,480 7,339 7,092 2, Washington 18,780 16,607 15,508 13,310 12,103 11,511 11,578 12,095 12,180 12,738 13,086 11,869 8,631 4,452 1,249 Wayne 9,851 9,364 9,858 10,400 9,959 10,129 9,880 10,566 9,725 10,397 9,862 6, Webster 4,061 4,279 4,858 5,396 6,224 7,395 8,071 10,210 10,922 12,008 11,619 11,210 7, Wheeler ,060 1,051 1,297 1,526 2,170 2,335 2,531 2,292 1,362 1, York 14,598 14,428 14,798 13,685 13,724 14,346 14,874 17,239 17,146 18,721 18,205 17,279 11, The state counts are final resident counts. In December 2000, the Census Bureau released Nebraska's reapportionment count at 1,715,369. This number includes persons who are U.S. military or federal employees and their dependents stationed overseas and who listed Nebraska as their home state. 2 The 1990 population totals for Nebraska as well as Howard, Knox, Merrick, and Polk Counties are corrected counts. The Census Bureau issued corrected population counts for these areas after the original 1990 counts and associated data products were published. Other detailed population tabulations were not revised to reflect the corrections, so the final counts reported here will differ slightly from the population totals in other tabulations. 3 The state total is more than the sum of the counties because several areas never had a legal existence and were dropped or reorganized in subsequent years. 4 The 2000 Census figure for Red Willow County was corrected, resulting in an increase of 2 people. The 2000 population counts listed do not reflect a change in the boundary between Platte and Butler Counties which took effect Jan. 1, This boundary change would effect the Census figures as follows: Butler gains 96 people while Platte loses
25 Table 5b: Ranking of Nebraska's 93 Counties by Highest Population: 1860 to 2000 Censuses County Adams Antelope Arthur Banner Blaine Boone Box Butte Boyd Brown Buffalo Burt Butler Cass Cedar Chase Cherry Cheyenne Clay Colfax Cuming Custer Dakota Dawes Dawson Deuel Dixon Dodge Douglas Dundy Fillmore Franklin
26 County Frontier Furnas Gage Garden Garfield Gosper Grant Greeley Hall Hamilton Harlan Hayes Hitchcock Holt Hooker Howard Jefferson Johnson Kearney Keith Keya Paha Kimball Knox Lancaster Lincoln Logan Loup McPherson Madison Merrick Morrill Nance Nemaha
27 County Nuckolls Otoe Pawnee Perkins Phelps Pierce Platte Polk Red Willow Richardson Rock Saline Sarpy Saunders Scotts Bluff Seward Sheridan Sherman Sioux Stanton Thayer Thomas Thurston Valley Washington Wayne Webster Wheeler York
28 Table 6: Listing of Nebraska Counties by Year of Highest Census Population Census Year (Number of Counties Having Highest Census Population) 1890 (10) 1900 (11) 1910 (12) 1920 (18) 1930 (21) 1940 (1) 1960 (2) 1980 (4) 2000 (14) Banner Butler Boyd Antelope Boone Rock Cheyenne Box Butte Adams Clay Cuming Franklin Arthur Burt Kimball Keith Buffalo Fillmore Frontier Harlan Blaine Cedar Lincoln Cass Gage Furnas Howard Brown Chase Scotts Bluff Dakota Hamilton Gosper Jefferson Cherry Dawes Dawson Hayes Johnson Loup Colfax Deuel Dodge Keya Paha Kearney McPherson Custer Dundy Douglas Otoe Nemaha Nance Dixon Garden Hall Polk Pawnee Sioux Garfield Hitchcock Lancaster Saline Phelps Thayer Grant Knox Madison Saunders Webster Greeley Logan Platte York Holt Morrill Sarpy Hooker Perkins Seward Merrick Pierce Washington Nuckolls Red Willow Thomas Richardson Valley Sheridan Wheeler Sherman Stanton Thurston Wayne 27

29 28
30 Table 7: Comparison of 2000 County Population to Population in Highest Census Year Source: Decennial Censuses, U.S. Census Bureau County Name 2000 Population Highest Recorded Population Year of Highest Population 2000 Population as a Percent of Highest Population Rank of 2000 Percentage Adams 31,151 31, Antelope 7,452 15, Arthur 444 1, Banner 819 2, Blaine 583 1, Boone 6,259 14, Box Butte 12,158 13, Boyd 2,438 8, Brown 3,525 6, Buffalo 42,259 42, Burt 7,791 13, Butler 8,767 15, Cass 24,334 24, Cedar 9,615 16, Chase 4,068 5, Cherry 6,148 11, Cheyenne 9,830 14, Clay 7,039 16, Colfax 10,441 11, Cuming 10,203 14, Custer 11,793 26, Dakota 20,253 20, Dawes 9,060 11, Dawson 24,365 24, Deuel 2,098 3, Dixon 6,339 11, Dodge 36,160 36, Douglas 463, , Dundy 2,292 5, Fillmore 6,634 16, Franklin 3,574 10, Frontier 3,099 8, Furnas 5,324 12, Gage 22,993 36, Garden 2,292 5, Garfield 1,902 3, Gosper 2,143 5, Grant 747 1, Greeley 2,714 8, Hall 53,534 53, Hamilton 9,403 14, Harlan 3,786 9, Hayes 1,068 3, Hitchcock 3,111 7,
31 County Name 2000 Population Highest Recorded Population Year of Highest Population 2000 Population as a Percent of Highest Population Rank of 2000 Percentage Holt 11,551 17, Hooker 783 1, Howard 6,567 10, Jefferson 8,333 16, Johnson 4,488 11, Kearney 6,882 9, Keith 8,875 9, Keya Paha 983 3, Kimball 4,089 7, Knox 9,374 19, Lancaster 250, , Lincoln 34,632 36, Logan 774 2, Loup 712 2, McPherson 533 2, Madison 35,226 35, Merrick 8,204 10, Morrill 5,440 9, Nance 4,038 8, Nemaha 7,576 14, Nuckolls 5,057 13, Otoe 15,396 25, Pawnee 3,087 11, Perkins 3,200 5, Phelps 9,747 10, Pierce 7,857 11, Platte 31,662 31, Polk 5,639 10, Red Willow 11,450 13, Richardson 9,531 19, Rock 1,756 3, Saline 13,843 20, Sarpy 122, , Saunders 19,830 22, Scotts Bluff 36,951 38, Seward 16,496 16, Sheridan 6,198 10, Sherman 3,318 9, Sioux 1,475 5, Stanton 6,455 7, Thayer 6,055 14, Thomas 729 1, Thurston 7,171 10, Valley 4,647 9, Washington 18,780 18, Wayne 9,851 10, Webster 4,061 12, Wheeler 886 2, York 14,598 18,
32 31
33 Figure 6: Percentage of Aggregate Population of Nebraska Counties Sorted by Size: Various Censuses , 48.3, 35.9, Percentage of aggregate population , 3.3, 2.0, , 13.0, 8.3, , 27.3, 18.7, , 67.2, 56.9, Cumulative number of counties sorted from smallest to largest The figures shown represent the percentages in 1920, 1950, 1980, and 2000 respectively
34 33
NHPCA member hospices serve these Nebraska counties:
 MEMBER HOSPICE DIRECTORY SUMMER 2012 3900 NW 12 Street, Suite 100, NE 68521 Phone: 402/477-0204 Fax: 402/475-6289 info@nehospice.org nehospice.org NHPCA member hospices serve these Nebraska : Adams Antelope
Community Colleges' Role and Mission
 Community s' Role and Mission Community colleges provide educational options for students seeking entry-level career training. The education program may culminate in an applied technology associate degree,
Mary Niemiec Associate Vice President for Distance Education Director, University of Nebraska Online Worldwide
 Mary Niemiec Associate Vice President for Distance Education Director, University of Nebraska Online Worldwide Modules Synchronous Flipped Blended Degrees Distance Educa,on Asynchronous Noncredit Online
Emergency Medical Services of Nebraska Ambulance Services Needs Assessment
 Emergency Medical Services of Nebraska Ambulance Services Needs Assessment April 2010 Author: Michelle Mason, M.A. Prepared for the Emergency Medical Services (EMS)/Trauma Program at the Nebraska Department
Beginning Farmer Tax Credit Act
 Beginning Farmer Tax Credit Act Annual Report July, 008 June 30, 009 Nebraska Department of Agriculture Beginning Farmer Program Intentionally left blank Beginning Farmer Program Annual Report Table of
Juvenile Justice Institute. State of Juvenile Justice 2014
 Juvenile Justice Institute State of Juvenile Justice 214 INTRODUCTION The 214 State of Juvenile Justice Report provides a snapshot of the juvenile justice system in Nebraska, with a specific focus on
2015-2018 SALARY RECOMMENDATIONS FOR COUNTY OFFICIALS
 2015-2018 SALARY RECOMMENDATIONS FOR COUNTY OFFICIALS NEBRASKA ASSOCIATION OF COUNTY OFFICIALS OCTOBER 2013 TABLE OF CONTENTS ACKNOWLEDGMENT... 1 COMMITTEE MAKE-UP... 1 INTRODUCTION... 2 NEBRASKA CONSTITUTION
2014 Nebraska Farm Custom Rates Part I
 Know how. Know now. EC2 (Revised May ) Nebraska Farm Custom Rates Part I Roger K. Wilson, Extension Farm Management Specialist Every two years a survey of custom operators is conducted to determine the
Deer-Vehicle Collision Information Kit
 Deer-Vehicle Collision Information Kit Nebraska Game and Parks Commission 2200 N. 33rd St Lincoln, NE 68503 (402) 471-0641 Use Caution to Avoid Deer-Vehicle Collisions LINCOLN, Neb. Deer become more active
Bureau of the Census
 Bureau of the Census RG513 & film United States. Bureau of the Census Records: 1854-1930 Cubic ft.: 10 No. of Vols: 30 volumes and 23 volumes on 15 reels of 35mm microfilm; State & Federal census Records
STATE OF NEBRASKA ATTESTATION REVIEW OF THE SEPTEMBER 1, 2007, THROUGH SEPTEMBER 30, 2009
 STATE OF NEBRASKA ATTESTATION REVIEW OF THE COORDINATING COMMISSION FOR POSTSECONDARY EDUCATION, THE DEPARTMENT OF REVENUE, AND THE DEPARTMENT OF ADMINISTRATIVE SERVICES DISTRIBUTION OF STATE AID TO COMMUNITY
The Basics of Nebraska s Property Tax. An LRO Backgrounder
 The Basics of Nebraska s Property Tax C re di ts Ta Pr x op ab er le ty An LRO Backgrounder Le vy Va l ua ti on The Basics of Nebraska s Property Tax January 2015 Prepared by: Keisha Patent Legal Counsel
A consumer controlled council committed to ensuring quality rehabilitation services. Report of the Nebraska. State Rehabilitation Council
 A consumer controlled council committed to ensuring quality rehabilitation services Report of the Nebraska State Rehabilitation Council 2 0 1 4-2 0 1 5 Contact information: The State Rehabilitation Council
The Nebraska Public Service Commission and General Admasion
 Page 8761 Chair Anne Boyle called the regularly scheduled meeting to order at 10:01 a.m. with Commissioners Anne Boyle, Rod Johnson, Frank Landis, and Tim Schram present, and Commissioner Gerald Vap excused.
Name Street Address City State Zip Code County Phone Number. Adams Primary Care 620 Main St Adams NE 68301 Gage (402) 988-2188
 988-2188") Adams Primary Care 620 Main St Adams NE 68301 Gage (402) 988-2188 Ainsworth Family Clinic 913 E Zero St Ainsworth NE 69210 Brown (402) 387-1900 Akron Mercy Medical Clinic 321 Mill St Akron IA 51001 Plymouth
Adams Primary Care 620 Main St Adams NE 68301 Gage (402) 988-2188 Ainsworth Family Clinic 913 E Zero St Ainsworth NE 69210 Brown (402) 387-1900 Akron Mercy Medical Clinic 321 Mill St Akron IA 51001 Plymouth
Nebraska Parenting Act Information Brochure
 Nebraska Parenting Act Information Brochure Information to help parents involved in divorce, separation and other custody matters to learn about Nebraska s: legal process divorce timeline requirements
NEBRASKA S IMMIGRANT POPULATION ECONOMIC AND FISCAL IMPACTS
 NEBRASKA S IMMIGRANT POPULATION ECONOMIC AND FISCAL IMPACTS Prepared by Christopher S. Decker, Ph.D. Associate Professor Department of Economics and Real Estate College of Business Administration University
Nebraska RN Survey Report 2011 Based on 2010 License Renewal Data
 Nebraska RN Survey Report 2011 Based on 2010 License Renewal Data by Nebraska Center for Nursing Nebraska Department of Health and Human Services Joann Schaefer, M.D., Chief Medical Officer, Director,
The GPE Success Story: The Positive Public Health Impact of the Graduate Psychology Education Program
 The GPE Success Story: The Positive Public Health Impact of the Graduate Psychology Education Program Alex Ross, ScD, Health Resources and Services Administration Bruce Rybarczyk, PhD, ABPP, Virginia Commonwealth
Digging Deeper in Shallow Pockets II: Examining Property Tax Burden Disparity among Nebraska Residents
 Digging Deeper in Shallow Pockets II: Examining Property Tax Burden Disparity among Nebraska Residents Contents Introduction Disparity among the Rich and Poor Policy Implications and Recommendations Footnotes
Nebraska Emergency Management/ Homeland Security Program 2014 STATE PREPAREDNESS REPORT
 Nebraska Emergency Management/ Homeland Security Program 2014 STATE PREPAREDNESS REPORT The State of Nebraska s annual report on the priorities, goals and objectives supporting the National Preparedness
For Individuals and Families
 For Individuals and Families Simple and Affordable. You re Covered Iowa, Nebraska, South Dakota Gold, Silver, Bronze, Catastrophic POS PPO HMO a Simple and affordable. You re Covered care when you need
Projections of the Size and Composition of the U.S. Population: 2014 to 2060 Population Estimates and Projections
 Projections of the Size and Composition of the U.S. Population: to Population Estimates and Projections Current Population Reports By Sandra L. Colby and Jennifer M. Ortman Issued March 15 P25-1143 INTRODUCTION
Table of Contents. Florida Population Atlas 1
 Florida Population Atlas 1 Table of Contents About the Florida Population Atlas... 2 Explanation of Florida Population Characteristics and Trends..2-5 Figures & Maps... 6-30 Florida Population Characteristics
STATE ELECTRICAL ACT AND STATE ELECTRICAL BOARD RULES
 STATE ELECTRICAL ACT AND STATE ELECTRICAL BOARD RULES November 2015 State of Nebraska State Electrical Division PO Box 95066 Lincoln, NE 68509-5066 PHONE (402)471-3550 FAX (402)471-4297 STATE ELECTRICAL
Behavioral Health Prevention Directory. Division of Behavioral Health
 Behavioral Health Prevention Directory Division of Behavioral Health Table of Contents Introduction...2 Prevention System Mission and Vision...3 Behavioral Health Regions... 3 Nebraska Prevention Coalitions
Age/sex/race in New York State
 Age/sex/race in New York State Based on Census 2010 Summary File 1 Jan K. Vink Program on Applied Demographics Cornell University July 14, 2011 Program on Applied Demographics Web: http://pad.human.cornell.edu
IOWA POPULATION TRENDS. Population Topics. Iowa Population: 1900-2010
 IOWA POPULATION TRENDS August 2011 Gary Krob, State Data Center Coordinator State Library of Iowa census@lib.state.ia.us www.iowadatacenter.org Population Topics 2 Past state trend How population changes
Community Redevelopment Tax Increment Financing Projects Tax Year 2014
 Community Redevelopment Tax Increment Financing Projects Tax Year 214 Report to the Legislature Nebraska Department of Revenue Property Assessment Division March 1, 215 Ruth A. Sorensen, Property Tax Administrator
The Economic Impact of the Senior Population on a State s Economy: The Case of North Dakota
 The Economic Impact of the Senior Population on a State s Economy: The Case of North Dakota RICHARD RATHGE January 2007 NORTH DAKOTA STATE DATA CENTER North Dakota State University, an Equal Opportunity
Benefit and Resource Guide for Older Nebraskans
 Benefit and Resource Guide for Older Nebraskans Nebraska Department of Health & Human Services State Unit on Aging P.O. Box 95044 Lincoln, NE 68509-5044 (402) 471-2307 - Lincoln 1 (800) 942-7830 - Nebraska
STATE OF NEBRASKA ROSTER ADULT DAY SERVICES
 STATE OF NEBRASKA ROSTER ADULT DAY SERVICES Department of Health and Human Services Division of Public Health, Licensure Unit 301 Centennial Mall South-Third Floor PO Box 9986 Lincoln, NE 68509-986 Adult
Planning for the Schools of Tomorrow
 Planning for the Schools of Tomorrow School Enrollment Projections Series January 2014 Page Intentionally Left Blank School Enrollment Projection Series: School District ii Table of Contents Introduction...
Youth Rehabilitation & Treatment Center- Kearney
 2008/09 Annual Report Division of Children & Family Services Office of Juvenile Services Youth Rehabilitation & Treatment Center- Kearney Helping Youth Live Better Lives THE NEBRASKA DEPARTMENT OF HEALTH
THE IMPACT OF BIG-BOX BUILDING MATERIALS STORES ON HOST TOWNS AND SURROUNDING COUNTIES IN A MIDWESTERN STATE
 THE IMPACT OF BIG-BOX BUILDING MATERIALS STORES ON HOST TOWNS AND SURROUNDING COUNTIES IN A MIDWESTERN STATE By Kenneth E. Stone Professor of Economics and Extension Economist And Georgeanne M. Artz Extension
Information Technology Assessment and Plan for the Western Region
 Information Technology Assessment and Plan for the Western Region Introduction Broadband high-speed Internet access is transforming Nebraska s economy and society. Businesses are using the technology to
Annual Report on the Public Health Portion of the Nebraska Health Care Funding Act (LB 692)
") Annual Report on the Public Health Portion of the Nebraska Health Care Funding Act (LB 692) Presented to the Governor of the State of Nebraska and the Health and Human Services Committee of the Legislature
Annual Report on the Public Health Portion of the Nebraska Health Care Funding Act (LB 692) Presented to the Governor of the State of Nebraska and the Health and Human Services Committee of the Legislature
Kansas State University Engagement Benchmarking Tool
 Kansas State University Engagement Benchmarking Tool Survey Introduction Survey Description: Kansas State University is surveying faculty and professional staff regarding our university s engagement mission.
Discussion Paper. Is New England experiencing a brain drain? Facts about demographic change and young professionals
 New England Public Policy Center Discussion Paper 07-3 November 2007 Discussion Paper Is New England experiencing a brain drain? Facts about demographic change and young professionals by Heather Brome
Location of Kansas Medical School Loan Program Recipients Who Have Completed Their Obligation
 Location of Kansas Medical School Loan Program Recipients Who Have Completed Their Obligation November 2013 ======================================================================================= This
CHAPTER ONE: DEMOGRAPHIC ELEMENT
 CHAPTER ONE: DEMOGRAPHIC ELEMENT INTRODUCTION One of the basic elements of this comprehensive plan is an analysis of the City of Beaufort s (the City) current and projected demographic makeup. The purpose
Lloyd Potter is the Texas State Demographer and the Director of the Texas State Data Center based at the University of Texas at San Antonio.
 Lloyd Potter is the Texas State Demographer and the Director of the Texas State Data Center based at the University of Texas at San Antonio. 1 2 Texas population in 2014 was just under 27 million and was
Nursing Leadership Survey (RN/LPN) Outcome Analysis. Nebraska Action Coalition
 Outcome Analysis. Nebraska Action Coalition") Nursing Leadership Survey (RN/LPN) Outcome Analysis Nebraska Action Coalition Juan-Paulo Ramírez, Ph.D. Independent Consultant June 2013 Contents Summary... 3 Introduction... 5 Survey... 5 Survey Sample
Nursing Leadership Survey (RN/LPN) Outcome Analysis Nebraska Action Coalition Juan-Paulo Ramírez, Ph.D. Independent Consultant June 2013 Contents Summary... 3 Introduction... 5 Survey... 5 Survey Sample
Agency 010 - AUDITOR OF PUBLIC ACCOUNTS
 STATUTORY AUTHORITY: Article IV of the Nebraska State Constitution designates the Auditor of Public Accounts as an executive officer of the State. Chapter 84 - Sections 84-304 through 84-322 contain the
ARCHIVES RECORD HISTORICAL NOTE
 ARCHIVES RECORD RG008 NEBRASKA. DEPARTMENT OF INSURANCE Records: 1883-current Cubic ft.: Approx. # of Items: HISTORICAL NOTE An act approved February 15, 1864, required insurance companies to be certified
How To Connect A Telehealth Network In Nebraska
 ..... Building a Statewide Information Technology Infrastructure Grant Number 048225 CN-AHEC / Hablamos Juntos October 1, 2003 September 30,2005 At the same time Central Nebraska Area Health Education
Agency 010 - AUDITOR OF PUBLIC ACCOUNTS
 STATUTORY AUTHORITY: Article IV of the Nebraska State Constitution designates the Auditor of Public Accounts as an executive officer of the State. Chapter 84 - Sections 84-304 through 84-322 contain the
Cost of Care Survey and About Genworth Financial
 Cost of Care Survey 2015 Genworth 2015 Cost of Care Survey Nebraska State-Specific Data 118928NE 04/01/15 Nebraska Homemaker Services Hourly Rates USA $8 $20 $40 $44,616 2% Nebraska Whole State $19 $22
The County-to-County Migration Patterns of Kansas Taxpayers, 1985-2004
 Research Report The County-to-County Migration Patterns of Kansas Taxpayers, 1985-2004 Arthur P. Hall, Ph.D. Executive Director Center for Applied Economics University of Kansas School of Business arthall@ku.edu
STATE OF NEBRASKA ROSTER HOSPITALS. General Acute Hospitals Critical Access Hospitals Rehabilitation Hospitals Psychiatric Hospitals
 STATE OF NEBRASKA ROSTER HOSPITALS General Acute Hospitals Critical Access Hospitals Rehabilitation Hospitals Psychiatric Hospitals Department of Health and Human Division of Public Health, Licensure Unit
Recommended Procedures for Planning and Recovering from a Disaster
 Recommended Procedures for Planning and Recovering from a Disaster As we have seen in recent emergency situations (floods, tornadoes, winter storms or other disasters), you may be unable to obtain needed
Migration Data and the ACS
 Migration Data and the ACS Rachel Franklin Spatial Structures in the Social Sciences (S4) / Population Studies Training Center (PSTC) Brown University ACS Migration Migration data come in lots of forms:
Rural America At A Glance
 United States Department of Agriculture Rural America At A Glance 2014 Edition Overview While the U.S. economy is now in its sixth year of recovery from the Great Recession of 2007-09, its performance
Annual Report on the Public Health Portion of the Nebraska Health Care Funding Act (LB 692)
") Annual Report on the Public Health Portion of the Nebraska Health Care Funding Act (LB 692) Presented to the Governor of the State of Nebraska and the Health and Human Services Committee of the Legislature
Annual Report on the Public Health Portion of the Nebraska Health Care Funding Act (LB 692) Presented to the Governor of the State of Nebraska and the Health and Human Services Committee of the Legislature
Demographic and Economic Profile. Mississippi. Updated May 2006
 Demographic and Economic Profile Mississippi Updated May 2006 Metro and Nonmetro Counties in Mississippi Based on the most recent listing of core based statistical areas by the Office of Management and
Children in Egypt 2014 A STATISTICAL DIGEST
 Children in Egypt 2014 A STATISTICAL DIGEST CHAPTER 1 DEMOGRAPHY Children in Egypt 2014 is a statistical digest produced by UNICEF Egypt to present updated and quality data on major dimensions of child
Educational Attainment in the United States: 2015
 Educational Attainment in the United States: 215 Population Characteristics Current Population Reports By Camille L. Ryan and Kurt Bauman March 216 P2-578 This report provides a portrait of educational
New South Wales State and Regional Population Projections 2001-2051. 2004 Release TRANSPORT AND POPULATION DATA CENTRE
 New South Wales State and Regional Population Projections 21-251 251 24 Release TRANSPORT AND POPULATION DATA CENTRE THE TRANSPORT AND POPULATION DATA CENTRE (TPDC) The TPDC is located in the NSW Department
No. 7 Early Settlers
 No. 7 Early Settlers Many different groups of people have settled in Nebraska. The very first were Indians who came here more than 10,000 years ago. They were nomadic hunters who were looking for an area
A Context for Change Management in the Capital Regional District
 A Context for Change Management in the Capital al District Future Population, Labour Force, Employment and Housing in the Capital al District URBAN FUTURES FINAL REPORT AUGUST 2009 A Context for Change
Births and deaths in Kent - 2014
 Business Intelligence Statistical Bulletin July and deaths in - Related information The Population and Census web page contains more information which you may find useful. Population data presents the
Report prepared by the Applied Population Laboratory at the University of Wisconsin- Madison October, 2007
 Northern Wisconsin Higher Education Initiative Demographic Profile Report prepared by the Applied Population Laboratory at the University of Wisconsin- Madison October, 2007 For more information, contact:
Impact of Wind Energy on Property Taxes in Nebraska
 Impact of Wind Energy on Property Taxes in Nebraska November 2013 Executive Summary Nebraska suffers from a declining rural population and, as a result, an increasing property tax burden on landowners.
The recession of 2007 2009, a
 Employment outlook: Labor force projections to : a more slowly growing workforce The projected labor force growth over the next 10 years will be affected by the aging of the baby-boom generation; as a
American Presidents. Author: Dr. Michael Libbee, Michigan Geographic Alliance
 American Presidents Author: Dr. Michael Libbee, Michigan Geographic Alliance Lesson Overview: Students will understand how the political geography of the country has changed. This lesson helps summarize
Cultural Competency Assessment of Health Care Providers across Nebraska: A Survey of Limited English Proficient (LEP) Individuals
 Individuals") Cultural Competency Assessment of Health Care Providers across Nebraska: A Survey of Limited English Proficient (LEP) Individuals Nebraska Department of Health & Human Services Office of Minority Health
Cultural Competency Assessment of Health Care Providers across Nebraska: A Survey of Limited English Proficient (LEP) Individuals Nebraska Department of Health & Human Services Office of Minority Health
Nationally Consistent Data Measures for Cancer Leukemia All Ages
 Nationally Consistent Data Measures for Cancer Leukemia All Ages Leukemia includes a diverse group of cancers that begin in blood cells. Although it is sometimes thought of as a children s disease, leukemia
Demography. Focus on the three contributors to population change: Fertility, mortality, and migration
 1 Formal Demography Demography Focus on the three contributors to population change: Fertility, mortality, and migration Social Demography Focus on relationship between social, economic, and demographic
Vol. 2 No. 2 March/April 2014 THE DEMOGRAPHIC FACTS OF AGEING IN AUSTRALIA: PATTERNS OF GROWTH
 Australian Population & Migration Research Centre Vol. 2 No. 2 March/April 2014 THE DEMOGRAPHIC FACTS OF AGEING IN AUSTRALIA: PATTERNS OF GROWTH By Graeme Hugo POLICY BRIEF It is well recognized that population
Affordable Care Act (ACA) Maternal, Infant, and Early Childhood Home Visiting Program Needs Assessment
 Maternal, Infant, and Early Childhood Home Visiting Program Needs Assessment") Affordable Care Act (ACA) Maternal, Infant, and Early Childhood Home Visiting Program Needs Assessment Supplemental Information Request for the Submission of the Statewide Needs Assessment North Dakota
Affordable Care Act (ACA) Maternal, Infant, and Early Childhood Home Visiting Program Needs Assessment Supplemental Information Request for the Submission of the Statewide Needs Assessment North Dakota
U.S. Teenage Pregnancy Statistics Overall Trends, Trends by Race and Ethnicity And State-by-State Information
 U.S. Teenage Pregnancy Statistics Overall Trends, Trends by Race and Ethnicity And State-by-State Information The Alan Guttmacher Institute 120 Wall Street, New York, NY 10005 www.guttmacher.org Updated
10. European Union. (a) Past trends
 Past trends") . European Union (a) Past trends The total fertility rate in the 15 countries that presently constitute the European Union was on a rising curve until 196-65, when it attained 2.69 births per woman. Since
. European Union (a) Past trends The total fertility rate in the 15 countries that presently constitute the European Union was on a rising curve until 196-65, when it attained 2.69 births per woman. Since
ECONOMIC FACTORS AFFECTING COMPENSATION
 Unit 4: Total Rewards 41 ECONOMIC FACTORS AFFECTING COMPENSATION Inflation Inflation has a substantial impact on compensation practices. Managing a compensation program is especially difficult during periods
STATE OF NEBRASKA ROSTER MENTAL HEALTH CENTERS
 STATE OF NEBRASKA ROSTER MENTAL HEALTH CENTERS Department of Health and Human Division of Public Health, Licensure Unit 301 Centennial Mall South-Third Floor PO Box 94986 Lincoln, NE 68509-4986 Mental
1.17 Life expectancy at birth
 1.17 Life expectancy at birth The life expectancy of Aboriginal and Torres Strait Islander males and females for a given period. Data sources Life expectancy estimates for the years 2005 2007 presented
Iowa Population Over 100 Years
 Iowa Population Over 100 Years The 2010 Census for Iowa offers a first look at population change over the past decade and century. State and local policy makers can use population trends to better inform
U.S. Population Projections: 2012 to 2060
 U.S. Population Projections: 2012 to 2060 Jennifer M. Ortman Population Division Presentation for the FFC/GW Brown Bag Seminar Series on Forecasting Washington, DC February 7, 2013 2012 National Projections
The goal is to transform data into information, and information into insight. Carly Fiorina
 DEMOGRAPHICS & DATA The goal is to transform data into information, and information into insight. Carly Fiorina 11 MILWAUKEE CITYWIDE POLICY PLAN This chapter presents data and trends in the city s population
Planning & Development Department City of Marion, Iowa www.cityofmarion.org/planning Phone: 319-743-6320 Fax: 319-737-4260
 Planning & Development Department City of Marion, Iowa www.cityofmarion.org/planning Phone: 319-743-6320 Fax: 319-737-4260 Marion City Hall 1225 6 th Avenue Suite 210 Marion, Iowa 52302 The following information
A STUDY OF RETAIL TRADE IN CITIES ACROSS KANSAS AN ANNUAL REPORT OF TRADE PULL FACTORS AND TRADE AREA CAPTURES
 A STUDY OF RETAIL TRADE IN CITIES ACROSS KANSAS AN ANNUAL REPORT OF TRADE PULL FACTORS AND TRADE AREA CAPTURES Annual report for Fiscal Year 2012 Kansas Department of Revenue Office of Policy and Research
Demographics in Texas: Changes in Household Characteristics and Changes in Family Structure of the Dallas Area
 Demographics in Texas: Changes in Household Characteristics and Changes in Family Structure of the Dallas Area Dallas Bar Association - Family Law Section February 9, 2012 Dallas, TX Growing States, 2000-2010
The U.S. labor force the number of
 Employment outlook: 14 Labor force projections to 2014: retiring boomers The baby boomers exit from the prime-aged workforce and their movement into older age groups will lower the overall labor force
POVERTY IN FLORIDA. POVERTY IN FLORIDA 1990 2000 1990 2000 Change. 2000 Census Reports. Florida Legislature. Office of Economic & Demographic Research
 2000 Census Reports Florida Legislature Office of Economic & Demographic Research POVERTY IN FLORIDA October 2002 The overall poverty rate for persons in Florida as measured in the 2000 Census was 12.5
Marriage and divorce: patterns by gender, race, and educational attainment
 ARTICLE OCTOBER 2013 Marriage and divorce: patterns by gender, race, and educational attainment Using data from the National Longitudinal Survey of Youth 1979 (NLSY79), this article examines s and divorces
Instructions for Form 8863 Education Credits (American Opportunity, Hope, and Lifetime Learning Credits)
") 2009 Instructions for Form 8863 Education Credits (American Opportunity, Hope, and Lifetime Learning Credits) Department of the Treasury Internal Revenue Service Section references are to the Internal
2009 Instructions for Form 8863 Education Credits (American Opportunity, Hope, and Lifetime Learning Credits) Department of the Treasury Internal Revenue Service Section references are to the Internal
POPULATION AND MIGRATION ESTIMATES NORTHERN IRELAND (2013) STATISTICAL REPORT
 STATISTICAL REPORT") POPULATION AND MIGRATION ESTIMATES NORTHERN IRELAND (2013) STATISTICAL REPORT 9.30am Thursday 26 June 2014 Key Points Northern Ireland population at 30 June 2013 is estimated to be 1.830 million people.
POPULATION AND MIGRATION ESTIMATES NORTHERN IRELAND (2013) STATISTICAL REPORT 9.30am Thursday 26 June 2014 Key Points Northern Ireland population at 30 June 2013 is estimated to be 1.830 million people.
The Commonwealth s Official Source for Population and Economic Statistics. March 9, 2011
 Research Brief The Commonwealth s Official Source for Population and Economic Statistics March 9, 2011 Local Data Released for Pennsylvania: State Shows Continued Population Growth PENN STATE HARRISBURG
Health Coverage among 50- to 64-Year-Olds
 Health Coverage among 50- to 64-Year-Olds In 2005, more than 51 million Americans were age 50 64. This number is projected to rise to 58 million in 2010, when the first baby boomers turn 64. The aging
Analysis of Proposed Tax Levies for Library Purposes
 Analysis of Proposed Tax Levies for Library Purposes March 2013 Prepared for the Ohio Library Council by Howard Fleeter & Associates 60 East Broad Street, Suite 350 Columbus, Ohio 43215 I. Overview This
One Stop for Business Resources BUSINESS ASSISTANCE, RETENTION AND EXPANSION
 One Stop for Business Resources BUSINESS ASSISTANCE, RETENTION AND EXPANSION Helping your existing business grow, prosper and realize its full potential, by partnering with you to identify, connect with
CRM for Every Budget
 CRM for Every Budget Cheryl Hodgson University of Iowa Health Care Sara Dykes LionShare The opinions expressed are those of the presenter and do not necessarily state or reflect the views of SHSMD or the
Uneven Progress: Upstate Employment Trends Since the Great Recession
 Uneven Progress: Upstate Employment Trends Since the Great Recession OFFICE OF THE NEW YORK STATE COMPTROLLER Thomas P. DiNapoli, State Comptroller AUGUST 2016 Message from the Comptroller August 2016
History of American Parties
 History of American Political Parties History of American Parties Six party systems or historical eras Changes in the nature of the two parties Which voters support which party What issues each party adopts
School Enrollment Social and Economic Characteristics of Students: October 2003
 School Enrollment Social and Economic Characteristics of Students: October 2003 Population Characteristics Issued May 2005 P20-554 This report highlights school enrollment trends of the population aged
Migration indicators in Kent 2014
 Business Intelligence Statistical Bulletin September 2015 Migration indicators in Kent 2014 Related information The and Census web page contains more information which you may find useful. change presents
THE DEMOGRAPHY OF POPULATION AGEING
 THE DEMOGRAPHY OF POPULATION AGEING Barry Mirkin and Mary Beth Weinberger* An inevitable consequence of the demographic transition and the shift to lower fertility and mortality has been the evolution
2013 Rankings Kansas
 2013 Rankings Kansas Introduction Where we live matters to our health. The health of a community depends on many different factors, including the environment, education and jobs, access to and quality
College Enrollment by Age 1950 to 2000
 College Enrollment by Age 1950 to 2000 Colleges compete with the labor market and other adult endeavors for the time and attention of young people in a hurry to grow up. Gradually, young adults drift away
Nebraska Senior Center Directory Revised June 2015
 Nebraska Senior y Revised June 2015 AAA County City Name Address Zip Phone Manager/ Congregate Aging Office of Western Nebraska Box Butte Alliance City of Alliance 212 Yellowstone 69301 (308) 762-8774
UTAH. Case Study Series
 Case Study Series UTAH MAP PAGE Nursing Homes and Hospitals Serving the Resident Population... 90 Major Cities............................................ 91 HAZMAT Response......................................