Arizona Climate Summary March 2016 Summary of conditions for February 2016
|
|
|
- Ethel Bruce
- 7 years ago
- Views:
Transcription

1 February 2016 Temperature and Precipitation Summary Arizona Climate Summary March 2016 Summary of conditions for February 2016 February 1 st 16 th : A strong low pressure system swept through Arizona on the last day of January and exited the state on February 2 nd. Widespread rain and snow fell across the state from this storm, including 9.2 of snow at Bellemont, 10.2 at Flagstaff, 17.5 at the Grand Canyon north rim, 7 at Williams, and 2 at Show Low. Rainfall totals included 0.51 at Kingman, 0.18 at Phoenix, 0.23 at Deer Valley, 0.40 at Prescott, 0.31 at St. Johns, 0.39 at Scottsdale, 0.34 at Window Rock, 0.38 at Winslow, 0.54 at Carefree, 0.63" at Pinnacle Peak, and 0.80 at Douglas. After the cold front passed through colder air moved into the southwest, dropping daytime temperatures in the southwest deserts into the upper 60s and nighttime lows at the higher elevations into negative values. On the 3 rd, Bellemont had a nighttime temperature of -21 o F. By the 5 th, high pressure returned and temperatures began to climb as humidity dropped. By the 8 th, high temperatures reached the upper 80s in the southwest deserts and the 50s at the higher elevations. Nighttime temperatures hit the 50s in the lower deserts and the teens at the higher elevations. The high pressure ridge remained over the state through the 16 th, when high temperatures peaked at 92 o F at Organ Pipe National Monument. February 17 th 29 th : On the 17 th a strong low pressure system moved down the California coast, coming onshore on the 18 th, bringing widespread precipitation to California. The system continued to drop rain and snow in California on the 19 th, but dissipated before it had the chance to move into Arizona. After two days of zonal flow with warm dry weather, a back door cold front moved down over the Great Plains, but precipitation was only recorded at Window Rock. The rest of the state only noted a 5 degree drop in temperatures on the 23 rd. The ridge re-established itself on the 24 th and remained in place through the end of the month. On the 27 th a weak shortwave moved through, dropping temperatures slightly but the southwest deserts remained in the upper 80s and lower 90s the last week of the month, and high temperature records were set in many areas of the state during the last two weeks of February. In This Issue: Overview of February, graphs of the February daily maximum and minimum temperatures, precipitation, mean daily dew points for Flagstaff, Phoenix, and Tucson; February climate statistics, maps of mean monthly maximum and minimum temperatures, precipitation, dew points, wind speeds for February; and graphs of the mean February temperature and precipitation for the period of record for Tucson, Phoenix, and Flagstaff, graphs of the cumulative precipitation for the calendar year for Flagstaff, Phoenix, and Tucson. Climate calendars for Flagstaff, Phoenix, Tucson, Prescott, Winslow and Yuma, including daily and monthly normals and extremes, for each month of the year, can be downloaded directly from the State Climate website. See p.19 of this report for calendar abbreviations. Data are preliminary and are from the National Weather Service Forecast Offices in Flagstaff, Phoenix and Tucson. **Note: The discrepancy between the Statewide Temperature and Precipitation values for Phoenix, Flagstaff and Tucson and the daily values in their graphs are due to the reporting times. Statewide Temperature and Precipitation values are taken at 5pm, while official daily records at the airports are taken from Midnight to Midnight. Dr. Nancy J. Selover, State Climatologist Edited by Nancy J. Selover & Kira Frost 2016 Arizona State Climate Office 1

2 February 2016 Daily Temperature, Precipitation, & Dew Point for Flagstaff, Phoenix, and Tucson 2

3 3
4 FLAGSTAFF CLIMATE STATISTICS February 2016 This February had no significant temperature or precipitation ranking. Avg Max Temp (F) 53.5 Normal 44.8 Avg Min Temp (F) 19.0 Normal 19.3 Avg Mean Temp (F) 36.3 Normal 4.2 Departure from Normal (F) +4.2 Highest Monthly Avg Temp (F) 39.7 in 2015 Lowest Monthly Avg Temp (F) 19.5 in 1939 Highest Temp this month (F): 65 on 16 th Lowest Temp this month (F): -9 on 3 rd Record High (F): 71 on 02/26/1986 Record Low (F): -23 on 02/01/1985 Temperature or precipitation records this month: 12 th HiMax 64 set, previous record 62 in st HiMax 63 set, previous record 60 in th HiMax 63 set, previous record 59 in 2008 Maximum Temp 60 o F or higher 13 Maximum Temp 32 o F or lower 2 Heating Degree Days 828 Normal -95 Cooling Degree Days 0 Normal 0 Degree base 65 o F Total February Precipitation 0.37 Normal February Precipitation 2.16 Departure from normal Greatest 24-Hr Precipitation 0.87 on 31 st -1 st Total Precipitation Year-to-Date 3.78 Departure from Normal Number of Days: Clear 28 Partly Cloudy 0 Cloudy 1 Greatest February Precipitation in 1993 Least February Precipitation 0.00 in 1967 Flagstaff Number of Days of: Minimum Temp 25 o F or higher 6 Minimum Temp 10 o F or lower 5 Average Wind Speed Highest Peak Gust 6.0 mph 46 mph from 220 o on 1 st PHOENIX CLIMATE STATISTICS February 2016 This February was the warmest on record for temperature but had no significant precipitation records. Avg Max Temp(F) 79.9 Normal 70.7 Avg Min Temp(F) 51.6 Normal 48.7 Avg Mean Temp (F) 65.7 Normal 59.7 Departure from Normal (F) +6.0 o F Highest Monthly Avg Temp (F) 66.0 in 1991 Lowest Monthly Avg Temp (F) 48.5 in 1939 Highest Temp this month (F): 90 on 17 th Lowest Temp this month (F): 34 on 3 rd Record High (F): Record Low (F): 92 on 02/27/1986&02/25/ on 02/08/1933&02/07/ Temperature or precipitation records this month: 9 th HiMax 86 set, previous record 85 in th HiMin 59 set, previous record 58 in th HiMax 85 set, previous record 83 in th HiMax 87 set, previous record 84 in th HiMax 87 set, previous record 84 in th HiMax 90 set, previous record 88 in th HiMin 59 set, previous record 58 in st HiMax 86 tied, first set in th HiMax 88 set, previous record 84 in th HiMin 59 set, previous record 57 in 1988 Phoenix Number of Days of: Minimum Temp 40 o F or lower 4 Minimum Temp 55 o F or higher 12
5 Maximum Temp 60 o F or lower 3 Maximum Temp 85 o F or higher 16 Heating Degree Days 86 Normal 163 Cooling Degree Days 113 Normal 98 Degree base 65 o F Total February Precipitation 0.00 Normal February Precipitation 0.92 Departure from normal Greatest 24-Hr Precipitation st Total Precipitation Year-to-Date 1.31 Departure from Normal Greatest February Precipitation 4.64 in 1905 Least February Precipitation 0.00 in 20016, 2014, 2006, 1967 and 10 others Number of Days: Clear 24 Partly Cloudy 5 Cloudy 0 Average Wind Speed 5.7 mph Highest Peak Gust 43 mph from 260 o on 2 nd TUCSON CLIMATE STATISTICS February 2016 This February was the 3 rd warmest on record, with no significant precipitation records. Avg Max Temp(F) 78.0 Normal 68.5 Avg Min Temp(F) 44.2 Normal 42.2 Avg Mean Temp(F) 61.1 Normal 55.3 Departure from Normal (F) +5.8 Highest Monthly Avg Temp (F) 62.1 in 2015 Lowest Monthly Avg Temp (F) 48.9 in 1903 Highest Temp this month (F): 90 on 17 th Lowest Temp this month (F): 28 on 3 rd Record High (F): 92 on 02/14/1957 Record Low (F): 17 on 02/07/1899 Temperature or precipitation records this month: 8 th HiMax 81 tied, first set in th HiMax 85 set, previous record 84 in th HiMax 87 set, previous record 86 in th HiMax 87 set, previous record 85 in th HiMax 90 set, previous record 86 in th HiMin 58 set, previous record 55 in st HiMax 82 tied, first set in 1999 Heating Degree Days 142 Normal 273 Cooling Degree Days 13 Normal Degree base 65 o F Total February Precipitation 0.18 Normal February Precipitation 0.86 Departure from normal Greatest 24-Hr Precipitation 0.18 on 1 st Total Precipitation Year-to-Date 1.71 Departure from Normal Greatest February Precipitation 4.15 in 1905 Least February Precipitation 0.00 in 1984, 1902, 1903 and 7 others Number of Days: Clear 27 Partly Cloudy 1 Cloudy 0 Average Wind Speed Highest Peak Gust 7.2 mph 46 mph from 250 o on 1 st Data are from the National Weather Service and the National Climatic Data Center and are preliminary. Tucson Number of Days of: Minimum Temp 32 o F or lower 3 Minimum Temp 50 o F or higher 5 Maximum Temp 60 o F or lower 3 Maximum Temp 85 o F or higher 7 5
6 Wind Speeds for February: Day Phoenix Flagstaff Tucson (mph) Avg Max Avg Max Avg Max Dew Points for February: Daily Average Dew Point ( o F): Day Phx Tuc Flg

7 The 7
8 The minimum temperatures ranged from -19 o F at Mormon Lake to 46 o F at Chandler. The lowest maximum temperature of 46 o F was recorded at Flagstaff, while the highest maximum temperature was 93 o F at Paloma and Yuma Proving Ground. The highest rainfall amounts were 1.90 at Promontory and 1.80 at White Horse Lake. The lowest average dew point was 0 o F at Window Rock and the highest was 36 o F at Yuma and Paloma. The highest peak wind gust was 47 mph at Aguila. Average wind speeds range from 2 mph at Phoenix Greenway to 16 mph at Laughlin-Bullhead City Airport. 8
9 T February 2016 The highest average minimum temperature was 64 o F at Chandler and the lowest average minimum temperature was -3 o F at Flagstaff 4 SW. The highest average maximum temperature was 85 o F at Yuma and lowest average maximum temperature was 38 o F at Flagstaff 4 SW. 9

10 10

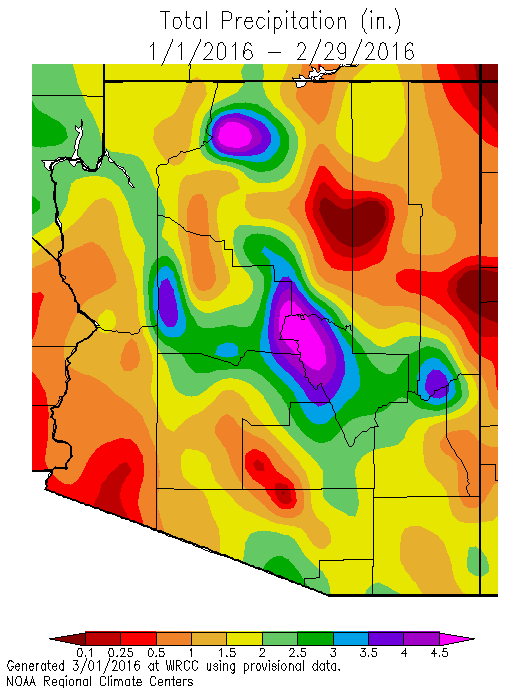
11 February February minimum temperatures ranged from 4 degrees F cooler to 8 degrees F warmer than normal across the state. The western border and central Arizona were the warmest locations while western Coconino County, Graham and Cochise counties and the White Mountains were the coolest locations. Daytime temperatures were 4 to 12 o F warmer than normal statewide. Only one significant winter storm crossed the state in February and it did not bring much cold air to the region. February precipitation was non-existent in much of the state (less than 25% of normal), particularly in the southern half of Arizona and southern Mohave, western Yavapai and western Coconino County. 11
12 12
13 Calendar Year 2016 Calendar year minimum temperatures varied from 4 o F warmer to 4 o F colder than normal across Arizona. Daytime temperatures were 1 to 5 o F warmer than average statewide. This is a reversal of January which was colder than normal across the state. The above normal precipitation by the end of January has become well below normal precipitation by the end of February. Most areas have had less than 70% of their normal precipitation. A small area of central Arizona is near average on the calendar year. 13
14 14
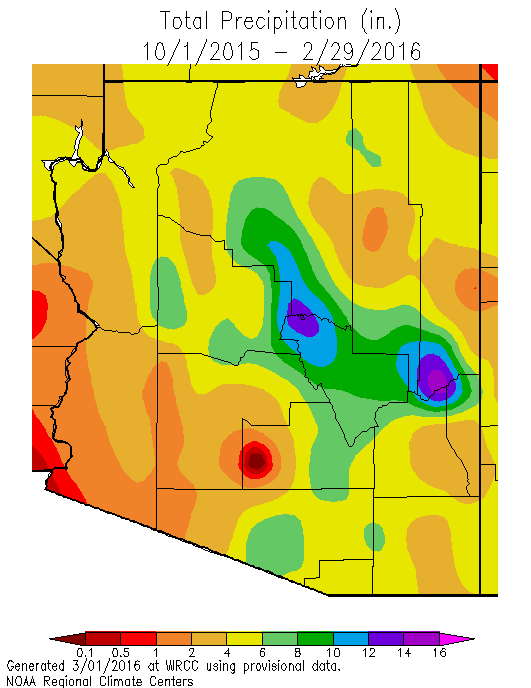
15 2016 Water Year The Water Year minimum temperatures are within 2 degrees of normal across most of the state with highest departures above normal on the Colorado Plateau and along the lower Colorado River Valley, and the greatest departures below normal in southern Arizona. The warmest area is southern Mohave County and the coolest is western Pima County. Daytime temperatures are also within 2 o F of normal with the cooler than normal areas in southern Navajo, eastern Gila, and western Pinal counties. Precipitation is well above normal on the Colorado Plateau, in eastern Coconino and central Navajo counties, as well as in central Pinal and eastern Pima counties. Western Pinal and most of Maricopa and western Coconino counties are much drier than normal, (less than 70%). The El Niño conditions are continuing in the central Pacific Ocean, but the circulation pattern has not been bringing the moisture to the southwest in February. The ridge has blocked storm systems. Early next week conditions are expected to change to cooler and wetter, but it s not clear if that will be a short-lived change or if March will be a wet month. 15

16 February Mean Temperature Graphs Flagstaff, Phoenix, and Tucson : 16
17 February Mean Precipitation Graphs Flagstaff, Phoenix, and Tucson

18 2016 Cumulative Precipitation Graphs Flagstaff, Phoenix and Tucson: Flagstaff and Tucson are near their average values, but Phoenix is about 0.56 below average for the end of February. 18
 LO MAX = Lowest maximum temperature for that day (F) LO MIN = Lowest minimum temperature for that day (F) HI")
19 The downloadable normals and extremes calendars use the following abbreviations: NORM = 30 year ( ) average value (degrees Fahrenheit (F)) OBS = The temperature observation for that day this year AVG = Average daily temperature HI MAX = Highest maximum temperature for that day (F) LO MAX = Lowest maximum temperature for that day (F) LO MIN = Lowest minimum temperature for that day (F) HI MIN = Highest minimum temperature for that day (F) Mx PCP = Maximum precipitation for that day (inches) Mx SNO = Maximum snowfall for that day (inches) 19
Arizona Climate Summary February 2015 Summary of conditions for January 2015
 Arizona Climate Summary February 2015 Summary of conditions for January 2015 January 2015 Temperature and Precipitation Summary January 1 st 14 th : January started off with a very strong low pressure
ADDENDUM. ADEQ Annual Air Quality Report for 2003. Issued 9/24/2004. The attached tables contain corrections to typographical errors.
 ADDENDUM ADEQ Annual Air Quality Report for 2003 Issued 9/24/2004 The attached tables contain corrections to typographical errors. Replace Table 13, pp. 34-37: Correction to Yuma - Juvenile Courthouse
2013 Annual Climate Summary for the Southeast United States
 Months of heavy rain forced the U.S. Army Corp of Engineers to open the spillways at Lake Hartwell, located at the headwaters of the Savannah River along the South Carolina-Georgia border, on July 9,.
MIAMI-SOUTH FLORIDA National Weather Service Forecast Office http://www.weather.gov/miami
 MIAMI-SOUTH FLORIDA National Weather Service Forecast Office http://www.weather.gov/miami November 2014 Weather Summary Cooler and Drier than Normal December 1, 2014: Cooler than normal temperatures was
The Pennsylvania Observer
 The Pennsylvania Observer August 3, 2009 July 2009 - Pennsylvania Weather Recap Written by: Dan DePodwin After a cool month of June, some hoped July would bring usual summertime warmth to the state of
ARIZONA ARIZONA LICENSED NURSING CARE INSTITUTIONS CITY COUNTY REQUIRED TO REPORT FINANCIAL DATA TO ADHS ~ UPDATED November 2015 ~
 ARIZONA DEPARTMENT OF HEALTH SERVICES PAGE 1 OF 5 LTC0214 ACACIA HEALTH CENTER PHOENIX MARICOPA LTC0045 ACUITY SPECIALTY HOSPITAL OF ARIZONA AT MESA MESA MARICOPA LTC0046 ACUITY SPECIALTY HOSPITAL OF ARIZONA
ARIZONA STATE BOARD OF NURSING Nursing Assistant Training Programs Annual First -Time Pass Rates
 Joey Ridenour Executive Director ARIZONA STATE BOARD OF NURSING Nursing Assistant Training Programs Annual First -Time Pass Rates The following is a list of annual pass rates for nursing assistant training
WEATHER AND CLIMATE practice test
 WEATHER AND CLIMATE practice test Multiple Choice Identify the choice that best completes the statement or answers the question. 1. What role does runoff play in the water cycle? a. It is the process in
ARIZONA STATE BOARD OF NURSING Nursing Assistant Training Programs Annual First -Time Pass Rates
 Joey Ridenour Executive Director ARIZONA STATE BOARD OF NURSING Nursing Assistant Training Programs Annual First -Time Pass Rates The following is a list of annual pass rates for nursing assistant training
Arizona Department of Education Adult Education Services
 Fees listed below represent what was reported to ADE as of 06/27/2011. Please contact the testing center of your choice to verify fees, hours, and registration process. Apache Chinle Unified School District
Climate of Illinois Narrative Jim Angel, state climatologist. Introduction. Climatic controls
 Climate of Illinois Narrative Jim Angel, state climatologist Introduction Illinois lies midway between the Continental Divide and the Atlantic Ocean, and the state's southern tip is 500 miles north of
Climates are described by the same conditions used to describe
 58 The Causes of Climate R E A D I N G Climates are described by the same conditions used to describe weather, such as temperature, precipitation, and wind. You now know that oceans have an important effect
7613-1 - Page 1. Weather Unit Exam Pre-Test Questions
 Weather Unit Exam Pre-Test Questions 7613-1 - Page 1 Name: 1) Equal quantities of water are placed in four uncovered containers with different shapes and left on a table at room temperature. From which
ARIZONA STATE BOARD OF NURSING Nursing Assistant Training Programs Annual First -Time Pass Rates
 Joey Ridenour Executive Director ARIZONA STATE BOARD OF NURSING Nursing Assistant Training Programs Annual First -Time Pass Rates The following is a list of annual pass rates for nursing assistant training
El Niño 1997-1998 in the Midwest a
 Data/Case Study 2-1 El Niño 1997-1998 in the Midwest a by Stanley A. Changnon, Steven D. Hilberg, and Kenneth E. Kunkel Atmospheric Environment Section Illinois State Water Survey A Division of the Illinois
Genworth 2015 Cost of Care Survey Arizona
 Cost of Care Survey 2015 Genworth 2015 Cost of Care Survey State-Specific Data 118928AZ 04/01/15 Homemaker Services Hourly Rates USA $8 $20 $40 $44,616 2% Whole State $10 $20 $25 $45,760 1% Flagstaff $18
Climate Change on the Prairie:
 Climate Change on the Prairie: A Basic Guide to Climate Change in the High Plains Region - UPDATE Global Climate Change Why does the climate change? The Earth s climate has changed throughout history and
2. The map below shows high-pressure and low-pressure weather systems in the United States.
 1. Which weather instrument has most improved the accuracy of weather forecasts over the past 40 years? 1) thermometer 3) weather satellite 2) sling psychrometer 4) weather balloon 6. Wind velocity is
Arizona Community Action Association
 Working Together to End Poverty The (ACAA) was incorporated as a non-profit organization in 1967 in response to a need for a statewide forum to address issues relating to poverty. With our partners, ACAA
MIAMI-SOUTH FLORIDA National Weather Service Forecast Office http://www.weather.gov/miami
 MIAMI-SOUTH FLORIDA National Weather Service Forecast Office http://www.weather.gov/miami Summer 2015 Weather Summary Wet West and Dry East September 2, 2015: One of the most variable summers in recent
The Economic Benefit of International Students $26.8 billion Contributed; 340,000 U.S. Jobs Supported
 The Economic Benefit of International $26.8 billion Contributed; 40,000 U.S. Jobs ed Economic Analysis for Academic Year 201-2014 International students and their families created or supported 40,000 jobs
MIAMI-SOUTH FLORIDA National Weather Service Forecast Office http://www.weather.gov/miami
 MIAMI-SOUTH FLORIDA National Weather Service Forecast Office http://www.weather.gov/miami January Summary: Warm and Dry Winter Rolls On February 1, 2013: South Florida s warm and dry winter pattern of
Southern AER Atmospheric Education Resource
 Southern AER Atmospheric Education Resource Vol. 9 No. 5 Spring 2003 Editor: Lauren Bell In this issue: g Climate Creations exploring mother nature s remote control for weather and Climate. g Crazy Climate
Meritus Provider Networks. Building better health in communities through our Provider Networks.
 Meritus Provider Networks Building better health in communities through our Provider Networks. We believe in developing long-term partnerships with providers by working together to improve health outcomes
The Climate of Oregon Climate Zone 2 Willamette Valley
 /05 E-55 No. ci oi Unbound issue e2_, Does not circulate Special Report 914 May 1993 The Climate of Oregon Climate Zone 2 Property of OREGON STATE UNIVERSITY Library Serials Corvallis, OR 97331-4503 Agricultural
Water & Climate Review
 Water & Climate Review 1. The cross section below shows the direction of air flowing over a mountain. Points A and B are at the same elevation on opposite sides of the mountain. 4. The graph below shows
6. Base your answer to the following question on the graph below, which shows the average monthly temperature of two cities A and B.
 1. Which single factor generally has the greatest effect on the climate of an area on the Earth's surface? 1) the distance from the Equator 2) the extent of vegetative cover 3) the degrees of longitude
Anyone Else Notice That Its Been Windy Lately?
 National Weather Service Aberdeen, South Dakota January 2014 Inside this issue: Has it Been Windy Lately or What? 2013 Year in Review 2013 Year in Review (cont.) 1 2 3 Has it Been Windy Lately or What?
1. Incredible India. Shade the map on the next page, to show India s relief. The correct shading is shown on the final page! Incredible India India
 1. Incredible India Shade the map on the next page, to show India s relief. The correct shading is shown on the final page! Incredible India India The DCSF supported Action plan for Geography is delivered
What is the Medical Services Project?
 What is the Medical Services Project? A community-service program of the nonprofit Arizona Chapter of the American Academy of Pediatrics, since 1993 Serves low-income & uninsured children across the state
2013 State of Arizona Hazard Mitigation Plan State and County Descriptions
 Mohave County History / Geography Mohave County is located in northwest corner of Arizona and shares a border with California and Nevada along the Colorado River to the west, and Utah to the north. Its
Climate Change. Lauma M. Jurkevics - DWR, Southern Region Senior Environmental Scientist
 Climate Change A n o t h e r F a c t o r i n M a n a g i n g S o u t h e r n C a l i f o r n i a s W a t e r R e s o u r c e s Lauma M. Jurkevics - DWR, Southern Region Senior Environmental Scientist USEPA-Region
List 10 different words to describe the weather in the box, below.
 Weather and Climate Lesson 1 Web Quest: What is the Weather? List 10 different words to describe the weather in the box, below. How do we measure the weather? Use this web link to help you: http://www.bbc.co.uk/weather/weatherwise/activities/weatherstation/
CLIMATE, WATER & LIVING PATTERNS THINGS
 CLIMATE, WATER & LIVING PATTERNS NAME THE SIX MAJOR CLIMATE REGIONS DESCRIBE EACH CLIMATE REGION TELL THE FIVE FACTORS THAT AFFECT CLIMATE EXPLAIN HOW THOSE FACTORS AFFECT CLIMATE DESCRIBE HOW CLIMATES
Arizona Healthcare News
 Arizona Healthcare News Articles, Interviews and Statistics for the Healthcare Executive At Arizona Hospitals, Size Matters Large Hospitals Report Profits While Small Hospitals Struggle By David Peel Publisher
ARIZONA DEPARTMENT OF REVENUE
 ARIZONA DEPARTMENT OF REVENUE MEMORANDUM DATE: April 15, 2009 FROM: THE OFFICE OF ECONOMIC RESEARCH & ANALYSIS February 2009 TAX FACTS SUMMARY OF GENERAL FUND REVENUES February 2009 Fiscal Year Total Individual
CGC1D1: Interactions in the Physical Environment Factors that Affect Climate
 Name: Date: Day/Period: CGC1D1: Interactions in the Physical Environment Factors that Affect Climate Chapter 12 in the Making Connections textbook deals with Climate Connections. Use pages 127-144 to fill
PRIVATE SCHOOL TUITION ORGANIZATION INCOME TAX CREDITS IN ARIZONA: A SUMMARY OF ACTIVITY FY 2011
 PRIVATE SCHOOL TUITION ORGANIZATION INCOME TAX CREDITS IN ARIZONA: A SUMMARY OF ACTIVITY FY 2011 Arizona has three income tax credits for taxpayer donations to school tuition organizations (STOs). One
South Dakota Severe Weather Awareness Week April 22nd through 26th
 National Weather Service Aberdeen, South Dakota April 2013 Inside this issue: Severe Weather Awareness Impact Based Warnings Impact Based Warnings (cont) Record Cold March Record Cold March (cont) Seasonal
Antecedent Conditions:
 Antecedent Conditions: Record to Near Record Heat occurred across Northeast & North Central Colorado September 2-8. A cold front moved across Northeast Colorado the morning of the 9 th, and deeper subtropical
Great Plains and Midwest Climate Outlook 19 March 2015
 Great Plains and Midwest Climate Outlook 19 March 2015 Wendy Ryan Assistant State Climatologist Colorado State University wendy.ryan@colostate.edu Grass fire in SE Nebraska 13 March 2015 General Information
Geography affects climate.
 KEY CONCEPT Climate is a long-term weather pattern. BEFORE, you learned The Sun s energy heats Earth s surface unevenly The atmosphere s temperature changes with altitude Oceans affect wind flow NOW, you
How To Assess Natural Hazards In Houston County, Minn.
 Natural Hazards Assessment Houston County, MN Prepared by: NOAA / National Weather Service La Crosse, WI Natural Hazards Assessment for Houston County, MN Prepared by NOAA / National Weather Service La
Year Ended June 30, 2005
 A REPORT TO THE ARIZONA LEGISLATURE Financial Audit Division Full-Time Equivalent Student Enrollment Report Arizona County Community College Districts and Colleges of Qualifying Indian Tribes Debra K.
Reference Guide. Vantage PRO2 Quick
 3465 Diablo Avenue, Hayward, CA 94545-2778 U.S.A. 510-732-9229 Fax: 510-732-9188 E-mail: info@davisnet.com www.davisnet.com Vantage PRO2 Quick Reference Guide Part Number: 07395.235 Rev C (1/6/2012) 2012
Partnerships Implementing Engineering Education Worcester Polytechnic Institute Worcester Public Schools
 Partnerships Implementing Engineering Education Worcester Polytechnic Institute Worcester Public Schools Supported by: National Science Foundation Weather: 4.H.3 Weather and Classical Instruments Grade
WeatherBug Vocabulary Bingo
 Type of Activity: Game: Interactive activity that is competitive, and allows students to learn at the same time. Activity Overview: WeatherBug Bingo is a fun and engaging game for you to play with students!
Overview of the Plan. Airport Roles. Vision, Goals, & Measures. Current Transportation System Performance. Airport Assets. Future Transportation
 A rizona s aviation system is diverse.as diverse as the state itself. From Arizona s major cities to its mountains, deserts, and world renowned tourist destinations, Arizona s airports provide important
5. Why does the weather near cities tend to be cloudier and wetter than in rural areas?
 Name: Date: 1. Today weather forecasting is better because of the use of A. barometers. B. telescopes. C. satellites. D. anemometers. 2. The letter H is the weather symbol for A. hail storms. B. humidity.
UNIT 6a TEST REVIEW. 1. A weather instrument is shown below.
 UNIT 6a TEST REVIEW 1. A weather instrument is shown below. Which weather variable is measured by this instrument? 1) wind speed 3) cloud cover 2) precipitation 4) air pressure 2. Which weather station
Arizona County Community College Districts and Colleges of Qualifying Indian Tribes Year Ended June 30, 2015
 A REPORT TO THE ARIZONA LEGISLATURE Financial Audit Division Arizona County Community College Districts and Colleges of Qualifying Indian Tribes Debra K. Davenport Auditor General The Auditor General is
Technical Support Document For The May 2, 2008 Exceptional Event
 Technical Support Document For The May 2, 2008 Exceptional Event Prepared by the Technical Services Program Air Pollution Control Division June 9, 2009 2 Table of Contents: 1.0 Introduction... 4 2.0 Ambient
Simplifying MAT. Medication-Assisted Treatment in Arizona
 Simplifying MAT Medication-Assisted Treatment in Arizona MAT Perceptions about Medication-Assisted Treatment Addiction need not be a life sentence. Individuals in need of treatment for substance use disorders
South Africa. General Climate. UNDP Climate Change Country Profiles. A. Karmalkar 1, C. McSweeney 1, M. New 1,2 and G. Lizcano 1
 UNDP Climate Change Country Profiles South Africa A. Karmalkar 1, C. McSweeney 1, M. New 1,2 and G. Lizcano 1 1. School of Geography and Environment, University of Oxford. 2. Tyndall Centre for Climate
FY 2011 Program Contact. Arizona State University. Bullhead City Elementary School District #15. Center for Academic Success, Inc.
 FY 2011 Program Contact Arizona State University Linda Vaughan Arizona State University 6049 Backus Mall, Sutton 340J Mesa, AZ 85212 Phone: 480-727-5196 Fax: 480-727-5305 linda.vaughan@asu.edu Doug Moreno
ENSO Cycle: Recent Evolution, Current Status and Predictions. Update prepared by Climate Prediction Center / NCEP 9 May 2011
 ENSO Cycle: Recent Evolution, Current Status and Predictions Update prepared by Climate Prediction Center / NCEP 9 May 2011 Outline Overview Recent Evolution and Current Conditions Oceanic Niño Index (ONI)
Year Ended June 30, 2008
 A REPORT TO THE ARIZONA LEGISLATURE Financial Audit Division Full-Time Equivalent Student Enrollment Report Arizona County Community College Districts and Colleges of Qualifying Indian Tribes Debra K.
ARIZONA DEPARTMENT OF REVENUE
 ARIZONA DEPARTMENT OF REVENUE MEMORANDUM DATE: August 24, 2007 FROM: THE OFFICE OF ECONOMIC RESEARCH & ANALYSIS June 2007 TAX FACTS SUMMARY OF GENERAL FUND REVENUES Fiscal Year June 2007 Total Individual
Analyze Weather in Cold Regions and Mountainous Terrain
 Analyze Weather in Cold Regions and Mountainous Terrain Terminal Learning Objective Action: Analyze weather of cold regions and mountainous terrain Condition: Given a training mission that involves a specified
Arizona County Community College Districts and Colleges of Qualifying Indian Tribes Year Ended June 30, 2014
 A REPORT TO THE ARIZONA LEGISLATURE Financial Audit Division Arizona County Community College Districts and Colleges of Qualifying Indian Tribes Debra K. Davenport Auditor General The Auditor General is
RE: James vs. ABC Company Greentown, NJ D/A: February 20, 2011
 PO Box 7100 Hackettstown, NJ 07840 Phone: 1 800 427 3456 Fax: 908-850-8664 http://www.weatherworksinc.com June 16, 2012 Attn: John Doe Law Offices of John Doe 123 Fourth Street Smithtown, NJ 04506 RE:
EPIC enews. Remember: No H-Bombs! Quarterly Highlights. Upcoming Events
 EXCELLENCE IN PRE-HOSPITAL INJURY CARE EPIC enews See Epic.arizona.edu for more details J ULY, 2014 Welcome to the EPIC enewsletter! Keeping you up to date Quarterly Highlights July 16 Upcoming Events
Temporal variation in snow cover over sea ice in Antarctica using AMSR-E data product
 Temporal variation in snow cover over sea ice in Antarctica using AMSR-E data product Michael J. Lewis Ph.D. Student, Department of Earth and Environmental Science University of Texas at San Antonio ABSTRACT
Arts Education in Arizona Public Schools for the 2012/2013 School Year
 Arts Education in Arizona Public Schools for the 2012/2013 School Year An Analysis of the Arizona Highly Qualified Teacher Database Prepared for the Arizona Commission on the Arts and the Arizona Department
Monsoon Variability and Extreme Weather Events
 Monsoon Variability and Extreme Weather Events M Rajeevan National Climate Centre India Meteorological Department Pune 411 005 rajeevan@imdpune.gov.in Outline of the presentation Monsoon rainfall Variability
EMPLOYMENT, TRAINING & EDUCATION
 EMPLOYMENT, TRAINING & EDUCATION IN THIS SECTION YOU WILL FIND INFORMATION ON: EMPLOYMENT TIPS JOBS - FOOD STAMP EMPLOYMENT AND TRAINING PROGRAMS TWO PARENT EMPLOYMENT PROGRAM (TPEP) WORKFORCE INVESTMENT
What Causes Climate? Use Target Reading Skills
 Climate and Climate Change Name Date Class Climate and Climate Change Guided Reading and Study What Causes Climate? This section describes factors that determine climate, or the average weather conditions
Alternatives to Incarceration
 Alternatives to Incarceration A Review of Arizona Pre-Trial Diversion Programs Research by Paula Arnquist for The American Friends Service Committee---Arizona Office August 2013 Research Project Scope
JOINT TECHNOLOGY EDUCATION DISTRICT JTED
 JOINT TECHNOLOGY EDUCATION DISTRICT JTED There is a place in America to take a stand and that stand is public education. TOM BROKAW JTED // OVERVIEW JTED System The Joint Technology Education District
This is a brief survey to learn your thoughts and suggestions on the draft 2015 Arizona Music Standards.
 During the 2014/2015 school year, the Arizona Department of Education is revising Arizona s Academic Standards in the Arts, including the Music Standards. This is a brief survey to learn your thoughts
Arizona County Community College Districts and Colleges of Qualifying Indian Tribes
 A REPORT TO THE ARIZONA LEGISLATURE Financial Audit Division Full-Time Equivalent Student Enrollment Report Arizona County Community College Districts and Colleges of Qualifying Indian Tribes Debra K.
8.5 Comparing Canadian Climates (Lab)
") These 3 climate graphs and tables of data show average temperatures and precipitation for each month in Victoria, Winnipeg and Whitehorse: Figure 1.1 Month J F M A M J J A S O N D Year Precipitation 139
These 3 climate graphs and tables of data show average temperatures and precipitation for each month in Victoria, Winnipeg and Whitehorse: Figure 1.1 Month J F M A M J J A S O N D Year Precipitation 139
Arizona County Community College Districts
 A REPORT TO THE ARIZONA LEGISLATURE Financial Audit Division Dual Enrollment Full-Time Equivalent Student Report Arizona County Community College Districts Debra K. Davenport Auditor General The Auditor
ES 106 Laboratory # 6 MOISTURE IN THE ATMOSPHERE
 ES 106 Laboratory # 6 MOISTURE IN THE ATMOSPHERE 6-1 Introduction By observing, recording, and analyzing weather conditions, meteorologists attempt to define the principles that control the complex interactions
Section 5 CLIMATE TABLES
 Section Section CLIMATE SOURCES OF DATA... -1 HISTORICAL CONTEXT... -1 PRECIPITATION... -2 TEMPERATURES... -3 EVAPOTRANSPIRATION... -3 WIND SPEED AND DIRECTION... -4 DEGREE DAYS...-4 CONCLUSIONS AND RECOMMENDATIONS...
Local Fire Activity for Yesterday
 Managers Briefing DATE PREPARED 06/08/15 TIME PREPARED NATIONAL PREPAREDNESS LEVEL RMACC PREPARDNESS LEVEL 1 1 *Upper Elevation Fire Danger CPC PREPARDNESS LEVEL 1 **Lower Elevation Fire Danger *School
Covenant Marriage In Arizona
 Covenant Marriage In Arizona Table of Contents Covenant Marriage in Arizona...1 What is a Covenant Marriage?...1 Entering into a Covenant Marriage...2 Covenant Marriage for Already Married Persons..4 Limited
Heavy Rainfall from Hurricane Connie August 1955 By Michael Kozar and Richard Grumm National Weather Service, State College, PA 16803
 Heavy Rainfall from Hurricane Connie August 1955 By Michael Kozar and Richard Grumm National Weather Service, State College, PA 16803 1. Introduction Hurricane Connie became the first hurricane of the
Purpose: To determine the dew and point and relative humidity in the classroom, and find the current relative humidity outside.
 Lab Exercise: Dew Point and Relative Humidity Purpose: To determine the dew and point and relative humidity in the classroom, and find the current relative humidity outside. Relative humidity is a measure
2015-2016 We the People Technical Assistance Regional Coordinator Request for Proposals
 2015-2016 We the People Technical Assistance Regional Coordinator Request for Proposals This is an exciting opportunity to: Transfer your knowledge of We the People to students new to the program Impact
Arizona Registrar of Contractors
 Arizona Registrar of Contractors Newsletter, September 2015 Director s Note The Licensing Department serves a vital role for the citizens of Arizona. They are on the frontlines of ensuring Arizona s licensed
Climate, Vegetation, and Landforms
 Climate, Vegetation, and Landforms Definitions Climate is the average weather of a place over many years Geographers discuss five broad types of climates Moderate, dry, tropical, continental, polar Vegetation:
Water Year 2001 in Northern California: Have the Good Years Ended?
 Water Year 21 in Northern California: Have the Good Years Ended? Maurice Roos Abstract For the second water season in a row, precipitation and snowpack accumulation from October through December were far
Name Period 4 th Six Weeks Notes 2015 Weather
 Name Period 4 th Six Weeks Notes 2015 Weather Radiation Convection Currents Winds Jet Streams Energy from the Sun reaches Earth as electromagnetic waves This energy fuels all life on Earth including the
2013 State of Arizona Hazard Mitigation Plan Risk Assessment
 Severe Winds Introduction/History Atmospheric or seasonal storm events are general accompanied by flooding and/or severe winds which cause extensive damage across the State. The 2007 Arizona State hazard
FLOOD FORECASTING PRACTICE IN NORTHERN CALIFORNIA
 FLOOD FORECASTING PRACTICE IN NORTHERN CALIFORNIA California Department of Water Resources Post Office Box 219000, Sacramento, California 95821 9000 USA By Maurice Roos, Chief Hydrologist ABSTRACT Although
IGAD CLIMATE PREDICTION AND APPLICATION CENTRE
 IGAD CLIMATE PREDICTION AND APPLICATION CENTRE CLIMATE WATCH REF: ICPAC/CW/No.32 May 2016 EL NIÑO STATUS OVER EASTERN EQUATORIAL OCEAN REGION AND POTENTIAL IMPACTS OVER THE GREATER HORN OF FRICA DURING
2013 State of Arizona Hazard Mitigation Plan Risk Assessment
 Extreme Heat Introduction/History Extreme Heat is the combination of very high temperatures and exceptionally humid conditions that exceed regionally based indices for perceived risk. The major human risks
Queensland rainfall past, present and future
 Queensland rainfall past, present and future Historically, Queensland has had a variable climate, and recent weather has reminded us of that fact. After experiencing the longest drought in recorded history,
CLIMATE OF RWANDA. Overview. Linked to other lessons
 Geography S6 GENERAL PHYSICAL GEOGRAPHY OF RWANDA Lesson 75 Developed by (Niwagaba Innocent) Subtopic Climate and factors influencing it in Rwanda Specific Objectives The learners must be able to: Describe
2015-2016 Project Citizen Technical Assistance Regional Coordinator Request for Proposals
 2015-2016 Project Citizen Technical Assistance Regional Coordinator Request for Proposals This is an exciting opportunity to: Transfer your knowledge of Project Citizen to students new to the program Impact
Storms Short Study Guide
 Name: Class: Date: Storms Short Study Guide Multiple Choice Identify the letter of the choice that best completes the statement or answers the question. 1. A(n) thunderstorm forms because of unequal heating
SIXTH GRADE WEATHER 1 WEEK LESSON PLANS AND ACTIVITIES
 SIXTH GRADE WEATHER 1 WEEK LESSON PLANS AND ACTIVITIES WATER CYCLE OVERVIEW OF SIXTH GRADE WATER WEEK 1. PRE: Evaluating components of the water cycle. LAB: Experimenting with porosity and permeability.
Temperature affects water in the air.
 KEY CONCEPT Most clouds form as air rises and cools. BEFORE, you learned Water vapor circulates from Earth to the atmosphere Warm air is less dense than cool air and tends to rise NOW, you will learn How
RaysWeather.Com 2015-2016 Winter Fearless Forecast
 Author: Dr. Ray Russell Founder and President of RaysWeather.Com Date: October 10, 2015 RaysWeather.Com 2015-2016 Winter Fearless Forecast Background It's that time of year--leaves change, temperatures
defined largely by regional variations in climate
 1 Physical Environment: Climate and Biomes EVPP 110 Lecture Instructor: Dr. Largen Fall 2003 2 Climate and Biomes Ecosystem concept physical and biological components of environment are considered as single,
Directory of Arizona One-Stop Sites
 Directory of Arizona One-Stop Sites 2009 Page 1 of 12 DIRECTORY OF SITES A main feature of Title I of the Workforce Investment Act (WIA) of 1998 is the creation of a One- Stop customer delivery system.
Climate Extremes Research: Recent Findings and New Direc8ons
 Climate Extremes Research: Recent Findings and New Direc8ons Kenneth Kunkel NOAA Cooperative Institute for Climate and Satellites North Carolina State University and National Climatic Data Center h#p://assessment.globalchange.gov
Name: OBJECTIVES Correctly define: WEATHER BASICS: STATION MODELS: MOISTURE: PRESSURE AND WIND: Weather
 Name: OBJECTIVES Correctly define: air mass, air pressure, anemometer, barometer, cyclone, dew point, front, isobar, isotherm, meteorology, precipitation, psychrometer, relative humidity, saturated, transpiration
Temperature and Humidity
 Temperature and Humidity Overview Water vapor is a very important gas in the atmosphere and can influence many things like condensation and the formation of clouds and rain, as well as how hot or cold