Franklin Regional Transit Authority
|
|
|
- Amanda Parrish
- 7 years ago
- Views:
Transcription


1 Franklin Regional Transit Authority Regional Transit Plan Final Report - August 2015 Burke & Company
2
3 TABLE OF CONTENTS Executive Summary...1 Overview... 1 Recommended Phase Approach... 2 Benefits... 4 Cost Estimation... 4 Framework... 5 Task Summaries Project Overview Project Purpose Core Goals and Objectives FRTA Goals and Objectives FRTA Performance Analysis Service Overview Ridership Service Operations Service Productivity Financial Performance Service Frequency Ranking of Weekday Route Performance Key Findings Determining Demand Regional Job Creation Goals and Employment Needs Transit Market Analysis Fare Rates and Collection Methods Collection Methods Fare Structure National Best Practices Conclusion Environmental GreenDOT Policy Conclusion Recommendations Introduction Strategies for Service Recommendation Recommendations Overview Cost Estimation Recommended Service Guidelines
4 7.6 Performance Measures Recommendation Profiles Conclusion Appendix A Market Demand Maps Appendix B Recommendation Memo Appendix C Public Outreach Appendix D Public Hearing Comments
5 FIGURES Figure 1: FRTA Service Area... 1 Figure 2: Proposed Route Network... 3 Figure 3: Cost by Phase... 5 Figure 4: FRTA Monthly Ridership FY FY Figure 5: FRTA Ridership by Route FY Figure 6: FRTA Percent Ridership Change by Route FY FY Figure 7: FRTA Annual Revenue Hours FY FY Figure 8: FRTA Annual Revenue Miles FY FY Figure 9: FRTA Annual Operating Costs FY FY Figure 10: FRTA Annual Passengers per Revenue Hour FY FY Figure 11: FRTA Productivity by Route FY FY Figure 12: FRTA Percent Productivity Change FY FY Figure 13: FRTA Annual Farebox Recovery FY FY Figure 14: FRTA Annual Subsidy per Passenger FY FY Figure 15: FRTA Weekday Subsidy per Passenger Figure 16: FRTA Regional Major Employers Figure 17: Older Populations Figure 18: Population Density Figure 19: Employment Density Figure 20: Transit Demand - Level of Service Figure 21: Median Household Income Figure 22: Zero Vehicle Household Figure 23: Underserved Areas Figure 24: Area A: Bernadston Figure 25: Area B: Orange Figure 26: Area C: Hatfield Figure 27: Area D: Huntington Figure 28: Area E: Southampton Figure 29: Area F: Southwick Figure 30: SmartCard Technologies. Left WMATA Smartrip contact-less; Center TRI MET mobile ticketing; Right Disney's Magic Band Figure 31: Helsinki Mobility as a Service App Figure 32: All Applicable Indicators Level of Attainment Figure 33: All Applicable Indicators Attainment by Year Figure 34: Wood Pellet Boiler Figure 35: Air Indicators Level of Attainment Figure 36: Air Indicators Attainment by Year
6 Figure 37: Top left: Solar Wall, Bottom Left: Photovoltaic Array, Right: Geothermal Pumps Figure 38: Energy Air Indicators Level of Attainment Figure 39: Energy Indicators Attainment by Year Figure 40: Bio-retention garden at JWOTC Figure 41: Land Indicators Level of Attainment Figure 42: Land Indicators Attainment by Year Figure 43: John W. Olver Transit Center Figure 44: Materials Air Indicators Level of Attainment Figure 45: Material Indicators Attainment by Year Figure 46: FRTA bike rack Figure 47: Planning Indicators Level of Attainment Figure 48: Planning Indicators Attainment by Year Figure 49: Litter control program at JWOTC Figure 50: Waste Indicators Level of Attainment Figure 51: Waste Indicators Attainment by Year Figure 52: Water Indicators Level of Attainment Figure 53: Water Indicators Attainment by Year Figure 54: Phase Figure 55: Phase 2 & Figure 56: Cost by Phase Figure 57: Fleet Requirements by Phase TABLES Table 1: Core Goals and Objectives Table 2: FRTA Route Overview Table 3: Ranking of FRTA Routes Table 4: Frequency Thresholds Table 5: Transit Demand Data Variables and Sources Table 6: Transit Demand Variables and Formulas Table 7: Fares Table 8: GreenDOT Goals, Objectives and Indicators Table 9: Air Goal Achievement Table 10: Energy Goal Achievement Table 11: Land Goal Achievement Table 12: Material Goal Achievement Table 13: Planning, Policy & Design Goal Achievement Table 14: Waste Goal Achievement
7 Table 15: Water Goal Achievement Table 16: Service Recommendations Table 17: Recommendations by Phase Table 18: FRTA Route Types Table 19: Service Thresholds Table 20: Minimum Service Spans Table 21: Minimum frequencies Table 22: Passenger per Hour Table 23: Cost per Hour Performance Standard Criteria Table 24: Phase Requirements Table 25: Summary of Recommendations
8
9 Executive Summary Burke & Company
 Geographically, FRTA covers the largest service area of all regional transit authorities in the state of")
10 EXECUTIVE SUMMARY Overview Franklin Regional Transit Authority (FRTA) provides fixed route bus service for 41 communities throughout Franklin, Hampden, Hampshire, and Worcester Counties. However fixed route service covers only 12 communities (2 of which are not in the FRTA region) Geographically, FRTA covers the largest service area of all regional transit authorities in the state of over 1,100 square miles and provides service to both rural and small urban communities. Figure 1 depicts FRTA s service area. Figure 1: FRTA Fixed Route Service Area FRTA operates a fleet of 43 transit vehicles, seventeen (17), of which are used to provide fixed-route service to the region. Service is provided Monday through Friday between 5:00 AM and 6:30 PM; service does not operate on weekends. FRTA carried 133,019 fixed route passengers during FY The State Legislature, in response to requirements of the Transportation Finance Bill passed in 2013, tasked each Regional Transit Authority (RTA) in the Commonwealth of Massachusetts to prepare a Regional Transit Plan. The purpose of this plan is to: Executive Summary 1 P age
11 - examine FRTA s existing service - identify local markets with potential ridership - provide recommendations on ways to improve service operations. The consultant firm of AECOM was selected to prepare this plan with assistance provided by FRTA, MassDOT, and local stakeholders. Recommended Phase Approach To meet the goals of the plan, recommendations are made to improve FRTA service over 3 phases, as follows: In Phase 1, Route 21 has been split into two routes (21, 25/62) and frequency has been improved. Additional alignment changes are also made to combine Route 22 and Route 32 into one route. The Route 23 will service Sugarloaf Apartments to connect with the PVTA instead of UMass. Schedules are adjusted to improve transfers with the neighboring RTAs and weekday service has been extended into the evening until 7:30 PM. During Phase 2, Saturday service is implemented. Route 25/62 is split into two separate routes and route frequency is improved. An express bus to rthampton via I-91 is implemented during peak hours. In this phase FRTA should explore operating service on select holidays for which service does not currently operate. Finally in Phase 3, service is implemented on Sunday and the express route to rthampton is increased to all day service. Figure 2 depicts the FRTA service area with the proposed route network based on the recommendations in all three phases. Executive Summary 2 P age

12 Executive Summary 3 P age Figure 2: Proposed Route Network
13 Benefits Implementing the phased recommendations would provide benefits to FRTA and aid them in meeting their goals and objectives to provide a cost-efficient system while maintaining a high level of service to its riders. The phased service improvements would result in the following benefits: 1. Adjusting route schedules to improve connections with PVTA and MART would provide FRTA passengers access to a larger transit network. 2. Improving route frequencies would provide a higher and more convenient level of service to FRTA riders. 3. Implementing alignment changes would allow FRTA to provide service to areas that demonstrate demand for transit service. 4. Expanding service to new areas, extending hours of operation during weekday evenings, and implementing service on Saturday and Sunday would expand mobility in the region. The following are FRTA objectives that have been met through the development and selection of the phased recommendations: Goal #1: Provide high-quality, customer-oriented service Objective 1.a: Expand weekday hours Objective 1.b: Implement weekend service Objective 1.c: Increase frequency on highly productive corridors Objective 1.d: Improve transit access for the public Goal #2: Provide effective and safe services Objective 2.a: Improve the productivity of routes Objective 2.b: Increase service area commensurate with growing demand and need within the region Objective 2.c: Design routes to improve on-time performance and minimize dwell time Cost Estimation With the implementation of each phased recommendation, additional operational and capital improvements would increase FRTA s annual cost. Figure 3 depicts the base operating costs for the existing system along with the additional costs associated with the service improvements in each phase. FRTA s existing annual revenue operating hours are 14,488; these hours are expected to increase throughout each phase. During Phase 1 annual revenue hours would increase by 6,229; annual revenue hours would increase by 3,833 in Phase 2 and finally by 10,346 to an estimated 34,895 hours in Phase 3. 4 P age
14 FRTA Systemwide Cost by Phase $4,000,000 $3,500,000 $3,000,000 $2,500,000 $2,000,000 $1,500,000 $1,000,000 $500,000 $0 Existing Phase 1 Phase 2 Phase 3 Phase increased cost 0 $682,000 $420,000 $1,133,000 Base cost $1,200,000 $1,200,000 $1,882,000 $2,302,000 Phase increased cost Base cost Capital Costs Figure 3: Cost by Phase Phase 1 service improvements have been designed using the constraint of FRTA s existing fleet of 17 fixed route buses, 8 of which are used during peak service. Additional vehicles will be required for the recommendations presented in Phases 2 and 3. To implement these phases in a timely manner, FRTA must begin the planning process now as vehicle procurement can take up to two years before the buses can be put into service. During peak service, Phase 2 will require 11 vehicles and Phase 3 will require 13 vehicles. Framework Recommendations were developed using a cumulative process that incorporated public outreach, a diverse steering committee, operational input from FRTA, and analysis of existing transit service and the local/regional market. Strategies to improve the system were developed based on FRTA s goals and objectives and the following guidelines: 1. Simplify Routes should be designed along main corridors with minimal schedule deviations. For routes that are not linear, service should be provided in both directions. 2. Service should match demand The denser (both in terms of employment and population) areas should have a higher level of service with either higher frequency routes or multiple lower frequency routes. Major corridors often warrant higher frequencies. 3. Standardized frequency Frequencies should be standardized using clock-face schedules to create 30, 60 and 120 minute headways. 5 P age
15 4. Priority to existing ridership Service should be increased in areas that warrant it over servicing new areas if limited resources are available. 5. Efficiency Where possible routes should be designed to be the most efficient. Decisions to deviate off the main corridor and add time to the route are only warranted where key destinations like shopping centers are too far off the main road, there are a lack of pedestrian facilities or the benefit (due to demand) of servicing the deviation outweighs the additional time incurred to others on the route. 6. Consistency Except where warranted by peak only routes or increased peak hour service, service should have consistent headways throughout the day using clock-face schedules. 7. Regional network Regional connections should be improved to provide access outside of the FRTA service area through timed transfers with other systems such as PVTA or MART, to areas identified as common destinations through the market analysis and public outreach process. Task Summaries The Transportation Finance Bill assigned the following nine tasks to be evaluated by each RTA: Task 1. Comprehensive Assessment of Transit Services FRTA has created a mission statement, goal, and objectives to help guide future service improvements. FRTA s mission statement and objectives, as outlined below, have been considered in the development of this Regional Transit Plan. Goal #1: Provide high-quality, customer-oriented service Goal #2: Provide effective and safe services Goal #3: Promote the transit service Task 2. Examination of Ridership Trends Ridership data collected from FY 2012, 2013, and 2014 was used to analyze yearly transit ridership trends. In FY 2014, FRTA reported 133,019 passengers. Recently, use of FRTA s service has declined; between FY 2012 and FY 2013 ridership decreased by roughly 1.6% and by 8.8% between FY 2013 and FY Part of this decrease may be attributed to a reduction of service after the town of Athol joined a neighboring RTA. Ridership is highest during the fall and spring due to student populations. Ridership increased between FY 2012 and FY 2014 on Routes 21 (8.2%) and 31 (4.3%). Task 3. Performance Analysis of Service Each route in the FRTA service area was evaluated based on several factors including ridership, passengers per revenue hours, and subsidy per passenger. The top three performing routes during the weekday include Routes 22 (Montague Greenfield), 31 (rthampton Greenfield), and 21 (Greenfield Community). These routes are top priorities for service investment and may benefit from increased service frequencies or service spans. Routes performing below average, such as Route 23 6 P age
16 (Amherst Greenfield) may require additional analysis to determine the cause of the problem or may be considered for discontinuation of service. Task 4. Develop and Evaluate Service Alternatives Service alternatives for the entire FRTA system were evaluated through a process that incorporated public outreach, a diverse steering committee, operational input from FRTA, and analyses of the existing transit service and local market. Alternatives were guided by the five goals identified by FRTA to improve service. Preliminary alternatives were presented to FRTA at a workshop where they were further refined. Task 5. Recommendations to Better Align Service Recommendations for FRTA have been presented through a three phase approach. Phases establish the immediacy and prioritization of needs and are based on an incremental approach and by the availability of resources. Recommendations in Phase 1 can be implemented immediately while recommendations in Phase 2 and 3 can only be implemented as resources become available. Phase 1 recommendations include standardizing frequencies, adjusting alignments, adjusting schedules to improve transfers, and implementing evening service. During Phase 2, Saturday service and new routes have been implemented. Lastly, in Phase 3, service has been implemented on Sunday. Task 6. Commonwealth s Environmental Policies GreenDOT s implementation plan, developed in 2012, identifies themes, goals and indicators to guide transportation development to a more sustainable future. An evaluation of FRTA s services was conducted to determine their ongoing compliance with the policy. While there are over 300 short, medium, and long-term indicators, only 78% are applicable to FRTA. Of these applicable indicators, FRTA is already meeting 26% and working towards meeting additional medium-term indicators by 2015 and long-term indicators by Task 7. Fare Rates and Collection Methods In 2009, FRTA installed GFI Genfare Electronic Validating Fareboxes on all fixed route vehicles. These fareboxes accept coins and bills and can issue change cards, essentially a stored value card, which can be used towards payment for future fares. Stored value cards can be purchased on the buses or from the JWO Transit Center. Adult fares range from $1.00 to $3.00 depending on the route while elderly persons, Medicare card holders, and disabled passengers receive a half price fare. Moving forward, FRTA should explore new technology, such as mobile payments or bpay/magic Band/Uband, to replace outdated fare collection methods. Task 8. Region s Job Creation Goals and Employment Needs FRTA s economy is shifting from that historically has been agricultural and manufacturing-based to an economy that is now strongly supported by the service industry. The top four industries in the region are healthcare (18.6%), manufacturing (18.4%), retail trade (14.9%) and food service (14.9%). While 7 P age
17 manufacturing is the second largest sector of the economy, it is quickly declining; 1,000 manufacturing jobs have been lost since Understanding the region s employment sector will allow FRTA to provide a better level of service to workers in the region. Task 9. Determination of Effectiveness of FRTA Service to Meet the Needs of the Region s Workforce The following indicators were used to identify demand levels across the region: population density, employment density, elderly populations, zero vehicle households, median household income, disabled households, schools, colleges and universities, hospitals, priority development areas, park and ride lots, and commuter rail. The analysis revealed that FRTA provides fixed-route service to all but six areas with high transit demand. These six underserved areas include Bernardston, Orange, Hatfield, Huntington, Southampton, and Southwick. There are 48 employers with more than 100 employees in the FRTA region; 77% of these employers are currently served by FRTA routes. Extending service to underserved employment centers would help improve mobility in the region. 8 P age
18 Page intentionally left blank
19 Chapter 1 Project Overview Burke & Company
20 1. PROJECT OVERVIEW The Franklin Regional Transit Authority has prepared this Draft Regional Transit Plan in accordance with the Transportation Finance Bill. The State Legislature has instructed all Regional Transit Authorities (RTAs) in the Commonwealth of Massachusetts to undertake the preparation of a Regional Transit Plan as a requirement of the Transportation Finance Bill passed in These Regional Transit Plans present an opportunity to improve local bus service operations, identify new markets of service opportunity, and meet the identified needs for public transit services in each respective RTA service area. Section 63 of the Bill notes nine discrete tasks that each Regional Transit Plan must address. These tasks are as follows: (1) Comprehensive assessment of transit services (2) Thorough examination of the ridership trends for each line and service provided by the regional transit authority (3) Performance analysis of existing services (4) Development and evaluation of alternative service scenarios (5) Development of a recommendation to better align service with local and regional demand (6) Commonwealth s environmental policies (7) Fare rates and collection methods (8) Region s job creation goals and employment needs (9) Determination of whether the regional transit authority s service is deployed in the most effective way possible to accommodate the transit needs of the region s workforce. Each RTA is also required to hold public hearings on the draft relating to the development of its Regional Transit Plan in order to inform the public and gather their input. 1-1 P age
21 Chapter 2 Project Purpose Burke & Company
22 2. PROJECT PURPOSE The Franklin Regional Transit Authority (FRTA) was established in 1978 under the provisions of Chapter 161B. FRTA currently serves 41 communities throughout Franklin, Hampden, Hampshire, and Worcester Counties. Although it is not the biggest Massachusetts transit authority in terms of ridership, FRTA covers the largest service area (over 1,100 square miles) and the most rural geographical area in the State. FRTA currently has a fleet of 13 vehicles used for their fixed route service seven buses and six mini-buses to provide fixed-route and paratransit service to member communities. The Authority is given general responsibilities to develop, finance, and contract for the operation of transportation facilities and services within the service area. The day-to-day affairs of the Authority are managed by the Administrator, who is appointed by the Advisory Board. According to the statute, regional transit authorities cannot operate service directly, but instead must contract with private operators for the provision of service. FRTA contracts with Franklin Transit Management, Inc. for their fixed-route and some demand response service. Due to the rural nature of its service area, FRTA also contracts with local Councils on Aging to provide additional demand response transportation. Since FRTA is a political subdivision of the Commonwealth of Massachusetts, it is funded by Federal, Local, and State governments in addition to farebox and advertising revenues. For Fixed Route service, local assessments are based on the number of vehicle revenue hours of service in each town and for paratransit service local assesments are based on the number of one way trips in each town. Federal and state funds must be used for capital projects such as equipment, preventative maintenance of vehicles, facilities and equipment, ADA services, facility improvements, and the purchase of vehicles. Operating expenses, such as salaries, benefits, advertising and marketing expenses and other cash needs, are funded by grants, federal, state and local monies, and farebox revenue. In August 2006, FRTA assumed the responsibility of providing transportation services for the towns of Greenfield and Montague. Transportation in those two towns was previously operated by the Greenfield Montague Transportation Area (GMTA) under MGL Chapter 161A and included fixed-route and demand response service. FRTA had four original fixed-routes prior to the consolidation of services. Fixed-route service increased to nine routes with expansion into Greenfield, Montague, and Amherst. This consolidation closed previous gaps in demand response service, and ADA service was implemented for consumers in Greenfield and Montague. 2.1 Core Goals and Objectives In April 2013, representatives from several RTAs were asked what they wanted their Regional Transit Plans to accomplish. Ideas were developed and ranked by these representatives to create a core list of goals and objectives for each RTA s Regional Transit Plan. The most highly-rated concepts and those to which each of the Regional Transit Plans will respond are as follows: 2-1 P age
23 Better align service with needs Improve efficiency and cost-effectiveness of system Improve transit access for the public Increase ridership levels Increase transit frequency and service options Increase revenue Improve transit access for transit-dependent populations Support economic development While goals outline priorities, objectives are measurable actions that are necessary to realize the goals. The above list can be broken down as follows: Table 1: Core Goals and Objectives Goals Increase ridership levels Better align service with needs Support economic development Increase revenue Objectives Increase transit frequency and service options Improve transit access for the public Improve transit access for transit-dependent populations Improve efficiency and cost-effectiveness of system It should be noted that goals and objectives that were ranked favorably by individual RTAs but did not receive an overall high ranking will still be considered in the Regional Transit Plan for those authorities. Section 2.2 explains the goals and objectives that are specific to FRTA. 2.2 FRTA Goals and Objectives In addition to responding to the core goals and objectives outlined in Section 2.1, the Regional Transit Plan for FRTA is also based on concerns related to their system. The goals and objectives echo the feedback received from a series of Community Conversations on Transit held with the public at four separate locations. The public outreach has helped form these goals and objectives. Mission Statement: FRTA has established a rural transit system that will improve the quality of life and enhance the economic health of the region and its residents through cost effective, accessible, safe, dependable, and courteous transportation services. The RTA is committed to finding ways to assist those living in low income and low population areas so that they will have access to the same modes of transit needed to nurture independence in their later years and allow less dependency on owning a vehicle. By educating our consumers on the benefits of public transit, FRTA hopes to reduce the carbon footprint in our service area and surrounding communities. 2-2 P age
24 Goal: The primary goal of FRTA is to implement its vision for transportation services in the region, as explained in the mission statement above. To meet this goal, FRTA will use the following objectives. Objectives: 1. Expand fixed route service hours during the week and implement Saturday and/or Sunday fixed route service. 2. Create a travel training program to perform in-person assessments for our disabled population and to help transition paratransit riders onto the fixed-route system. 3. Increase fixed-route frequencies to average 30 minute headways on Routes 21 and 22, 60 minute headways on Routes 31 and 32, and 120 minute headways on Routes 23 and P age
25 Chapter 3 Perfromance Analysis Burke & Company
26 3. FRTA PERFORMANCE ANALYSIS 3.1 Service Overview The Franklin Regional Transit Authority (FRTA) has the largest service area of the 15 RTAs in Massachusetts with 41 communities spanning nearly 1,100 square miles. Ten of the communities receive fixed route service in addition to two non-member communities. FRTA is responsible for fixedroute service within its service area as well as the coordination of paratransit services. All routes operate to and from Greenfield serving the John W. Olver Transit Center from Monday through Friday between 5:00am and 6:30pm, with no service provided on Saturday or Sunday. Table 2 provides a brief overview of the services provided by FRTA. Route Service Type Description Days Operated Service Span Service Frequency 21 Fixed-route Greenfield Community Weekdays 6:15am - 6:00pm 5 trips/day 22 Fixed-route Montague Greenfield Weekdays 6:15am - 6:30pm 8 trips/day 23 Fixed-route Amherst Greenfield Weekdays 6:45am - 4:10pm 2 trips/day 31 Fixed-route rthampton Greenfield Weekdays 5:15am - 6:15pm 6 trips/day 32 Fixed-route Orange Greenfield Weekdays 5:00am - 6:22pm 7 trips/day 41 Fixed-route Charlemont Greenfield Weekdays 6:45am - 5:35pm 4 trips/day Corp Fixed-route Corporate Center Shuttle Weekdays 8:00am - 3:25pm 5 trips/day 3.2 Ridership Table 2: FRTA Route Overview 3.21 System Ridership FRTA s annual ridership in FY 2012 was 137,383 and has been on a steady decline with FY 2014 ridership at 123,303 passengers. Ridership dropped about 1.6 percent between FY 2012 and FY 2013 and 8.8 percent between FY 2013 and FY One of the reasons for this ridership decline is the reduction of service to Athol after the town joined the MART service area. FRTA averages approximately 11,000 passengers each month. Average monthly ridership has remained largely stable over the last three fiscal years with diminished ridership relative to previous years seen in January through March of Ridership drops slightly during the winter and summer months, due to the student populations, and is strongest in the spring and fall. Figure 4 shows FRTA ridership per month from FY 2012 to FY P age
27 Monthly Ridership Monthly Ridership 14,000 12,000 10,000 8,000 6,000 4,000 2,000 FY 12 FY 13 FY 14 0 Jul Aug Sep Oct v Dec Jan Feb Mar Apr May Jun Month 3.22 Weekday Ridership Figure 4: FRTA Monthly Ridership FY FY 2014 Average daily weekday system ridership for FY 2014 was 471 passengers. Average ridership per route among FRTA s six routes is 81 passengers per route. Routes 31 and 21 exhibit the highest ridership in the system with 126 and 118 daily passengers respectively. These figures are shown in Figure 5. FRTA recently introduced a Corporate Center Shuttle route; however, complete data was not yet available for this route and as such it is not included in this analysis. Ridership by Route (FY 2014) Average Weekday Ridership Route System average: 81 passengers/route Figure 5: FRTA Ridership by Route FY P age
28 Figure 6 shows the percent change in daily average ridership from FY 2012 to FY 2014 for individual routes. Of the six routes, two Routes (Routes 21 and 31) experienced growth in ridership. Routes 23 and 32 had the largest decreases in ridership, losing 47 and 36 percent of their riders respectively. Overall, weekday ridership decreased by about 11 percent. Fluctuations in ridership do not correlate with changes in service revenue hours as service hours remained unchanged between fiscal years 2012 and 2014, as discussed in Section 3.3 below. It is speculated that the drop in ridership on the 41 is because less students are traveling to the Academy of Charlemont. The drop in ridership on Route 32 is due to the reduction in service when Athol left FRTA to join MART. Route 23 has such low ridership that a minor change in ridership is magnified greatly in a percent change. Percent Change 20% 10% 0% -10% -20% -30% -40% Percent Ridership Change FY FY % Route Figure 6: FRTA Percent Ridership Change by Route FY FY Weekend Ridership FRTA does not currently operate any weekend services. 3-3 P age
29 3.3 Service Operations 3.31 Revenue Hours FRTA runs approximately 14,200 revenue hours each year in regular fixed-route service with a monthly average of approximately 1,180 hours. significant changes have taken place in the overall amount of annual fixed-route revenue hours operated by FRTA between FY 2012 and FY Figure 7 shows annual revenue hours from FY 2012 to FY ,000 14,000 Annual Revenue Hours Annual Revenue Hours 12,000 10,000 8,000 6,000 4,000 2,000 0 FY 2012 FY 2013 FY 2014 Fiscal Year Figure 7: FRTA Annual Revenue Hours FY FY Revenue Miles FRTA operated approximately 335,000 regular fixed-route revenue miles annually in both FY 2012 and FY 2013, but decreased in FY 2014 to approximately 325,000 miles, averaging approximately 27,000 revenue miles per month. This is due to a 14.3 percent reduction in Route 32 mileage in FY 2014 from a revised routing now terminating at the Hannaford supermarket on the Orange/Athol town line rather than the Athol Memorial Hospital at Main Street and Mechanic Street in Athol following the departure of the Town of Athol from FRTA. This has also extended operator layover at the route s eastern terminus to 26 minutes. This change in route structure creates the potential for the introduction of greater service efficiencies in the service planning process through, for example, route restructuring or interlining to improve service efficiency. Figure 8 shows annual revenue miles for FY 2012 to FY P age
30 Annual Revenue Miles Annual Revenue Miles 400, , , , , , ,000 50,000 0 FY 2012 FY 2013 FY 2014 Fiscal Year Figure 8: FRTA Annual Revenue Miles FY FY Operating Costs FRTA operations cost was $1.28 million annually in FY 2013, with a monthly average of about $106,000. FRTA had an hourly operating cost of $ per revenue hour in FY FRTA s operating costs show an increase between FY 2012 and FY 2014 of 15 percent to $1.3 million, despite no significant increases in service taking place during that period. Figure 9 shows FRTA s annual operating costs between FY 2012 and FY System Operating Costs $1,400,000 $1,200,000 $1,000,000 $800,000 $600,000 $400,000 $200,000 Annual Operating Costs $0 FY 2012 FY 2013 FY 2014 Fiscal Year Figure 9: FRTA Annual Operating Costs FY FY P age
31 3.4 Service Productivity 3.41 System Productivity Productivity measures the ridership generated per unit of service (revenue hours or revenue miles) and provides an understanding of the effectiveness of a route or transit network. While revenue hours have stayed largely constant since FY2012, ridership has decreased, reducing FRTA s system productivity from 9.7 passengers per revenue hour in FY 2012 to 8.5 passengers per revenue hour in FY 2014, as shown in Figure Annual Productivity Passengers per Revenue Hour FY 2012 FY 2013 FY 2014 Fiscal Year Figure 10: FRTA Annual Passengers per Revenue Hour FY FY Weekday Productivity FRTA routes exhibit a wide range of performance, as shown in Figure 11. The routes with the highest ridership in the FRTA system are also the routes with the greatest productivity. Route 22 is the best performing route in the system with approximately 13 passengers per revenue hour, while Routes 31 and 21 are both above ten passengers per revenue hour. Route 32, while previously performing among FRTA s better routes, has experienced a significant decrease in productivity due to its April 2013 truncation at the Orange/Athol town line, falling from 10 passengers per revenue hour to 6 between FY 2012 and FY Routes 41 and 23 are the least productive at 4.4 and 2.7 passengers per revenue hour respectively. 3-6 P age
32 Productivity by Route Passengers per Revenue Hour Route System average: 8.5 passengers/revenue hour Passengers per Revenue Hour Average Figure 11: FRTA Productivity by Route FY FY 2014 Figure 12 shows the percent change in productivity from FY 2012 to FY 2014 to date for all individual routes. Only Routes 21 and 31 experienced growth in ridership, while all other routes experienced losses. In particular, Routes 32 and 23 experienced losses in service productivity of 37 and 47 percent respectively. Route 32 s decrease can likely be again attributed to the departure of Athol from FRTA and the resulting loss of its ridership, while the percent decrease on Route 23 can be attributed, in part, to its overall low ridership with only eleven average daily passengers, the loss of a few passengers will magnify the losses in terms of a percentage. 3-7 P age
33 Percent Productivity Change FY FY % 0% Percent Change -10% -20% -30% -40% -50% Route Figure 12: FRTA Percent Productivity Change FY FY Financial Performance 3.51 Farebox Recovery Ratio The farebox recovery ratio is the ratio of fare revenue to operating costs. Higher ratios indicate higher cost-effectiveness and measure the portion of operating costs covered by passenger fares. The higher the farebox ratio, the lower the subsidy a route needs to operate, leaving more funding available to operate more service. FRTA s rural service offers few opportunities to maintain a competitive farebox recovery ratio while keeping fares affordable to customers. Fares are free for veterans and individuals registered with the Massachusetts Commission for the Blind. Other discounts include children under five riding for free (with a fare paying adult), and half fare prices for ADA and Statewide Access pass holders, and seniors over 60. As such farebox recovery ratios fell below five percent for the past three fiscal years, as shown in Figure 13. However, performance has diminished in that time from 10.7 percent in FY 2012 to 7.6 percent in FY2014 through March 31st. While operating costs have increased slightly since FY 2012, the decrease in financial efficiency is most strongly driven by decreases in passenger revenue. While farebox recovery ratios for rural transit systems are typically low according to 2011 figures from the Rural National Transit Database 1, eight percent of total operating expenses are covered through fare P age
34 revenue for all rural transit systems 2, while 14 percent of total operating expenses for medium-large rural systems such as FRTA are covered by fare revenue FRTA s system wide farebox recovery ratio is still very low in comparison. However, the average farebox recovery ratio for other agencies in FTA Region I, encompassing the entirety of New England, is only five percent. Annual Farebox Recovery Operating Revenue / Operating Costs 14.0% 12.0% 10.0% 8.0% 6.0% 4.0% 2.0% 0.0% FY 2012 FY 2013 FY 2014 (through 3/31) Figure 13: FRTA Annual Farebox Recovery FY FY Subsidy per Passenger Subsidy per passenger measures how much it costs to operate transit service on a per passenger basis. It is calculated by subtracting passenger revenue from operating cost and dividing by the total number of passengers. Lower passenger subsidy values indicate that a greater portion of operating costs are recovered through passenger fares, and are more desirable for financial sustainability. Subsidy per passenger has increased over the past three fiscal years. The average subsidy per passenger was $7.29 in FY 2012, $8.57 in FY 2013, and $9.68 in FY Rural areas are defined by the NTD as areas receiving Section 5311 n-urbanized Area Formula Program funding. 3-9 P age
35 Annual Subsidy per Passenger $0.00 FY 2012 FY 2013 FY 2014 $2.00 Subsidy per Passenger $4.00 $6.00 $8.00 $10.00 $12.00 Figure 14: FRTA Annual Subsidy per Passenger FY FY Weekday Subsidy per Passenger Route 22 had the lowest weekday subsidy per passenger at $6.31. Route 23 to Amherst had the highest subsidy at $31.86 per passenger. Figure 15 shows average subsidy per passenger by route on weekdays. Weekday Subsidy per Passenger (FY 2014) $ Subsidy per Passenger $5.00 $10.00 $15.00 $20.00 $25.00 $30.00 $35.00 Avg. $14.26 Figure 15: FRTA Weekday Subsidy per Passenger 3-10 P age
36 3.6 Service Frequency Frequency refers to how often a bus serves a particular route. Service frequencies affect how passengers use the system and the flexibility they can have when making travel plans. FRTA routes operate infrequently, ranging from two to seven trips on each route per direction per day. Routes 22 and 32 run the most frequently with seven trips per direction per day, with frequencies of approximately 120 minutes between trips. Route 23 runs least frequently with two trips per direction per day, with one round trip during the morning peak period and one round trip in the evening peak period. Service frequencies correspond somewhat well with passenger ridership within the FRTA system, with the most frequent routes carrying more passengers and the least frequent routes carrying considerably fewer passengers. 3.7 Ranking of Weekday Route Performance In order to evaluate investment priorities, the routes were given a score based on how their performance compared with system averages. Routes were scored based on ridership, passengers per revenue hour, and subsidy per passenger. For each route, each performance indicator was evaluated as a percentage of the system average. For example, if the system average was 100 passengers and a given route has 200 passengers, it would score 200% for that category. The composite score was calculated by taking the averages of the percentages for each category. The routes were then divided into four tiers based on their composite score: Highest performers (150% or greater), above average performers (149%-100%), below average performers (99%-50%), poor performers (49% or lower). Table 3: Ranking of FRTA Routes Rank Route Route Description Score 1 22 Montague Greenfield 144% 2 31 rthampton Greenfield 141% 3 21 Greenfield Community 130% 4 32 Orange Greenfield 91% 5 41 Charlemont Greenfield 48% 6 23 Amherst Greenfield 26% Investment strategies for routes will vary based on their performance tier. The six routes with the highest performances are top priorities for service investment and may benefit from increased service frequencies or service spans. The other routes that perform above average are candidates for further service investment as resources become available. For routes that perform below average require further analysis to determine the cause of low performance. A more in depth analysis could look at inefficiencies in route alignments as well as service 3-11 P age
37 frequencies and spans. Routes with exceptionally low performance may be candidates for discontinuation of service. 3.8 Key Findings Overall, ridership decreased between FY 2012 and FY 2014 as a result of Athol leaving the FRTA service area. Because of this reduction in ridership, service performance decreased between FY 2012 and FY Ridership loss is not an isolated event two-thirds of routes on weekdays lost riders between FY 2012 and FY Routes 21, 22, 31, and 32 exhibit above-average ridership, while Routes 23 and 41 carry considerably fewer than average passengers. Routes with higher frequencies have higher productivities P age
38 Page intentionally left blank
39 Chapter 4 Determining Demand Burke & Company
40 4. DETERMINING DEMAND In order to evaluate a transit system and identify possible ways to strengthen it, it is important to understand the surrounding market, how this market is evolving, and who the riders of the system are. Demographics, land use, and socioeconomics all of which impact ridership are constantly changing. To align service to meet the needs of these potential riders, it is important to understand the level of transit demand that they represent. This chapter is divided into two parts. The first section examines regional job creation goals and employment needs to demonstrate the economic context of the region and to identify potential ridership growth areas. The second section seeks to determine how the current service offered by the Franklin Regional Transit Authority (FRTA) aligns with its regional transit demand. 4.1 Regional Job Creation Goals and Employment Needs This section will examine economic growth in the region to determine job creation goals and employment needs as well as the role transit plays in accommodating these needs. To determine the region s job creation goals and employment needs, the Strategic Plan of the Commonwealth of Massachusetts Executive Office for Housing and Economic Development (EOHED) was reviewed to examine the overarching goals for the state. The Greater Franklin County 2013 Comprehensive Economic Development Strategy (CEDS) and The Pioneer Valley Plan for Progress were also reviewed to determine economic context and how the region is expected to grow. Major regional employers/industries were also identified. This information was supplemented by site visits and interviews with FRTA and Franklin Regional Council of Governments (FRCOG) planning staff EOHED Strategic Plan The EOHED plays a crucial role in supporting the growth of the economy, vibrant communities, and competition for consumers and businesses. The office, led by the Secretary of Housing and Economic Development, is focused on steering Massachusetts towards smart growth, a development approach that recognizes the interactions between land use, energy, and transportation. To achieve this, the EOHED has outlined a three-year strategic plan that focuses on the following four goals: 1. Accelerated job creation; 2. Stabilized housing; 3. Enhanced consumer awareness; and 4. Improved regulatory solutions. As the economy transitions from health care, higher education, technology, financial services, and tourism to one that includes life sciences, clean energy, and the creative economy, more jobs will be added. Accelerating job creation in conjunction with compact land use development patterns that 4-1 P age
41 promote sustainability and increase the number of affordable housing units will change residential patterns and transportation needs. To serve the needs of the new emerging clusters of employment and housing, the transportation system as a whole must change and adapt. The new environments, which will be comprised of small and mid-sized businesses, must be served by public transit in order to meet the demands of the new workforce. While the public transit system must adapt to the changing economy, it should be noted that no two regions of the state are the same. As such, job creation goals and employment needs and thus transportation needs will differ Franklin County Economic Development FRTA s service region is diverse, serving both rural and urban areas across four counties (Franklin, Hampshire, Worcester, and Hampden). There are 41 3 communities in the region, which range from rural communities of 650 residents to cities with populations of 17,000. The largest population centers are the cities of Greenfield, Montague, and Southwick, which together account for 34% of the population. Greenfield has slightly fewer than 17,000 residents; Southwick has 9,500; and Montague has slightly fewer than 8,500. Twenty-three of the communities are within the FRCOG region, 16 fall under the Pioneer Valley Planning Commission (PVPC) and two are within the Montachusett Regional Planning Commission (MRPC). FRTA provides fixed-route service to 12 communities including Greenfield and Montague two of the three largest communities. Two of these 12 communities Amherst and rthampton are not FRTA member communities while the other 10 are. For communities that do not receive fixed-route service, including Southwick the second most populous FRTA community, FRTA contracts with the Council on Aging to provide service for the elderly. The region as a whole has a population of 103,845 and has seen marginal increases in population. Franklin County communities have declined in population by 0.2% over the last ten years, while member communities in Hampshire and Hampden counties experienced a 4% growth during this time period. Collectively, the region has grown 1.05%. Population projections show that by 2035 Franklin County communities will increase in population by approximately 5,400. The smaller rural communities have experienced the largest percentage population growth, but a small change in population is magnified much more when the population is low to begin. Income indicators show that the region s median household and family income values are slightly lower than the state averages. Franklin s economy has constantly been evolving. Historically an agricultural based economy, it shifted to manufacturing and is now transitioning to a service based economy. The largest industry in Franklin County is healthcare (18.6%) followed by manufacturing (18.4%), retail trade (14.9%), and food service (9.4%). Education is closely behind with 7.3%, primarily because of the numerous institutes of higher education in the communities of Amherst and rthampton. While manufacturing is the largest sector of the economy, it is the fastest declining industry in the region. Since 2000 there has been a loss of almost 1,000 manufacturing jobs. As manufacturing has declined, service-based industries have 3 This includes Hatfield who was just approved to join the FRTA 4-2 P age
42 increased, though 95% of these establishments have 50 or fewer employees. Many of Hampshire and Hampden County FRTA communities are small, and much of the employment data by sector has been suppressed for confidentiality. 4 Key observations for these areas include: there is a large wholesale trade sector in Hatfield; a strong construction industry exists; the largest of these communities, Southwick, has 274 establishments that employee 2,511 workers; and there are very few healthcare, education, information, finance, and manufacturing jobs. Commuting patterns for Franklin County communities show that for the five largest communities 78.2% live and work in Franklin County while 9.7% work in Franklin County but live in Hampshire County. Overall, 21.8% of the workforce does not live in Franklin County, and 38% of the people who live in Franklin County work elsewhere. The largest percentage of residents who work outside Franklin County, 20%, work in Hampshire County, primarily in the communities of Amherst, Hadley, Hatfield, and rthampton. Amherst is the largest net importer of Franklin County residents to their workforce, as 3,631 of the 23,501 employees in Amherst are residents of Franklin County. Employment levels in Amherst are high due to the three colleges that collectively employ more than 8,000. rthampton, Athol, and Hadley are the next three largest communities that employee Franklin County residents There are 48 employers that have more than 100 employees in FRTA communities (Figure 16). Of those employers, 77% are serviced by fixed-route transit, and the largest Yankee Candle is serviced by FRTA. The largest percentage, 31%, of these top employers are located in Greenfield, followed by 14.5% in Deerfield and 12.5% in Montague. Outside of the FRTA region major employers of FRTA community residents in Amherst and rthampton include The University of Massachusetts, Amherst College, Hampshire College, Smith College, Cooley Dickinson Hospital and the Veterans Medical Center in addition to hundreds of small employers. Priority development areas (PDAs) are regions that a community has designated as places to focus economic growth. These areas typically have existing infrastructure and underlining zoning that favors development and are an indicator of future growth in the community. PVPC identifies commercially zoned land and land use areas located in town centers as part of their Valley Vision Plan. All of the PVPC communities have identified PDA areas. FRCOG has designated all areas in town centers as PDAs. 4 To use the entire Hampshire and Hampden counties data to depict these communities would provide an inaccurate picture due to the large urban areas outside the FRTA service areas. These large communities are members of the PVTA service area. 4-3 P age

43 Figure 16: FRTA Regional Major Employers 4-4 P age
44 4.2 Transit Market Analysis Certain groups, such as older adults, the young, low income populations, and those without access to a vehicle, are more likely to use transit, and quite often their trips are for work purposes. By analyzing and examining such factors as age, population density, employment density, income levels, and vehicle availability, transit-dependent populations within the region were identified (Section 4.21). This information was then combined with additional attributes such as land use and amenities to determine an overall market and demand for transit in the region (Section 4.22). To determine if service was currently deployed in the most effective way to accommodate the transit needs of the region s workforce, each route was mapped and overlaid on maps displaying employment and socio-economic data (Section 4.23) Transit Dependent Populations Transit-dependent populations are those exhibiting socioeconomic and demographic characteristics that make them more likely to use public transit than others, such as level of income, access to a vehicle, and age. Transit systems are often designed with a focus on serving such populations. In addition, population and employment densities can also provide an indication to the feasibility of providing service Industry standards indicate that at least 2,000 households are needed per square mile to support a fixed-route transit system. It is important to match the level of demand with the level of service as it is expensive to run a transit system. Older Populations According to the American Public Transportation Association (APTA), individuals aged 65 and above represent the second largest transit user group 5. This group s high level of transit ridership, however, is disproportional to the relatively small percentage of the population that the group represents. Senior population typically correlates with areas of low income levels and vehicle ownership. These individuals are often on fixed incomes, which reduces their desire to own a vehicle. Additionally, health issues such as poor eyesight can deter them from driving. There appears to be no real pattern to where this age group tends to live in the FRTA service area (Figure 17). Thus, it can be challenging to institute transportation services that meet their needs. Within the FRTA service area, 15.6% of the population is made up of individuals over the age of 65 and MassDOT projections show that by 2035 this cohort will increase by 77% by 2035 Results from a Community Action survey conducted by FRCOG in 2014 and distributed to Franklin, Hampshire and rth Quabbin regions show that while some do not currently use public transit, they believe they will come to rely on it as they grow older. This will have large impacts on the transit system. 5 This based on the proportion of individuals in in this age class who use transit and not the proportion of transit riders who are in this age class. 4-5 P age
45 Figure 17: Older Populations 4-6 P age
46 Population Density The majority of trips (transit or non-transit) originate or end at the home, making population an important indicator of potential transit use. Population density is used in this analysis instead of the total population because it accounts for varying area sizes. High density areas are typically found in urban centers consisting of multifamily units, mixed-use developments, limited parking, and walkable environments, all of which generate higher transit ridership. The average population density in the Franklin Region is 85 persons per square mile, which is lower than the state average of 858 persons per square mile. The densest areas are located in Greenfield, the village of Turners Falls in Montague and pockets of density in Southwick and Orange as well. As shown in Figure 18, many of dense population areas are served by FRTA routes. 4-7 P age

47 Figure 18: Population Density 4-8 P a g e
48 Employment Density According to APTA, commuting for work purposes is the number one reason people take transit. As such, it is imperative that transit systems serve areas with high concentrations of employment. Within the FRTA service area, there are 37,605 jobs, which equates to an average of 30.9 jobs per square mile. Employment centers tend to be concentrated in the city centers or in industrial parks. Many of the densest employment areas are served by FRTA (Figure 19). It is important to note that Amherst and rthampton businesses and schools are major employers for FRTA community residents but are not FRTA member communities. Since the jobs do not reside in the FRTA service region they have not been included but transit connections to these communities are crucial. 4-9 P age

49 Figure 19: Employment Density 4-10 P a g e
50 Home and work are the most common origin and destinations according to APTA. Since population and employment densities are the best approximation for determining the level of demand, these two variables were combined to examine service frequencies based on thresholds. 6 As job and population densities increase, the headway for transit service should decrease (Table 4). Figure 20 indicates that the demand for more frequent service is concentrated in the urban cores of Greenfield and along the Route 2 corridor in Orange. Much of the FRTA service area is rural and does not warrant fixed-route service. Table 4: Frequency Thresholds Jobs & Population per Square mile Fixed-Route Headway 3,000-6, Min 6,501-16, Min 16, , Min 250, Min 6 These estimates are based on of data from the Urban Development Intensities in the Washington DC Metropolitan Area by Terry Holzheimer, Public Transportation and Land Use Policy by Boris Pushkarev, and TCRP Report 111 Elements Needed to Create High Ridership Transit Systems P age
51 Figure 20: Transit Demand - Level of Service 4-12 P age
52 Income Level Median household income is used as a measure for propensity to use transit. Automobile ownership is expensive and as household incomes decline so does the likelihood of having access to a private vehicle. Work-trip market shares from the American Community Survey show that as income rises, the percentage of people using transit decreases. The average median household income in the Franklin Regional area is $63,011. Despite this average, however, there are some areas in the region, especially within the northern most communities, Orange, Greenfield, and Montague that have substantially lower income levels. These areas are depicted in Figure P age

53 Figure 21: Median Household Income 4-14 P a g e

54 Zero-Vehicle Households The FRTA system serves an area where 5.33% of households do not have access to a personal vehicle. Concentrations of these households coincide with low-income and dense population areas shown on the previous maps. Figure 22 depicts these zero-vehicle household areas concentrated in Greenfield, Orange and village of Turners Falls in Montague. Figure 22: Zero Vehicle Household 4.22 Methodology To determine if FRTA s service is deployed in the most effective way possible to accommodate the transit needs of the regions workforce, the level of potential demand was calculated. The level of potential demand is based on the following: population density, number of jobs, percent of zero-vehicle households, proximity to schools and hospitals, median household income, the enrollment at local colleges and universities, park and ride lots, commuter rail stations, the percent of households with 4-15 P a g e
55 people with disabilities, and the percent of the population above the age of The data was derived from the American Community Survey (ACS) 5-Year Estimate and the MassGIS website (Table 5). The level of demand was analyzed at the census block level. Table 5: Transit Demand Data Variables and Sources Variable Source Population ACS 5 Year table SF 3 Table B00001 Area Cartographic boundary files US census Zero-Vehicle household ACS 5 Year table SF 3 Table B25044 Schools MassGIS from Mass - DOE Hospitals MassGIS from the DPH - OEMS Median Household Income ACS 5 Year table SF 3 Table B19013 Colleges and Universities MassGIS from National Center for Education Statistics Disabled Households ACS 5 Year table SF 3 Table B22010 Employment MAPC statewide employment data Park and Ride Lots MassDOT Commuter Rail MassGIS from CTPS Elderly Populations ACS 5 Year table SF 3 Table B00001 Priority Development Data PVPC and FRCOG To compile the data, all GIS shape file layers and tables were loaded into ArcGIS and joined on the appropriate variables. Data was then transformed to the census block level if it did not exist in this form already and then clipped to the RTA service area. A model was then run in ArcGIS to calculate the population density, percent of zero-vehicle households, percent of households with people with disabilities, percent of the population older than 65, and employment density within each block. This data along with the median household income, school, hospitals, park and ride lots, commuter rail, and colleges and universities was then extracted into Excel for each block within the service area of FRTA. Using the Jenks natural breaks optimization method 8, the data for the population density, number of jobs, percent of zero-vehicle households, percent of households with people with disabilities, percent of the population older than 65 and median household income were arranged into five classes. Clipping the data during the first step allows for the evaluation of only the RTA service area, so the values for the class breaks differ among different RTAs. This is important as it minimizes the data being skewed by areas not serviced by the RTA and allows for a more accurate picture of whether the RTA s service is deployed in the most effective way possible for that region. 7 Priority development area data was not included because there are no officially designated PDAs in this region. 8 The Jenks method is a way of arranging data into different classes by minimizing the average deviation from the mean an maximizing each class s deviation from the means of other groups. It is based on standard deviation P age
56 Population density, number of jobs, percent of the population older than 65, percent of zero-vehicle households, and percent of disabled households all have a positive correlation with transit demand, and thus higher values were places into higher classes. Those that fell into class 1 were given a score of 1, class 2 received a score of 2, etc. up to class five. Income has a negative correlation with ridership, so those that fell into class 1 were given a score of 5, class 2 a score of 4, class 3 a score of 3, class 4 a score of 2, and class 5 a score of 1. The scores were then weighted based on highly recognized research done by Brian D. Taylor on the determinants of transit ridership 9. The study uses a two stage regression model to look at more than fifteen census variables in 265 urbanized areas to determine which characteristics impact the level of transit use the most. The parameter estimates found in the study were used to weight the classification value given in the previous step for population density, percent of zero-vehicle households, and median household income. These weights represent the relative impact each variable has on transit demand, with higher weights being assigned to variables that have a higher likelihood of increasing the demand for transit within an area. Taylor s research showed that the percent of college students has a positive correlation to ridership. A weighted score was calculated by dividing the number of enrolled students according to the National Center for Education Statistics by 1,000. For the commuter rail stations, schools, and hospitals one point was given for each located within the block. Work trips are one of the primary trips taken by individuals so weight of 1.5 was applied to the classification score for the number of jobs located in a block. Park and ride lots were scored by dividing the number of spaces by 100 to provide a weighted score for ridership. Research has also shown that people with disabilities are more likely to use transit than those without as it may be their only means of motorized transport. A complete set of variables and method for calculating its value can be seen in Table 6. 9 Taylor, B.D. et al, Nature and/or nurture? Analyzing the determinants of transit ridership across US urbanized areas, Transport. Res. Part A (2008), doi: /j.tra P age
57 Table 6: Transit Demand Variables and Formulas Variable Value Calculation Population Density Classification score * 0.76 Zero-Vehicle Households Classification score * 1.75 Schools Number of Locations Hospitals Number of Locations Median Household Income Classification score * 0.92 Colleges and Universities Number of Students/1,000 Disabled Households Classification score * 0.25 Priority Development Areas Percent of area that was priority development * 5 Employment Classification score * 1.5 Park and Ride Lots Number of spaces/100 Commuter Rail Number of Locations Older Populations Classification score * 1.31 The scores for each variable were then summed for each block to get an overall score for transit demand by block. This data was then put into GIS and displayed to show demand for the entire region. Features such as schools, hospitals, park and ride lots, commuter rail stations, key destinations, and important features were overlaid on the map to provide a frame of reference and to act as supporting material Transit Demand FRTA provides fixed-route service to all but six areas that were determined to have a higher demand for transit (Figure 23). These regions include areas of Bernardston, Orange, Hatfield, Huntington, Southampton, and Southwick. This section provides a further analysis of these areas and explores why they have demonstrated transit demand P age

58 Figure 23: Underserved Areas 4-19 P a g e
 by FRCOG.")
59 Area A (Figure 24) in Bernardston has a demonstrated demand for transit because of the 177 jobs associated with the Kringle Candle distribution center as well as its lower median household income of $50,000 compared to the region s average of $63,000. This area is also a town center and has been designated as a Priority Development Area (PDA) by FRCOG. In 2011 a study was completed by FRCOG to determine the feasibility of extending service to the Gill/Bernadston/rthfield region due to the proposed opening of the C.S. Lewis College. The study recommended implementing a fixed route with two service options. The service was not implemented, primarily because the college never opened. This is a very rural area, and while it is not a strong candidate for fixed-route service, it may make sense to consider alternative demand response options. A further revaluation of the area is suggested to determine is fixed route service is still viable without the college. Figure 24: Area A: Bernadston 4-20 P age

60 Area B (Figure 25) in Orange has a demonstrated demand for transit because of high employment, a high rate of zero-vehicle households, and a low median household income. This area is home to three industrial parks. The Orange Innovation Center and the Orange Industrial Park have employees each. The third, Randall Pond, is currently quite small and is a focus area for economic growth within Orange. This area has a rate of zero-car households of 38.4% and a median household income of $38,000. It is also designated as a PDA by FRCOG and is home to Mahar Regional High School, which has 742 students. Currently FRTA Route 32 services Route 2, a downtown development area in Orange, and lays over for 26 minutes at the Hannaford s. Figure 25: Area B: Orange 4-21 P a g e
.")
61 Area C (Figure 26) in Hatfield has a demonstrated demand for transit because it is designated as a PDA by PVPC. There is also demand due to higher employment and because of two schools and a higher percentage of houses without a car (9.1%). Currently the closest bus service is on Route 5 via FRTA Route 31, 1 ½ miles west from the town center. Figure 26: Area C: Hatfield 4-22 P age
 and a lower median household income ($42,000).")
62 Area D (Figure 27) in Huntington has a demonstrated demand for transit because it is designated as a PDA by PVPC. The area also has a higher rate of zero-vehicle households (10.9%) and a lower median household income ($42,000). Huntington is a rural community with no fixed-route service within its vicinity. Figure 27: Area D: Huntington 4-23 P age

63 Area E (Figure 28) in Southampton has a demonstrated demand for transit because it is designated as a PDA by PVPC. This is a mostly rural area with some development along Route 10, the main corridor in town. In the downtown area, however, population density is higher (3,061 people per square mile) because of several apartment complexes. In the northeast corner of this area there is a shopping plaza with a grocery store. This plaza serviced by the PVTA via the Nashawannuck Express. Figure 28: Area E: Southampton 4-24 P age
, and pockets of residential density (up to 4,000 people per square mile). The area is also designated as a PDA by PVPC and features commercial development along Route 10.")
64 Area F (Figure 29) in Southwick has a demonstrated demand for transit because of a lower median household income ($50,000), a higher rate of zero-vehicle households (up to 8.5%), and pockets of residential density (up to 4,000 people per square mile). The area is also designated as a PDA by PVPC and features commercial development along Route 10. This corridor is approximately 1 ½ miles long and includes more than 25 small employers collectively employing approximately 500 people. Figure 29: Area F: Southwick There are areas in the FRTA service area which are possible candidates for service modifications, which would better deploy service to meet the needs of the region s workforce and improve access to employment. Operating night service 10 on many of the routes would allow for second and third shift employees to use transit. Providing service outside of traditional workdays (weekdays) and times would allow for additional trips besides those for work. FRTA has demonstrated success at connecting services 10 Night service is defined as service that runs between 7 PM and 11 PM P age
65 to regional employment centers but more can be done. To understand what the system can achieve, we must first understand what the current demand is. Appendix A has maps of each route within the FRTA service area depicting the regional demand within ¼ mile of each route. Recommendations in the following chapters will be designed to strengthen job access and develop even better connections P age
66 Page intentionally left blank
67 Chapter 5 Fare Analysis Burke & Company
68 5. FARE RATES AND COLLECTION METHODS 5.1 Collection Methods The Franklin Regional Transit Authority (FRTA) purchased and installed GFI Genfare Electronic Validating Fareboxes in Fareboxes are installed on all fixed route vehicles. Passengers are able to purchase stored value cards on board the buses or at the JWO Transit Center. Farebox The farebox is capable of electronically validating and verifying all coins and bills inserted for payment as well as the magnetic fare tickets. All coins and bills are automatically identified by denomination, without operator action. All invalid coins and bills are automatically rejected and returned to the passenger. The farebox assists operators with verification of the fare deposited by showing the Operator Control Unit (OCU) the value of coins and bills inserted. All accepted coins and bills will be deposited into a single cashbox, securely compartmentalized to separate the coins and bills. The fare only recognizes exact fares and no change is given for over payment. Instead the farebox will issue a magnetic change card with the excess value stored on it. This card can be used for future trips. 5.2 Fare Structure FRTA fares vary by route. In 2009 FRTA modified their fare structure and there the fare for the Route 23 increased from $2.50 to $3.00 and the Route 32 went from $1 to $1.50. Currently FRTA has free transfers for up to 60 minutes unless you are transferring to the Route 23 due to the higher fare. Free fares are offered to passengers with a valid MA Commission for Blind card, and Veterans with proper identification. Elderly persons over the age of 60, Medicare card holders and disabled passengers receive a half price fare with a photo ID. FRTA offers a wide range of fares based on the route, which can be found in Table 7. Table 7: Fares Fixed Route Single Trip Route 21, 22 $1.00 Route 23 $3.00 Route 31, 32, 41 $1.50 Children under 5 Free 5.3 National Best Practices This chapter provides an overview of different fare policies and fare media that are used throughout the United States. While the fare policies and practice of FRTA reflect local needs and practices, the comparison with national standards can provide helpful insight and guidance regarding ways to improve 5-1 P age
69 available fare media and policies. The fare policy and standards section describes various policies and fare pass types employed by transit agencies and represent standard fare practices on a national level. A wealth of information regarding best practices in fare policy, technology, and fare media is presented by the Transit Cooperative Research Program (TCRP) and forms the basis of this section. Information is also supplemented by research on specific fare practices of transit agencies throughout the country. An overall summary of TCRP Report 94, the update on Fare Policies, Structures, and Technologies shows that 11 : Overall fare levels are increasing, specifically the base cash fares Agencies are moving towards a more simplified fare structure Many agencies are moving away from a policy of free or reduced cost transfers and replacing the transfer policy with a day pass that can be purchased onboard vehicles Pre-paid and multi-trip fare media is growing Many agencies have either implemented or are exploring Smart Card technologies Regional fare integration, where multiple operators within a metropolitan region, are moving towards a common fare policy and media improving the customer experience 5.31 Fare Technology and Media Fare technology and media represent the primary hardware and software for collecting passenger fares onboard transit vehicles. Transit agencies throughout the country use a variety of different fare technology and media (how the fare is paid). The technology and media have evolved greatly over the years. Current fare technology runs the range from non-registering fareboxes which are literally just containers that house the fare revenue deposited by passengers all the way up to SmartCard technologies that allow passengers to pay their fare with a quick pass of a credit card size fare instrument. Technology is evolving in such a way that some agencies have been experimenting with paying fares using SmartPhone applications. Some systems, primarily rail and Bus Rapid Transit systems, have off-board fare collection technology with a proof of payment system. Below is a description of different fare technology and media. n-registering fareboxes are the simplest fare technology. These fareboxes are little more than containers where passengers are able to deposit fares. These fareboxes can only accept cash fares or, if the system utilizes them, fare payment coupons. Flash passes, coupons, and punch cards are used for prepaid fare media. These fareboxes do not have the ability to track ridership payment characteristics. Many operators who use these fareboxes will have a separate passenger counter device that the operator manual clicks for each fare type. Very few systems use non-registering fareboxes nowadays. 11 Transit Cooperative Research Program Report 94: Fare Policies, Structures, and Technologies pages 2 through P age
70 Registering fareboxes allow for fares to be paid and data to be collected regarding fare types. These fareboxes can collect the number of passengers boarding a bus by each fare type for each trip operated. Registering fareboxes can be designed to accept different types of fare media including flash or punch passes or even magnetically coded fare cards. With magnetically coded fare cards, the fare type can be read automatically by the farebox. For punch and flash passes, operators can manually enter information regarding fare type paid. These are currently the most common types of fareboxes. The newest fare technology used by transit agencies are known as a SmartCard system. The SmartCard fare instrument is the size of a credit card and can be loaded with any kind of pass or stored value passes. SmartCard readers are needed on fareboxes in order to process fares. Similar to the magnetically coded fare media, many different fare types are available and are automatically counted by the farebox itself. By installing SmartCard readers at each door of a transit vehicle, multiple door boarding can be facilitated. Another advantage of SmartCards is that they can be used by multiple systems. The Massachusetts Bay Transportation Authority (MBTA) Charlie Card, which is also accepted by ten of the fifteen Regional Transit Authorities 12, is an example of a SmartCard. There is a high cost to transit agencies when implementing SmartCards as they require new or modified fareboxes, and the fare media itself is rather expensive. SmartCard technologies are constantly evolving such as with contactless technology where a user no longer swipes a farecard but simply taps the card on a reader and enters and mobile ticketing where ones pays their fare from their smartphone. An example of a contactless card is the Washington METRO SmarTrip card. Transit agencies are also starting to experiment with fare payment through cellular telephone. With this, the cellular telephone operates as a SmartCard and has the ability to store multiple pass options and fare types. This works by riders downloading an application onto their cell phone, payment is processed through the app and a transit pass is produced on the person s phone 13. This mobile ticketing system is currently used by TriMet in Portland, OR, the first agency in the US to pilot this for fixed route. The user simply selects their rider and mode type to purchase a ticket, then when they want to use it they select the ticket which generates a QR code that the fare inspector can scan. The technology was developed by GlobeSherpa, a Portland based software company. Similar technology, developed by Bytemark, was deployed in 2014 at Capital Metro in Austin, TX. Locally the MBTA uses technology developed by Masabi for mobile payments on their commuter rail and ferry systems. 12 Charlie Card is accepted for fare payment by the following operators: Massachusetts Bay Transportation Authority, Berkshire Regional Transit Authority, Brockton Area Transit Authority, Cape Ann Transportation Authority, Cape Cod Regional Transit Authority, Lowell Regional Transit Authority, Merrimack Valley Regional Transit Authority, MetroWest Regional Transit Authority, Montachusetts Regional Transit Authority, Southeastern Regional Transit Authority, and Worcester Regional Transit Authority P age

71 In the future, other technologies such as the Magic Band which Disney uses as admission to the park, connects to your credit card for easy payment and unlocks your hotel room, may be possible for travel on transit. The band contains a short range RFID chip similar to the read-only RFID 14 chip found in contactless SmartCard technology. The Disney Magic Band is similar to the UBand made by IDenticard. The UBand uses MIFARE 15 technology to provide contactless access and payment and is currently being used by Mohawk College in Ontario. In the United Kingdom, Barclaycard launched the bpay band a similar wrist band which users can link any VISA or MasterCard debit or credit card to and can be used at any establishment that accepts contactless payments (300,000 locations). Amongst the many things the band can be used to pay for is the fare (bus or rail) on Transport for London 16. Figure 30: SmartCard Technologies. Left WMATA Smartrip contact-less; Center TRI MET mobile ticketing; Right Disney's Magic Band Fare media has evolved drastically over the last 100 years for transit from entirely cash based system to the new innovative contact technology merging today. The first fare media was the token followed by the ticket. These allowed transit agencies to offer discounts over the cash fare. Tickets were used until magnetic stripe cards were introduced, this allowed for the development of passes. Tap cards were developed next with RFID technology and had the capability of operating as a stored value card and as a daily, weekly monthly, etc pass. The newest technology is contactless open fare payments which are directly linked to debit or credit cards and can be in plastic card form, on a mobile device and now a wrist band. Regardless of the type of technology used reducing cash transfers benefits the transit system all around. The overhead cost to process cash as opposed to cards can be as much as double due 14 Radio-frequency identification cards (RFID) is a wireless chip which uses electromagnetic fields to transfer data, 15 MIFARE is the name of the technology (chip) that is created by NXP. It complies with international standard ISO/IEC for data security and transmission protocols for communication with contactless integrated circuit cards, proximity cards and identification cards. 16 The agency who oversees the London rail and bus network. 5-4 P age

72 to the security measures and personal needs to empty vaults and count money. Improved farebox technologies not only can improve operating costs but can speed up the boarding time of passengers thus reducing the overall travel time. In Helsinki, an innovative fare strategy is being implemented through a new market approach viewing Mobility as a Service (MaaS). The principle of the MaaS approach focuses on door-to-door service and mobility as a whole package, instead of each mode individually. Through this method, users are able to plan their trip through one portal and payment system. Different packages provide riders with unique options to meet their transit needs. For example, an urban commuter package, available for purchase at a set price point, may include free public transport in the rider s home city, up to 60 miles in taxi services, 300 miles for rental cars, and 1,000 miles in domestic public transport. Packages are flexible and can be adjusted to meet the needs of different service areas. Incorporating all transport modes into one, user-friendly interface will provide seamless service to the rider and encourage the use of public transportation over personal vehicles. Figure 31: Helsinki Mobility as a Service App Some systems have implemented off-board fare collection/proof of payment fare payment. Off board fare collection requires fare equipment located at stops and stations and allows for faster boardings. Passengers pay their fare off-board and are issued a receipt or their farecard is validated for the trip. Fare inspectors randomly check to see if passengers have paid their fares by scanning farecards or looking at the receipts. Those who have not paid fares are issued a citation. 5-5 P age
73 5.32 Fare Policy and Standard Practices A review of fare policies around the country provides a myriad of different fare types and fare media. Fare media types include unlimited ride passes and multi-ride/stored value transit fares. A description of cash fares and transfer policies are included in this section. Fare policies and standard practices vary amongst various transit agencies and are suited to meet individual local conditions. Fare Policies Cash fares are accepted by almost all transit agencies. Most transit agencies accept only exact fare and will not make change. A small number of agencies will make change for passengers on some or all services. Some agencies have limitation with their fare collection equipment that only allows the farebox to accept coins, while most operators are able to accept both bills and coins. Unlimited ride passes allow users to take as many rides as needed over a set period of time. These passes are a pre-paid fare media and come in many increments. Most agencies have either a 30-day, 31-day or monthly pass. For a shorter duration, agencies may have a week pass or even a two-week pass. The shortest duration pass is a one-day pass and agencies that sell a one-day typically do not have free or discounted transfers. Unlimited ride passes provide a discount over cash fares, with the discount related to the number of times the pass is used as it represents a single payment over a time period. The issue with unlimited ride passes is that it typically requires a large upfront payment by customers to take advantage of the discount, which may be difficult for lower income users. Multi-ride passes or stored value cards allow for passengers to buy a set number of transit trips ahead of time usually at a discount. These pass/stored value cards allow for the pre-paid purchase of discounted fares. Similar to the unlimited ride passes; these fares require a large upfront payment, although not as large as the unlimited ride passes, in order to take advantage of discounts. Multi-ride passes/stored value cards can come in a variety of different types of media and formats including ticket books, tokens, punch cards, or as stored values on a fare card or SmartCard. Some agencies have instituted free fares. Free fares primarily exist in places where the primary generator in the area is a major university. In these areas, funding sources for transit services come from the university. In other locations, college students are provided a free transit pass that is funded by student service fees, parking revenues at the college, general fund revenue, or a combination of these sources. An example of a system that has a free fare policy is Chapel Hill Transit in rth Carolina, which serves the University of rth Carolina 17. Transfer policies are a very important consideration and part of any fare policy and fare media. Transit passengers have varied origin and destination locations so it is impossible to serve all passengers P age
74 without requiring passengers to transfer. Many systems are designed around bringing passengers to a central location where they can connect to another bus to reach their destination. Other systems have transfers occur at points where two or more routes intersect. Regardless of transfer location, transfer policies have an impact on ridership. The existing transfer policies include allowing transfers to occur for free, transfers to occur at a low cost, or requiring passengers to pay full fare when transferring. Some systems have different policies based on fare media used, for example a free transfer if using a SmartCard while cash passengers have to pay full fare when transferring. Standard Practices Fare policies typically respond to local needs. In some locales the fare policy and changes to fare policies are well codified. In other locations, fare policies change only in response to an identified issue; otherwise fare policies may not change at all for a long time. Fare policies need to be responsive to local needs. The fare policy has to be cognizant of the need to provide an adequate local share of operating costs. That being said the fare policy has to also strike a balance between being equitable to all users, encourage pre-paid fares, encourage ridership, and the need to raise local revenue. Federal rules and guidelines need to be taken into account in fare policy discussions. Environmental justice concerns also need to be taken into account as part of fare policy and fare policy changes as it relates to Title VI of the Civil Rights Act of Legal proceedings have forced modifications to fare policies and fare policy changes due to environmental justice concerns 18. Environmental justice concerns are addressed by ensuring that fare policy changes are equitable for all services an agency operates. Fare policies also need to be consistent with rules and guidelines with the American s with Disabilities Act. As stated previously, very few agencies have a policy regarding fare changes. Primarily, agencies adjust fare levels based on a specific need, usually the need for additional directly generated revenue. This could be in response to cuts in funding from other sources, changes in cost structure, or overall cost increases. On a philosophical level many agencies prefer to increase fares along with improvements in service so that passengers are receiving better service as part of higher fares. The key elements of a fare policy include a base cash fare, multi-ride fare media, unlimited ride passes, and a transfer policy. Ten out of fifteen RTA s in Massachusetts use the Charlie Card SmartCard for fare payment which does have the ability to store unlimited ride passes. Beyond this fare policy, transit agencies have been partnering with colleges and universities to fund UPass programs which provide free trips for students and guaranteed revenues for the transit agency. 18 Transit Cooperative Research Program Report 94: Fare Policies, Structures, and Technologies page P age
75 5.4 Conclusion Moving forward, the best plan of action involves each of the RTA s joining together to research and develop innovative fare policies and media for the next generation. Through collaboration, the RTA s have the chance to implement fare strategies that can function collectively across Massachusetts and be a model for innovation. As the Sheidt & Bachmann fareboxes and CharlieCard technology, that many of the RTAs have, becomes outdated and must be replaced this present an opportunity for the RTAs to explore alternative technology such as the MaaS project in Helsinki, mobile payments, or the bpay/magic Band/Uband. A system-wide approach, as opposed to individual fare strategies for each RTA, will foster a cohesive transit system and provide riders an easier opportunity to travel between the RTA s. 5-8 P age
76 Page intentionally left blank
77 Chapter 6 Environmental Burke & Company
78 6. ENVIRONMENTAL In 2010, MassDOT launched their sustainability and environmental responsibility initiative to green the state transportation system, called GreenDOT. All branches of the Commonwealth s transportation system (transit, air, highway and planning) are subject to the policies contained within the GreenDOT initiative. The policy is driven by three primary objectives: (1) reduce greenhouse gas emissions, (2) promote healthy transportation options, and (3) support smart growth and development. In order to meet these objectives and to become a national leader in sustainability and transportation, MassDOT created an implementation plan in 2012 that outlines 7 themes (Air, Energy, Land, Materials, Planning Policy & Design, Waste, Water) and 16 sustainability goals. As part of the GreenDOT policy, each indicator was given a priority for implementation. Indicators for immediate implementation are those that were to be implemented by 2013, medium-term by 2015 and long-range policy targets for While the concept of improving sustainability and environmental responsibility would prove beneficial for Massachusetts, coordination and input from the 15 RTAs across the state has not yet occurred. In addition, while the GreenDOT policy outlines 331 indicators applicable to the rail and transit division, not all of these are relevant to the fifteen RTAs across the state 19. Those that are not relevant are often the responsibility of the MBTA, Bay State Roads, metropolitan planning organizations, and/or MassDOT but not the RTA. Many of the policies extend beyond the responsibility and reach of any of the RTAs and the timeline for achieving the indicators are not realistic or necessarily right sized for the RTA s. Many of the RTA s (either individually or collectively) will require more time to implement these environmental initiatives. A logical step is for each RTA to coordinate and confirm with MassDOT which initiatives are the most appropriate and achievable actions that can be taken and how best to achieve them. In addition to GreenDOT, Massachusetts recently passed regulation 310 CMR 60.05: Global Warming Solutions Act Requirements for the Transportation Sector and the Massachusetts Department of Transportation. The purpose of the act is to assist the state in achieving their goals of reduced greenhouse gas emissions (GHG). There are various parts to the regulation that require interagency coordination between MassDOT, Metropolitan Planning Organizations (MPOs), Regional Transit Authoritys (RTAs), the Department of Environmental Protection and the Executive Office of Energy and Environmental Affairs. The RTAs are specifically given 4 tasks: Conduct comprehensive service reviews (CSRs), Identify service enhancements to increase passenger ridership Identify vehicle technology and operational improvements that can reduce GHG emissions Work within the MPO process to prioritize and fund GHG reduction projects and investments 19 Mass GreenDOT policy P age
79 The RTAs along with MassDOT and the MPOs will be required to calculate GHG impacts on all RTP projects, consider GHG impacts when prioritizing and selecting projects, and report GHG impacts of all projects. Spreadsheet calculation tools have been developed for calculating GHG emissions and air quality analysis on bus replacements, new bus services, complete street programs and park and ride lots. The Department of Environmental Protection requires that the GHG impacts be measured for all projects and reported annually. This section of the FRTA plan examines how the policy s themes and their goals are being applied to regional transit authorities and which ones, in particular the FRTA, is currently meeting. There are a total of 331 indicators identified in the GreenDOT policy, of which only 238 or 72% are applicable to the FRTA. Of the 238 applicable indicators, 118 are short term indicators which are recommended to be in place by 2013, 97 are medium term indicators to be implemented by 2015 and the remaining 23 indicators should be implemented by FRTA has met 36 (31%) of the short term, is working towards meeting 25 (26%) of the medium-term and 7 (30%) of the long-range indicators. (Figure 33). Overall, the FRTA is meeting 63 (26%) of the 238 applicable indicators (Figure 32). The FRTA is working continuously to achieve the indicators and has accomplished many of them ahead of schedule. Some of the applicable indicators are joint responsibilities of the FRTA, MassDOT, the planning commission or the municipality and they must work collaboratively to achieve success. Additionally, of the 238 indicators that do not apply, some reasons may be because they are specific to the MBTA, specific to rail, require that there has been or will be new construction, they are for MassDOT owned facilities, they are for environmentally sensitive land areas, and/or there may be other constraints beyond the FRTAs control. 6-2 P age
80 All Indicators 26% 2% 72% t meeting Working Towards Meet Figure 32: All Applicable Indicators Level of Attainment All Indicators by Year 100% 90% 80% 70% 60% 50% 40% 30% 20% 10% 0% Meet Working Towards t meeting Figure 33: All Applicable Indicators Attainment by Year 6-3 P age
81 6.1 GreenDOT Policy The seven themes of GreenDOT that aim to reduce carbon footprints and improve sustainability include air, energy, land, materials, planning (policy and design), waste and water. Each theme has at least two goals and several objectives and indicators for meeting the goal. The indicators are measurable tasks that describe sustainable practices. Table 8 outlines the goals, objectives and indicators for each theme. For each indicator FRTA was asked if they currently are achieving it, are working towards achieving the indicator, do not meet the indicator and are not currently working towards or if it is not applicable to them. Table 8: GreenDOT Goals, Objectives and Indicators Theme Goals Objectives Indicators Applicable Indicators Air Energy Land Materials Planning, Policy & Design Waste Water Total The theme with the largest percentage of indicators met is energy at 55% of the 34 that are applicable Air Air goals include improving the state s air quality and reducing greenhouse emissions. To improve statewide air quality FRTA has installed a wood pellet boiler at the John W. Olver Transit Center (JWOTC). This boiler uses locally sourced wood pellets and the CO2 released into the air is equivalent to the amount the biofuel absorbed during their lifetime making them carbon neutral (Figure 34). 6-4 P age
, working towards 2 (6%) and not meeting 29 (78%) of the applicable air indicators as seen in Figure 35.")
82 Figure 34: Wood Pellet Boiler There are 49 indicators for air but only 37 (48%) are applicable to FRTA. FRTA is meeting 6 (16%), working towards 2 (6%) and not meeting 29 (78%) of the applicable air indicators as seen in Figure 35. Figure 36 outlines the air indicators by implementation time and level of achievement. There are 12 indicators in the air theme which are not applicable to FRTA. For the applicable indicators 15 are short term indicators, 14 are medium-term, and 8 long-range. Of those that are applicable to FRTA they have met 4 (27%) of the immediate implementation (2013) indicators, and are working towards or meeting 3 (21%) of the medium-term (2015) indicators and 1 (13%) of the long-range indicators. Even with the JWOTC it has been difficult for FRTA to meet many of the indicators due to limited funding, small fleet size and limited staff. 6-5 P age
83 Air Indicators 16% 6% 78% t meeting Working Towards Meet Figure 35: Air Indicators Level of Attainment 100% Air Indicators by Year 80% 60% 40% 20% 0% t meeting Working Towards Meet Figure 36: Air Indicators Attainment by Year 6-6 P age
84 Table 9: Air Goal Achievement Goal 1: Improve Statewide Air Quality Objective: Reduce emissions from maintenance & construction equipment Indicator Retrofit + use of hybrid engine system for each vehicle class piloted Diesel retrofit program for on and off-road vehicles expanded Hours of non-revenue vehicle operation reduced by 5% through operations streamlining Electric and/or full exhaust cycle motors have replaced 2-stroke equipment All new heavy equipment purchased run hybrid, CNG, or other high efficiency engines Objective: Decrease total engine idling Indicator On-board electrification of maintenance equipment for each vehicle type piloted MassDOT compliance with anti-idling laws ensured On + off-road anti-idling policies included in all construction, maintenance + service contracts Anti-idling policies, more restrictive than state law developed to eliminate unnecessary idling Anti-idling technology in transit vehicle + maintenance truck operations utilized 90% of MassDOT over-road maintenance vehicles run hybrid engines or have on-board electrification Objective: Decrease volatile organic compound discharge from facilities Indicator Spray painting restricted to permitted booths + emissions controls installed at spray shops All maintenance yard gasoline fueling pumps retrofitted with vapor recovery systems Technologies for diesel + jet fuel vapor recovery explored + implemented where feasible Air emission control training provided to all maintenance employees Objective: Increase fuel efficiency of operating transit fleet Indicator 100% of transit bus fleet replaced or retrofitted with hybrid systems or best in class fuel efficiency vehicles Statewide diesel transit + school bus retrofit program optimized + balanced with efficient vehicle purchases Contribution Contribution Yes Contribution t Applicable - We do not have spray shops Yes Contribution 20 new high efficiency commuter rail diesel locomotive in service t Applicable - Do not operate Commuter rail 40 new high efficiency commuter rail locomotives purchased t Applicable - Do not operate Commuter rail 6-7 P age
85 Objective: Increase efficiency of transportation systems operations Indicator Bus route efficiency measures implemented by all transit operators Planned bridges and ROWs designed to increase options for double tracked lines + allow double-stack cars Six rail corridors upgraded to increase speed including separated grade crossings or other improvements Dwell time of commuter rail trains at stations decreased Program initiated to increase the number of high level commuter rail platforms Electronic tolling facility of road and parking facilities launched Contribution Working towards - Regional transit plan t Applicable - Do not operate rail t Applicable - Do not operate rail t Applicable - Do not operate Commuter rail t Applicable - Do not operate Commuter rail t Applicable - electronic tolling Goal 2: Reduce Greenhouse Gas Emissions Objective: Increase vehicle electrification facilities Indicator At least 30 electric vehicle (EV) chargers installed along state highway system + transit parking areas All major park and ride, + transit parking lots (>50 vehicles) have charging stations Feasibility analysis of expanding the use of battery + fuel cell powered buses completed Optimal Statewide EV plug-in station network planned + implemented The feasibility of electric commuter rail locomotives studied within the Commuter Rail Master Plan Objective: Increase use of alternative + renewable fuels Indicator Contribution t Applicable - State Initiative t Applicable - Do not operate Commuter rail Contribution Bio-fuel (such as B10-B20 biodiesel) tested in oil heated buildings 20% biodiesel (B20) blend purchased for oil heated buildings Recycled vegetable oil / non-food stock impairing fuel purchased for biodiesel blends Volume purchasing of alternative fuels established across facilities + divisions B10 + B20 biodiesel pilot begun in all diesel vehicle types B10 to B20 biodiesel utilized in all diesel vehicles, depending on availability, vehicle type + season Objective: Increase fuel efficiency of light duty vehicles Indicator Vehicle fleet inventoried + prioritized for replacement and retrofit based on emissions reduction A portion of light duty fleet in urban areas integrated with car-share programs Light duty fleet downsized with carpooling, interdepartmental vehicle use, + car-sharing All light duty vehicles replaced or retrofitted with hybrid, electric, CNG or best in class technology 50% of DOT light vehicle fleet replaced or retrofitted with zero or partially zero emission vehicles Yes Yes Yes Contribution Working towards - Some but not all 6-8 P age
86 Objective: Increase fuel efficiency of maintenance + construction equipment Indicator Performance measures added to maintenance + construction contracts for green fleets 15% of maintenance fleet replaced with best in class emission ratings Objective: Increase telecommuting + meetings by web conference Indicator Teleconference technology capabilities installed at all offices Take home vehicle fleet for office employees eliminated Telecommuting + flex time options expanded for employees Peak hour single occupancy vehicle trips by employees reduced by 20% Contribution Contribution Objective: Track progress toward statewide GHG reduction + other sustainability goals Indicator Yes t Applicable - We don't have policies for taking vehicles home Contribution All resource use + purchases reported for performance monitoring MassDOT's GHG emissions target of 40% reduction from a 2002 baseline is met t Applicable - We don't track that information 6.22 Energy Energy goals are focused on consuming less energy and increasing the percentage of energy which comes from renewable sources. The new JWOTC is the first net-zero energy transit center in the United States. It has Photovoltaic Arrays which produce 123 megawatts hours annually and provides enough electricity to power the building (Figure 37). The geothermal pumps provide cooling air for the handling units, and the solar wall is 900 sq. ft and in the winter months can pre-heat the air as much as 15 degrees. 6-9 P age
, working towards 0 (0%) and not meeting 9 (45%) of the applicable energy indicators as seen in Figure 38.")
87 Figure 37: Top left: Solar Wall, Bottom Left: Photovoltaic Array, Right: Geothermal Pumps There are 39 indicators for energy but only 20 (51%) are applicable to FRTA. FRTA is meeting 11 (55%), working towards 0 (0%) and not meeting 9 (45%) of the applicable energy indicators as seen in Figure 38. Figure 39 outlines the energy indicators by implementation time and level of achievement. There are 19 indicators in the energy theme which are not applicable to FRTA. For the applicable indicators 9 are short term indicators, 7 are medium-term, and 4 long-range. Of those that are applicable to FRTA they have met 3 (33%) of the immediate implementation (2013) indicators, and are working towards or meeting 5 (71%) of the medium-term (2015) indicators and 3 (75%) of the long-range indicators. FRTA is able to meet many of the long term goals with the JWOTC P age
88 Energy Indicators 45% 55% 0% t meeting Working Towards Meet Figure 38: Energy Air Indicators Level of Attainment Energy Indicators by Year 100% 90% 80% 70% 60% 50% 40% 30% 20% 10% 0% t meeting Working Towards Meet Figure 39: Energy Indicators Attainment by Year 6-11 P age
89 Table 10: Energy Goal Achievement Goal 1: Consume Less Energy Objective: Reduce building electricity use Indicator Electrical + HVAC use of all buildings + facilities audited Office electrical equipment shutdown program implemented Employee education and incentive programs established to encourage energy use reduction All buildings not updated in 10 years renovated / overhauled / consolidated Motion sensor/occupancy lighting installed in all buildings Electricity purchased by the MBTA reduced by 20% per passenger mile Objective: Reduce electricity use by outdoor lighting Indicator Contribution Yes Yes t Applicable - t the MBTA Contribution Use of incandescent bulbs eliminated Outdoor lighting assets + technology inventoried 50% of all outdoor lighting (ROW, parking lots, tunnels, runways, airfields) retrofitted 100% of all outdoor lighting retrofitted Yes Electricity consumption for lighting reduced by 50% through retrofits and operations All traffic signals replaced with LED bulbs Objective: Reduce fuel use for heating buildings + water Indicator Audit of all heating systems + water fixtures conducted + opportunities for retrofit identified Temperatures of all adjustable boilers/heaters reduced Yes Yes Yes t Applicable - We do not have traffic signals Contribution All inefficient / electric water heaters replaced with high efficiency Yes tanks or tankless systems Oil heating systems converted to natural gas or renewable alternatives t Applicable - We do not have oil heat where feasible Geothermal + cogeneration heating systems studied for all new Yes buildings Envelops of all buildings are evaluated and prioritized for insulation t Applicable - New building upgrades Total heating fuel + costs for MassDOT-owned buildings reduced by t Applicable - We are not in a MassDOT building 20% Total heating fuel + costs for MassDOT-owned buildings reduced by t Applicable - We are not in a MassDOT building 35% Insulation of all heated / air conditioned buildings assessed and t Applicable replaced as needed All MassDOT-owned HVAC systems +/or windows retrofitted or t Applicable - We are not in a MassDOT building replaced Shade tree planting around MassDOT buildings increased to improve t Applicable - We are not in a MassDOT building building energy performance 50% of all inefficient / electric water heaters replaced with high Yes 6-12 P age
90 efficiency tanks or tankless systems Objective: Reduce electricity consumption by subways + trolleys Indicator Evaluation of on-board and/or wayside energy recapture conducted for all subway lines Electrical systems of all subway lines evaluated and retrofitted where cost effective All outdated transit vehicles replaced with high efficiency cars New subway car purchases contain regenerative braking technology RFR issued for wayside station regeneration installation Contribution t Applicable - Do not operate rail t Applicable - Do not operate rail t Applicable - Do not operate rail t Applicable - Do not operate rail t Applicable - Do not operate rail Goal 2: Increase Reliance on Renewable Energy Objective: Participate in MassDOT Energy Initiative Indicator Contribution Create a MassDOT energy management plan All energy consumption (electricity / heating / fleet fuel) tracked + centrally reported Feasibility study completed for additional wind power generation sites on MassDOT properties t Applicable - MassDOT responsibility t Applicable - We are not in a MassDOT building Objective: MassDOT GreenDOT Implementation Plan Increase energy produced at MassDOT facilities Indicator Comprehensive feasibility assessment and renewable energy generation plan completed Contribution 4 RFR's issued by MassDOT for additional renewable generation sites t Applicable - MassDOT responsibility 10 new renewable energy projects installed at MassDOT facilities t Applicable - We are not in a MassDOT building At least 5% of electricity demand generated by MassDOT renewable projects Objective: Purchase more renewable energy Indicator Bulk purchasing of green electricity portfolio with other state agencies initiated 12% of electricity needs met through production or green energy purchases 25% of electricity needs met through production or green energy purchases t Applicable - We are not in a MassDOT building Contribution Yes Yes 6.23 Land Land goals are aimed at using sustainable vegetation maintenance practices and protecting significant habitat areas and natural landscapes. Many all of the indicators are not applicable because there are no significant habitats on any of the FRTA property, no endangered species and no surplus land. FRTA has planted low maintenance plants and a bio-retention garden at the JWOTC in order to minimize impacts to the land (Figure 40) P age
, working towards 0 (0%) and not meeting 26 (76%) of the applicable land indicators as seen in Figure 41.")
91 Figure 40: Bio-retention garden at JWOTC There are 45 indicators for land but only 34 (76%) are applicable to FRTA. FRTA is meeting 8 (24%), working towards 0 (0%) and not meeting 26 (76%) of the applicable land indicators as seen in Figure 41. Figure 42 outlines the land indicators by implementation time and level of achievement. There are 11 indicators in the land theme which are not applicable to FRTA. For the applicable indicators 17 are short term indicators, 16 are medium-term, and 1 long-range. Of those that are applicable to FRTA they have met 5 (29%) of the immediate implementation (2013) indicators, and are working towards or meeting 2 (13%) of the medium-term (2015) indicators. Meeting 100% of long term indicators has been achieved through planting native vegetation P age
92 Land Indicators 24% 0% 76% t meeting Working Towards Meet Figure 41: Land Indicators Level of Attainment 100% 90% 80% 70% 60% 50% 40% 30% 20% 10% 0% Land Indicators by Year t meeting Working Towards Meet Figure 42: Land Indicators Attainment by Year 6-15 P age
93 Table 11: Land Goal Achievement Goal 1: Minimize Energy + Chemical Use in Maintenance Objective: Increase acreage of land planted with native / low maintenance vegetation Indicator New facilities planted with sustainable, minimally managed native landscape Lawn installations around five facilities replaced with natural (low maintenance) vegetation Native plant restoration or managed fallow habitat restoration increased 25% along ROWs Available land surrounding all rural depots and offices planted with native vegetation Objective: Decrease area + frequency of land mowed Indicator Inventory of grassed area conducted Turf grass replaced with broad spectrum blend of grasses including warm season + slow growing for low maintenance Mowing frequency reduced by 25% Mower blades raised in turtle habitat + areas contiguous with natural areas as standard operating procedure Mowing + brush cutting jobs are scheduled around animal nesting season to the maximum extent possible Contribution Yes Yes Yes Contribution Yes t Applicable - We do not use turf grass t Applicable Objective: Implement an integrated vegetation management approach for ROWs + facilities Indicator Landscape areas inventoried by habitat area + maintenance regime Adopted Vegetation Management Plans focus on integrated management approach Soil augmentation utilize organic landscape techniques + minimize nutrient loads to water supplies Compost materials used as the preferred soil amendment in all maintenance + construction projects t Applicable - Our property is not contain turtle habitat t Applicable - We don't have 5 or more continuous acres Contribution Objective: Require intelligent use herbicides + pesticides in construction + maintenance Indicator Mechanical weed control utilized to minimize traditional herbicide use Herbicides used only in conjunction with integrated + sustainable roadside/railway vegetation management plans Increase number of employees trained for herbicide application to allow more selective application Integrated pest management (IPM) implemented for all maintenance projects + construction sites Ongoing training for employees + technical assistance for municipalities on organic/ipm practices established Contribution Yes t Applicable - do not use herbicide t Applicable - do not use herbicide t Applicable - o recent projects 6-16 P age
94 Objective: Protect, preserve + enhance woodland + urban tree coverage Indicator 2 to 1 tree replacement policy implemented where woodland preservation desired Mature, healthy tree preservation is maximized in maintenance and project design where feasible Trees and naturalized landscaping emphasized in revised Project Development + Design Guide Sustainable roadside woodland management plan established for construction and maintenance Urban street tree coverage enhanced during improvement projects Coordinated tree planting policy established to encourage locally supported urban forestry practices 100,000 trees planted along roadways as part of MassDOT's Complete Streets practices Contribution Yes t Applicable - MassDOT responsibility Goal 2: Enhance Ecological Performance of MassDOT Impacted Land Objective: Increase habitat preservation + enhancements Indicator Proactively coordinate project development with MA Department of Fish + Game Restored + maintained areas increased for non-urban construction projects 25 nest boxes installed at appropriate locations Surplus land with high natural resource value evaluated for transfer to appropriate state agencies Grassland and/or Woodland Management Plans in place for all appropriate facilities Wildlife + endangered species training program provided for applicable employees Ten rare species habitat management/ enhancement projects initiated within right-of-way Objective: Increase wildlife accommodation along ROWs + facilities Indicator Contribution t Applicable - no surplus land t Applicable - no rare species habitat Contribution Wildlife hazard mitigation plan(s) implemented for all facilities Reptile + amphibian + fish passage structures incorporated into maintenance activities Project forms revised to include wildlife accommodations measures early in design review Wildlife fencing along ROWs/properties within all critical habitat areas evaluated + installed t Applicable - no critical habitat 6-17 P age
95 Objective: Decrease quantity of invasive + noxious species Indicator Planting of all listed noxious or invasive species prohibited All stockpiled materials screened for noxious or invasive species Transportation of cut wood materials limited to avoid beetle + other pest transportation Aggressive species early detection + rapid response program in place Invasive species control on sites are managed with minimal adverse impact on other species Active invasive species management programs in place within priority habitat areas All maintenance crews trained on invasive species detection Objective: Decrease outdoor light pollution Indicator New lighting designed to conserve energy + avoid light pollution Light shields installed in coordination with roadway + parking lot lighting fixture retrofits Contribution Contribution Yes Yes 6.24 Materials Material goals include using environmentally friendly products; using innovative materials and construction techniques that leave smaller environmental footprints; and having green facilities. The 24,000 sq. ft. JOWTC embodies environmentally friendly products, innovative materials and techniques and green facilities. As the first net-zero energy transit center in the US it uses traditional and local building materials. FRTA though has only met a fraction of the indicators for materials as many of them also relate to the operations and maintenance facility. That facility, originally a trolley barn, is over 100 years old and in poor shape. FRTA is also working to obtain property to construct a new maintenance facility P age
, working towards 0 (0%) and not meeting 45 (85%) of the applicable material indicators as seen in Figure 44.")
96 Figure 43: John W. Olver Transit Center There are 63 indicators for materials but only 53 (84%) are applicable to FRTA. FRTA is meeting 8 (15%), working towards 0 (0%) and not meeting 45 (85%) of the applicable material indicators as seen in Figure 44. Figure 45 outlines the material indicators by implementation time and level of achievement. There are 10 indicators in the material theme which are not applicable to FRTA. For the applicable indicators 30 are short term indicators, 20 are medium-term, and 3 long-range. Of those that are applicable to FRTA they have met 7 (23%) of the immediate implementation (2013) indicators, and are working towards or meeting 1 (5%) of the medium-term (2015) indicators and 0 (0%) of the long-range indicators P age
97 Material Indicators 0% 15% 85% t meeting Working Towards Meet Figure 44: Materials Air Indicators Level of Attainment 100% 90% 80% 70% 60% 50% 40% 30% 20% 10% 0% Material Indicators by Year t meeting Working Towards Meet Figure 45: Material Indicators Attainment by Year 6-20 P age
98 Table 12: Material Goal Achievement Goal 1: Purchase Environmentally Preferred Products Objective: Implement an environmentally preferred materials purchasing program Indicator Environmentally preferred materials purchasing programs implemented in collaboration with OSD Low or no volatile organic compound furniture + flooring purchased 100% recycled content paper products purchased Reclaimed + recycled materials utilized for landscaping + earthwork Only refrigerators with low Global Warming Potential (GWP) refrigerants and insulation purchased Sustainable Forestry Certified wood for permanent or temporary construction utilized Standards for recycled content of traffic control/safety devices developed Sustainability practices integrated into all construction and service contract evaluation criteria Objective: Purchase energy efficient equipment Indicator Only Energy Star or Electronic Product Environmental Assessment Tool certified electronic products purchased Total electronic appliances within office locations reduced Energy efficient criteria utilized for shop equipment + machinery purchases Objective: Use environmentally friendly cleaning products + procedures Indicator Maintenance products + procedures utilized that pose least harm to humans + the environment Protocols for disposal of all cleaning product waste established Environmentally friendly cleaning products purchased when available Environmental friendly cleaning products required to be used within vendor service contracts Contribution Yes Yes Yes Contribution Yes Contribution Yes Yes 6-21 P age
99 Objective: Reduce hazardous chemical use in operations + maintenance Indicator Hazardous materials substitution program developed Hazardous materials spill prevention control and countermeasures plan created Lead free wheels purchased and steel weighted wheels phased in to replace older wheels Natural or organic fertilizers, pesticides, + landscaping materials purchased Low or no volatile organic compound paints applied on indoor facilities Purchasing lists + disposal protocols for engine service + maintenance standardized Technology implemented reducing the quantity of salt applied to roadways proportional to weather conditions Contribution t Applicable - no pesticide used Yes t Applicable Objective: Increase opportunities for local vendors or locally sourced products sold at facilities Indicator Vendor solicitation for MassDOT facilities written to encourage local ownership / sourced products Lease language for MassDOT facilities written to encourage locally sourced products Local vendors + locally sourced products sold at MassDOT facilities doubled Contribution t Applicable - We are not a MassDOT facility t Applicable - We are not a MassDOT facility t Applicable - We are not a MassDOT facility Goal 2: Improve Life-Cycle Impacts of Investments Objective: Reduce energy inputs into paving operations Indicator Warm asphalt mix chosen as the standard state specification and hot mix asphalt eliminated Two pilots of cold in-place paving completed Standard specifications + guidelines for expansion of cold inplace paving established Two pilots of full depth reclamation advertised Standard specifications + guidelines for expansion of full depth reclamation projects established Research to increase the recycled content, reduce energy inputs, and improve vehicle efficiency of paving completed Contribution Objective: Increase total volume of materials sourced within 200 miles of construction site Indicator Total weight/volume/cost of material purchased locally (within 200 miles) measured in all projects Product source information added to bidding requirements Cost share of locally sourced materials increased 20% on state funded projects Yes t Applicable - MassDOT responsibility Contribution 6-22 P age
100 Objective: Increase % of recycled materials in paving + concrete installations Indicator 20% of recycled paving material content used in road resurfacing projects 25% recycled paving material content used in road reconstruction projects The highest recycled content paving and base material available utilized for shared-use paths Use of recycled rubberized asphalt + rubberized asphalt sealer increased Minimum 25% fly ash, slag concrete, or silica flume utilized Innovative sustainable concrete construction techniques encouraged in contracts 20% recycled course aggregate concrete used in all suitable applications Objective: Increase albedo factor in hardscapes, rooftops + paving Indicator Solar Reflectivity Index minimum of 78 instituted for all roofing projects Two innovative roofing (green, vegetation or blue water) projects piloted All new roofing installations utilize high measured albedo factor materials Albedo factor increased in paving surfaces + hardscape materials Urban roadways + parking lots designed to maximize shade coverage of asphalt + concrete surfaces Solar Reflectivity Index of at least 30 required for paving projects Objective: Design for deconstruction + reuse Indicator Road rehabilitation standards developed for reuse of existing installations Expertise in designing for deconstruction specified in all RFRs for design contracts Procurement criteria include incentives to contractor bids utilizing higher recycled content materials Lifecycle analysis in design, project alternative + material selection included Readily reusable + renewable materials encouraged in design specifications Contribution Contribution Contribution 6-23 P age
101 Goal 3: Build Green Facilities for MassDOT Objective: Design all new facilities to green building standards Indicator New facilities funded or built by MassDOT over 20,000 sq. ft. designed to MA LEED Plus New facilities funded by MassDOT designed to LEED Gold or Net Zero Energy Building standard Objective: Retrofit existing facilities to meet environmental design criteria Indicator All window AC units removed from office buildings or replaced with Energy Star units Three building retrofits to LEED Existing Buildings Operations + Maintenance (EBO+M) initiated Air circulation/filtration of MassDOT owned indoor facilities improved Wildlife fencing along ROWs/properties within all critical habitat areas evaluated + installed Objective: Relocate offices + encourage healthy transportation options Indicator Offices in town or city centers relocated to be served by transit, walking + bicycling Provide transit pass exchange for employees with subsidized parking benefits Free parking + take home vehicles for MassDOT urban office employees eliminated Objective: Consolidate office + maintenance facilities where feasible Indicator MassDOT office + maintenance facility consolidation opportunity study completed One office consolidation site piloted Three pilot consolidation and/or cross utilization maintenance sites piloted Contribution Contribution t Applicable - t MassDOT employees t Applicable - We are not a MassDOT facility Contribution t Applicable - t MassDOT employees Contribution t Applicable - We are not a MassDOT facility 6.25 Planning, Policy & Design Planning, policy and design goals are aimed at developing a multi-modal system designed to promote healthy transportation and livable communities. FRTA promotes healthy transportation by providing pedestrian and bike amenities in all new facility design. This helps promote Complete Streets and increase connectivity. All buses are equipped with bike racks. With the Knowledge Corridor upgrades Amtrak s Vermonter now stops in Greenfield at the JWOTC making the center a truly multi-modal station with bus, intercity bus, rail and pedestrian and bike amenities P age
, working towards 3 (8%) and not meeting 24 (61%) of the applicable indicators as seen in Figure 47.")
102 Figure 46: FRTA bike rack There are 56 indicators for planning, policy and design but only 39 (70%) are applicable to FRTA. FRTA is meeting 12 (31%), working towards 3 (8%) and not meeting 24 (61%) of the applicable indicators as seen in Figure 47. Figure 48 outlines the planning, policy and design indicators by implementation time and level of achievement. There are 17 indicators in the theme which are not applicable to FRTA. For the applicable indicators 18 are short term indicators, 20 are medium-term, and 0 long-range. Of those that are applicable to FRTA they have met 7 (39%) of the immediate implementation (2013) indicators and are working towards or meeting 8 (40%) of the medium-term (2015) indicators. Planning, Policy & Design Indicators 31% 8% 61% t meeting Working Towards Meet Figure 47: Planning Indicators Level of Attainment 6-25 P age
103 Planning, Policy & Design Indicators by Year 100% 80% 60% 40% 20% 0% t meeting Working Towards Meet Figure 48: Planning Indicators Attainment by Year Table 13: Planning, Policy & Design Goal Achievement Goal 1: Design a Multi-Modal Transportation System Objective: Increase delivery of Complete Streets projects Indicator Bicycle + pedestrian facilities featured + prioritized in designs, rather than simply accommodated Project forms + databases revised to track Complete Streets + sustainability measures Update of Project Development + Design Guide underway to reflect evolution of Complete Streets Surfaces and facilities of at-grade rail crossings improved for pedestrian + bicycle travel All 'driveway' approaches to MassDOT airports, rail stations + MassDOT provide bicycle + pedestrian access Objective: Increase bicycle parking + access to transit Indicator Transit stations with significant customer car parking (>50 spaces) have covered +/or secure bicycle parking All MBTA + RTA buses equipped with bicycle racks Study + pilot programs completed evaluating options for eliminating peak hour restrictions of bikes on transit Bike stations at rth, South, and Back Bay stations established with showers + locker facilities High capacity bicycle coaches operated on all commuter rail lines + peak-hour access restrictions lifted Bicycle access to heavy rail lines expanded to all hours except two 1-hour peak periods Contribution t Applicable t Applicable Contribution t Applicable Yes t Applicable - Do not operate these stations t Applicable - Do not operate Commuter rail t Applicable - Do not operate rail 6-26 P age
104 Objective: Improve traffic controls to reduce vehicle emissions, + to support walking + biking Indicator Inventory of traffic signals + grade crossing signal conducted All signals evaluated and adjusted for optimal operations for all users Objective: Improve transit system performance statewide Indicator Bus stop consolidation on key routes assessed All RTA's have conducted comprehensive service analysis to improve system connectivity + efficiency Opportunities for express bus lanes + regional bus services analyzed Transit operation efficiency improved while maintaining/increasing ridership Transit Signal Priority for all new traffic signals implemented Payment + boarding system for MBTA light rail + vehicles + buses improved Green Line extension + South Coast Rail service completed Contribution t Applicable t Applicable Contribution Yes Working towards t Applicable - Do not operate rail Goal 2: Promote Healthy Transportation + Livable Communities Objective: Encourage walking, biking, + transit as active transportation Indicator MassDOT Bay State Bike Week facilitated + promoted annually in partnership with MassBike All office locations have visible bicycle parking locations for visitors near entrances Selection of public meeting venues prioritizes locations with transit, pedestrian + bicycle access Information on transit, bicycle + pedestrian travel provided on public meeting announcements MassDOT sidewalks + bicycle facilities are cleared of snow + ice simultaneously with vehicle lanes Navigational signage to transit stations expanded along local roads and highways Employees + contractors required to use transit, walk, bike or carpool to meetings whenever location + service schedules allow 40% of elementary + middle schools reached through Safe Routes to Schools program Contribution Yes Yes Yes Yes t Applicable - DOT initiative 6-27 P age
105 Objective: Promote eco-driving + programs to reduce reliance on single occupancy vehicles Indicator Eco-driving promoted through digital display boards + customer facilities Expand commuter options programs Objective: Indicator Commuter options programs through digital displays promoted statewide Parking spots at major transit stations with parking reserved for car sharing Covered +/or secure bicycle parking installed at major park + ride facilities Secure indoor bicycle parking + shower facilities provided at all major MassDOT employment centers Contribution Contribution Objective: Utilize surplus land, parking lots + air rights for transit-oriented developments Indicator All properties, including air-rights, studied for development feasibility Large parking lots at transit stations analyzed for TOD redevelopment in the Commuter Rail Master Plan Four new RFP's issued for land development At least two mixed use developments on MBTA properties initiated t Applicable - We don't operate park and ride facilities Yes Contribution t Applicable - commuter rail t Applicable - t the MBTA Goal 3: Triple Bicycling, Transit + Walking Mode Share Objective: Connect land use planning with transportation planning + investments Indicator Transit authorities participate in all MassDOT and MPO corridor studies RTA's participate in MassDOT MEPA review and mitigation formation Land use + transportation planning strategies to support mode shift incorporated into 2016 RTPs GreenDOT Implementation Plan activities incorporated into MPO's Unified Planning Work Programs Contribution Yes Yes Yes - Since the release of the GreenDOT Implementation Plan, we have conducted the following studies that work towards achieving GreenDOT goals: Alternative Transportation Planning and Mode Shift, Feasibility Study of a Bike Share Program in Greenfield, Improving/Expanding the Franklin County Bikeway, Expansion of Rail and Transit in Franklin County, Evaluation of Park and Ride Facilities, Survey of Select Populations Regarding Transit Service, Promotional Support for Mode Shift, Complete Street Site Assessments (this has been conducted twice) 6-28 P age
106 Project evaluation criteria that prioritize mode shift, GreenDOT + GHG reduction adopted by MPOs Complete Commuter Rail Master Plan to evaluate options to expand capacity + increase ridership along each line Priority Development Areas (PDAs) + Priority Protection Areas (PPAs) approved by HED established in all MPOs Strategic regional visions for 'zero' SOV growth + GHG reduction adopted by MPOs State-of-the-practice metric for measuring bicycle and pedestrian quality of roadways utilized in corridor planning + design Objective: Stabilize travel demand growth on roadways from single occupancy vehicles Indicator Contribution All rail stations are accessed by Complete Streets Yes - Our Project Eval Criteria does take into consideration the following items: 1) sustainable development effects; 2) consistency with regional land use plans; 3) air quality/climate effects; 4) effect on bicycle and pedestrian safety; 5) effect on congestion; 6) effect on other modes. There are other factors it takes into consideration, but these are the ones that look at GreenDOT topics. t Applicable - commuter rail - We have proposed Priority Development Areas and Emerging Development areas that were developed as part of our Regional Plan for Sustainable Development. But they have not been approved by HED. Working towards - We have not specified zero SOV growth, but we do a have goal in our 2012 Regional Transportation Plan to Promote transportation activities and technologies which conserve energy and reduce travel congestion and vehicle emissions. We are in the process of updating this plan and the draft plan will have additional goals that more specifically promote SOV alternatives, but will most likely not call out zero SOV growth. - We are in the process right now of developing performance measures for bicycling and walking in the region. t Applicable - commuter rail connections Objective: Collect data regarding factors influencing mode choices + utilize better planning tools Indicator Contribution Person Miles Travelled (PMT) for all modes measured and/or estimated annually at state and regional levels Public health impacts of major transportation projects considered in project selection criteria New methods for collecting travel data for bicycles and pedestrians piloted Scenario planning methods utilized by MassDOT and MPOs instead of traditional growth trend forecasts Traffic model assumptions for road design revised to assume limited traffic growth rather than historic VMT growth trends MassDOT conducts travel demand forecasts with an activity based model Yes - Our project selection criteria include a factor that examines Residential effects: right-of-way, noise, aesthetics, cut-through traffic, other. Public health is not specifically mentioned here, but would be included under these criteria. - We use traditional growth trend forecasts developed in partnership with MassDOT, the Donahue Institute, and the FRCOG. - We do not have a traffic model for Franklin County. t Applicable - This is a MassDOT responsibility, not RTA 6-29 P age

107 Objective: Increase training opportunities on GreenDOT and Mode Shift Indicator Coordinated information gateway for shuttles and inter-city bus travel implemented Programs for healthy transportation education and travel training for young + elderly travelers developed statewide Bay State Roads technical assistance offers materials on sustainability, mode shift, Complete Streets, and parking policies Contribution Working towards - have links to PVTA Yes t Applicable - t Bay State Roads 6.26 Waste Waste goals aim to reduce the exposure to hazardous waste and minimize the disposal of waste. FRTA is minimizing waste by recycling, using less material, and installing trash bins and information at the JWOTC. Figure 49: Litter control program at JWOTC There are 33 indicators for waste but only 29 (88%) are applicable to FRTA. FRTA is meeting 9 (31%), working towards 0 (0%) and not meeting 20 (69%) of the applicable indicators as seen in Figure 50. Figure 51 outlines the waste indicators by implementation time and level of achievement. There are P age
108 indicators in the waste theme which are not applicable to FRTA. For the applicable indicators 16 are short term indicators, 10 are medium-term, and 3 long-range. Of those that are applicable to FRTA they have met 5 (31%) of the immediate implementation (2013) indicators, and are working towards or meeting 3 (30%) of the medium-term (2015) indicators and 1 (33%) of the long-range indicators. Waste Indicators 31% 0% 69% t meeting Working Towards Meet Figure 50: Waste Indicators Level of Attainment 100% 90% 80% 70% 60% 50% 40% 30% 20% 10% 0% Waste Indicators by Year t meeting Working Towards Meet Figure 51: Waste Indicators Attainment by Year 6-31 P age
109 Table 14: Waste Goal Achievement Goal 1: Achieve Zero Solid Waste Disposal Objective: Increase the diversion rate of office waste Indicator Zero waste plan developed for MassDOT Full "single stream" recycling provided at all buildings All electronics, cartridges, batteries, + accessories recycled Employee education program on recycling + waste reduction underway 15% reduction in solid waste from offices achieved Office building composting or biomass heating piloted at two facilities Waste reduction / recycling program emphasized in all janitorial service contracts 30% reduction in solid waste disposal achieved Objective: Eliminate litter accumulation in ROWs + stations Indicator Litter control programs initiated in all corridors Litter prevention information provided at all rest areas + stations Contribution Yes Yes Contribution Objective: Provide "full-stream" recycling opportunities at all customer facilities Indicator Container + paper recycling installed at all rest area, airports, transit stations + RMV branches Mobile electronics + license plate recycling drop off provided at key locations Contribution Objective: Decrease amount of waste generation during construction + maintenance Indicator Waste management plans developed for all construction projects At least 65% of construction debris is reused or recycled At least 80% of construction debris is reused or recycled At least 90% of landscaping waste material is reused or composted Objective: Decrease paper use Indicator Paperless office procedures and equipment piloted in all offices Paper use is cut in half A paper-free office program adopted + implemented Other paper products consumption (paper towels, napkins, etc.) reduced in all facilities Yes Contribution Contribution Yes 6-32 P age
110 Goal 2: Reduce all Exposure to Hazardous Waste Objective: Implement Environmental Management System Indicator EMS systems adopted + implemented for all divisions All waste is managed in compliance with a hazardous waste management plan Metrics of recycling + disposals reported from all sites EMS data from all Divisions compiled annually into a central performance management system Best management practices for salt and sand storage in place at all depot facilities Objective: Comply with waste ban + eliminate on-site storage Indicator 100% compliance with state waste bans met at office + maintenance facilities Long-term storage of hazardous waste minimized Objective: Increase recycling rate of hazardous materials Objective: Indicator Refrigerants with high global warming potential from HVAC + Yes refrigerators recycled 80% of all hazardous waste generated is recycled where Yes possible 100% of hazardous waste with recycling potential is diverted Yes Objective: Evaluate + remediate brownfield sites Indicator Contribution t Applicable - We don't have a hazardous waste management plan Yes Contribution Yes Contribution Contribution An assessment of all brownfield properties is completed Remediation / redevelopment of at least four properties underway Remediation / redevelopment at all known brownfield sites initiated t Applicable - no brownfields t Applicable - no brownfields t Applicable - no brownfields 6.27 Water Water goals look to use less water and improve water systems. Many of these are not applicable as there is no open water flow on any of the properties. Where possible water has been conserved, such as with recycling rain water to wash the vehicles. FRTA is also working hard to reduce storm water runoff and non-point pollutant discharge. There are 46 indicators for water but only 27 (59%) are applicable to FRTA. FRTA is meeting 9 (33%), working towards 0 (0%) and not meeting 18 (67%) of the applicable water indicators as seen in Figure 52. Figure 39Figure 53 outlines the water indicators by implementation time and level of achievement P age
111 There are 19 indicators in the water theme which are not applicable to FRTA. For the applicable indicators 13 are short term indicators, 10 are medium-term, and 4 long-range. Of those that are applicable to FRTA they have met 5 (38%) of the immediate implementation (2013) indicators, and are working towards or meeting 3 (30%) of the medium-term (2015) indicators and 1 (25%) of the longrange indicators. Water Indicators 33% 0% 67% t meeting Working Towards Meet Figure 52: Water Indicators Level of Attainment 6-34 P age
112 Water Indicators by Year 100% 90% 80% 70% 60% 50% 40% 30% 20% 10% 0% t meeting Working Towards Meet Figure 53: Water Indicators Attainment by Year Table 15: Water Goal Achievement Goal 1: Use Less Water Objective: Decrease potable water use in buildings Indicator The efficiency of all water fixtures in buildings evaluated Fixtures retrofitted to gain a 10% reduction in water use Plumbing system retrofitted to gain 20% reduction in water use Objective: Decrease water use for irrigation Indicator Water conservation integrated into vegetation management plans Potable water use for irrigation reduced by 25% Objective: Increase utilization of recycled water + rainwater Indicator Water conservation practices at bus, vehicle, or airplane washing facilities required All new vehicle/bus/rail vehicle washing facilities designed and built with recycled water technologies All existing vehicle washing facilities evaluated for recycled or recaptured rain water alternatives Study of rooftop rainwater use for toilets / HVAC of largest office facilities completed Rain barrels or other means to reuse rainwater + disconnect drain spouts from sewage systems installed Contribution Yes t Applicable t Applicable Contribution t Applicable - We don't have vegetation management plans t Applicable Contribution t Applicable - new facility 6-35 P age
113 Objective: Install innovative dual plumbing water systems in facilities Indicator Water use innovations required in all new building proposals Three new pilot structures or building retrofits utilizing dual plumbing completed Contribution Goal 2: Improve Ecological Function of Water Systems Objective: Minimize impacts + enhance wetlands + impaired waters Indicator Preservation + enhancement of wetlands is adopted in design instead of replacement Environmental benefits of impact mitigation through watershed planning improved Natural buffers between wetland resources + transportation infrastructure increased whenever possible Alternative deicer agents utilized in areas with wetlands, cold water fisheries, and water supplies Five wetland restoration projects not considered mitigation completed Objective: Adapt facilities for climate change resilience Indicator Climate change adaptation strategies initiated between local and federal parties Revised extreme precipitation data utilized for rainfall, flood flow + storm water calculations Climate Adaptation Plan applicable to all MassDOT facilities adopted Statewide climate change vulnerability assessment for MassDOT facilities completed Critical roadway or rail segments targeted for culvert replacement + rearming for scour protection Fish passage structures which meet state crossing standards included in maintenance activities All reconstruction projects crossing tidal habitats include measures to eliminate tidal flow restrictions Contribution Yes Yes Yes Contribution t Applicable - We are not a MassDOT facility t Applicable - limited roadway t Applicable - no open waters t Applicable - not near tidal water 6-36 P age
114 Objective: Minimize impacts of ROWs + bridges on fluvial processes Objective: Indicator New roadways + bridges designed to maximize natural fluvial processes including tidal flushing At minimum 12 bridge replacement projects improving water flow under construction or completed All railroad bed reconstruction projects retrofitted with enhanced stream crossing standards The standards within MA Stream Crossing Handbook utilized in all project development processes A minimum of five culverts redesigned + rebuilt for improved fish migration All projects crossing tidal habitats evaluated for restriction of tidal flow Objective: Reduce storm water volumes + increase permeable surface areas Indicator Environmentally sensitive site design in new construction projects utilized Post peak discharge rates held to less than pre-project discharge rates to the maximum extent possible All projects designed to remove solids + pollutants to the maximum extent possible All projects designed to include measures to increase infiltration + reduce storm water volumes Permeable paving or other infiltration installations included in parking lot resurfacing projects Design charrette conducted for creating "green roof" bus shelters for the MBTA and/or major RTA Green roof installed on at least one large bus or rail maintenance garage Contribution t Applicable - no new paved roads since 2010 t Applicable - no open water flow t Applicable - Do not operate rail t Applicable t Applicable - no culverts t Applicable - not near tidal waters Contribution Yes Yes Yes Yes 6-37 P age
115 Objective: Decrease non-point source pollutant discharges Indicator All structural best management practices inspected annually + cleaned as necessary Illicit discharges from MassDOT structures eliminated upon detection Long-term pollution prevention programs implemented at all maintenance sites Environmentally sensitive design / Low Impact Design (LID) utilized in all construction projects New best management practices installed at all facilities identified by Impaired Waters Program Phytotechnology as part of storm water evaluation + constructed storm water controls utilized Assessment protocol developed to evaluate water quality functions of roadside vegetation Storm water 'Low Impact Design' integrated into revised Project Development + Design Guide Commuter ferries follow best practices for fuel handling, bilge water, sanitary waste + trash disposal Contribution t Applicable t Applicable - We are not a MassDOT facility Yes t Applicable - MassDOT responsibility t Applicable - Do not operate ferries 6.2 Conclusion With over 300 indicators, as identified in the GreenDOT policy 72% are applicable to FRTA. They are working continuously to achieve the indicators and have achieved many indicators ahead of schedule. Some of the indicators which are applicable are joint responsibilities of FRTA and either MassDOT, the planning commission or the town and they must work collaboratively to achieve success. Additionally many of the indicators just do not apply because they are specific to the MBTA; rail; require that there has been or will be new construction; they are for MassDOT owned facilities, or they are for environmentally sensitive land areas P age
116 Page intentionally left blank
117 Chapter 7 Recommendations Burke & Company
118 7. RECOMMENDATIONS 7.1 Introduction Recommendations were developed using a cumulative process that incorporated public outreach, a diverse steering committee, operational input from FRTA, and analysis of existing transit service and the local/regional market. Strategies to improve the system were developed based on the goals and objectives outlined at the beginning of the plan. The recommendations are intended to better align service with local and regional demand using a three phase process that will serve to strengthen the system and attract more riders. A phased approach was used in order to establish the immediacy and prioritization of needs and was based on an incremental approach and available resources. Phase 1 implement some elements immediately and as resources and funding are available Phase 2 - implement as resources and funding are available Phase 3 - implement as resources and funding are available To be able to evaluate whether or not transit services are meeting system goals and objectives, an effective monitoring program should first be in place. A service monitoring program is important both in terms of gauging whether the goals of the community are being accomplished with the service and that the service is both effective and efficient. Without specific measures, success is difficult to measure from year to year. Service monitoring should be part of the daily operation based on specific data collection procedures. Data collection is essential to evaluating the service performance and to determining if changes should be made in the service delivery. To assist in developing a service monitoring program, recommended service guidelines and performance measures have been developed. 7.2 Strategies for Service Recommendation For transportation planning purposes, a goal is defined as a purpose or need that should be attained to address a transportation issue. An objective is a specific, measurable method or activity that is designed to achieve the identified goal. The goals and objectives were developed at the onset of the planning process with FRTA and have guided the development of the plan throughout. Goal #1: Provide high-quality, customer-oriented service Objective 1.a: Expand weekday hours Objective 1.b: Implement weekend service Objective 1.c: Increase frequency on highly productive corridors Objective 1.d: Improve transit access for the public Objective 1.e: Create a travel training program to perform in-person assessments for your disabled population and to help transition paratransit riders onto the fixed-route system 7-1 P age
119 Goal #2: Provide effective and safe services Objective 2.a: Improve the productivity of routes Objective 2.b: Increase service area commensurate with growing demand and need within the region Objective 2.c: Design routes to improve on-time performance and minimize dwell time Goal #3: Promote the transit service Objective 3.a: Work with local employers, educational institutions, and medical facilities to promote the use of the transit system, leaving educational and promotional materials with them Objective 3.b: Participate in marketing and promotion of services, including coordinating with other organizations Objective 3.c: Educate the public on the benefits of transit Aside from the goals and objectives several other strategies/guiding principle were used in designing recommendations: 8. Simplify Routes should be designed along main corridors with minimal schedule deviations. For routes that are not linear, service should be provided in both directions. 9. Service should match demand The denser (both in terms of employment and population) areas should have a higher level of service with either higher frequency routes or multiple lower frequency routes. Major corridors often warrant higher frequencies. 10. Standardized frequency Frequencies should be standardized using clock-face schedules to create 30, 60 and 120 minute headways. 11. Priority to existing ridership Service should be increased in areas that warrant it over servicing new areas if limited resources are available. 12. Connections route should be designed in isolation. If possible it should connect to at least one hub. Where connections to hubs are not possible the route should connect with at least one other route to facilitate transfers. 13. Efficiency Where possible routes should be designed to be the most efficient. Decisions to deviate off the main corridor and add time to the route are only warranted where key destinations like shopping centers are too far off the main road, there are a lack of pedestrian facilities or the benefit (due to demand) of servicing the deviation outweighs the additional time incurred to others on the route. 14. Consistency Except where warranted by peak only routes or increased peak hour service, service should have consistent headways throughout the day using clock-face schedules. 15. Regional network Regional connections should be improved to provide access outside of the FRTA service area through timed transfers with other systems such as PVTA or 7-2 P age
120 MART, to areas identified as common destinations through the market analysis and public outreach process. 7.3 Recommendations Overview Recommendations are categorized by route and phase. A three phase process was used in order prioritize recommendations. Priority was based on demand, route performance, public feedback and resource availability. In Phase 1 frequencies have been standardized, alignments have been adjusted, schedules have been adjusted to improve transfers with PVTA and MART, and evening service has been implemented. In Phase 2 Saturday service has been added, and new services have been implemented. In Phase 3 service has been expanded to Sunday. The timeframe for each phase is based on available capital and operating resources. In general Phase 1 can be implemented immediately if funding resources become available through changes being made to existing service and as other resources become available as it does not require an increase in the current fleet size, but Phase 2 and Phase 3 can only be implemented as resources and capital equipment become available. Phase 1: Split the Route 21 into two routes (21, 25/62) and improve frequency of service Combine the Route 22 and Route 32 into one route Extend weekday service to 7:30 PM Improve connections and transfers with PVTA and MART Phase 2: Implement Saturday service Split the Route 25/62 into two routes and improve frequency Peak hour express bus to rthampton via I-91, stops at the Whately Park and Ride Examine implementing holiday service Phase 3 Sunday service Establish all day express service to rthampton, end the Route 31 at Walmart in rthampton A summary of the overall recommendations is in Table 16 and Table 17 breaks down the recommendations by phase. Figure 54-Figure 55 are maps depicting system wide alignment changes for each phase of the plan. For detailed individual route recommendation profiles see section P age
121 Table 16: Service Recommendations FRTA Proposed Service Recommendations Weekday Saturday Sunday Route Name Proposed Changes Alignment Changes 21 Greenfield Community Split into three routes: 21, 25, 62. Add weekend service on new Greenfield Circulator Realign to remove some deviations, shift service to GCC and Corporate Center on separate routes. Current Existing Proposed Proposed Proposed Productivity Ridership (Riders/Hr) Frequency Span Frequency Span Frequency Span Frequency Span trips/day, 4 clockwise, 5 counterclockwise 6:15am - 6:00pm 30 6:00am - 7:30pm 60 8:00am- 6:00pm 60 8:00am- 6:00pm 22 Montague Greenfield Discontinue, combine with Amherst Greenfield Additional Trips Reroute to Sunderland via MA-47 to connect with PVTA trips/day trips/day 6:15am - 6:30pm 6:45am - 4:10pm 4 trips/day 6:30am - 5:05pm 31 rthampton Greenfield Regular schedule for better connections, schedule to improve transfers between PVTA P- 31, B-43, B-48 & G-46 and FRTA. Terminate at Walmart when 91E gets established as all day service trips/day 5:15am - 6:15pm 120 min in phase 1 &2 90 in phase 3 6:25am - 7:25pm 120 8:00am - 6:00pm 120 8:00am - 6:00pm 32 Orange Greenfield Improve frequencies, shift scheduled times to meet with MART in Orange Add service to Industrial Center (fixed route deviation - peak, oncall off-peak) previously served by Route 22 on select trips trips/day 5:00am - 6:23pm 60 5:00am - 7:30 pm 120 8:00am - 6:00pm 120 8:00am - 6:00pm 41 Charlemont Greenfield Remove school deviation to Mohawk Regional during summer Streamline routing trips/day 6:45am - 5:35pm 4 trips/day 6:45am - 5:35pm 25 GCC Shuttle New route Run from Transit Center, Main, Colrain St, College Dr., GCC, College, Colrain Rd, Mohawk Trail, Big Y, Mohawk Trail, Main 60 7:40am- 5:40pm 60 9:00am- 5:00pm 60 9:00am- 5:00pm 62 Corporate Center Shuttle Publicize route; number with new system map Run from Transit Center, Main, Newton, Fairview St W, Munson, Wisdom Way, Mill St 30 peak, 60 offpeak 7:30am - 5:30pm 91E rthampton Greenfield Express New route Express service from JWO Transit Center to rthampton via I-91, stops at Whately P&R 60 7:40am- 5:40pm 7-4 P age
122 Table 17: Recommendations by Phase Bus Route Proposed Changes Alignment Schedule Phase 1 Phase 2 Phase 3 Route 21 Greenfield Community Route Yes Current route split into three routes: 21, 25, 62. Shift service to GCC and Corporate Center on separate routes, bidirectional service. -60/30 minute bidirectional service -Extend weekday service to 7:30 PM -New weekend service -Split into three routes -60 minute frequency bidirectional -Extend service to 7:30 PM -Saturday service -Sunday Service -30 minute frequency weekday service Route 22 Montague/Greenfield Yes Discontinue, combine with 32 - service -Eliminate route Route 23 Amherst/Greenfield Yes Reroute to Sunderland via RT-47, terminate at Sugarloaf apartments to transfer with the PVTA P-31 Route 31 Greenfield/rthampton Yes Terminate at Walmart in rthampton (weekdays only) when the 91E is established as an all day service Route 32 Orange/Greenfield Yes Service Industrial Blvd. on peak hour trips only Route 41 Charlemont/Greenfield Yes Streamline routing; Service Mohawk regional HS on select trips when school is in session only -2 daily trips added -New alignment -Add trips -120/90 minute frequency -Service span 6:25 AM to 7:25 PM -New weekend service -Time route to maximize transfers with the PVTA G-46 -Adjust schedule times to meet MART -Extend service to 7:30 PM -60 Minute Frequency -New weekend service -120 minute frequency -Service span -Time route to maximize transfers with the PVTA G- 46 -Adjust schedule times to meet MART -Add service to Industrial Blvd. -Extend service to 7:30 PM -60 Minute Frequency -Streamline route, Service Mohawk HS in session only -Saturday service -Saturday service -Sunday Service -Adjust alignment to terminate at the rthampton Walmart -90 minute frequency -Sunday Service Route 25/62 Combined Yes New Route Combines the 62 and minute frequency -Service span 7:40 AM-5:40 PM Route 62 Corporate Center Shuttle Yes New Route - Run from Transit Center, Main, Newton, Fairview St W, Munson, Wisdom Way, Mill St -60 peak/120 off-peak frequencies -30 peak/60 off-peak frequencies -Service span 7:30 AM to 5:30 PM -Implement combined service -Discontinue combined service in favor of separate routes -Implement service -Improve frequency Route 25 GCC Shuttle Yes New Route - Run from Transit Center, Main, Colrain St, College Dr., GCC, College, Colrain Rd, Mohawk Trail, Big Y, Mohawk Trail, Main Route 91E rthampton - Greenfield Express Yes New route - Express service from JWO Transit Center to rthampton via I-91, stops at Whately P&R - Weekday 60 min frequency 7:40 AM-5:40 PM -30 minute frequency - Saturday 60 min frequency 9 AM 5 PM - Sunday 60 min frequency 9 AM 5 PM -60 minute frequency -Service span 7:40 AM-5:40 PM -Implement service weekday and Saturday -Implement service during peak hours only -Sunday service -60 minute frequency 7:40 AM to 5:40 PM span 7-5 P age

123 Figure 54: Phase P age

124 Figure 55: Phase 2 & P age
125 7.4 Cost Estimation 7.41 Operating Costs Operating costs are based on the average cost per hour of $109.5 and incorporate all of the recommendations for each route and phase. The cost can be adjusted by implementing some but all not recommendations or interlining routes to improve efficiency; therefore the final costs may differ slightly from what is proposed. Figure 56 charts the total operational cost for the existing system and the additional costs associated with the service improvements in each phase. For a breakdown of the cost/savings for each route and phase see the recommendation profiles in section 7.7. $4,000,000 $3,500,000 $3,000,000 $2,500,000 Cost by Phase $2,000,000 $1,500,000 $1,000,000 $500,000 $0 Existing Phase 1 Phase 2 Phase 3 Phase increased cost 0 $682,000 $420,000 $1,133,000 Base cost $1,200,000 $1,200,000 $1,882,000 $2,302,000 Phase increased cost Base cost Figure 56: Cost by Phase 7.42 Capital Costs Capital costs include vehicle and infrastructure costs. In Phase 1 the primary constraint was based on the number of vehicles required in peak service. FRTA currently has a fleet of seven buses and 10 mini buses to provide fixed route service for a total of 17 vehicles. In peak service there are currently 8 vehicles in use, Phase 1 was designed with this constraint (Figure 57). Future phases will require additional vehicles and the procurement process can take up to two years from the time the process begins until the vehicles are delivered and put into service. FRTA must begin to plan now for future expansion of the fleet. With the expansion of the fleet, this may require a new or additional facility; the current one is at capacity and outdoor storage space is limited. 7-8 P age
126 14 Peak Fleet Requirements Vehiclers Existing Phase 3 Phase 2 Phase 3 Figure 57: Fleet Requirements by Phase 7.5 Recommended Service Guidelines In order to establish service guidelines in the pursuit of establishing a monitoring program in the future, service must first be monitored and data collected. Routes should be defined by the function they service in order to accurately measure the health of a route. Four types of routes are recommended for FRTA: (1) local, (2) rural, (3) express route, and (4) service route. Each route type will have in turn different performance measures to monitor existing service and evaluate new service. Table 18 provides an overview of the suggested route type and pairing for existing and recommended FRTA routes. Local Routes These are routes that service densely populated areas. They typically begin and end in an urban center and stop at all locations along the way. Rural Routes- These routes typically operate a few trips a day and originate in an urban area but the majority of the route is operated in rural areas. They typically exhibit higher operating speeds, longer trips and do not run on a consistent headway. Express Routes Express routes are designed to provide faster, direct service for commuters and have limited stops. They typically operate on weekdays only during peak periods. Service Routes Service routes are designed to meet the needs of a specific group. They typically have lower ridership and sporadic trip times based on the schedule of the group in question. They can be partially funded by a group. Examples may include school tripper routes, commuter rail connectors, school/college shuttles, or work shuttles. 7-9 P age
127 Table 18: FRTA Route Types Route Type Routes Local 21, 31, 32, 62, 25 Rural 41 Express 91E Service 23 Categories of data to be collected and used in the monitoring program include the following, which are discussed in detail below: Ridership On-time performance Financial Service coverage Service levels span and frequency Passenger boarding data should be collected continually on a time-specific basis. There is a trade-off between data collection efforts and the value of information. It is just as easy to collect too much data as it is to collect insufficient data. Passenger boardings should be recorded daily by route, fare category, and by trip; this information can often be generated through farebox reports. One goal all transit agencies should strive to reach is the implementation of Automatic Passenger Counters (APCs). APCs include capabilities such as recording each passenger by fare category as they board. This function should be programmed into the software as it is implemented. However, even without the benefit of APCs, passenger data can still be collected and recorded by drivers for numerous variables. With any transit system, it is important to monitor on-time performance. An on-time performance goal should be established (e.g. an attainable on-time goal of 95 percent may be considered). Minor adjustments to routes may be needed to ensure that schedule and headway adherence can be maintained. If automatic vehicle location (AVL) software is not available to track on-time performance, drivers should report actual arrival and departure times at designated bus stops along the routes and at major stops. It should be emphasized that drivers should not leave prior to a scheduled stop time to make up time along a route. Leaving early could cause riders to miss a bus. The dispatcher should then record this information so that the number of trips running late can be determined. Financial data are required to evaluate performance measures such as the operating cost per hour of service and the cost per passenger-trip. Financial monitoring should continue as part of the performance monitoring program. Important data to collect and report include operating revenue by source, farebox revenue by fare category, maintenance costs, gas and oil expenditures, employee-related costs (including salary and benefits), and the cost of extending the hours that the JWO will be open P age
128 Service coverage should be based on demand as the area has a wide range of employment and population density. Before service is expanded to new areas or frequencies increased, density thresholds should be examined (Table 19). Table 19: Service Thresholds Jobs & Population per Square mile Fixed-Route Headway <2,000 service 2,000-3, min or peak only 3,001-6, Min 6,501-16, Min 16, , Min 250, Min It is also important to establish minimum levels of service for each route type. These include service span and frequency. Table 20 below outlines suggested minimum service spans (or number of trips) for each route type. Service can begin earlier or end later if demand warrants. Adjustments to the times can also be made based on the hours of centers served and the passengers needs but should be within the financial capacity of FRTA. Table 20: Minimum Service Spans Local Routes Rural Routes Express Routes Service Routes Weekday 6:30 AM 6:30 PM 7:00 AM - 5:00 PM 6:00 AM 9:00 AM, Varies with need 3:00 PM 6:00 PM Saturday 9:00 AM 5:00 PM Sunday 9:00 AM 5:00 PM Frequency often has a direct correlation with ridership; higher levels are more attractive to riders but cost more to operate; therefore it is critical to establish frequencies that are high enough to attract riders but not so high that the subsidy is greater than the need. Higher frequency routes require more vehicles and drivers. Clock-face schedules should be used except for under unique circumstances. These circumstances can include trips that are: designed to meet work shifts or school bell times; that include clock-face schedules that would require excessive recovery time (inefficient service); or that disallow interlining with other routes or miss key transfers. Minimum service frequencies are presented in Table 21 and should correlate to service thresholds established in Table 19. These frequencies represent minimums based on the service spans in Table 20 but can have variations throughout the day such as added service during the peak hours or reduced service at night P age
129 Table 21: Minimum frequencies Route Type Local Rural Express Service Frequency 60 Minutes 120 Minutes 2 trips/day 2 trips/day 7.51 New Service Warrants FRTA often receives requests for new service; new service warrants will help FRTA evaluate proposals and determine service levels. Section 7.63 outlines how to monitor and measure new services. The development of the new services should follow the new service warrants and after 2 years be able to meet or exceed the performance measures outlined in Section When analyzing new service requests and proposals the following should be considered: Area coverage When service is proposed the new route should be evaluated for its ability to connect to other routes, meet service thresholds, and operate cost effectively. Routes extend the service area may have a demand but the increased miles/hours may cause the subsidy to be greater than those recommended in the performance measures. Transit dependent populations The presence of transit dependent populations should be considered when evaluating new service proposals. If there is a high but remote transit dependent population, alternative service types might be warranted. Special markets New service is often proposed for special markets such as a new shopping center, university campus, or employment center. These markets often produce demand but the cost to service them can be high and ridership potential undetermined. FRTA should work with these destinations to secure some dedicated funding which can help bring down the cost of the route. 7.6 Performance Measures Performance measures serve as a guide to evaluate the success of a transit service. Performance measures include the types of data to be collected and give the tools necessary to identify transit system opportunities and deficiencies. Performance measures should: Be easily measurable Have a clear and intuitive meaning so that it is understandable to those who will use it and to non-transportation professionals Be acceptable and useful to transportation professionals Be comparable across time and between geographical areas Have a strong functional relationship to actual system operations so that once changes occur in service operations, changes to the system can readily be determined 7-12 P age
130 Provide the most cost-effective means of data collection Where appropriate, be based on statistically sound measurement techniques Be consistent with measures identified for other systems Recommended performance measures to monitor existing and future routes could include: Passengers/Hour: Number of total monthly and annual passengers divided by the corresponding revenue-hours. Subsidy/Passenger: Total expenses minus fare revenue divided by ridership. Farebox Recovery: The percentage of operating costs covered by fares collected, calculated by the fares collected divided by the cost to operate the route. Cost/Revenue-Hour: An excellent indicator of efficiency is cost per revenue-hour of service. Costs per hour should be analyzed by route and compared to overall system averages. Late Trips: The percentage of fixed-route trips which operate late or are missed should be recorded and reported. The recommended standard for late trips is any trip that is more than five minutes behind schedule. Service/Road Calls: the number of service/road calls divided by the number of revenue miles. This measure is typically measured for the entire system and not individual routes. This monitors routine maintenance and vehicle performance. Accidents/100,000 miles: Measure of driver safety. There must be a standard practice for defining what an accident is Service Benchmarks The aforementioned performance measures can be used to create benchmarks for service operation. The benchmarks will help FRTA track progress and set goals for the performance of the route. These benchmarks should be seen as short-term goals that should be re-evaluated at set intervals at least every five years to ensure that the expectations for the route are consistently evolving. If a specific benchmark has been greatly exceeded during the first two years of operation, the criteria should be changed to provide a progressive target for the service. The following benchmarks were determined by the base type of service, national best standards and the current performance. Passengers per Hour Passengers per hour measures ridership as a function of the amount of service provided and will vary based on the type of route. Table 22 outlines the threshold for route/service types which can be used to monitor the route. As system-wide service improves these values should be adjusted to reflect the change and reevaluated every 3-5 years. They are based on current performance and best practices. If routes are performing at 75% or below of the benchmark then the route may need to be evaluated to determine remedies to improve performance P age
131 Table 22: Passenger per Hour Route Type Passengers per Hour Local 10 Rural 8 Express 10 per trip Service 5 Subsidy per Passenger Subsidy per passenger measures the cost of providing service, taking into account fare revenue collected. As with passengers per hour, as system-wide service improves these values should be adjusted to reflect improvements and should be reevaluated every 3-5 years. FRTA should strive to have a subsidy per passenger less than $8 on all routes. If subsidies are more than 50% higher than the benchmark and the route does not have a dedicated source of funding, then the route may need to be evaluated to determine remedies to improve performance. Farebox Recovery Farebox recovery ratios are typically low for rural transit systems such as FRTA. FRTA should strive to meet or exceed the average farebox recovery ratio outlined in the Rural National Transit Database of 8% on all routes. If the ratio drops on a route to below 5% (the average recovery ratio for other rural agencies in FTA Region 1) then the route may need to be evaluated to determine remedies to improve performance. Cost per Revenue Hour Cost per revenue hour by route should be related to the average of the system so that it can change as service is added or subtracted or funding sources change. Table 23 provides a guideline for monitoring this benchmark. Table 23: Cost per Hour Performance Standard Criteria Performance Percentage of Average Action Very Low 0%-50% Immediate action Low 51%- 75% Subject to review Average 75%-150% action needed High 150%+ Evaluate for service improvements For those routes performing under 50% immediate actions are listed in section Routes falling within the 50%-75% range are routes that are candidates for monitoring service. Routes falling within the 75%-150% range are routes that are performing well and require no action. 150%+ routes indicate high performing routes which may benefit from increased service. Late Trips Late trips measure on-time performance and help evaluate a vehicle s adherence to a schedule. A trip is considered on-time if it departs a timepoint no more than five minutes late; no trips should leave early P age
132 The recommended best practice for on-time performance nationwide is 95%; FRTA should strive to meet this benchmark. Service/Road Calls Vehicle breakdowns are inevitable. This measure tracks the distance traveled between mechanical breakdowns. Although frequent occurrences can create disruptions in a transit system, it is important to track the frequency and type of mechanical failures of each vehicle in addition to monitoring a fleet s age. Monitoring of vehicle breakdowns is one method of reducing system disruptions and may allow an agency to improve monitoring of vehicle replacement schedules and preventative maintenance practices. Data collection efforts should include date, time of day, type of failure, age of vehicle, vehicle number, vehicle mileage, and how the situation was rectified. Monitoring of these items will allow FRTA to recognize patterns in repeated types of mechanical breakdowns; breakdowns related to vehicle type, age or mileage; and assist with preventative maintenance programs. Wheelchair lift failures should also be monitored. FRTA should strive for 20,000 miles between road calls. Accidents per 100,000 Miles The FTA suggests that at a minimum transit providers strive towards the goal of six accidents or less per 100,000 miles. FRTA should seek to exceed that minimum with no more than three (3) accidents per 100,000 miles. The measure can be calculated by dividing the number miles by the number of accidents in a given time period. Values lower than 33,333 indicate that the indicator is not being met Action for Low Performing Routes If routes are not meeting at least two out of the three main indicators (passenger per hour, subsidy per passenger, farebox recovery) or fall below the minimum suggested values (5% farebox recovery, $12 subsidy per passenger, 75% of the passenger per hour by service type or very low performance score for cost per hour), they should be evaluated for possible modification. The following actions may help improve route performance: Change service level Some low performing routes may not warrant increased service frequency; yet routes with very few trips may not attract riders. High frequency routes that are low performing should be evaluated for service changes. Low frequency routes can be evaluated for trip additions to determine if the low performance is related to minimal service. This analysis should be done in conjunction with outreach to determine if extra trips would garner higher ridership Segment identification A segment level analysis of a route might highlight a portion of the route that causes the overall poor performance. This segment can be modified to help improve the overall route P age
133 Marketing Marketing can help raise the public awareness of a route. Ridership can be poor because the public lacks knowledge of the service. A marketing/educational campaign can help improve performance statistics. Public outreach On-board surveys or rider interviews can help gain information about how the route can be improved. Span identification Evaluating the performance at different time periods throughout the day may help identify time periods or trips that garner very little ridership. For example the last trip of the day may have very low productivity and bring down the performance of the entire route. Subsidy reduction If the subsidy per passenger is high one way to reduce it is to explore cost sharing partnerships with external funding sources. Examples include schools/colleges, large housing complexes, shopping centers, and places of employment. Another method is to work with local employment centers to coordinate the sale of passes with employee incentives. Discontinuation Discontinuation is the last option for dealing with a low-performing route and should only be implemented once other measures have been tried but the route is still under performing. A whole route or segment can be discontinued. Routes should not be discontinued until other remedial actions have been tried and the service has been monitored for at least sixth months and there is still no improvement on the route New Service Performance Evaluation Once a new route or service has been implemented, it should be monitored for an initial period to evaluate its performance. At the onset the route may not meet the benchmarks set forth for existing routes, but as the service becomes more popular it may. New services should be implemented for a period of at least one year in order to garner ridership and monitor monthly fluctuations. While minor changes such as timing can be made to the route within the initial period, large changes should be avoided. On-time data should be checked randomly to ensure that performance remains acceptable; a new service that has low on-time performance will have a difficult time attracting ridership. Approximately halfway through the initial period (6 months) a passenger survey of the route should be conducted to understand the effectiveness of the route. The route should continue to be monitored as a new route beyond one year if ridership has had continual growth. Once ridership has plateaued the route can be evaluated against the aforementioned benchmarks with the other routes. 7.7 Recommendation Profiles The following route profiles depict the proposed recommendation changes P age
134 Page intentionally left blank
135 Route 62 Proposed Route Alignment Changes in Current Route Alignment
136 Current Route Performance Route 62 Corporate Center Shu le Produc vity Route 62 System Average Daily Weekday Ridership Saturday Ridership N/A N/A Sunday Ridership N/A N/A Weekday passengers/hr Saturday passengers/hr N/A N/A Sunday passengers/hr N/A N/A Financials Route 62 System Average Farebox Recovery 3.1% 7.6% Weekday Subsidy per passenger $14.42 $10.93 Saturday Subsidy per passenger N/A N/A Sunday Subsidy per passenger N/A N/A Route Type: Fixed Route Route Ranking: N/A Proposed Service Changes Current Proposed Days Operated N/A M F Route Length N/A 4.4 miles Route Run Time N/A 19 min Peak Headway N/A 30 min Off Peak Headway N/A 60 min Saturday Headway N/A N/A Route Alignment Changes: This route will be a new route and will run from the Transit Center, Main, Newton, Fairview St W, Munson, Wisdom Way, Mill St. Sunday Headway N/A N/A Hours of Opera ons M F N/A 7:30 AM 5:30 PM Hours of Opera on Saturday N/A N/A Hours of Opera on Sunday N/A N/A Environmental Jus ce Policy: Unknown Phase 1: Consolidated 62/25 Phase 2: Implement Service 60 min peak/120 min off peak headway Phase 3: Implement Service 30 min peak/60 min off peak headway ADA Impact: Financial Phase 1 Phase 2 Phase 3 Annual Change in Revenue Hours Annual Change in Revenue Miles 8, ,900 +3,633 Es mate Change in Cost $33,000 +$87,000 +$29,000 Addi onal vehicle requirements: Capital Requirement: Other ne Other tes: Separa ng this route out will provide increased service to the industrial centers. There will be no impact to the ADA service as this route is currently covered by the Route 21.
137 Route 25/62 Proposed Route Alignment Changes in Current Route Alignment
138 Current Route Performance Route 25/62 GCC/Corporate Center Shu le Produc vity Route 25/62 System Average Daily Weekday Ridership N/A 78 Saturday Ridership N/A N/A Sunday Ridership N/A N/A Weekday passengers/hr N/A 8.5 Saturday passengers/hr N/A N/A Sunday passengers/hr N/A N/A Financials Route 25/62 System Average Farebox Recovery N/A 7.6% Weekday Subsidy per passenger N/A $10.93 Saturday Subsidy per passenger N/A N/A Sunday Subsidy per passenger N/A N/A Route Type: Fixed Route Route Ranking: New Route Recommenda ons Current Proposed Days Operated N/A M F Route Length N/A 7.5 Route Run Time N/A 40 min Peak Headway N/A 60 min Off Peak Headway N/A 60 min Saturday Headway N/A N/A Route Alignment Changes: New Route combines the 62 and 25, which used to be part of the 21. Sunday Headway N/A N/A Hours of Opera ons M F N/A 7:40 AM 5:40 PM Hours of Opera on Saturday N/A N/A Hours of Opera on Sunday N/A N/A Environmental Jus ce Policy: Unknown Phase 1: Implement service Phase 2: Discon nue service Phase 3: ne Financial Phase 1 Phase 2 Phase 3 Annual Change in Revenue Hours +1,385 1,385 0 Annual Change in Revenue Miles +18,725 18,725 0 Es mate Change in Cost +$149,000 $149,000 0 Addi onal vehicle requirements: Capital Requirement: Other ne ADA Impact: There will be no impact to the ADA service as this route is currently covered by the Route 21. Other tes: This route will be implemented with the changes in the route 21. The two routes will operate as one un l they can be broken out into separate routes with the procurement of addi onal vehicles.
139 Route 25 Proposed Route Alignment Changes in Current Route Alignment
140 Current Route Performance Route 25 GCC Shu le Produc vity Route 25 System Average Daily Weekday Ridership N/A N/A Saturday Ridership N/A N/A Sunday Ridership N/A N/A Weekday passengers/hr N/A N/A Saturday passengers/hr N/A N/A Sunday passengers/hr N/A N/A Financials Route 25 System Average Farebox Recovery N/A 7.6% Weekday Subsidy per passenger N/A $10.93 Saturday Subsidy per passenger N/A N/A Sunday Subsidy per passenger N/A N/A Route Type: Fixed Route Route Ranking: New Route Proposed Service Changes Current Proposed Days Operated N/A Mmon Sun Route Length N/A 5.58 miles Route Run Time N/A 25 min Peak Headway N/A 30 min Off Peak Headway N/A 30 min Saturday Headway N/A 60 min Route Alignment Changes: This route will be a new route. It will run from Transit Center, Main, Colrain St, College Dr., GCC, College, Colrain Rd, Mohawk Trail, Big Y, Mohawk Trail, and Main. Sunday Headway N/A 60 min Hours of Opera ons M F N/A 7:40 AM 5:40 PM Hours of Opera on Saturday N/A 9:00AM 5:00 PM Hours of Opera on Sunday N/A 9:00 AM 5:00 PM Environmental Jus ce Policy: Unknown Phase 1: ne Phase 2: Implement service 60 min frequency weekday Saturday service Phase 3: Improve frequency 30 min Sunday service ADA Impact: There will be impact to the ADA service, weekend service must be added. Financial Phase 1 Phase 2 Phase 3 Annual Change in Revenue Hours 0 +1,123 +1,123 Annual Change in Revenue Miles 0 +15, ,489 Es mate Change in Cost 0 +$123,000 +$123,000 Addi onal vehicle requirements: Capital Requirement: Other Other tes: ne Separa ng this route out will provide increased service to GCC and the shops along Route 2. It should be implemented once an addi onal vehicle can be procured. On the weekend it will not service GCC.
141 Route 41 Proposed Route Alignment Changes in Current Route Alignment
142 Current Route Performance Route 41 Charlemont/Greenfield Produc vity Route 41 System Average Daily Weekday Ridership Saturday Ridership N/A N/A Sunday Ridership N/A N/A Weekday passengers/hr Saturday passengers/hr N/A N/A Sunday passengers/hr N/A N/A Financials Route 41 System Average Farebox Recovery 5.1% 7.6% Weekday Subsidy per passenger $21.37 $10.93 Saturday Subsidy per passenger N/A N/A Sunday Subsidy per passenger N/A N/A Route Type: Fixed Route Route Ranking: 5/6 Proposed Service Changes Current Proposed Days Operated M F M F Route Length 47.5 miles 40.8 miles Route Run Time 115 min 95 min Peak Headway 150 min 150 min Off Peak Headway 150 min 150 min Saturday Headway N/A N/A Route Alignment Changes: This route will streamline rou ng. Sunday Headway N/A N/A Hours of Opera ons M F 6:45 AM 5:35 PM 6:45 AM 5:35 PM Hours of Opera on Saturday N/A N/A Hours of Opera on Sunday N/A N/A Environmental Jus ce Policy: Unknown Phase 1: Alignment change Phase 2: ne Phase 3: change Financial Phase 1 Phase 2 Phase 3 Annual Change in Revenue Hours Annual Change in Revenue Miles 7, Es mate Change in Cost $29, Addi onal vehicle requirements: Capital Requirement: Other ne ADA Impact: There will no impact. Other tes: Mohawk Regional High School will be serviced on select trips, when school is in session only.
143 Route 32 Proposed Route Alignment Changes in Current Route Alignment
144 Current Route Performance Route 32 Orange/Greenfield Produc vity Route 32 System Average Daily Weekday Ridership Saturday Ridership N/A N/A Sunday Ridership N/A N/A Weekday passengers/hr Saturday passengers/hr N/A N/A Sunday passengers/hr N/A N/A Financials Route 32 System Average Farebox Recovery 9.8% 7.6% Weekday Subsidy per passenger $9.74 $10.93 Saturday Subsidy per passenger N/A N/A Sunday Subsidy per passenger N/A N/A Route Type: Fixed Route Route Ranking: 4/6 Proposed Service Changes Current Proposed Days Operated M F M Su Route Length 47.8 miles 51.1 miles Route Run Time 120 min 120 min Peak Headway 120 min 60 min Off Peak Headway 120 min 60 min Saturday Headway N/A 120 min Route Alignment Changes: This route will service Industrial Blvd. on peak hour trips only, elsewise it will service Park Villa in Montague Sunday Headway N/A 120 min Hours of Opera ons M F 5 AM 6:22 PM 5 AM 7:30 PM Hours of Opera on Saturday N/A 8 AM 6 PM Hours of Opera on Sunday N/A 8 AM 6 PM Environmental Jus ce Policy: Unknown Phase 1: Adjust schedule mes to meet MART Add service to Industrial Blvd. Extend service to 7:30 PM 60 Minute Frequency Phase 2: Implement Saturday service Phase 3: Implement Sunday Service ADA Impact: Financial Phase 1 Phase 2 Phase 3 Annual Change in Revenue Hours +3, Annual Change in Revenue Miles +110, , ,286 Es mate Change in Cost +$404,000 +$65,000 +$65,000 Addi onal vehicle requirements: Capital Requirement: Other Other tes: ne This route will create med transfers with the MART G link at the Hannaford s in Orange. Transfer will be possible on every other trip. There will be a moderate impact with the addi on of weekend service.

145 Route 31 Changes in Current Route Alignment Proposed Route Alignment
146 Current Route Performance Route 31 rthampton/greenfield Produc vity Route 31 System Average Daily Weekday Ridership Saturday Ridership N/A N/A Sunday Ridership N/A N/A Weekday passengers/hr Saturday passengers/hr N/A N/A Sunday passengers/hr N/A N/A Financials Route 31 System Average Farebox Recovery 12.9% 7.6% Weekday Subsidy per passenger $7.21 $10.93 Saturday Subsidy per passenger N/A N/A Sunday Subsidy per passenger N/A N/A Route Type: Fixed Route Route Ranking: 2/6 Proposed Service Changes Current Proposed Days Operated M F M Su Route Length 47.6 mile 43 mile Route Run Time 113 min 90 min Peak Headway 120 Min 90 Min Off Peak Headway 120 Min 120 Min Saturday Headway N/A 120 min Sunday Headway N/A 120 min Hours of Opera ons M F 5:15 AM 6:15 PM 6:25 AM 7:25 PM Hours of Opera on Saturday N/A 8 AM 6 PM Hours of Opera on Sunday N/A 8 AM 6 PM Route Alignment Changes: In Phase 3 (weekdays) the route will end at the Walmart in rthampton with connec ons to the PVTA R 44. The 91E will provide service from Greenfield to rthampton. This can be used to improve the headway on Route 31 to 90 minutes or service Sugarloaf Estates in Sunderland, increasing connec ons to UMass. Environmental Jus ce Policy: Unknown Phase 1: 120 minute frequency Service span Time route to maximize transfers with the PVTA G 46 Phase 2: Add Saturday service Phase 3: Add Sunday Service Adjust alignment to terminate at the rthampton Walmart on weekdays ADA Impact: There will be a moderate impact with the addi on of weekend service. Financial Phase 1 Phase 2 Phase 3 Annual Change in Revenue Hours Annual Change in Revenue Miles +11, ,376 +8,293 Es mate Change in Cost +$75,000 +$53,000 +$52,000 Addi onal vehicle requirements: Capital Requirement: Other Other tes: ne The schedule has been designed to establish consistent frequencies and facilitate 4 transfers in Whately/South Deerfield to the G 46. The last trip will leave rthampton at 5:25 PM. This route will terminate at Walmart in rthampton when the 91E is established as an all day service.

147 Route 23 Proposed Route Alignment Changes in Current Route Alignment
148 Current Route Performance Route 23 Amherst Greenfield Produc vity Route 23 System Average Daily Weekday Ridership Saturday Ridership N/A N/A Sunday Ridership N/A N/A Weekday passengers/hr Saturday passengers/hr N/A N/A Sunday passengers/hr N/A N/A Financials Route 23 System Average Farebox Recovery 9.2% 7.6% Weekday Subsidy per passenger $18.16 $10.93 Saturday Subsidy per passenger N/A N/A Sunday Subsidy per passenger N/A N/A Route Type: Fixed Route Route Ranking: 6/6 Proposed Service Changes Current Proposed Days Operated M F M F Route Length 50.4 miles 41.6 miles Route Run Time 125 min 100 min Peak Headway 500 min 150 min Off Peak Headway 500 min 150 min Saturday Headway N/A N/A Route Alignment Changes: This route will be rerouted to Sunderland via RT 47 and terminate at Sugarloaf apartments to transfer with the PVTA P 31. Sunday Headway N/A N/A Hours of Opera ons M F 6:45 AM 4:10PM 6 :30AM 5:05 PM Hours of Opera on Saturday N/A N/A Hours of Opera on Sunday N/A N/A Environmental Jus ce Policy: Unknown Phase 1: New alignment Add trips Phase 2: ne Phase 3: ne Financial Phase 1 Phase 2 Phase 3 Annual Change in Revenue Hours Annual Change in Revenue Miles +16, Es mate Change in Cost +$74, Addi onal vehicle requirements: Capital Requirement: Other ne Other tes: ADA Impact: There will be minimal impact to ADA service, with the increase in trips. This will improve service to UMass with the addi on of trips. The trips will be med to arrive at Sugarloaf Apartments at 7:30 AM, 9:15 AM 3:00 PM and 5:35 in order to maximize transfers based on the P 31 reduced service schedule and university class schedule. The P 31, when school is in session, runs every 15 minutes. The P 31 is free to five college students, staff and faculty. We recommend renaming this route to UMass Connector.

149 Route 22
150 Current Route Performance Route 22 Montague/Greenfield Produc vity Route 22 System Average Daily Weekday Ridership Saturday Ridership N/A N/A Sunday Ridership N/A N/A Weekday passengers/hr Saturday passengers/hr N/A N/A Sunday passengers/hr N/A N/A Financials Route 22 System Average Farebox Recovery 8.7% 7.6% Weekday Subsidy per passenger $6.67 $10.93 Saturday Subsidy per passenger N/A N/A Sunday Subsidy per passenger N/A N/A Route Type: Fixed Route Route Ranking: 1/6 Proposed Service Changes Current Proposed Days Operated M F Combined with 32 Route Length 18.3 mile N/A Route Run Time 52 min N/A Peak Headway 60 min N/A Off Peak Headway varies N/A Saturday Headway N/A N/A Route Alignment Changes: This route has been discon nued and will be combined with Route 32. Sunday Headway N/A N/A Hours of Opera ons M F 6:15 AM 6:30 PM N/A Hours of Opera on Saturday N/A N/A Hours of Opera on Sunday N/A N/A Environmental Jus ce Policy: Unknown Phase 1: Eliminate Route Phase 2: ne Phase 3: ne Financial Phase 1 Phase 2 Phase 3 Annual Change in Revenue Hours 1, Annual Change in Revenue Miles 44, Es mate Change in Cost $201, Addi onal vehicle requirements: Capital Requirement: Other ne Other tes: ADA Impact: There will be no impact as this route duplicates other routes. While a strong performer this route parallels Route 32; by elimina ng this route service can be increased on the 32. There would be the same number of trips between Turners Falls and Greenfield but the headway would be consistent, improving service.
151 Route 21 Proposed Route Alignment Changes in Current Route Alignment
152 Current Route Performance Route 21 Greenfield Community Produc vity Route 21 System Average Daily Weekday Ridership Saturday Ridership N/A N/A Sunday Ridership N/A N/A Weekday passengers/hr Saturday passengers/hr N/A N/A Sunday passengers/hr N/A N/A Financials Route 21 System Average Farebox Recovery 5.3% 7.6% Weekday Subsidy per passenger $8.89 $10.93 Saturday Subsidy per passenger N/A N/A Sunday Subsidy per passenger N/A N/A Route Type: Fixed Route Route Ranking: 3/6 Proposed Service Changes Current Proposed Days Operated M F M Su Route Length 17.2 mile 9.7 mile Route Run Time 75 min 60 min Peak Headway 90 min 30 min Off Peak Headway 90 min 30 min Saturday Headway N/A 60 min Route Alignment Changes: This route has been split into three routes that meet at the transit center. Its new alignment has been streamlined and service will be bidirec onal. Sunday Headway N/A 60 min Hours of Opera ons M F 6:15 AM 6 PM 6 AM 7:30 PM Hours of Opera on Saturday N/A 8 AM 6 PM Hours of Opera on Sunday N/A 8 AM 6 PM Environmental Jus ce Policy: Unknown Phase 1: Split into three routes 60 minute frequency bidirec onal Extend service to 7:30 PM Phase 2: Add Saturday service Phase 3: Sunday Service 30 minute frequency weekday service ADA Impact: There will be a moderate impact with the addi on of weekend service. Financial Phase 1 Phase 2 Phase 3 Annual Change in Revenue Hours +2, ,760 Annual Change in Revenue Miles +23,840 +5, ,408 Es mate Change in Cost +$243,000 +$85,000 +$631,000 Addi onal vehicle requirements: Capital Requirement: Other Other tes: This route will have one vehicle circula ng in each direc on. Service to GCC and the industrial parks will be via separate routes. This recommenda on allows for increased service on the route.
153 Route 91E
154 Current Route Performance Route 91E rthampton Greenfield Express Produc vity Route 91E System Average Daily Weekday Ridership N/A N/A Saturday Ridership N/A N/A Sunday Ridership N/A N/A Weekday passengers/hr N/A N/A Saturday passengers/hr N/A N/A Sunday passengers/hr N/A N/A Financials Route 91E System Average Farebox Recovery N/A 7.6% Weekday Subsidy per passenger N/A $10.93 Saturday Subsidy per passenger N/A N/A Sunday Subsidy per passenger N/A N/A Route Type: Express Route Route Ranking: New Route Proposed Service Changes Current Proposed Days Operated N/A M F Route Length N/A 42.5 miles Route Run Time N/A 85 min Peak Headway N/A 60 min Off Peak Headway N/A 60 min Saturday Headway N/A N/A Route Alignment Changes: New route Express service from John Olver Transit Center to rthampton via I 91, stops at Whately P&R. Sunday Headway N/A N/A Hours of Opera ons M F N/A 7:40 AM 5:30 PM Hours of Opera on Saturday N/A N/A Hours of Opera on Sunday N/A N/A Environmental Jus ce Policy: Unknown Phase 1: ne Phase 2: Implement service during peak hours only Phase 3: Implement 60 minute frequency 7:40 AM to 5:40 PM span ADA Impact: Financial Phase 1 Phase 2 Phase 3 Annual Change in Revenue Hours 0 +1,417 +2,125 Annual Change in Revenue Miles 0 +42, ,750 Es mate Change in Cost 0 +$155,000 +$233,000 Addi onal vehicle requirements: Capital Requirement: Other Other tes: ne To begin this route will run during the peak hours only. Once service has been established, if ridership con nues to grow, service can be expanded to all day. Express services do not require complementary ADA service. impact.
155 Chapter 8 Conclusion Burke & Company
156 8. CONCLUSION Recommendations were developed using a cumulative process that incorporated public outreach, a diverse steering committee, operational input from FRTA, an analysis of existing transit service and the local/regional market. Strategies to improve the system were developed based on the goals and objectives outlined in Chapter 2. The proposed recommendations will help improve mobility in the region, and improve service efficiency. The three phase approach allows FRTA to plan for future service and seek the necessary funding and equipment that would be needed. Phase 1 would require a significant increase in funding of 56.8% in order to add evening service, standardize frequencies, and coordinate transfers with adjoining MART and PVTA services. This large increase in funding needed is largely due to the small operating budget FRTA currently has, thus any increase is magnified. Phases 2 and 3 would require more funding (Table 24) and additional vehicles as well. Phase 2 would add Saturday service, improve frequencies, and express service. Phase 3 would implement Sunday service and increase express service. These improvements would help FRTA achieve their goals of providing high-quality, customer-oriented service, providing effective and safe services, and promoting the transit service. Table 24: Phase Requirements Phase Additional funding New cost of service Percent increase from previous needed Phase 1 $682,000 $1,822, % Phase 2 $420,000 $2,302, % Phase 3 $1,133,000 $3,435, % Total $2,235,000 N/A 186.3% Service guidelines have been established to monitor service in the future with performance measures to evaluate a route s health. Recommended performance measures to monitor existing and future routes include: Passengers/Hour: Number of total monthly and annual passengers divided by the corresponding revenue-hours. Subsidy/Passenger: Total expenses minus fare revenue divided by ridership. Farebox Recovery: The percentage of operating costs covered by fares collected, calculated by the fares collected divided by the cost to operate the route. Cost/Revenue-Hour: An excellent indicator of efficiency is cost per revenue-hour of service. Costs per hour should be analyzed by route and compared to overall system averages. 8-1 P age
157 Late Trips: The percentage of fixed-route trips which operate late or are missed should be recorded and reported. The recommended standard for late trips is any trip that is more than five minutes behind schedule. Service/Road Calls: the number of service/road calls divided by the number of revenue miles. This measure is typically measured for the entire system and not individual routes. This monitors routine maintenance and vehicle performance. Accidents/100,000 miles: Measure of driver safety. There must be a standard practice for defining what an accident is. The performance measures can be used to create benchmarks for FRTA service operation. These benchmarks will help FRTA track progress and set goals for the performance of the route. They will also assist FRTA in measuring the impact of the proposed recommendations on service. The recommendations include later night service, weekend service, express service, improved frequencies, and clockface schedules (Table 25). Route 21 Greenfield Community Route Table 25: Summary of Recommendations Bus Route Alignment Schedule Current route split into three routes: 21, 25, 62. Shift service to GCC and Corporate Center on separate routes, bidirectional service. Route 22 Montague/Greenfield Route 23 Amherst/Greenfield Route 31 Greenfield/rthampton Route 32 Orange/Greenfield Discontinue, combine with 32 Reroute to Sunderland via RT-47, terminate at Sugarloaf apartments to transfer with the PVTA P-31 Terminate at Walmart in rthampton (weekdays only) when the 91E is established as an all day service Service Industrial Blvd. on peak hour trips only -60/30 minute bidirectional service -Extend weekday service to 7:30 PM -New weekend service - service -2 daily trips added -120/90 minute frequency -Service span 6:25 AM to 7:25 PM -New weekend service -Time route to maximize transfers with the PVTA G-46 -Adjust schedule times to meet MART -Extend service to 7:30 PM -60 Minute Frequency -New weekend service Route 41 Charlemont/Greenfield Route 25/62 Combined Streamline routing; Service Mohawk regional HS on select trips when school is in session only New Route Combines the 62 and minute frequency -Service span 7:40 AM-5:40 PM 8-2 P age
158 Bus Route Alignment Schedule New Route - Run from Transit Center, Main, Newton, Fairview St W, Munson, Wisdom Way, Mill St Route 62 Corporate Center Shuttle Route 25 GCC Shuttle Route 91E rthampton - Greenfield Express New Route - Run from Transit Center, Main, Colrain St, College Dr., GCC, College, Colrain Rd, Mohawk Trail, Big Y, Mohawk Trail, Main New route - Express service from JWO Transit Center to rthampton via I-91, stops at Whately P&R -60 peak/120 off-peak frequencies -30 peak/60 off-peak frequencies -Service span 7:30 AM to 5:30 PM - Weekday 60 min frequency 7:40 AM-5:40 PM -30 minute frequency - Saturday 60 min frequency 9 AM 5 PM - Sunday 60 min frequency 9 AM 5 PM -60 minute frequency -Service span 7:40 AM-5:40 PM 8-3 P age
159 Appendix A Market Demand Maps
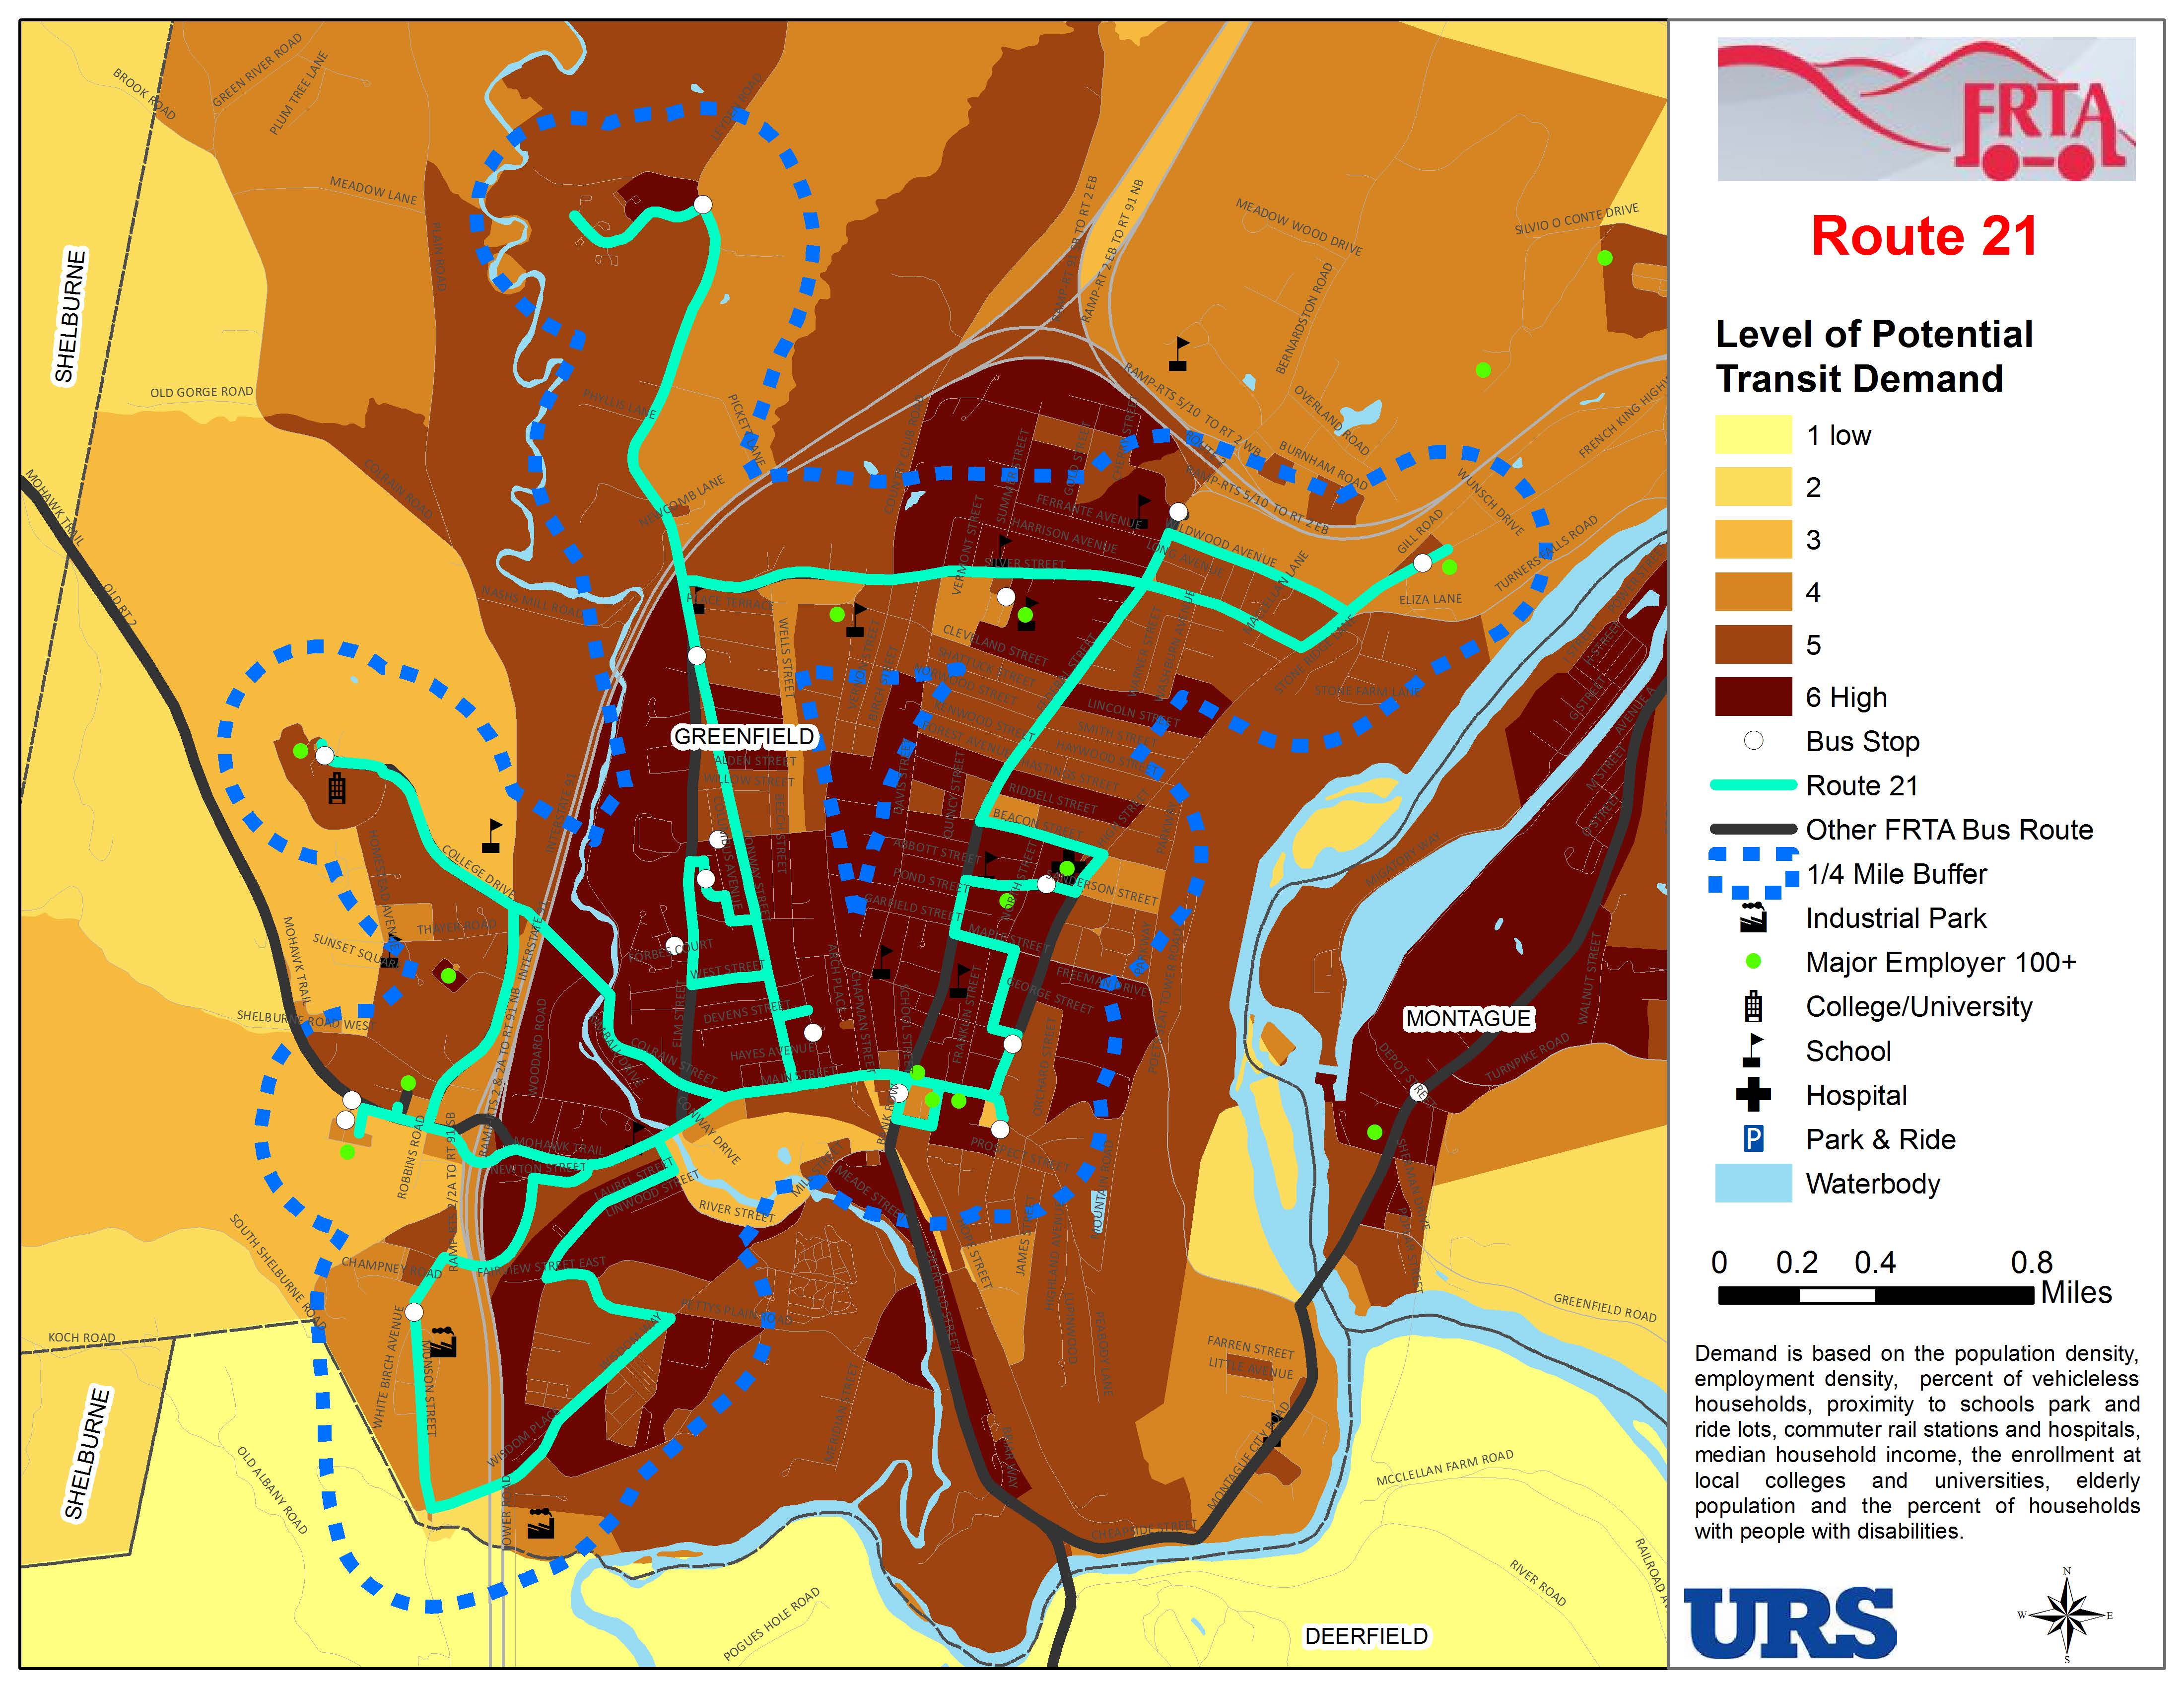
160

161
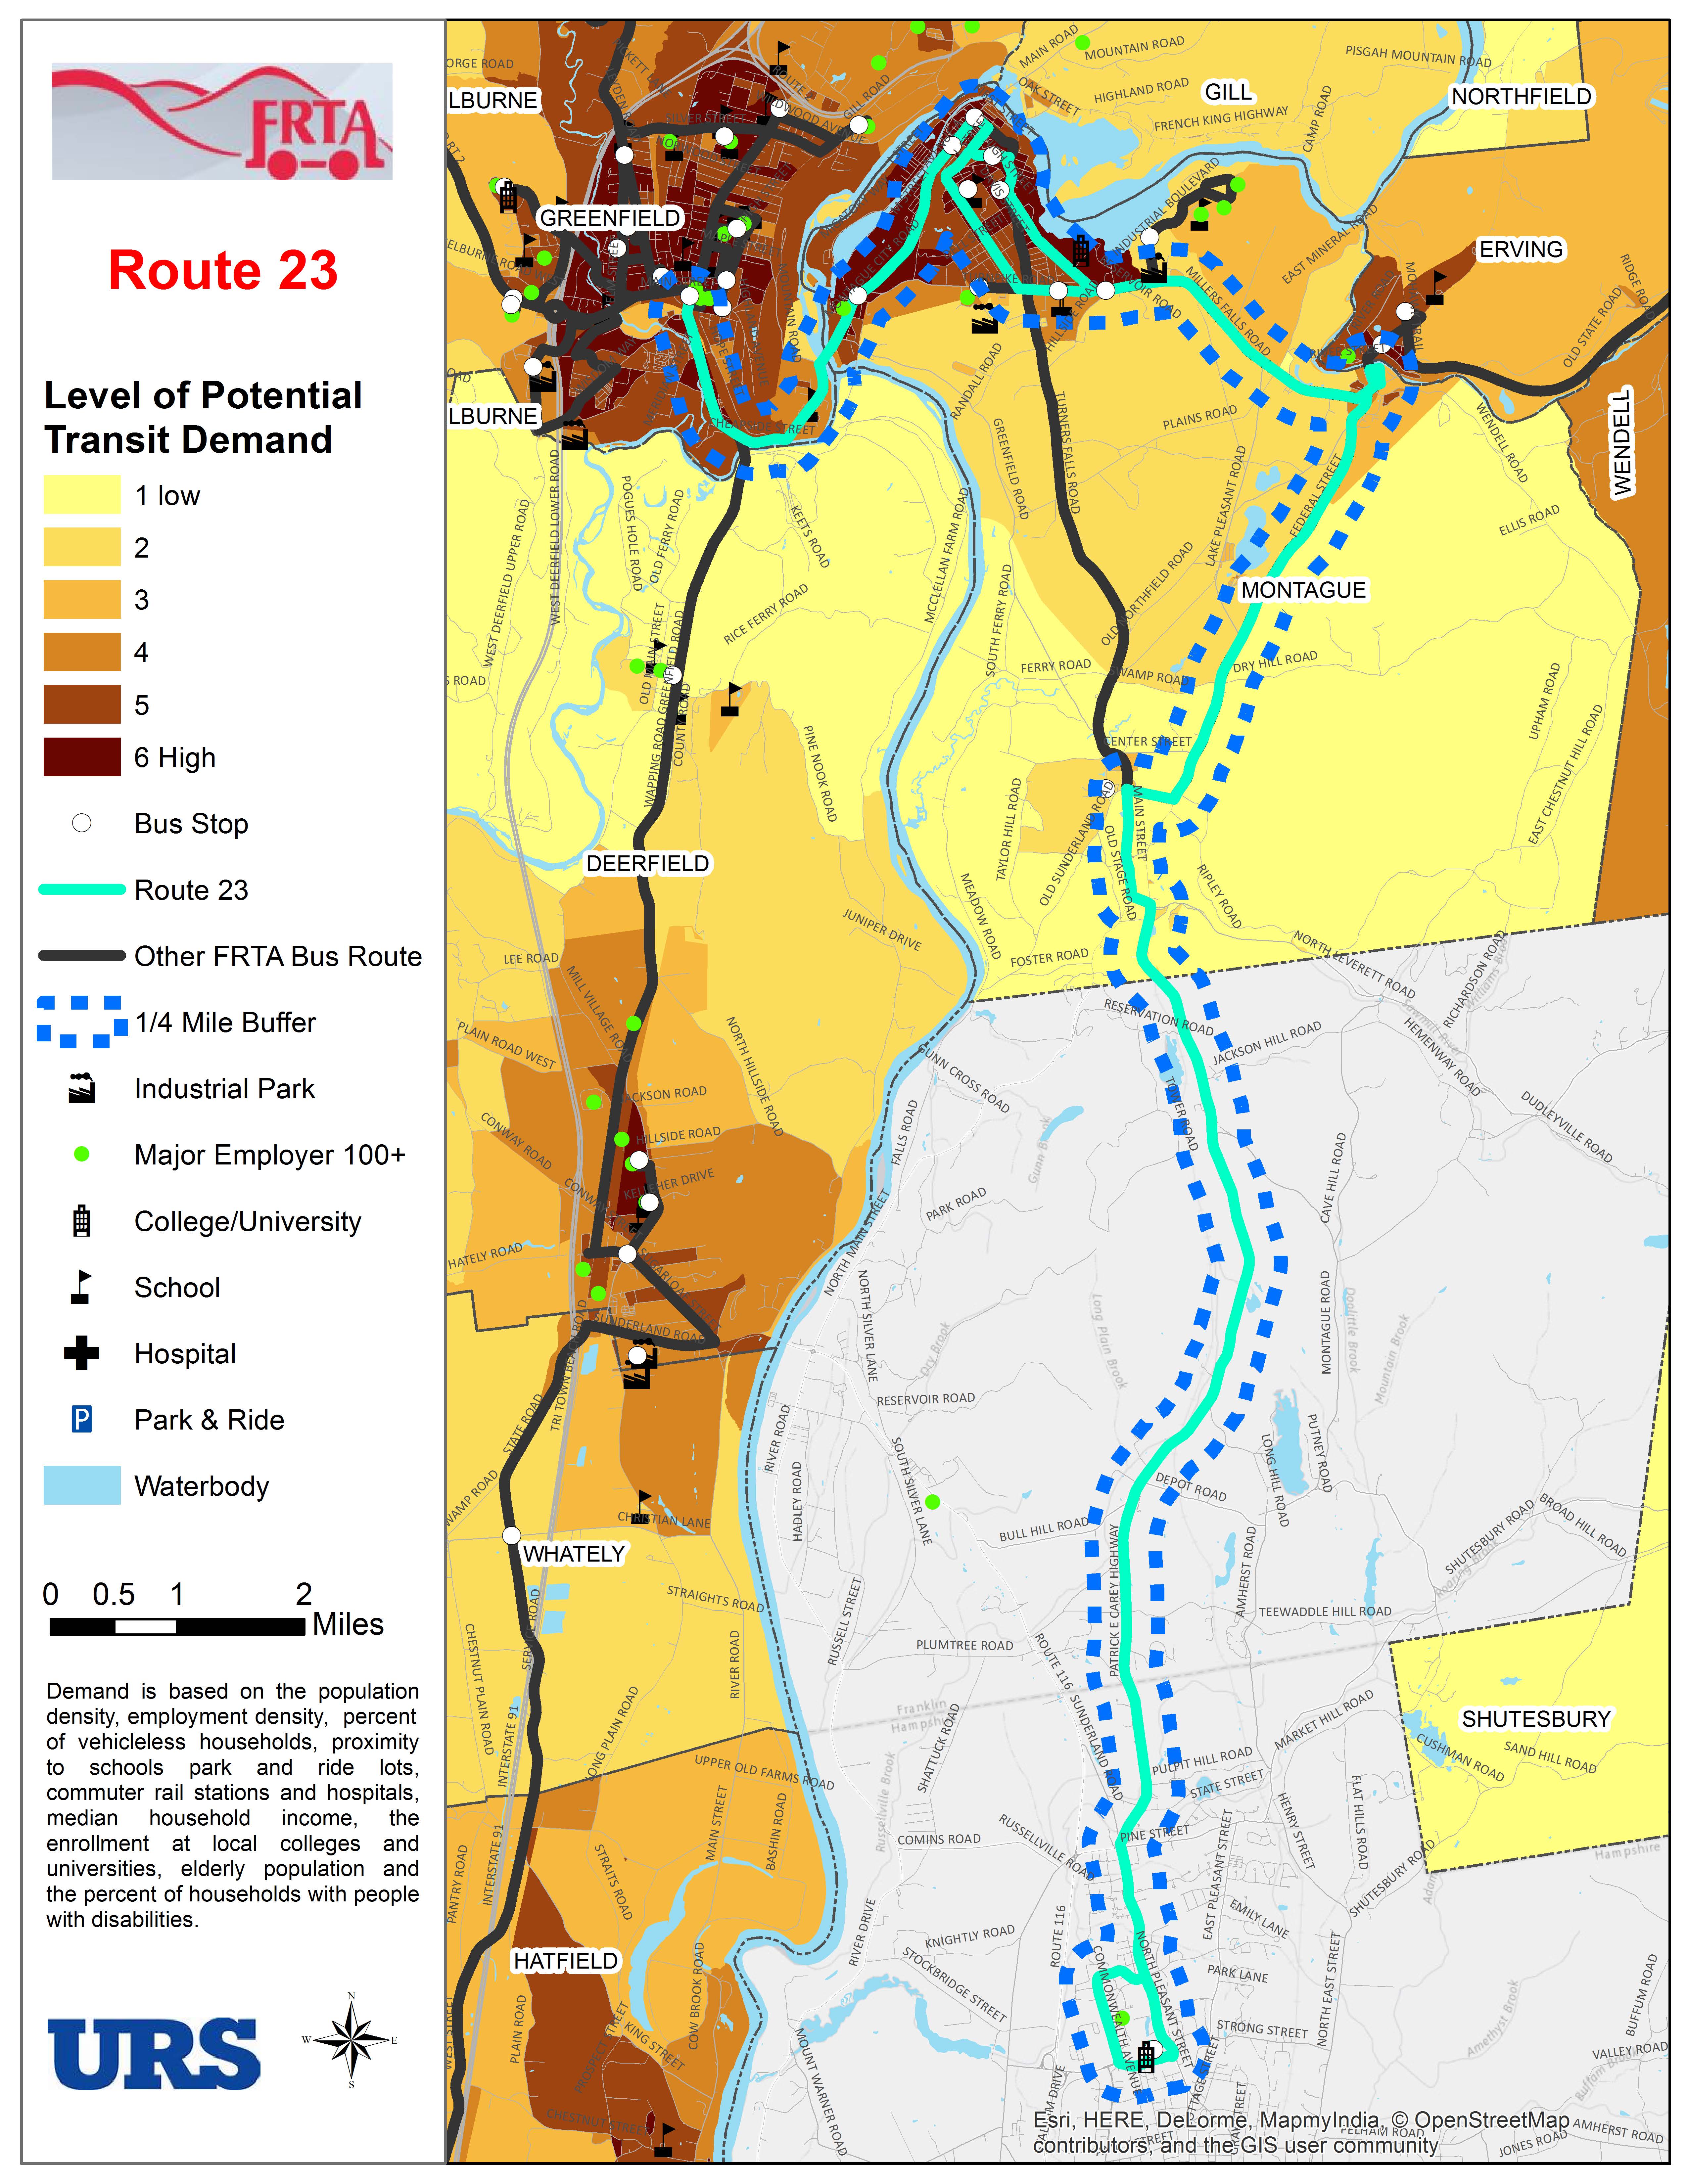
162
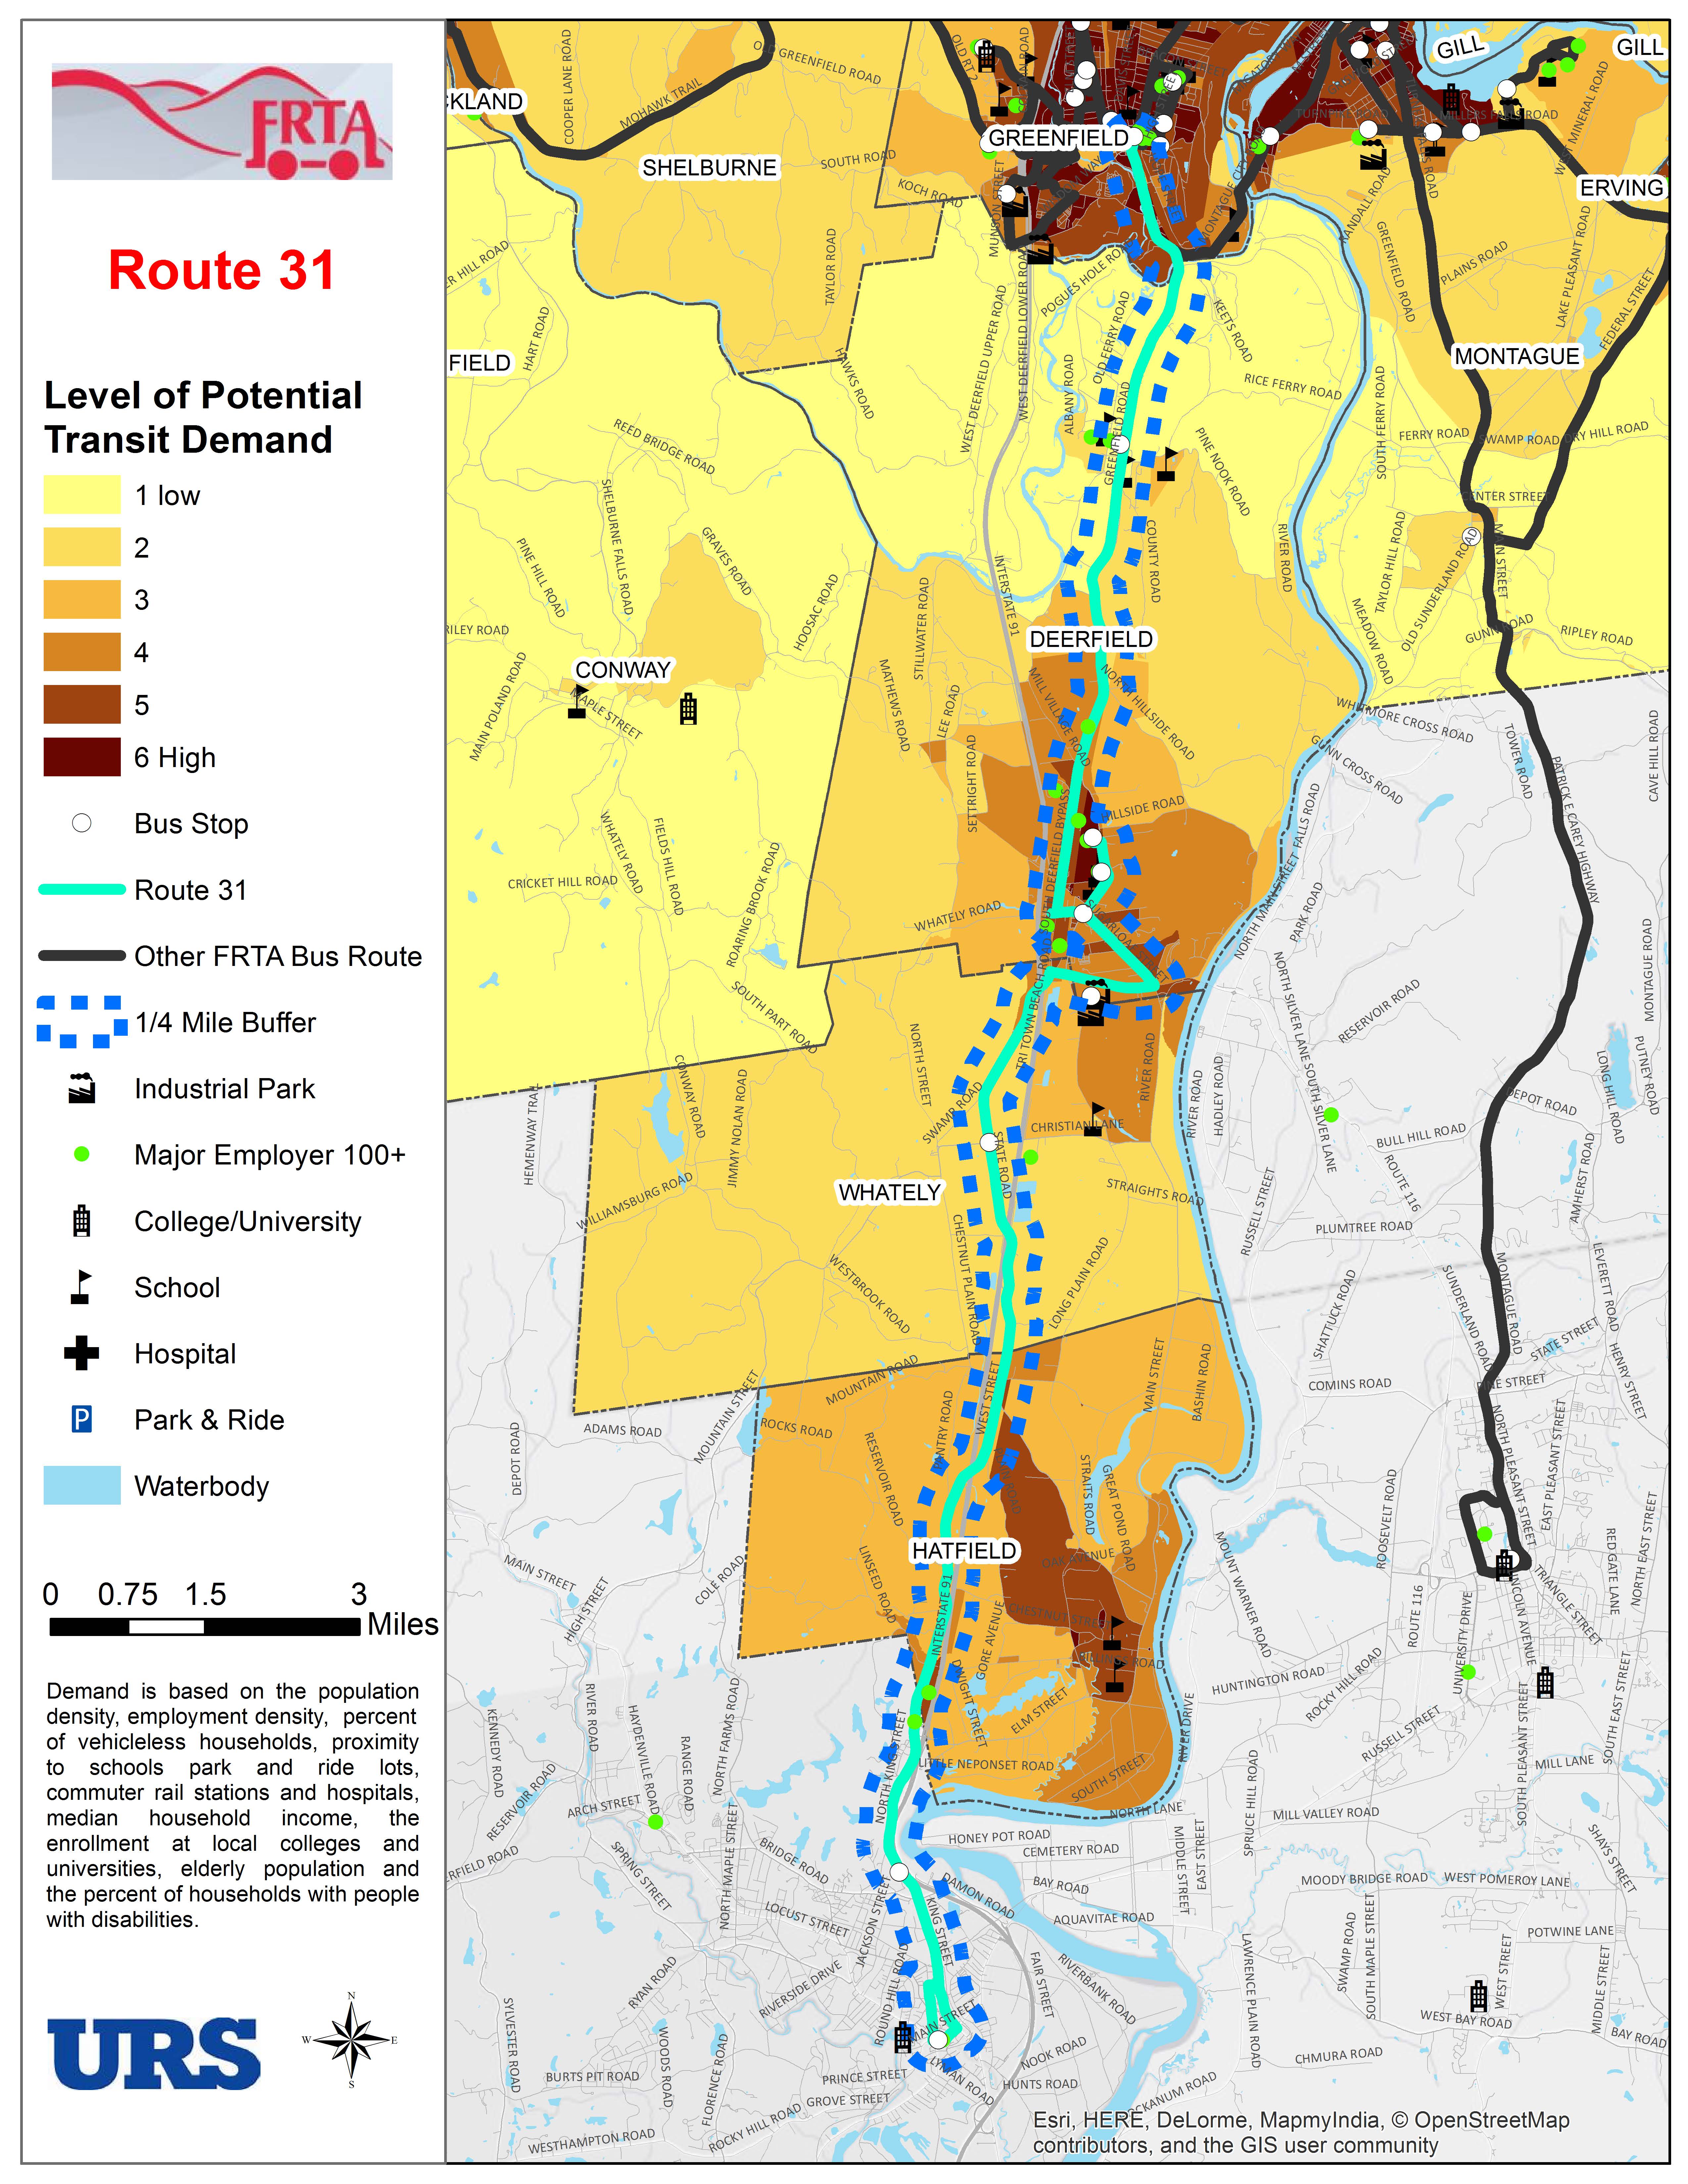
163

164

165
166 Page intentionally left blank
167 Appendix B Recommendation Memo
168 MEMORANDUM Client: Franklin Regional Transit Authority Project Name: Comprehensive Service Assessment Issue Date: January 21, 2015 To: Tina Cote and FRTA From: Stephen Gazillo, URS Corporation FRTA Comprehensive Service Assessment Recommendations The following outlines the recommendations and alternatives to improve service for FRTA based on the comments received from the vember 2014 workshop. Opportunities were identified to improve connectivity, streamline service, and add service. A table can be found at the end which outlines all recommendations by route, additional information and maps have been provided for select routes. Recommendation Changes, December 2014 Route 21 The current route 21 was split into three routes (21, 25, and 62) in order to provide more direct service, simplify schedules and add service. Service to the industrial park area, Shopping along Rt 2 and GCC will be available on routes 25 and 26. The new 21 will operate as a bidirectional community circulator in Greenfield along major corridors, deviations have been eliminated and a flex system should be explored in Phase 3 when integration of fixed route and paratransit software is available. Streamlining the service will allow for the route to operate more frequently. Information on Flex Routing (Route 21 Greenfield Community Circulator): Operates every 60 minutes on new loop through Greenfield with one vehicle circulating in each direction Regular fare for customers boarding along the regular route Additional fare for deviations; fare set at twice local fare Deviation reservations would need to be made in advance via phone 1 day prior Set maximum number of deviations at 1 or 2 per trip to ensure schedule kept Can be used to cover ADA service as well 500 Enterprise Drive, Suite 3B Rocky Hill, CT (860) Fax (860)
 529-8882 Fax (860)")
169 MEMORANDUM Route 21 Proposed Route Proposed Route Extension Upcharge Current Route Other FRTA routes- Current Flex Zone 500 Enterprise Drive, Suite 3B Rocky Hill, CT (860) Fax (860)
 529-8882 Fax (860)")
170 MEMORANDUM Route 21 Phase 3 Proposed Route Proposed Route Extension Upcharge Current Route Other FRTA routes- Current Flex Zone 500 Enterprise Drive, Suite 3B Rocky Hill, CT (860) Fax (860)
171 MEMORANDUM Route 22 This route has been eliminated due to redundancy with the route 32. The resources have been combined with the 32 to improve service along that route. Route 23 The alignment has changed and the new route will terminate at Sugarloaf Apartments in Sunderland to allow for transfers to and from the PVTA P-31 which operates on 15 minute headways during full service and 35 min during reduced. This allows for the addition of 2 trips. The travel time from Greenfield to UMass with transferring would be minutes depending on the wait time for the transfer. In order to maximize transfers based on the P-31 reduced service schedule and the university class schedule we recommend the route arrive at Sugarloaf apartments at 7:30 AM, 9:15 AM, 3 PM and 5 PM Route 23 Proposed Route Proposed Route Extension Upcharge Current Route Other FRTA routes- Current Flex Zone 500 Enterprise Drive, Suite 3B Rocky Hill, CT (860) Fax (860)
172 MEMORANDUM Route 31 We recommend establishing consistent 120 minute frequencies with the schedule designed to maximize transfers to and from the PVTA G-46 (3 UMass to Greenfield and 1 Greenfield to UMass connections). Heading to UMass the transfers can be made at the Whately Park and Ride and heading to Greenfield the transfers can be made in South Deerfield Center. The timing of the schedule will need to be adjusted so that the first trip leaves at 6:25 from Greenfield which is 50 minutes later than it currently does and the last trip leaving rthampton at 5:25 would leave 50 minutes earlier than it currently does. We also recommend keeping Route 31 to rthampton until the express route is introduced, and to phase in express route as peak only first to gauge ridership demand, then extend to all day if needed and terminate Route 31 at Walmart in rthampton. UMass G -46 South Deerfield G-46 South Deerfield 31 Greenfield 31 7:45 AM 8:00 AM 8:05 AM 8:25 AM 1:45 PM 2:00 PM 2:05 PM 2:25 PM 5:40 PM 5:55 PM 6:05 PM 6:25 PM Greenfield 31 Whately 31 Whately G-46 UMass G -46 4:25 PM 4:50 PM 4:55 PM 5:10 PM Route 32 Frequency is improved to a consistent 60 minute headway. Service to the industrial center will be on select peak trips only; during off-peak hours the center will only be served by request. Timing should be adjusted to meet the MART G-link at the Hannaford s in Orange. Transfers will be possible on every other trip. MART FRTA Hannaford s Arrive 0:40 Arrive 0:55 FRTA MART Hannaford s Arrive 0:55 Arrive 0: Enterprise Drive, Suite 3B Rocky Hill, CT (860) Fax (860)

173 MEMORANDUM Route 32 Proposed Route Proposed Route Extension Upcharge Current Route Other FRTA routes- Current Flex Zone Route 41 The alignment for this route has been simplified in Greenfield and Shelburne Falls. While there are weight and height restrictions (10 9 and 12 tons) on the Bridge St bridge in Shelburne Falls the bridge is not listed as structurally deficient and a typical Mini-bus meets these requirements. The deviation to Mohawk regional school should be eliminated when school is not in session. In phase 3 extension to Berkshire East should be explored. 500 Enterprise Drive, Suite 3B Rocky Hill, CT (860) Fax (860)
 529-8882 Fax (860)")
174 MEMORANDUM Route 41 Greenfield Berkshire East Phase 3 Shelburne Falls Proposed Route Proposed Route Extension Upcharge Current Route Other FRTA routes- Current Flex Zone 500 Enterprise Drive, Suite 3B Rocky Hill, CT (860) Fax (860)
 529-8882 Fax (860)")
175 MEMORANDUM Route 25/62 Combination This route should operate as a combination route until funding can be obtained to procure an additional vehicle and operate the two routes separately. Route 25/62 Proposed Route Proposed Route Extension Upcharge Current Route Other FRTA routes- Current Flex Zone 500 Enterprise Drive, Suite 3B Rocky Hill, CT (860) Fax (860)

176 MEMORANDUM Route 62 This route should operate when funding can be obtained to procure an additional vehicle and operate the two routes separately. At that time the 25/62 can be discontinued. Route 62 Proposed Route Proposed Route Extension Upcharge Current Route Other FRTA routes- Current Flex Zone Route 25 This route should operate when funding can be obtained to procure an additional vehicle and operate the two routes separately. At that time the 25/62 can be discontinued. Proposed Route Proposed Route Extension Upcharge Current Route Other FRTA routes- Current Flex Zone Route Enterprise Drive, Suite 3B Rocky Hill, CT (860) Fax (860)
177 MEMORANDUM Route 91E The route should be phased as peak only first to gauge ridership demand, then extend to all day if needed and terminate Route 31 at Walmart in rthampton. Proposed Route Proposed Route Extension Upcharge Current Route Other FRTA routes- Current Flex Zone Route 91E 500 Enterprise Drive, Suite 3B Rocky Hill, CT (860) Fax (860)
178 MEMORANDUM Other Southwick and Southampton are too far out from the bus facility to serve with FRTA vehicles; should coordinate with PVTA or contract with another operator to provide service in these communities. A flex zone service may work best until travel patterns can be established. Operational Impacts Phase Weekday Peak Vehicles Annual Revenue Hours Annual Revenue Miles Existing 8 14, ,864 Phase , ,525 Phase , ,149 Phase , , Enterprise Drive, Suite 3B Rocky Hill, CT (860) Fax (860)
179 MEMORANDUM Bus Route Proposed Changes Alignment Schedule Phase 1 Phase 2 Phase 3 Route 21 Greenfield Community Route Yes Current route split into three routes: 21, 25, 62. Realign to remove some deviations, shift service to GCC and Corporate Center on separate routes, bidirectional service. flex on request for additional fee in later phase -60/30 minute bidirectional service -Extend weekday service to 7:30 PM -New weekend service -Split into three routes -60 minute frequency bidirectional -Extend service to 7:30 PM Route 22 Montague/Greenfield Yes Discontinue, combine with 32 - service -Eliminate route Route 23 Amherst/Greenfield Yes Reroute to Sunderland via RT-47, terminate at Sugarloaf apartments to transfer with the PVTA P-31-2 daily trips added -New alignment -Add trips -Saturday service -Sunday Service -30 minute frequency weekday service - Flex service implmented Route 31 Greenfield/rthampton Yes Terminate at Walmart in rthampton when the 91E is established as an all day service -120/90 minute frequency -Service span 6:25 AM to 5:25 PM -New weekend service -Time route to maximize transfers with the PVTA G minute frequency -Service span -Time route to maximize transfers with the PVTA G- 46 -Saturday service -Sunday Service -Adjust alignment to terminate at the rthampton Walmart Route 32 Orange/Greenfield Yes Service Industrial Blvd. on peak hour trips only -Adjust schedule times to meet MART -Extend service to 7:30 PM -60 Minute Frequency -New weekend service -Adjust schedule times to meet MART -Add service to Industrial Blvd. -Extend service to 7:30 PM -60 Minute Frequency -Saturday service -Sunday Service Route 41 Charlemont/Greenfield Yes Extend to Berkshire East; streamline routing through Shelburne Falls using the Bridge St bridge; Service Mohawk regional HS on select trips when school is in session only -Service span 6:45 AM to 6:45 PM -Streamline route, Service Mohawk HS in session only -Extend to Berkshire East Route 25/62 Combined Yes New Route Combines the 62 and minute frequency -Service span 7:40 AM-5:40 PM Route 62 Corporate Center Shuttle Yes New Route - Run from Transit Center, Main, Newton, Fairview St W, Munson, Wisdom Way, Mill St -30 peak/120 off-peak frequencies -Service span 7:30 AM to 5:30 PM -Implement service -Discontinue service -Implement service Route 25 GCC Shuttle Yes New Route - Run from Transit Center, Main, Colrain St, College Dr., GCC, College, Colrain Rd, Mohawk Trail, Big Y, Mohawk Trail, Main -30 minute frequency -Service span 7:40 AM-5:40 PM -Implement service Route 91E rthampton - Greenfield Express Yes New route - Express service from John Olver Transit Center to rthampton via I-91, stops at Whately P&R -60 minute frequency -Service span 7:40 AM-5:40 PM -Implement service during peak hours only -60 minute frequency 7:40 AM to 5:40 PM span 500 Enterprise Drive, Suite 3B Rocky Hill, CT (860) Fax (860)
180
181 Appendix C Public Outreach
182 PUBLIC OUTREACH One of the primary goals of the Regional Transit Plan (RTP) was to identify alternatives and recommendations that would result in improvements to the system for existing riders and potentially attract new riders. In order to meet the needs of the riders, FRTA reached out to the public through a series of Community Conversations and a survey in order to better understand what the public s transit needs and priorities are. The public input received from these efforts helped form the goals of the Regional Transit Plan, guide the alternative service scenarios to be examined, and prioritize FRTA service strategies. In addition FRTA formed a Study Advisory Committee. This committee represented key stakeholder groups within the community and provided review and comment on chapters of the document as they were produced. Study Advisory Committee As dictated by the Transportation Finance Bill, FRTA has formed and supported the development of a Study Advisory Committee (SAC) to guide the development of this plan. Its members include local employers and business members, the regional planning agency, labor organizations, transit riders and others. A complete list of committee members organization/group represented on the SAC can be found in Table 1 and comments submitted by SAC members can be found at the end of the document. Table 1 Study Advisory Committee Members Organization Franklin Regional Council of Governments An operator from the Management Company, Franklin Transit Management Franklin Medical Center/Baystate Health A management person from Franklin Transit Management Franklin Hampshire Career Center Community Action A transit rider/advocate of public transit/member of our Transit Advisory Committee Over the course of the study the committee has met xx times to discuss the development of the plan in addition to reviewing each chapter and providing feedback. The times, dates and locations of these meetings can be found in Table 2. Table 2. Study Advisory Committee Meetings Date Location 4/28/2014 JWO Transit Center 10/15/2014 JWO Transit Center 4/6/2015 JWO Transit Center 6/25/2015 JWO Transit Center 1 P age
183 Public Involvement For the public outreach effort, the FRTA partnered with the Franklin Regional Council of Governments (FRCOG) to conduct a series of Community Conversations. The timing of FRTA s Comprehensive Service Analysis coincides with the FRCOG s update to its Regional Transportation Plan. The FRCOG began updating this Plan in the Fall of 2014 and examined all modes of transportation, including transit. The Comprehensive Service Analysis focused solely on fixed route services. However, the FRCOG Regional Transportation Plan will be able to complement this by examining and making planning recommendations regarding the remainder of FRTA s service the demand response/paratransit services. The FRTA and FRCOG created a series of public forums called Community Conversations to gather public input on the future of transit in the region. These Community Conversations were designed to be informative, educational, and interactive for participants. Four Community Conversations were held throughout the region at fully accessible locations on fixed bus routes to facilitate attendance. In addition, they were held at times that coincided with the bus schedule to make it easier for transit riders to attend and provide input. The dates and times of the locations were: Monday, May 12 - Turners Falls, Great Falls Discovery Center, 4-6pm Wednesday, May 14 Greenfield, John W. Olver Transit Center, 12:30-2:30pm Monday, May 19 Shelburne Falls, Shelburne-Buckland Community Center, 3-5pm Tuesday, May 20 Orange, Orange Amory, 3-5pm An additional Community Conversation was held in July at the Greenfield Farmer s Market to further expand the outreach efforts. Volunteers have also come forward to conduct on-board surveys of transit riders to make sure that feedback from riders is fully captured. The format of the Community Conversations was designed to be interactive with multiple ways in which people could provide their thoughts on transit. At the beginning of each of the events, a PowerPoint presentation was given that provided: 1) an overview of the FRTA and its services; 2) what the Comprehensive Service Analysis was and why it mattered; 3) and interactive polling questions that asked the participants about themselves and their current/potential use of transit. After the short presentation, the participants had the opportunity to have an open conversation with each other and FRTA/FRCOG staff about public transit. Following this conversation, participants were asked to make their way around the room at their own pace and stop at the several stations set up in which participants could give feedback on different topics. These topics included short term priorities, long term desires, important destinations/routes, and what public transit means to them. In addition, surveys and comment boxes were placed throughout the room for people to provide more specific information. FRTA and FRCOG staff were also available for participants to speak with, ask questions, and provide their input on the current and future state of transit in the region. 2 P age

184 To reach as many and diverse members of the public as possible, the FRTA and FRCOG prepared an outreach strategy to let people know about the upcoming Community Conversations. This strategy included radio ads on local radio stations advertising the time and locations of the forums. Press releases were sent to all local newspapers. There were several prominent articles in the Greenfield Recorder discussing the public forums. Targeted mailings were also sent to a large and diverse group of regional stakeholders, including: social service groups, elected representatives, environmental groups, housing authorities, senior centers, municipal officials, chambers of commerce, and more. Flyers were posted on all buses, in the John W. Olver Transit Center, and in key locations throughout the region, such as popular stores. In addition, information about the events were posted on the FRTA and FRCOG Facebook pages and widely shared and liked by other organizations Facebook pages. Finally, word-of-mouth was employed as FRTA and FRCOG staff met with the various groups from the region in their day-to-day business. Almost 60 people attended the Community Conversations. Through the electronic polling questions conducted in the PowerPoint presentation, the FRTA/FRCOG staff know that most of the participants were working age (61% were aged years old) and that almost half (48%) of the participants have never used the Figure 1, Participants letting FRTA know what public transit means to them. FRTA public transit system. The Appendix contains more detailed information about the age and frequency of transit use of the participants. Summary of Feedback The feedback provided by participants at the Community Conversations was very constructive and informative. Summarized below is the input received at each of the stations at the forums. Overwhelmingly, participants support an expanded transit system that has greater frequency of service, weekend service, and evening service. What Public Transit Means to Me At this station, forum participants were asked to write down on sticky notes what they felt public transit means to them. The goal of this station was to understand the needs of people interested in transit. For example, do many people use transit because they have no other transportation alternatives or do they use it because they choose to do so for environmental reasons? The responses can be grouped into the following 3 general categories: 3 P age
 Is necessary for survival/work (24%) 2) Helps the environment (37%) 3) Provides travel options (39%) These results indicate that many people depend on FRTA s fixed route system for their basic")
185 Public transit.. 1) Is necessary for survival/work (24%) 2) Helps the environment (37%) 3) Provides travel options (39%) These results indicate that many people depend on FRTA s fixed route system for their basic daily needs. But some participants also have their own vehicle and are interested in transit for the additional options that it provides them and the benefit to the environment it allows by reducing carbon emissions. Short Term Priorities At this station, participants were presented with a large poster listing 10 actions that the FRTA could take with little or no increase in funding in the short term (as defined immediately or in the next several years). Participants were asked to identify which of these actions would be their top 4 priorities. The top recommendation was that FRTA should add more direct, short shuttle trips to specific destinations. This was closely followed by providing more connections with PVTA bus routes and offering various pass options. Table 1 below shows in detail the ranking of the priorities by the participants at the Community Conversations. Figure 2. Participants voting for short term priorities for FRTA. Table 3. Ranking of Short Term Priorities for FRTA Rank Short Term Priorities Count Percent 1 Add more short, direct shuttle trips (to GCC, hospital, grocery stores, attractions) 42 21% 2 Offer day, monthly, & student pass options 35 18% 3 Provide more connections with PVTA bus service 35 18% 4 Add bus shelter amenities (bike racks, lights, trash cans) 26 13% 5 Improve marketing of bus services 24 12% 6 Improve customer service and communication with bus riders 15 8% 7 Staff the ticket and information booth in the Transit Center lobby 6 3% 8 Improve the bus schedules to make them easier to read 6 3% 9 Add WiFi access on buses 4 2% 10 Re-design and enhance the FRTA website 4 2% 4 P age
186 Transportation Hot Spots Another of the interactive stations at the Community Conversations was geared towards finding out where people live and where they go. This would help inform the FRTA as to whether they are currently serving popular destinations, and if not, where there could be additional opportunities to serve with the goal of increasing ridership. Specifically, participants were asked to place little dot stickers on a large map of the greater Franklin County region showing generally where they live and their most common destinations. The attached Map in the Appendix depicts the locations of the most popular origins and destinations for participants. Most participants live in/or originate in the towns of Greenfield, Shelburne Falls, and Montague. The most popular destinations varied widely across Western Massachusetts and even extended to Boston, New Hampshire (Keene), and Vermont (Brattleboro). The Table below shows the top destinations. Table 4. Top Destinations of Community Conversation Participants Rank Overall Top Destinations Count Percent 1 Greenfield - downtown 31 69% 2 rthampton 28 62% 3 Amherst 25 56% 4 Greenfield - west of I % 5 Ashfield 12 27% 6 Montague - Turners Falls 11 24% 7 Holyoke 10 22% 8 Brattleboro VT 9 20% 8 Charlemont 9 20% 8 Shelburne Falls 9 20% 9 Athol 8 18% 9 Orange - downtown 8 18% 10 Hadley 7 16% 10 rthfield 7 16% Long Term Ideal Transit System An important station at the Community Conversations asked participants what they would like FRTA s fixed route system to look like if there were no constraints on funding or resources. Participants could draw new routes and bus stops on maps provided or write ideas down on paper. In terms of service, participants almost universally agreed that there should be more frequent service particularly to align with employee and school schedules; weekend service (Saturday service seemed to be more desired than Sunday); and evening service. The most common additional routes that people wanted include the following: Greenfield to Amherst via South Deerfield Greenfield/Turners Falls to rthfield via Bernardston/Gill rthfield/millers Falls to Amherst 5 P age

187 Millers Falls/Montague Center to rthampton Greenfield to Boston/Fitchburg via Orange Shelburne Falls to Amherst/rthampton via Route 116 Greenfield/rth County to Brattleboro General Comments Participants at the Community Conversations were also encouraged to write down any comments they may have and place them in envelopes throughout the room. Many constructive comments were received (See the Appendix for full listing). The following image is a wordcloud that visually summarizes the comments received. The larger words in the wordcloud indicate the most frequently mentioned words. From this image, it is clear that participants at the Community Conversations want more service particularly additional hours and on the weekend. They also want more bus service to serve Greenfield and Turners Falls residents and that the bus needs to get them to work and school. Figure 3. Summary of comments received at the FRTA Community Conversations. 6 Page
188 Surveys Surveys with specific transit and demographic questions were also available at the Community Conversation forums for participants to fill out. A copy of the survey is included in the Appendix. In addition to paper copies, electronic versions of the survey were also made available through the FRTA and FRCOG websites and Facebook pages. Through both the paper and electronic versions, 94 people responded to the survey 1. Key findings from the survey are: A large number of respondents currently use transit for school (50%), work (41%), and shopping (40%). A smaller percentage use it for social activities/leisure (36%) and medical appointments (25%).* Most current riders use transit because it is convenient (54%). But 43% use it for financial reasons (it is cheaper than driving) and another 38% use it because they do not have access to a car. Many of the respondents said they would like more service to Amherst and rthampton. The most common reasons people do not currently use transit is because: 1) the bus schedules do not match their need (66%); 2) the bus service is not frequent enough (59%); and the bus routes do not go to the places that they need to get to (36%). The top 3 recommendations to improve transit in the region are: o More frequent bus service (70%) o Weekend bus service (50%) o Evening bus service (44%) 1 The percentages will not add up to 100% because respondents were allowed to select multiple answers. 7 P age
189
190
191
192
193

194 August 22, 2014 Tina Cote, Administrator Franklin Regional Transit Authority 12 Olive Street Greenfield, MA Dear Ms. Cote, Thank you for sending us the draft Chapters 1 and 2 of the FRTA s Comprehensive Service Analysis to review. We have read through the draft and offer the following comments to be passed on to the consultant, URS. Bottom photo on cover This is a good picture, but it shows people with J Crew and Banana Republic bags stores that do not exist in this area and do not represent the region very well. Ch. 1 Page 1, last sentence It would be wonderful to highlight and summarize the actual public outreach that has been completed for the project. The FRTA has been proactive about this component and has partnered with the FRCOG to help reach out to the public in new ways. Specifically mentioning these efforts will help provide legitimacy from the local population for the Comprehensive Service Analysis. Below is an example summary that could be included in this section. We have also attached the Summary of the Public Input that the FRCOG created that summarizes the different efforts and results of the public outreach for more detailed information. Suggested text: At the beginning stages of the Comprehensive Service Analysis, the FRTA, and its partner regional planning agency, the Franklin Regional Council of Governments, created a series of public forums called Community Conversations on Transit to gather public input and better understand the public s transit needs and priorities. These Community Conversations were designed to be informative, educational, and interactive for participants. Four Community Conversations were held throughout the region at fully accessible locations on fixed bus routes to facilitate attendance. In addition, they were held at times that coincided with the bus schedule to 1
195 make it easier for transit riders to attend and provide input. The dates and times of the locations were: Monday, May 12 - Turners Falls, Great Falls Discovery Center, 4-6pm Wednesday, May 14 Greenfield, John W. Olver Transit Center, 12:30-2:30pm Monday, May 19 Shelburne Falls, Shelburne-Buckland Community Center, 3-5pm Tuesday, May 20 Orange, Orange Amory, 3-5pm An additional Community Conversation was held on Saturday, July 26 th at the Greenfield Farmer s Market to further expand the outreach efforts for people that may not have been able to attend the other events during the weekday. Volunteers also conducted on-board surveys of transit riders to make sure that feedback from current riders is fully captured. The same surveys were also available online and were advertised through the local newspapers, public television stations, and social media with very good success. The feedback gathered from these public outreach efforts has strongly shaped the goals and objectives of this Regional Transit Plan. This feedback has also informed Tasks 4 and 5 with the evaluation of various alternative service scenarios and developing recommendations to better align service with local and regional demand. Ch. 2 Page 2 FRTA Goals and Objectives The goals and objectives listed here directly echo the feedback received from the public outreach that was conducted. We feel strongly that adding several sentences connecting the results of the public outreach to these goals is very important in confirming to the public that their input was heard. We greatly appreciate the opportunity to comment on the first two draft chapters of the Regional Transit Plan and are looking forward to seeing the additional chapters as they are completed. We would be happy to answer any questions you have regarding these comments. Sincerely, Megan Rhodes Senior Transportation and Land Use Planner 2
196
197
198 Page intentionally left blank
199 Appendix D Public Hearing Comments
200
201
202 FRTA Public Comments The FRTA invited the public to submit all comments about the draft Comprehensive Service Analysis document entitled Regional Transit Plan through an open public comment period from July 6, 2015 through August 4, The following is a list of comments and attached letters of the feedback received: I live ½ mile north of Leyden Woods, to and from where I walk when occasionally using the bus. At 88 years and fully mobile, I have just used the Demand Response option one time excellent service however I really have no physical limitations to regularly need it. I currently do volunteer service in the mornings at Federal Street School. Once a month our car is away Friday-Sunday, curtailing my options for in town activities and programs. I wonder whether the East and West Bound #21, could be routed on Leyden Road to Barton Road, and down Country Club Road to Silver Street. It does seem like a long, time consuming stretch, but might bring more riders, perhaps high school students. I read that #21 might be expanded, and so perhaps there could be a better north area service. Thank you for all you do to provide transportation in our community. I am writing to request a bus stop at or near the Franklin Hampshire Career Center during the week. Might the municipal parking area near the Grapevine work as a safe stop closer to the Career Center, CSO, the Grapevine, the Salvation Army, and other social services? Can there be a bus stop closer to One Arch Place? Your consideration about this matter is deeply appreciated. I am writing to bring attention and also ask for extra service. First: the bench on the corner of 3 rd St & Ave A in Turners Falls has been broken in half for well over a month. It now only (sits) only 2 people instead of the usual 4. Second: if possible, could you add what is called a special event bus? These buses would run between Turners Falls and Greenfield for special events. Greenfield Fair, Turners Falls Music Fest, Turners Falls Octoberfest, Turners Falls every third Thursday per month event, and other events as they come along. If nothing else please fix the bench at 3 rd (St) and Ave A. Since I can t attend a public meeting, I wanted to submit some comments for consideration. I lived in Amherst and Sunderland for many years and used public transportation in that area, which I recognize is extraordinary for small-town America. I used it daily to go to work at UMass, and to go other places as well. Since moving to Greenfield when I purchased a home, I have to drive to work. I ve tried, and largely failed, at finding someone to regularly commute with, even though I know many people make the same commute. I believe strongly in public transportation that having to drive to work every day, alone, is incredibly frustrating. The minimal service to Amherst doesn t work for employment purposes. I really wish Greenfield would consider working with the (FRTA) to create affordable and usable routes for people making the commute between Greenfield and Amherst (I fill out surveys whenever asked about public transportation by the (FRTA) as well). It seems like the FRTA is focused on connecting the rest of Franklin County to Greenfield, when I wish Greenfield would focus on connecting beyond Franklin County. To accommodate adult workers, I think there would need to be 2-3 morning and late afternoon trips to coordinate with standard business hours. Page 1 of 4
203 Would like to see ticket sales in Montague: Food City in Turners Falls, Mini Mart in Montague Center, and Carols Market in Millers Falls. Orange bus reduced to one. What about connections to buses to Boston? Orange to Gardner to Fitchburg Train to Boston. I take the earliest (Orange) bus and I arrive in Boston about 9am. I coordinate an afterschool program at Greenfield High School and utilize FRTA services to transport students home Monday Thursday. 70% of our students are from families living below sustainable income levels. Having found the flier about the route changes when I picked up bus tickets today, I have questions. Is the stop at Greenfield High School to be eliminated? There is an R on the chart? Our students now take the 5:02 bus from Greenfield High School to be dropped at Big Y (living in hotels near by), the Corporate Center, and Leyden Woods or Greenfield Gardens. When would the routes be changed? I am grateful for the service we were just beginning to use, and I worry about how the loss will affect our students access to our growing program. Drop off Chapman St near Arch St. Allows access to F/H Career Center, CSO, Salvation Army, and Grapevine. State should recognize disparity in FRTA s funding and should be able to put funding on level with other larger, urban regional transit authorities. Feeder routes into smaller towns. Need fixed route from New Salem to Greenfield Community College. Current waste in the system could be repurposed (5:15pm Route 22 and Route 32 as an example) to provide an express bus to Orange and by-pass Turners Falls and Millers Falls. Skip GCC to get riders to the Corporate Center by 9:00am. Route changes don t fix GCC; 1 hour connection from Leyden Woods to GCC; people can walk faster. Hello, we provide you with propane at 382 Deerfield Street. Using pricing from state contract ENE-35, your price for propane is now less than $1.00 per gallon. I was also just reading chapter 6 of your regional transit plan. Propane Autogas could significantly reduce your operating costs while also helping you meet your sustainability goals. We now have 15 passenger e-450 cutaways available. Some of your existing fleet could also be converted to run on autogas. I've read the Greenfield Recorder article on the FRTA's proposal to merge the #22- Montague route into the #32-Orange route, and that no comments had yet been received from the public. For my part, I'm opposed. I live in downtown Turners Falls, my wife and I have no car, and we rely on the bus for all our transit needs. While the Recorder article touted the promise of more trips to Orange, it would result in fewer trips to and from Montague, a more heavily populated area than Orange, and not served by multiple RTA, as Orange is with MART. This would be the case even were service to be extended to 7:30 PM -- otherwise a welcome addition to those who might wish to travel to Greenfield during Page 2 of 4
204 other than bankers' hours -- a net reduction of two trips a day. Such a discontinuation might be warranted if the #22/Montague route had poor ridership. As your own proposal states, "Discontinuation is the last option for dealing with a low-performing route and should only be implemented once other measures have been tried but the route is still under performing." Yet the route is, according to your own statistics, the BEST performing route in the system, with the highest riders per hour -- over TWICE as many as on the #32. I'm unsure what the payoff is in doubling service on a route few people take... instead of, for instance, increasing service on busier routes. Beyond that, I'm concerned that the Orange bus is a fixed stop route, and drivers are very unwilling or refuse to make stops away from the ones designated on the schedule. I'm hardly the only rider with mobility problems, and I greatly appreciate that the #22 drivers will stop at the end of my street, which the Orange drivers will not do. I am also concerned at your plan to truncate the Amherst route in Sunderland to intercept a PVTA route. Does PVTA accept transfers from FRTA buses? If not, then you are producing LESS service in return for a higher cost. As far as the other service proposals, I've no objection; I still have no idea why the GCC/Corporate Center routes had not been split off two years ago as proposed, instead of maintaining the confusion of keeping them merged into the Greenfield Loop route. The #91 express route to rthampton seems a fine idea... except where, exactly, do you contemplate terminating the route? Getting out at the Academy of Music in downtown rthampton is very convenient to all (and that is indeed where most riders depart), while the Walmart stop over a mile away would force commuters into time-consuming transfers and added expense connecting to the PVTA. Thank you for your time and trouble in reading this. Don t combine the (Route) 22 and (Route) 32; instead add a Saturday run (between Greenfield and Turners Falls). In my opinion, the idea of expanding fixed route public transit opportunities to the four towns mentioned, New Salem, Wendell, Shutesbury and Leverett, is a proper one at this time of concern about over-use of the private (usually single-occupant) automobile. It should increase ridership, overall, but it also surely begins addressing another important objective: broadening the service toward more meaningfully serving the area as a whole. FRTA service quite logically started around population centers and the areas's few highvolume businesses and institutions. The present service recommendations, as worded, don't seem to depart much from this policy, focusing on increasing frequency of trips and days of service on existing routes. I would strongly urge FRTA to expand this narrow objective. As the Authority matures and as efficient, energy-saving transit becomes vital public policy, the organization's role can become a truly farsighted, leadership one, and Franklin County, as the state's most rural county, the ideal place to lead this shift. At this crucial point in the trajectory of our civilization, the earlier "bus company" should break the chains of the old, quantitative business model in order to fold in the best interests of the planet life system and ways to align human activities with it. It should consciously work to serve the planet as well as the county and surrounding area in all its rural, productive potential, human and natural...this through aiming to give its most rural population a way to move about for work and trade without the need for a private vehicle. A committed focus of that kind would strengthen and secure the existing, more urban routes, but, just as importantly, would help reduce current high levels of harmful, singleoccupant automobile use while stabilizing our smaller towns economically. These places are now belated afterthoughts of our public policy. Page 3 of 4
205 How to find the funds? Our area is the most communal, forested and agricultural part of Massachusetts, three adjectives that form a key part of the state's heritage and a potentially more stable and secure economic future. There's innate value in the rural and small-town communal character, the homes and fields of Franklin County and the adjacent region: agriculture, existing and potential; and deep knowledge and culture of an Earth-based kind that slips away in urban confines. Lacking a more broadly focused vision, this region of Massachusetts threatens to slide toward a collection of cities and commuter-centered bedroom communities alongside areas of wild thickets and decaying homes. I would suggest that, to a public service agency like FRTA, finding the funds to protect that character and potential means departing from normal business in which maximum desirability is more or less equated with the highest numbers. Such an approach isn't just "business," it's the urban model of business, enforcing the tyrrany of the quantitative, and it favors centralization, cultural homogenization, disregard of the planet's natural function and produces all the short- and long-term problems thereof. To move toward a healthy culture in a quantitatively oriented state, national and global economy, the transit authority must make sure values well beyond ridership numbers and farebox receipts rule decisions like expanding routes and setting fares, then communicate our region's fragile but real viability to funding sources. Seek the help of municipalities, foundations and the Commonwealth in joining it in protecting these assets. A well-informed citizenry will defend its heritage of town and country patterns, ways and values - Earth-based, working-rural values - and accept a level of taxation in order to do so. Otherwise, as resources tighten and people view their choices about where to live, bus service will be one more force in the urban migration of our still largely "small-town" state. I encourage the FRTA to recogize and accept its role in this matter and to commit to protecting the all-important character of the area it serves by expanding and strengthening its fixed route coverage by creating coordinated feeder routes into the smaller towns, and subsidizing the fares of these routes sufficiently to make the service attractive even to current automobile owners. Page 4 of 4
206
207
208
209
210

211 Prepared by: URS Corporation AES 500 Enterprise Drive, Suite 3B Rocky Hill, CT 06067
1 FIXED ROUTE OVERVIEW
 1 FIXED ROUTE OVERVIEW Thirty transit agencies in Ohio operate fixed route or deviated fixed route service, representing a little less than half of the 62 transit agencies in Ohio. While many transit agencies
2012 King County Metro Transit Peer Agency Comparison on Performance Measures
 2012 Peer Agency Comparison on Performance Measures Department of Transportation Metro Transit Division King Street Center, KSC-TR-0415 201 S. Jackson St Seattle, WA 98104 206-553-3000 TTY Relay: 711 www.kingcounty.gov/metro
How To Expand Commuter Rail Between Worcester And Boston
 AN INDEPENDENT VOICE FOR RESPONSIBLE GOVERNMENT CONNECTING THE HEART OF THE COMMONWEALTH WITH THE HUB OF THE UNIVERSE: MAKING THE CASE FOR EXPANDING COMMUTER RAIL SERVICE BETWEEN WORCESTER AND BOSTON Report
2012 Saskatoon Transit Services Annual Report
 2012 Annual Report Saskatoon Transit provides a high quality of service for all citizens in our community, and is undertaking initiatives focused on building its ridership. Like most North American cities,
Miami-Dade Transit Service Standards
 Miami-Dade Transit Service Standards Presentation to RTC November 10, 2005 Roosevelt Bradley 1 MDT Service Standards Primer Background Standards: Old & New Best Practices: Comparison Denver RTD ChicagoCTA
Montgomery County Coordinated Transportation Plan
 Montgomery County Coordinated Transportation Plan Updated March 2009 Adopted by the Montgomery County Board of Supervisors Resolution 95 of 2009 April 28, 2009 Executive Summary A Locally Developed, Coordinated
TRANSIT DEVELOPMENT PLAN
 Arlington County Capital Bikeshare TRANSIT DEVELOPMENT PLAN Fiscal Years 2013 to 2018 executive summary Executive Summary ARLINGTON COUNTY CAPITAL BIKESHARE TRANSIT DEVELOPMENT PLAN Fiscal Years 2013 to
College of Southern Maryland. Hughesville Transportation Study
 College of Southern Maryland Project Overview Existing Conditions Transit Service Land Use CSM Student Demographics Recommendations Methodology Transit Recommendations Transportation Demand Management
5. FARE RATES AND COLLECTION METHODS
 5. FARE RATES AND COLLECTION METHODS 5.1 Collection Methods The Martha s Vineyard Transit Authority (VTA) purchased and installed GFI Genfare Electronic Validating Fareboxes in 2002. Fareboxes are installed
Operating Budget. MARIN TRANSIT 2016 2025 SHORT RANGE TRANSIT PLAN Chapter 5: Financial Plan
 Operating Budget Marin Transit forecasts revenues and expenses for the 10-year period based on current contract rates, annual escalations, historical trends, and partner agencies revenue projections. Marin
Southwest Light Rail Transit Minneapolis-St. Paul, Minnesota New Starts Project Development (Rating Assigned November 2014)
") Southwest Light Rail Transit Minneapolis-St. Paul, Minnesota New Starts Project Development (Rating Assigned November 2014) Summary Description Proposed Project: Light Rail Transit 15.7 Miles, 17 Stations
Southwest Light Rail Transit Minneapolis-St. Paul, Minnesota New Starts Project Development (Rating Assigned November 2014) Summary Description Proposed Project: Light Rail Transit 15.7 Miles, 17 Stations
Overview of the Travel Demand Forecasting Methodology
 Overview of the Travel Demand Forecasting Methodology Prepared by the Central Transportation Planning Staff (CTPS) Authors: Scott A. Peterson, Manager Ian Harrington, Chief Planner March 29, 2008 1 OVERVIEW
Mid-Coast Corridor Transit Project San Diego, California New Starts Project Development (Rating Assigned November 2014)
") Mid-Coast Corridor Transit Project San Diego, California New Starts Project Development (Rating Assigned November 2014) Summary Description Proposed Project: Light Rail Transit 10.9 Miles, 9 Stations Total
Mid-Coast Corridor Transit Project San Diego, California New Starts Project Development (Rating Assigned November 2014) Summary Description Proposed Project: Light Rail Transit 10.9 Miles, 9 Stations Total
Why NEC FUTURE? 457 MILES LONG 2,200 DAILY TRAINS 750,000 DAILY PASSENGERS. Study Partners. Key Needs
 457 MILES LONG 2,200 DAILY TRAINS 750,000 DAILY PASSENGERS THE NEC IS THE BUSIEST RAIL CORRIDOR IN THE NATION, AND IS VITAL TO THE ECONOMY AND CITIES OF THE NORTHEAST. Why NEC FUTURE? The Northeast United
Teachers work patterns differ from those of
 Visual Essay: Teachers Work Patterns Teachers work patterns: when, where, and how much do U.S. teachers work? Rachel Krantz-Kent Teachers work patterns differ from those of many other professionals. In
Medical Transportation. What the hell is he talking about, And why is it important in my community
 Medical Transportation What the hell is he talking about, And why is it important in my community Laurence.Osband.us /2009 Medical Transportation services Conveyance services provided, directly or through
Federal Fiscal Year 2014 Funding For Utah s Large Urban Areas
 Federal Transit Administration 5310 GRANT APPLICATION INSTRUCTIONS Enhanced Mobility of Seniors and Persons with Disabilities Federal Fiscal Year 2014 Funding For Utah s Large Urban Areas Instructions
COORDINATING RURAL AND HUMAN SERVICES 2015 REPORT PREPARED FOR THE GOVERNOR S OFFICE OF PLANNING AND BUDGET
 COORDINATING RURAL AND HUMAN SERVICES TRANSPORTATION IN GEORGIA 2015 REPORT PREPARED FOR THE GOVERNOR S OFFICE OF PLANNING AND BUDGET CREATED BY THE GOVERNOR S DEVELOPMENT COUNCIL AND THE GEORGIA COORDINATING
March 2015 Prepared by the Department of Finance & Performance Management. 2013 Regional Peer Review PERFORMANCE MEASURES
 March 2015 Prepared by the Department of Finance & Performance Management 2013 Regional Peer Review PERFORMANCE MEASURES CONTENTS CONTENTS... 1 EXECUTIVE SUMMARY... 2 SNAPSHOT... 4 PEER SELECTION... 5
Mid-Coast Corridor Transit Project San Diego, California New Starts Engineering (Rating Assigned November 2015)
") Mid-Coast Corridor Transit Project San Diego, California New Starts Engineering (Rating Assigned November 2015) Summary Description Proposed Project: Light Rail Transit 10.9 Miles, 9 Stations Total Capital
Mid-Coast Corridor Transit Project San Diego, California New Starts Engineering (Rating Assigned November 2015) Summary Description Proposed Project: Light Rail Transit 10.9 Miles, 9 Stations Total Capital
DRAFT. Martha's Vineyard Coordinated Human Services Transportation Plan
 DRAFT Martha s Vineyard Transit Authority (VTA) and Martha s Vineyard Commission (MVC) Martha's Vineyard Coordinated Human Services Transportation Plan January 2015 Martha s Vineyard Coordinated Human
Fiscal Year 2015 Quarter 4 April - June 2015 Stephanie Pollack Secretary & CEO
 Performance and Accountability Report Fiscal Year 2015 Quarter 4 April - June 2015 Stephanie Pollack Secretary & CEO Prepared by: Office of Performance Management & Innovation August 2015 Inside This Issue
Performance Dashboards in Local Government: What, Why, and How?
 Performance Dashboards in Local Government: What, Why, and How? City of Portland TriMet TSCC Quarterly Meeting August 18, 2015 Dashboards: An Overview What s Driving the Interest in Performance Dashboards?
Tripp Umbach developed a detailed survey with input from the PDP and distributed the survey to six Downtown Pittsburgh market segments:
 I. INTRODUCTION In June 2005, the Pittsburgh Downtown Partnership (PDP) retained the consulting firm, Tripp Umbach & Associates (TUA), to complete a comprehensive study of Downtown Pittsburgh transit and
METRO. Fiscal Year 2013 Monthly Board Report. June 2013 (Third Quarter Fiscal Year-to-Date)
") METRO Fiscal Year 2013 Monthly Board Report Revenue Expense Ridership Performance (Third Quarter Fiscal Year-to-Date) 7/16/2013 Table of Contents Section A Section B Section C Section D Section E Section
METRO Fiscal Year 2013 Monthly Board Report Revenue Expense Ridership Performance (Third Quarter Fiscal Year-to-Date) 7/16/2013 Table of Contents Section A Section B Section C Section D Section E Section
Financial Plan & Implementation. Matrix
 Financial Plan & Implementation Matrix Revenue Projections and Financial Assumptions 1.0 Context. Background. The development of the financial plan is consistent with requirements regarding the development
MaineDOT Locally Coordinated Transit Plan Region 7. Community Concepts FY 2013-2017
 MaineDOT Locally Coordinated Transit Plan Region 7 Community Concepts FY 2013-2017 Table of Contents Description... 1 Rural transit provider... 1 Service... 1 Geographic area... 1 Community Concepts overview...
SOCIAL ENGAGEMENT BENCHMARK REPORT THE SALESFORCE MARKETING CLOUD. Metrics from 3+ Million Twitter* Messages Sent Through Our Platform
 THE SALESFORCE MARKETING CLOUD SOCIAL ENGAGEMENT BENCHMARK REPORT Metrics from 3+ Million Twitter* Messages Sent Through Our Platform *All trademarks, service marks, and trade names are the property of
Palouse Regional Transportation Planning Organization
 Palouse Regional Transportation Planning Organization Human Services Transportation Coordination Plan Update October 6, 2012 1 P alouse HSTCP Update October 2012 Palouse Regional Transportation Planning
Triangle Transit Financial Plan. Durham Orange Light Rail Transit Project
 Durham Orange Light Rail Transit Project September 2012 TABLE OF CONTENTS LIST OF TABLES... ii LIST OF FIGURES... iii 1. Introduction... 1 1 1.1. DESCRIPTION OF PROJECT SPONSOR... 1 1 1.1.1. Durham Transit
The Corporation of the TOWN OF MILTON
 The Corporation of the TOWN OF MILTON Report To: From: Committee of the Whole M. Paul Cripps, P. Eng., Director, Engineering Services Date: January 25, 2016 Report No: Subject: Recommendation: Eng-004-16
The mission of the Division of Transit Services is to provide an effective mix of public transportation services in Montgomery County.
 Transit Services MISSION STATEMENT The mission of the Division of Transit Services is to provide an effective mix of public transportation services in Montgomery County. BUDGET OVERVIEW The total approved
GTA Cordon Count Program
 Transportation Trends 2001-2011 Executive Summary Project No. TR12 0722 September 2013 1.0 Introduction The Cordon Count program was established to collect traffic data as a tool for measuring travel trends
Digital Inclusion Programme Started. BL2a
 PROJECT BRIEF Project Name Digital Inclusion Programme Status: Started Release 18.05.2011 Reference Number: BL2a Purpose This document provides a firm foundation for a project and defines all major aspects
The LYNX Transit Master Plan. METROPLAN Orlando Presentation
 2030 Paw Print: The LYNX Transit Master Plan D b 2010 December 2010 METROPLAN Orlando Presentation Project Partners Project Overview 18 Corridors Bridge between 5 Year Service Plan and Long Range Transportation
SALT RIVER PROJECT AGRICULTURAL IMPROVEMENT AND POWER DISTRICT E-29
 SALT RIVER PROJECT AGRICULTURAL IMPROVEMENT AND POWER DISTRICT E-29 EXPERIMENTAL PRICE PLAN FOR TIME-OF-USE SERVICE WITH SUPER OFF-PEAK FOR ELECTRIC VEHICLES Effective: April 2015 Billing Cycle AVAILABILITY:
Louisville Region: Travel Management Coordination Center
 Louisville Region: Travel Management Coordination Center Mobility Services for All Americans ITS Phase 1 Grant Project Team Leads: TARC & KIPDA Region IV Conference May 2008 Evolution of Coordination Travel
COMMUNITY TAILORED SERVICES Capital Area Rural Transit System (CARTS), Austin, Texas
, Austin, Texas") COMMUNITY TAILORED SERVICES Capital Area Rural Transit System (CARTS), Austin, Texas Service Design Strategies SUMMARY OF THE STRATEGY: CARTS delivers transportation tailored specifically for each of the
COMMUNITY TAILORED SERVICES Capital Area Rural Transit System (CARTS), Austin, Texas Service Design Strategies SUMMARY OF THE STRATEGY: CARTS delivers transportation tailored specifically for each of the
Proposed New Starts/Small Starts Policy Guidance
 Proposed New Starts/Small Starts Policy Guidance Table of Contents I. INTRODUCTION... 1 II. PROJECT JUSTIFICATION CRITERIA... 4 MOBILITY IMPROVEMENTS... 4 OPERATING EFFICIENCIES... 5 Measure:... 5 Calculation:...
Performance Measures. First Quarter 2012
 Performance Measures First Quarter 2012 1Q2012 Earn & Retain Community Trust 6 Performance Measures: Ridership Cost Efficiency (Cost per Revenue Hour) Cost Effectiveness (Cost per Passenger) Service Effectiveness
Doing More with the Same: How the Trinity Railway Express Increased Service without Increasing Costs
 Doing More with the Same: How the Trinity Railway Express Increased Service without Increasing Costs W. T. "Bill" Farquhar Trinity Railway Express Irving, TX Abstract The Trinity Railway Express (TRE)
Bus Users in Sydney. Transport Data Centre ISSUES PAPER 2002/02 DECEMBER 2002 ISSN 1325-9253 ISBN 0 7313 2821 3
 ISSUES PAPER 2002/02 DECEMBER 2002 ISSN 1325-9253 ISBN 0 7313 2821 3 Bus Users in Sydney Bus Users in Sydney presents the latest information on bus travel and bus travellers living in the Sydney Statistical
VRE SYSTEM PLAN SUMMARY
 VRE System Plan Summary January 2014 VRE SYSTEM PLAN SUMMARY VRE A Cost-Effective Contributor to Regional Mobility During the last decade, VRE has demonstrated its ability to accommodate a rapid and substantial
Transit Cost Analysis
 Transit Cost Analysis Types of Costs Fixed Cost: does not vary with the amount of service provided in the short run. Variable Costs: change with the amount of service provided. Variable Cost Fixed Level
THE ADA AND ITS COMPLEMENTARY PARATRANSIT REQUIREMENTS
 Section 1: Entity Submitting the Plan Charles County Department of Community Services VanGO Transportation 8190 Port Tobacco Road Port Tobacco, Maryland 20677 Contact: Ms. Lisa M. Quill Chief of Housing
Chapter 8 Funding Considerations
 Chapter 8 Funding Considerations Expanding transit services into El Dorado Hills under any of the service alternatives has associated operating and capital costs. This chapter considers the funding sources
Tam Valley Call n Ride Shuttle Option April 2008
 Tam Valley Call n Ride Shuttle Option April 2008 If funding is available to provide transit service to Tam Valley, Marin Transit staff recommends that a call-n-ride service is started. Survey data from
WRTA Administration Events in Fiscal Year 2007
 WORCESTER REGIONAL TRANSIT AUTHORITY2007 FISCAL YEAR ANNUAL REPORT WRTA Administration Events and Milestones In fiscal year 2007 the WRTA was in transition with Administrator Mary MacInnes leaving to become
Peer Analysis Summary Report: Identifying the State Role in Public Transportation in Washington
 Peer Analysis Summary Report: Identifying the State Role in Public Transportation in Washington Performance Management Overview The peer analysis represents one step of the task aimed at developing efficiency
Coordinated Plan Update and Funding for Transit
 Capital Area Regional Transit Coordination Committee Coordinated Plan Update and Funding for Transit December 2011 Regional Transit Coordination Committee (RTCC) RTCC Covers 10 County CAPCOG Region Addresses
Service Guidelines Task Force. 5. Social Equity
 Service Guidelines Task Force 5. Social Equity a. Overview... 5.1 b. Map: Elderly Population... 5.5 c. Map: Youth Population... 5.6 d. Map: Foreign Born Population... 5.7 e. Map: Non-English Speaking Population...
STRATEGIC BUSINESS PLAN QUARTERLY KPI REPORT FOR: FISCAL YEAR 2015, QUARTER 2 (JULY THROUGH DECEMBER 2014)
") STRATEGIC BUSINESS PLAN QUARTERLY KPI REPORT FOR: FISCAL YEAR 215, QUARTER 2 (JULY THROUGH DECEMBER ) CONTENTS BALANCED SCORECARD OF KEY PERFORMANCE INDICATORS SAFETY & SECURITY SLIDE VEHICLE, PASSENGER
STRATEGIC BUSINESS PLAN QUARTERLY KPI REPORT FOR: FISCAL YEAR 215, QUARTER 2 (JULY THROUGH DECEMBER ) CONTENTS BALANCED SCORECARD OF KEY PERFORMANCE INDICATORS SAFETY & SECURITY SLIDE VEHICLE, PASSENGER
Living After Stroke: Mobility and Transportation Options After Stroke. The Family of Community Transportation Options
 Living After Stroke: Mobility and Transportation Options After Stroke Karen Wolf-Branigin, MSW National Center on Senior Transportation Washington, DC The Family of Community Transportation Options This
Welcome & Introductions. We encourage you to take notes during the presentation so you can refer back to them during our open discussion at the end.
 Hosted by Welcome & Introductions We encourage you to take notes during the presentation so you can refer back to them during our open discussion at the end. WHY we are here today Federal Transportation
PERFORMANCE AUDIT OF COLUSA COUNTY LOCAL TRANSPORTATION COMMISSION FOR THE THREE YEARS ENDED JUNE 30, 2014
 PERFORMANCE AUDIT OF COLUSA COUNTY LOCAL FOR THE THREE YEARS ENDED JUNE 30, 2014 AUDIT PREPARED FOR THE COLUSA COUNTY LOCAL PREPARED BY SMITH & NEWELL CPAS THIS PAGE INTENTIONALLY LEFT BLANK Table of Contents
New York State Employment Trends
 New York State Employment Trends August 2015 Thomas P. DiNapoli New York State Comptroller Prepared by the Office of Budget and Policy Analysis Additional copies of this report may be obtained from: Office
Municipal Transportation Quality Review
 Municipal Transportation Quality Review SFMTA Response June 2015 San Francisco, California Overview The Agency s response to recommended modifications in the Transportation Quality Review An update on
Transit System Performance Review. May 2, 2014. Area Transportation Authority of North Central Pennsylvania (ATA) Performance Review Report
 Performance Review Report") Transit System Performance Review May 2, 2014 Area Transportation Authority of North Central Pennsylvania (ATA) Performance Review Report This page is intentionally blank to allow for duplex printing.
Transit System Performance Review May 2, 2014 Area Transportation Authority of North Central Pennsylvania (ATA) Performance Review Report This page is intentionally blank to allow for duplex printing.
STOP CONSOLIDATION TRANSIT STRATEGIES
 TRANSIT STRATEGIES STOP CONSOLIDATION Transit stops are the places where people access transit service, and greatly impact many elements of passengers transit experiences. They are typically thought of
South Carolina Multimodal Transportation Plan Vision, Goals, Objectives, and Performance Measures
 South Carolina Multimodal Transportation Plan Vision, Goals, Objectives, and Performance Measures Prepared for: Prepared by: June 2013 TABLE OF CONTENTS 1. Introduction... 1 1.1 Baseline Understanding...
Fiscal Year 2016 Service and Fare Adjustment Proposals
 Service and Fare Adjustment Proposals Ridership: 915,900 weekday trips Number of Buses: 3,040 Number of Bus Routes: 261 Number of Locomotives & Rail Cars : 1,342 Number of Rail Lines: 12 Light Rail Vehicles:
TCRP Report 153: Guidelines for Providing Access to Public Transportation Stations. Part 2: Station Typology and Mode of Access Planning Tool
 TCRP Report 153: Guidelines for Providing Access to Public Transportation Stations Part 2: Station Typology and Mode of Access Planning Tool Jamie Parks, AICP Kittelson & Associates, Inc. Acknowledgements
DRAFT. Pioneer Valley Coordinated Public Transit - Human Services Transportation Plan. Pioneer Valley Planning Commission February 4, 2015
 Pioneer Valley Metropolitan Planning Organization Pioneer Valley Coordinated Public Transit - Human Services Transportation Plan Prepared by the Pioneer Valley Planning Commission February 4, 2015 DRAFT
Passenger Rail. 2016 Regional Transportation Plan
 7 Passenger Rail 2016 Regional Transportation Plan 7 Passenger Rail Railroads have a long and proud history in Franklin County dating back to the 1840s. In 1920, there were four separate railroad companies
College of Engineering Proposal for a Tour Program
 1 College of Engineering Proposal for a Tour Program Date: January 4, 2006 To: Fr: Glenn Beltz, Associate Dean of Undergraduate Studies Tacy Costanzo, Admissions and Recruitment Coordinator Introduction
Appendix E Transportation System and Demand Management Programs, and Emerging Technologies
 Appendix E Transportation System and Demand Management Programs, and Emerging Technologies Appendix Contents Transportation System Management Program Transportation Demand Management Program Regional Parking
Transportation Breakout Session. Curvie Hawkins Mark Rauscher Mike Sims Paul Moore
 Transportation Breakout Session Curvie Hawkins Mark Rauscher Mike Sims Paul Moore Curvie Hawkins Director of Planning Fort Worth Transportation Authority Fort Worth Transportation Authority The T Presented
Residential Development Travel Plan
 Residential Development Travel Plan A Template for Developers Name of Development (Address) Name of Developer (Contact Details) Date of Travel Plan For office use: Planning reference.. /.. /.. Residential
Michigan State University Ingham County Health Department Tri- County Regional Planning Commission Land Use and Health Resource Team
 HEALTH IMPACT ASSESSMENT OF THE URBAN AND RURAL SERVICES MANAGEMENT POLICY Mid- Michigan Region Health In All Project Michigan State University Ingham County Health Department Tri- County Regional Planning
City Services Benchmarking: Public Transportation
 City Services Benchmarking: Public Transportation City and County of Office of the Controller City Services Auditor March 13, 214 City Services Benchmarking: Public Transportation CITY AND COUNTY OF SAN
Proposed Scope of Consulting Services for Business Plan Development and Performance Based Budgeting
 Business Plan Development Performance Based Budgeting Proposed Scope of Consulting Services for Business Plan Development and Performance Based Budgeting Budget Committee February 9, 2006 1 Business Plan
MAKING TRANSITION AND CHANGE EASIER THROUGH INTERIM CONTRACT MANAGEMENT
 MAKING TRANSITION AND CHANGE EASIER THROUGH INTERIM CONTRACT MANAGEMENT G.A. Grissop,* S.R. Kellogg, J.L. Taylor CDM One Cambridge Place 50 Hampshire Street Cambridge, MA 02139 KEYWORDS Brain drain, competitive
Existing Transportation Services
 CHAPTER III Existing Transportation Services INTRODUCTION This chapter reviews the existing transportation providers within the southeast study area. The chapter discusses elderly transportation service
SANTA CLARA VALLEY TRANSPORTATION AUTHORITY AD-HOC FINANCIAL RECOVERY COMMITTEE AGENDA
 SANTA CLARA VALLEY TRANSPORTATION AUTHORITY AD-HOC FINANCIAL RECOVERY COMMITTEE Wednesday, April 7, 2010 3:00 P.M. VTA River Oaks Campus Auditorium 3331 North First Street San Jose, CA AGENDA 1. CALL TO
Community Pharmacy in 2016/17 and beyond - proposals Stakeholder briefing sessions
 Community Pharmacy in 2016/17 and beyond - proposals Stakeholder briefing sessions 1 CONTENTS Contents This presentation describes our vision for community pharmacy, and outlines proposals for achieving
Every Student I Every Day I Every Possibility
 For the Facilities Master Plan March 4, 2015 1 Introduction This has been prepared to describe a proposed process to be implemented in order to develop comprehensive Facility Master Plans for all schools
Car Service with App and Dispatch Options Program Concept Paper June 15, 2016
 The City of New York Department for the Aging 2 Lafayette Street New York, New York 10007 A. Purpose Car Service with App and Dispatch Options Program Concept Paper June 15, 2016 This concept paper is
The Main Page of RE STATS will provide the range of data at the very top of the page.
 RE STATS Navigator can be accessed from Tempo under the Financials Tab at the top. It will be your bottom option under the drop down menu. The Main Page of RE STATS will provide the range of data at the
Proposed Service Design Guidelines
 Proposed Service Design Guidelines July 2015 I. Introduction During Phase II of the Reimagining CityBus project, feedback from public outreach and data analysis conducted during Phase I of the project
Reveal Management Services, Inc.
 Reveal Management Services, Inc. Case Study / Kansas City Area Transportation Authority (KCATA) This Case Study has been client approved as published. Customer Profile Kansas City (also referred to as
Leicestershire County Council Transport Trends in Leicestershire 2014. Transport Data and Intelligence (TDI)
") Leicestershire County Council Transport Trends in Leicestershire 2014 Transport Data and Intelligence (TDI) Table of Contents Contents List of Tables... 3 List of Figures... 3 Overview... 5 Traffic Growth...
Leicestershire County Council Transport Trends in Leicestershire 2014 Transport Data and Intelligence (TDI) Table of Contents Contents List of Tables... 3 List of Figures... 3 Overview... 5 Traffic Growth...
SPECIAL SERVICES HANDBOOK
 SPECIAL SERVICES HANDBOOK 1700 North 11th Street, Reading, PA 19604 For Information, Call The Special Services Department Phone - 610-921-2361 Fax - 610-921-0209 TDD - 610-921-1018 Toll Free 1-800-383-2278
Transportation Best Practices for Serving Low Income Residents National Resource Network 311 for Cities
 Transportation Best Practices for Serving Low Income Residents National Resource Network 311 for Cities In August 2015, a city submitted a request for assistance to the National Resource Network s 311
Overview of Regional Paratransit System Recommendations. RTA Board Meeting July 23, 2009
 Overview of Regional Paratransit System Recommendations RTA Board Meeting July 23, 2009 Introduction / Purpose of Study Initiated at the direction of RTA Board Improve delivery of paratransit service throughout
Nanaimo Regional Transit Business Plan. April 2008
 Nanaimo Regional Transit Business Plan April 2008 Table of Contents 1. INTRODUCTION... 1 2. OBJECTIVES AND POLICY CONTEXT... 1 3. COMMUNITY BENEFITS OF TRANSIT... 5 3.1 Reduced Infrastructure and Congestion
Ask Lexington Initiative
 Ask Lexington Initiative Round One Summary The goal of the Ask Lexington initiative was to bring people into conversation about the kind of communities they want to live in and to generate ideas on how
CHAPTER 7 DEMAND-RESPONSIVE TRANSIT
 I Transit Capacity and Quality of Service Manual, 3rd Edition CHAPTER 7 DEMAND-RESPONSIVE TRANSIT 1. User's Guide 2. Mode and Service Concepts 3. Operations Concepts 4. Quality of Service Concepts 5. Quality
COMPARISON OF FIXED & VARIABLE RATES (25 YEARS) CHARTERED BANK ADMINISTERED INTEREST RATES - PRIME BUSINESS*
 CHARTERED BANK ADMINISTERED INTEREST RATES - PRIME BUSINESS*") COMPARISON OF FIXED & VARIABLE RATES (25 YEARS) 2 Fixed Rates Variable Rates FIXED RATES OF THE PAST 25 YEARS AVERAGE RESIDENTIAL MORTGAGE LENDING RATE - 5 YEAR* (Per cent) Year Jan Feb Mar Apr May Jun
COMPARISON OF FIXED & VARIABLE RATES (25 YEARS) 2 Fixed Rates Variable Rates FIXED RATES OF THE PAST 25 YEARS AVERAGE RESIDENTIAL MORTGAGE LENDING RATE - 5 YEAR* (Per cent) Year Jan Feb Mar Apr May Jun
11. Monitoring. 11.1 Performance monitoring in LTP2
 178 11. Monitoring 11.1 Performance monitoring in LTP2 Performance against the suite of indicators adopted for LTP2 is shown in the following table. This shows progress between 2005/06 and 2009/10 (the
2016-17 POSITION DESCRIPTIONS
 2016-17 POSITION DESCRIPTIONS The following information describes the positions offered by the Center for Sustainability Education (CSE) for 2016-17. For all positions, students of all majors are encouraged
Summary of FTA Charter Service Rule Requirements
 Summary of FTA Charter Service Rule Requirements Introduction FTA-funded transit systems may provide charter service within their service area subject to meeting certain conditions. These are detailed
PALOUSE RTPO HUMAN SERVICES TRANSPORTATION COORDINATION PLAN
 PALOUSE RTPO HUMAN SERVICES TRANSPORTATION COORDINATION PLAN BACKGROIND AND OVERVIEW o Agencies: Five transits and Lewiston Idaho (included this time) o previous one developed in 2010 with 2012 update
Pupil Transportation Cost and Outsourcing Feasibility Study Performed for the West Plains R-VII Schools May 2013
 Pupil Transportation Cost and Outsourcing Feasibility Study Performed for the West Plains R-VII Schools May 2013 The TransPar Group, Inc. of Lee s Summit, Missouri was engaged by the West Plains Schools
EMPLOYMENT OPPORTUNITY
 EMPLOYMENT OPPORTUNITY Waste Diversion/Recycling Officer DEPARTMENT OF PUBLIC WORKS The City of Long Beach is seeking a highly qualified industry professional to develop and lead the City s Waste Diversion
TIMETABLE ROUTE. Effective 4/24/16 Broward Central Terminal to Hillsboro Blvd. via Dixie Highway
 TRANSFER POLICY 7/10/11 TRANSFERS BETWEEN REGULAR BUS ROUTE SERVICE AND PREMIUM EXPRESS BUS SERVICE A BCT 31-Day Premium Express Pass is acceptable on all BCT regular bus service. Passengers transferring
SERVICE, DESIGN, PERFORMANCE AND EVALUATION GUIDELINES
 SERVICE, DESIGN, PERFORMANCE AND EVALUATION GUIDELINES SERVICE STANDARDS BIG BLUE BUS 1 SERVICE STANDARDS BIG BLUE BUS 2 Contents 1 OVERVIEW.... 1.1 2 SERVICE DESIGN... 2.1 2.1 Service Categories...2.2
From the FTA 5310 Circular (C9070.1F): 1. ELIGIBLE CAPITAL EXPENSES. Funds for the Section 5310 program are available for capital expenses as defined
: 1. ELIGIBLE CAPITAL EXPENSES. Funds for the Section 5310 program are available for capital expenses as defined") From the FTA 5310 Circular (C9070.1F): 1. ELIGIBLE CAPITAL EXPENSES. Funds for the Section 5310 program are available for capital expenses as defined in Section 5302(a)(1) to support the provision of transportation
From the FTA 5310 Circular (C9070.1F): 1. ELIGIBLE CAPITAL EXPENSES. Funds for the Section 5310 program are available for capital expenses as defined in Section 5302(a)(1) to support the provision of transportation
2016 Performance Measures
 2016 Performance Measures Community Indicators/Benchmarks Airport Enplanements Stabilizing at a Lower Level of Air Service Source: Colorado Springs Airport Between 2008 and 2012, four Airline mergers consolidated
Transit in the United States 3. Operating Costs and Performance Measures 13. Quality of Transit Service 19. ADA Compliance Bus 28
 1999 National Transit Summaries and Trends Introduction 1 Introduces the transit modes discussed throughout the NTST. Transit in the United States 3 National statistics and trends in ridership, miles of