Knut Helge Midtbø, Mariken Homleid and Viel Ødegaard (P.O. Box 43, N-0313 OSLO, NORWAY)
|
|
|
- Derrick Dorsey
- 8 years ago
- Views:
Transcription
1 Verification of wind and turbulence forecasts for the airports Mehamn, Honningsvåg, Hammerfest, Hasvik, Tromsø, Bardufoss, Evenes, Narvik, Svolvær, Leknes, Mo i Rana, Mosjøen, Sandnessjøen, Brønnøysund, Værnes, Ørsta-Volda, Sandane, Førde and Fagernes for the period to ABSTRACT Knut Helge Midtbø, Mariken Homleid and Viel Ødegaard (P.O. Box 43, N-0313 OSLO, NORWAY) Atmospheric turbulence still accounts for a significant percentage of weather-related aircraft incidents in. A turbulence modelling project is run by the Norwegian Meteorological Institute in cooperation with SINTEF. A nested model system designed for forecasting atmospheric turbulence has been developed. From mid 2007 the system has been operated for seven airports in. Report 2, 2008 (Midtbø et. al., 2008) presents the system and gives verification results for the last months of Previous notes presented similar verification results for 2008 up to 31 th of December The present note is a follow up covering the next eight month period ending 31 th August In the project it has been decided to do a special studies for Værnes and Tromsø airport. These airports are chosen since there is AMDAR reports from aircrafts operating there on a regular basis. The models validated include HIRLAM 8-km (8-km resolution), UM 4-km and UM 1-km (Unified Model, 4-km and 1- km horizontal resolution) and the SIMRA model (approximately 100m resolution). Verification results are presented. No. 11 Oslo,

2 1. Model description Below is included a short description of the model system. The global ECMWF model provides lateral boundary conditions for the nested turbulence model system. Those boundary values are used for a first nest of the HIRLAM8 hydrostatic 8-km model covering Scandinavia and adjacent sea areas. From increased computer resources made it possible to upgrade to 8 km resolution (the model was renamed to HIRLAM8). The upgrade also included introduction of data assimilation in the new HIRLAM8. In HIRLAM10 no such assimilation was operational due to limited computer power. Nested inside this HIRLAM10 (from HIRLAM8) model is a version of the non-hydrostatic Unified Model (UM 4-km) developed at Met set up with 4-km resolution. (See areas in figure 2). The airport specific part of the turbulence system consists of two models covering an area surrounding the airport. A: 1-km resolution of the Unified Model (UM 1-km) B: approximately 100-m turbulence model Simra A is nested inside the 4-km run. Initial values and boundary conditions for B is taken from model A. Surrounding the airports the airports which during the period has increased to 14 are set up several UM 1- km models. The set up of UM 1-KM has changes during the period covered. The changes are described briefly in section 2 below. The set up used at the end of the one year period is presented in figures 2,3,4 and 5. All the models involved are regular numerical weather prediction models with exception for SIMRA, which is a turbulence model. The model areas for the UM 1-km and Simra for the 14 airports are given in figures The figures also include model topography and surface projection of the runway. For examples of results as presented to the ATM users we refer to IPPC. In the present model set up input to the SIMRA turbulence forecasts are produced by running UM 1-km model with an interpolated +3 hour forecast from UM 4-km as initial values. Boundary values are specified from the same UM 4-km every hour, and the model is integrated from +6 hours up to + 18 hours. The procedure is repeated based on 4-km forecasts starting at 00UTC and 12 UTC. 1-km model results are produced for both 00UTC and 12 UTC from +6 up to + 18 hours. Data are interpolated from the spherical rotated UM 1-km grid to UTM coordinates used by SIMRA. Vertical interpolation is needed to adapt to the higher resolution topography in the SIMRA model. Weather parameters transferred from UM to SIMRA are given in the following list: Surface pressure 2d Horizontal wind 3d Potential temperature 3d Specific humidity 3d Pressure at model levels 3d SIMRA is a model based upon Reynolds equations with a standard (K, ε) - turbulence closure and boundary conditions. It has the capability of predicting flows with separation, attachment, hydraulic transitions and internal wave breaking. The SIMRA model has a dynamic estimation of turbulent kinetic energy and dissipation and predicts turbulent kinetic energy (TKE). The square root of TKE has the dimension of velocity and is used as an indicator of turbulence intensity. 2

3 Initial data for the SIMRA model are interpolated from the 1-km runs valid every hour (+6, +7, +8, +18). For each of those points of time the SIMRA model is run with constant boundaries until a stationary solution is achieved. Rather than an ordinary forecast dataset, SIMRA supplies data that can be used to estimate quantitatively the strength of the turbulence in each time interval (1 hour) (Eidsvik and Utnes, 1997). The reason for running with a lead-time of 6 hours is that the total time from taking the observations up to finished computations is 4 hours. As the system is operated today, turbulence forecasts valid every hour between +6 and +18 based on 00UTC and 12UTC are available at approximately 04UTC and 16UTC. 2. Updates during the period We repeat here the changes between 31. august 2010 and 31. December 2010 covered by the previous report. 27. Octobre 2010 Start of SIMRA forecast for Leknes and Bardufoss. 3. December Start of SIMRA forecast for Svolvær. There has not been any changes in the period this report covers.. 3


4 Figure 2. Model domain for UM 1-km (named UM 1-KMNN) for parts of Mid-. The Simra areas for the airports Mehamn, Honningsvåg, Hammerfest, Hasvik, Tromsø, Bardufoss, Evenes, Svolvær Leknes, Narvik are shown in blue. Topography given by a colour scale from green at 0 meters to brown above a few hundred meters. 4

5 Figure 3. Model domains for UM 1-km (named UM 1-KMBNS) for parts of Mid-. The Simra areas for the airports Sandnessjøen, Mosjøen, Mo i Rana and Brønnøysund are shown in blue. The Simra area for Mo I Rana intersects with the area for Mosjøne but is not displayed in the figure. Topography given by a colour scale from green at 0 meters to brown above a few hundred meters. 5


6 Figure 4. Model domains for UM 1-km (named UM 1-KMSN) for parts of Southern. The Simra areas for the airport Værnes,Ørsta/Volda, Sandane, Førde and Fagernes are shown by red squares dashed. Topography given by a colour from green at 0 meters to brown above a few hundred meters. 6


7 Figure 5a. Model area for SIMRA at Mehamn airport. Model topography colour coded from green to brown. Isolines for each 60 meters are also given. 7

8 8
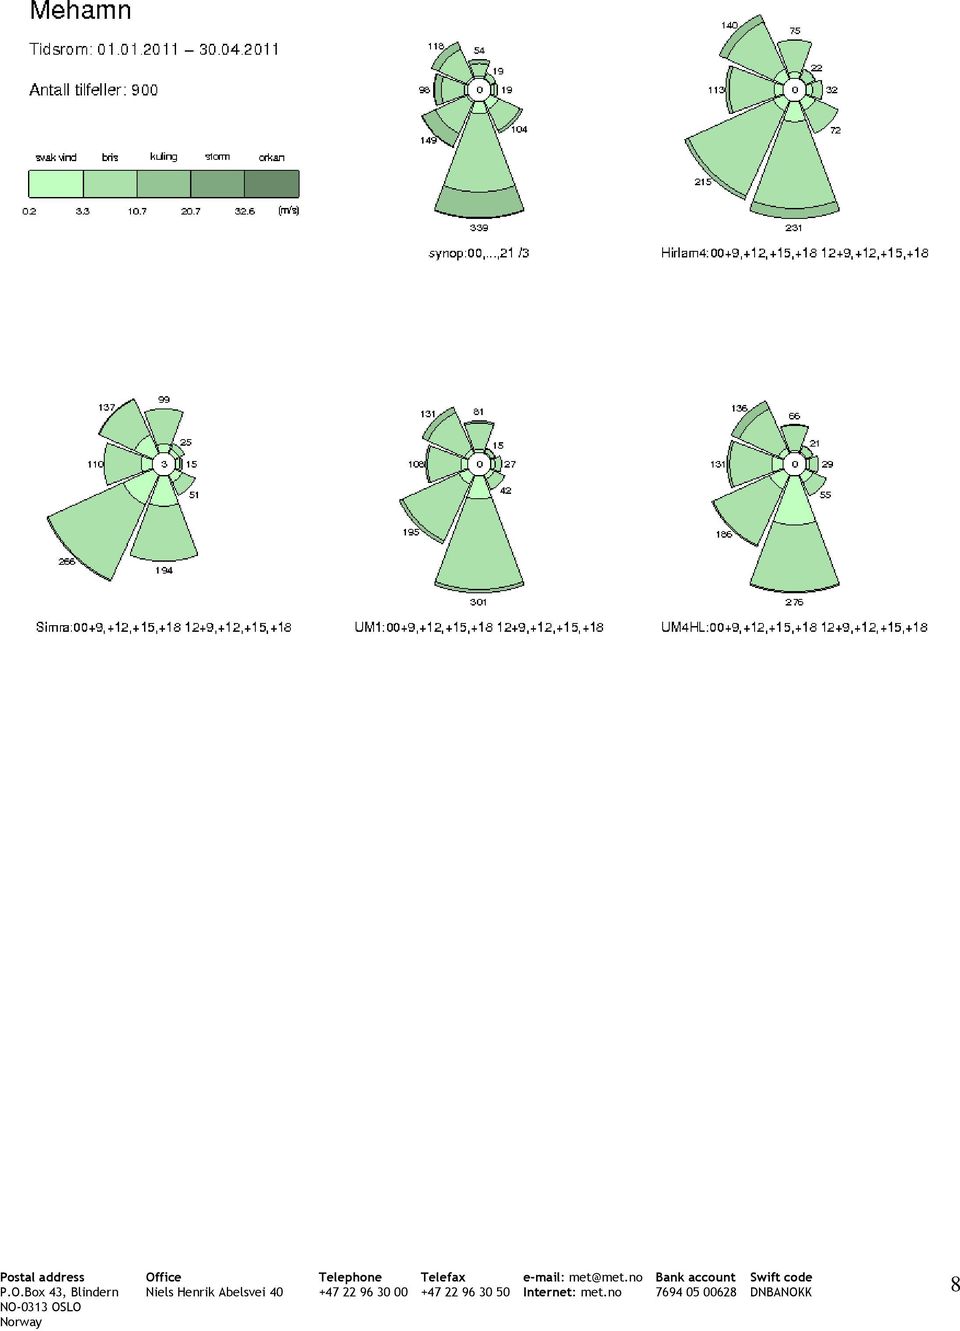
 is given in each panel. The scale of the wind force in green is given in the figure in classes with limits from 0.2m/s to above 32.6 m/s.")
9 Figure 5b. Distribution of wind force for Mehamn airport in eight direction classes for ( tidsrom ) The upper panel covers the first four months and the lower the last months. Number of cases ( Antall tilfeller ) is given in each panel. The scale of the wind force in green is given in the figure in classes with limits from 0.2m/s to above 32.6 m/s. The different windroses gives wind as observed and from the models HIRLAM 4 km (HIRLAM4), Simra, UM 1-km (UM 1-KM) and UM 4-km (UM 4-HL). The total number in each direction class is given in print. In the sentral section of the plot the number of cases with wind force below the lowest limit (0.2m/s) is given.. 9
, Simra, UM 1-km (UM 1-KM) and UM 4-km (UM 4-HL).")
10 Figure 5c. Verification results for Mehamn airport.. Upper panel shows plot of uv s (see section 4) for SIMRA, UM 1-km and UM 4-km while lower panel shows mean error. The data are displayed as monthly mean values in both panels. Colour code given in the plot. 10


11 Figure 6a. Model area for SIMRA at Honningsvåg airport, Valan. Model topography colour coded from green to brown. Isolines for each 80 meters are also given. 11

12 12
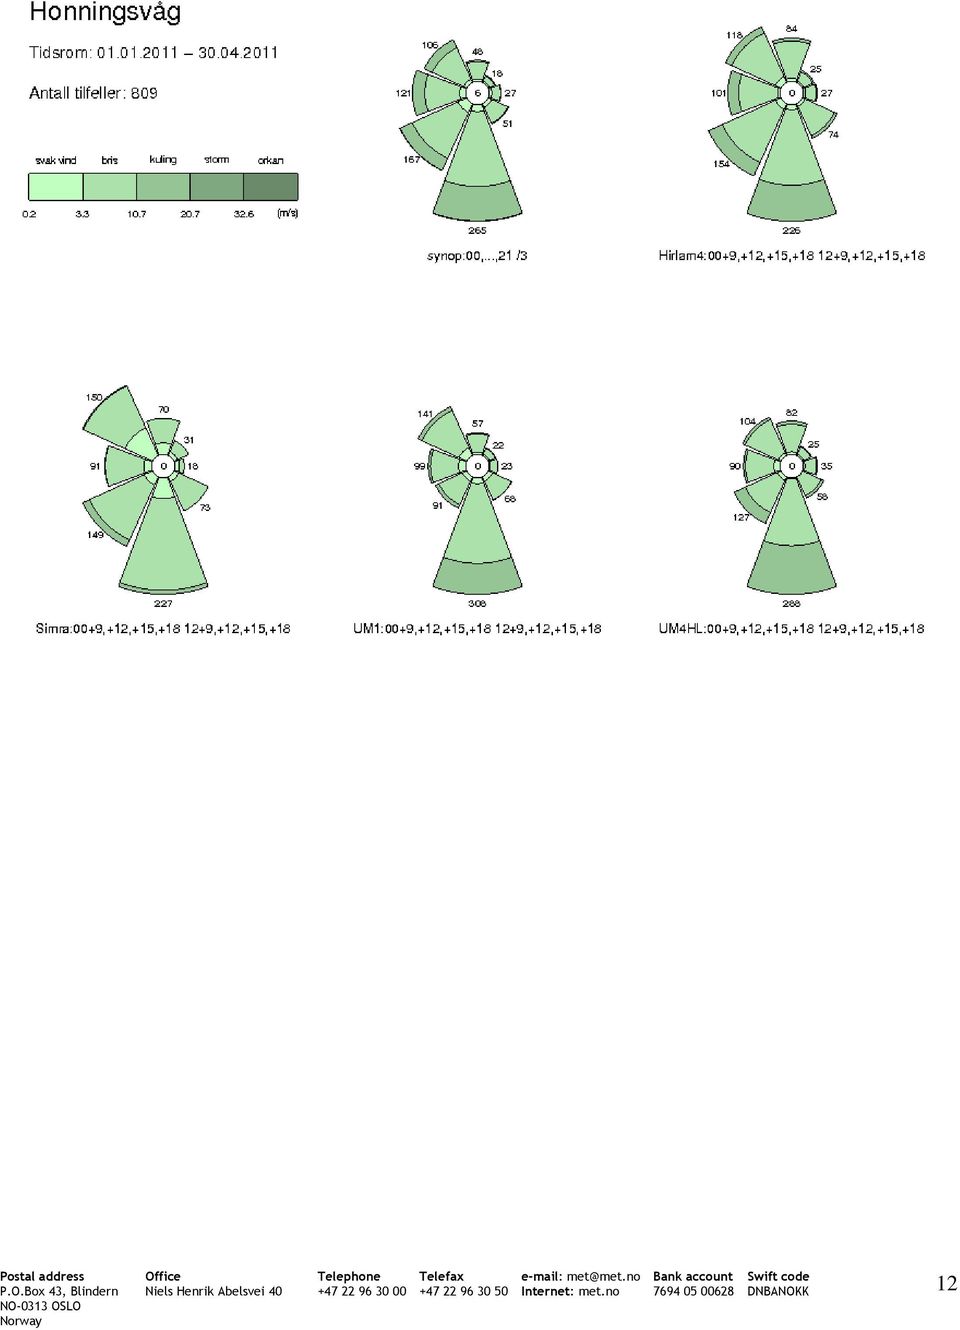
 is given in each panel. The scale of the wind force in green is given in the figure in classes with limits from 0.2m/s to above 32.6 m/s.")
13 Figure 6b. Distribution of wind force for Honningsvåg airport, Valan in eight direction classes for ( tidsrom ) The upper panel covers the first four months and the lower the last months. Number of cases ( Antall tilfeller ) is given in each panel. The scale of the wind force in green is given in the figure in classes with limits from 0.2m/s to above 32.6 m/s. The different windroses gives wind as observed and from the models HIRLAM 4 km (HIRLAM4), Simra, UM 1-km (UM 1-KM) and UM 4-km (UM 4-HL). The total number in each direction class is given in print. In the sentral section of the plot the number of cases with wind force below the lowest limit (0.2m/s) is given. 13
, Simra, UM 1-km (UM 1-KM) and UM 4-km (UM 4-HL).")
14 Figure 6c. Verification results for Honningsvåg airport, Valan. Upper panel shows plot of uv s (see section 4) for SIMRA, UM 1-km and UM 4-km while lower panel shows mean error. The data are displayed as monthly mean values in both panels. Colour code given in the plot. 14


15 Figure 7a Model area for SIMRA at Hammerfest airport. Model topography colour coded from green to brown. Isolines for each 80 meters are also given. 15

16 16

 is given in each panel. The scale of the wind force in green is given in the figure in classes with limits from 0.2m/s to above 32.6 m/s.")
17 Figure 7b. Distribution of wind force for Hammerfest airport in eight direction classes for ( tidsrom ) The upper panel covers the first four months and the lower the last months. Number of cases ( Antall tilfeller ) is given in each panel. The scale of the wind force in green is given in the figure in classes with limits from 0.2m/s to above 32.6 m/s. The different windroses gives wind as observed and from the models HIRLAM 4 km (HIRLAM4), Simra, UM 1-km (UM 1-KM) and UM 4-km (UM 4-HL). The total number in each direction class is given in print. In the sentral section of the plot the number of cases with wind force below the lowest limit (0.2m/s) is given. 17
, Simra, UM 1-km (UM 1-KM) and UM 4-km (UM 4-HL).")
18 Figure 7c. Verification results for Hammerfest airport. Upper panel shows plot of uv s (see section 4) for SIMRA, UM 1-km and UM 4-km while lower panel shows mean error. The data are displayed as monthly mean values in both panels. Colour code given in the plot. 18


19 Figure 8 a. Model area for SIMRA at Hasvik airport. Model topography colour coded from green to brown. Isolines for each 80 meters are also given Figure 8 a. Model area for SIMRA at Hasvik airport. Model topography colour coded from green to brown. Isolines for each 80 meters are also given. 19

20 20

21 Figure 8b. Distribution of wind force for Hasvik airport in eight direction classes for ( tidsrom ) The upper panel covers the first four months and the lower the last months. Number of cases ( Antall tilfeller ) is given in each panel. The scale of the wind force in green is given in the figure in classes with limits from 0.2m/s to above 32.6 m/s. The different windroses gives wind as observed and from the models Simra and UM 1-km (UM 1-KM). The total number in each direction class is given in print. In the sentral section of the plot the number of cases with wind force below the lowest limit (0.2m/s) is given. 21
22 22
 is given in each panel.")
23 Figure 8c. Distribution of wind force for weather station Hasvik,, Sluskfjellet in eight direction classes for ( tidsrom ) The upper panel covers the first four months and the lower the last months. Number of cases ( Antall tilfeller ) is given in each panel. The scale of the wind force in green is given in the figure in classes with limits from 0.2m/s to above 32.6 m/s. The different windroses gives wind as observed and from the models Simra and UM 1-km (UM 1-KM). The total number in each direction class is given in print. In the sentral section of the plot the number of cases with wind force below the lowest limit (0.2m/s) is given. 23
24 Figure 8d. Verification results for Hasvik. Upper panel shows plot of uv s (see section 4) for SIMRA, UM 1- km and UM 4-km while lower panel shows mean error. The data are displayed as monthly mean values in both panels. Colour code given in the plot. 24
25 Figure 8e. Verification results for weather station Hasvik, Sluskfjellet. Upper panel shows plot of uv s (see section 4) for SIMRA, UM 1-km and UM 4-km while lower panel shows mean error. The data are displayed as monthly mean values in both panels. Colour code given in the plot. 25

26 Figure 9 a Model area for SIMRA at Tromsø airport, Langnes. Model topography colour coded from green to brown. Isolines for each 80 meters are also given. 26
27 27
28 Figure 9 b. Distribution of wind force for Tromsø airport, Langnes in eight direction classes for ( tidsrom ) The upper panel covers the first four months and the lower the last months. Number of cases ( Antall tilfeller ) is given in each panel. The scale of the wind force in green is given in the figure in classes with limits from 0.2m/s to above 32.6 m/s. The different windroses gives wind as observed and from the models HIRLAM 4 km (HIRLAM4), Simra, UM 1-km (UM 1-KM) and UM 4-km (UM 4-HL). The total number in each direction class is given in print. In the sentral section of the plot the number of cases with wind force below the lowest limit (0.2m/s) is given. 28
29 Figure 9c. Verification results for Tromsø airport, Langnes. Upper panel shows plot of uv s (see section 4) for SIMRA, UM 1-km and UM 4-km while lower panel shows mean error. The data are displayed as monthly mean values in both panels. Colour code given in the plot. 29
30 30
31 Figure 9 d. Distribution of wind force for Tromsø weather station in eight direction classes for ( tidsrom ) Number of cases ( Antall tilfeller ) is given in each panel. The scale of the wind force in green is given in the figure in classes with limits from 0.2m/s to above 32.6 m/s. The different windroses gives wind as observed and from the models HIRLAM 4 km (HIRLAM4), Simra, UM 1-km (UM 1-KM) and UM 4-km (UM 4-HL). The total number in each direction class is given in print. In the sentral section of the plot the number of cases with wind force below the lowest limit (0.2m/s) is given. 31
32 Figure 9e. Verification results for Tromsø weather station. Upper panel shows plot of uv s (see section 4) for SIMRA, UM 1-km and UM 4-km while lower panel shows mean error. The data are displayed as monthly mean values in both panels. Colour code given in the plot. 32

33 Figure 10 a. Model area for SIMRA at Bardufoss airport.. Model topography colour coded from green to brown. Isolines for each 80 meters are also given. 33
34 34
 is given in each panel. The scale of the wind force in green is given in the figure in classes with limits from 0.2m/s to above 32.6 m/s.")
35 Figure 10 b. Distribution of wind force for Bardufoss airport, in eight direction classes for ( tidsrom ) The upper panel covers the first four months and the lower the last months. Number of cases ( Antall tilfeller ) is given in each panel. The scale of the wind force in green is given in the figure in classes with limits from 0.2m/s to above 32.6 m/s. The different windroses gives wind as observed and from the models HIRLAM 4 km (HIRLAM4), Simra, UM 1-km (UM 1-KM) and UM 4-km (UM 4-HL). The total number in each direction class is given in print. In the sentral section of the plot the number of cases with wind force below the lowest limit (0.2m/s) is given. 35
36 Fi Figure 10c. Verification results for Bardufoss airport. Upper panel shows plot of s uv (see section 4) for SIMRA, UM 1-km and UM 4-km while lower panel shows mean error. The data are displayed as monthly mean values in both panels. Colour code given in the plot. 36

37 Figure 11 a Model area for SIMRA at Harstad/Narvik airport, Evenes.Model topography colour coded from green to brown. Isolines for each 80 meters are also given. 37
38 38
39 Figure 11 b. Distribution of wind force for Harstad/Narvik airport, in eight direction classes for ( tidsrom ) The upper panel covers the first four months and the lower the last months. Number of cases ( Antall tilfeller ) is given in each panel. The scale of the wind force in green is given in the figure in classes with limits from 0.2m/s to above 32.6 m/s. The different windroses gives wind as observed and from the models HIRLAM 4 km (HIRLAM4), Simra, UM 1-km (UM 1-KM) and UM 4-km (UM 4-HL). The total number in each direction class is given in print. In the sentral section of the plot the number of cases with wind force below the lowest limit (0.2m/s) is given. 39
40 Figure 11 c. Verification results for Harstad/Narvik airport, Evenes. Upper panel shows plot of uv s (see section 4) for SIMRA, UM 1-km and UM 4-km while lower panel shows mean error. The data are displayed as monthly mean values in both panels. Colour code given in the plot. 40

41 Figure 12 a Model area for SIMRA at Narvik airport, Framnes. Model topography colour coded from green to brown. Isolines for each 80 meters are also given. 41
42 42

43 Figure 12 b. Distribution of wind force for Narvik airport, Framnes, in eight direction classes for ( tidsrom ) Number of cases ( Antall tilfeller ) is given in each panel. The scale of the wind force in green is given in the figure in classes with limits from 0.2m/s to above 32.6 m/s. The different windroses gives wind as observed and from the models HIRLAM 4 km (HIRLAM4), Simra, UM 1-km (UM 1-KM) and UM 4-km (UM 4-HL). The total number in each direction class is given in print. In the sentral section of the plot the number of cases with wind force below the lowest limit (0.2m/s) is given. 43
44 Figure 12 c. Verification results for Narvik airport, Framnes. Upper panel shows plot of uv s (see section 4) for SIMRA, UM 1-km and UM 4-km while lower panel shows mean error. The data are displayed as monthly mean values in both panels. Colour code given in the plot. 44

45 Figure 13 a Model area for SIMRA at Svolvær airport, Helle. Model topography colour coded from green to brown. Isolines for each 80 meters are also given. 45
46 46
47 Figure 13 b. Distribution of wind force for Svolvær airport, Helle, in eight direction classes for ( tidsrom ) Number of cases ( Antall tilfeller ) is given in each panel. The scale of the wind force in green is given in the figure in classes with limits from 0.2m/s to above 32.6 m/s. The different windroses gives wind as observed and from the models HIRLAM 4 km (HIRLAM4), Simra, UM 1-km (UM 1-KM) and UM 4-km (UM 4-HL). The total number in each direction class is given in print. In the sentral section of the plot the number of cases with wind force below the lowest limit (0.2m/s) is given. 47
48 Figure 13 c. Verification results for Svolvær airport, Helle. Upper panel shows plot of uv s (see section 4) for SIMRA, UM 1-km and UM 4-km while lower panel shows mean error. The data are displayed as monthly mean values in both panels. Colour code given in the plot. 48

49 Figure 14 a Model area for SIMRA at Leknes airport. Model topography colour coded from green to brown. Isolines for each 80 meters are also given. 49
50 50

51 Figure 14 b. Distribution of wind force for Leknes airport, in eight direction classes for ( tidsrom ) Number of cases ( Antall tilfeller ) is given in each panel. The scale of the wind force in green is given in the figure in classes with limits from 0.2m/s to above 32.6 m/s. The different windroses gives wind as observed and from the models HIRLAM 4 km (HIRLAM4), Simra, UM 1-km (UM 1-KM) and UM 4-km (UM 4-HL). The total number in each direction class is given in print. In the sentral section of the plot the number of cases with wind force below the lowest limit (0.2m/s) is given. 51
52 Figure 14 c. Verification results for Leknes airport. Upper panel shows plot of uv s (see section 4) for SIMRA, UM 1-km and UM 4-km while lower panel shows mean error. The data are displayed as monthly mean values in both panels. Colour code given in the plot. 52

53 Figure 15 a Model area for SIMRA at Mo I Rana airport, Røssvoll. Model topography colour coded from green to brown. Isolines for each 80 meters are also given. 53
54 54
55 Figure 15 b. Distribution of wind force for Mo I Rana airport, Røssvoll, in eight direction classes for ( tidsrom ) Number of cases ( Antall tilfeller ) is given in each panel. The scale of the wind force in green is given in the figure in classes with limits from 0.2m/s to above 32.6 m/s. The different windroses gives wind as observed and from the models HIRLAM 4 km (HIRLAM4), Simra, UM 1-km (UM 1-KM) and UM 4-km (UM 4-HL). The total number in each direction class is given in print. In the sentral section of the plot the number of cases with wind force below the lowest limit (0.2m/s) is given. 55
56 Figure 15 c. Verification results for Mo I Rana airport, Røssvoll. Upper panel shows plot of uv s (see section 4) for SIMRA, UM 1-km and UM 4-km while lower panel shows mean error. The data are displayed as monthly mean values in both panels. Colour code given in the plot. 56

57 Figure 16 a. Model area for SIMRA at Mosjøen airport, Kjærstad. Model topography colour coded from green to brown. Isolines for each 80 meters are also given. 57
58 58
59 Figure 16 b. Distribution of wind force for Mosjøen airport, Kjærstad in eight direction classes for ( tidsrom ) Number of cases ( Antall tilfeller ) is given in each panel. The scale of the wind force in green is given in the figure in classes with limits from 0.2m/s to above 32.6 m/s. The different windroses gives wind as observed and from the models HIRLAM 4 km (HIRLAM4), Simra, UM 1-km (UM 1-KM) and UM 4-km (UM 4-HL). The total number in each direction class is given in print. In the sentral section of the plot the number of cases with wind force below the lowest limit (0.2m/s) is given. 59
60 Figure 16 c. Verification results for Mosjøen airport, Kjærstad. Upper panel shows plot of uv s (see section 4) for SIMRA, UM 1-km and UM 4-km while lower panel shows mean error. The data are displayed as monthly mean values in both panels. Colour code given in the plot. 60

61 Figure 17 a Model area for SIMRA at Sandnessjøen airport, Stokka. Model topography colour coded from green to brown. Isolines for each 80 meters are also given. 61
62 62
63 Figure 17 b. Distribution of wind force for Sandnessjøen airport, Stokka in eight direction classes for ( tidsrom ) The upper panel covers the first four months and the lower the last months. Number of cases ( Antall tilfeller ) is given in each panel. The scale of the wind force in green is given in the figure in classes with limits from 0.2m/s to above 32.6 m/s. The different windroses gives wind as observed and from the models HIRLAM 4 km (HIRLAM4), Simra, UM 1-km (UM 1-KM) and UM 4-km (UM 4-HL). The total number in each direction class is given in print. In the sentral section of the plot the number of cases with wind force below the lowest limit (0.2m/s) is given. 63
64 Figure 17 c. Verification results for Sandnessjøen airport, Stokka. Upper panel shows plot of uv s (see section 4) for SIMRA, UM 1-km and UM 4-km while lower panel shows mean error. The data are displayed as monthly mean values in both panels. Colour code given in 64

65 Figure 18 a Model area for SIMRA at Brønnøysund airport, Brønnøy. Model topography colour coded from green to brown. Isolines for each 80 meters are also given. 65
66 66
67 Figure 18 b. Distribution of wind force for Brønnøysund airport, Brønnøy, in eight direction classes for ( tidsrom ) The upper panel covers the first four months and the lower the last months. Number of cases ( Antall tilfeller ) is given in each panel. The scale of the wind force in green is given in the figure in classes with limits from 0.2m/s to above 32.6 m/s. The different windroses gives wind as observed and from the models HIRLAM 4 km (HIRLAM4), Simra, UM 1-km (UM 1-KM) and UM 4-km (UM 4-HL). The total number in each direction class is given in print. In the sentral section of the plot the number of cases with wind force below the lowest limit (0.2m/s) is given. 67
68 Figure 18 c. Verification results for Brønnøysund airport, Brønnøy. Upper panel shows plot of uv s (see section 4) for SIMRA, UM 1-km and UM 4-km while lower panel shows mean error. The data are displayed as monthly mean values in both panels. Colour code given in the plot. 68

69 Figure 19 a Model area for SIMRA at Trondheim airport, Værnes. Model topography colour coded from green to brown. Isolines for each 80 meters are also given. 69
70 70
71 Figure 19 b. Distribution of wind force for Trondheim airport, Værnes, in eight direction classes for ( tidsrom ) The upper panel covers the first four months and the lower the last months. Number of cases ( Antall tilfeller ) is given in each panel. The scale of the wind force in green is given in the figure in classes with limits from 0.2m/s to above 32.6 m/s. The different windroses gives wind as observed and from the models HIRLAM 4 km (HIRLAM4), Simra, UM 1-km (UM 1-KM) and UM 4-km (UM 4-HL). The total number in each direction class is given in print. In the sentral section of the plot the number of cases with wind force below the lowest limit (0.2m/s) is given. 71
72 Figure 19 c. Verification results for Trondheim airport, Værnes. Upper panel shows plot of uv s (see section 4) for SIMRA, UM 1-km and UM 4-km while lower panel shows mean error. The data are displayed as monthly mean values in both panels. Colour code given in the plot. 72

73 Figure 20 a Model area for SIMRA at Ørsta-Volda airport, Hovden. Model topography colour coded from green to brown. Isolines for each 80 meters are also given. 73
74 74
75 Figure 20 b. Distribution of wind force for Ørsta-Volda airport, Hovden, in eight direction classes for ( tidsrom ) The upper panel covers the first four months and the lower the last months. Number of cases ( Antall tilfeller ) is given ine each panel. The scale of the wind force in green is given in the figure in classes with limits from 0.2m/s to above 32.6 m/s. The different windroses gives wind as observed and from the models HIRLAM 4 km (HIRLAM4), Simra, UM 1-km (UM 1-KM) and UM 4-km (UM 4-HL). The total number in each direction class is given in print. In the sentral section of the plot the number of cases with wind force below the lowest limit (0.2m/s) is given. 75
76 Figure 20 c. Verification results for Ørsta-Volda airport, Hovden. Upper panel shows plot of uv s (see section 4) for SIMRA, UM 1-km and UM 4-km while lower panel shows mean error. The data are displayed as monthly mean values in both panels. Colour code given in the plot. 76

77 Figure 21 a Model area for SIMRA at Sandane airport, Anda. Model topography colour coded from green to brown. Isolines for each 80 meters are also given. 77
78 78
79 Figure 21 b. Distribution of wind force for Sandane airport, Anda, in eight direction classes for ( tidsrom ) The upper panel covers the first four months and the lower the last months. Number of cases ( Antall tilfeller ) is given in each panel. The scale of the wind force in green is given in the figure in classes with limits from 0.2m/s to above 32.6 m/s. The different windroses gives wind as observed and from the models HIRLAM 4 km (HIRLAM4), Simra, UM 1-km (UM 1-KM) and UM 4-km (UM 4-HL). The total number in each direction class is given in print. In the sentral section of the plot the number of cases with wind force below the lowest limit (0.2m/s) is given.in each panal.. 79
80 Figure 21 c. Verification results for Sandane airport, Anda. Upper panel shows plot of uv s (see section 4) for SIMRA, UM 1-km and UM 4-km while lower panel shows mean error. The data are displayed as monthly mean values in both panels. Colour code given in the plot. 80

81 Figure 22 a Model area for SIMRA at Førde airport, Bringeland. Model topography colour coded from green to brown. Isolines for each 80 meters are also given. 81

82 82
 is 744.")
83 Figure 22 b. Distribution of wind force for Førde airport, Bringeland, in eight direction classes for ( tidsrom ) The upper panel covers the first four months and the lower the last months. Number of cases ( Antall tilfeller ) is 744. The scale of the wind force in green is given in the figure in classes with limits from 0.2m/s to above 32.6 m/s. The different windroses gives wind as observed and from the models HIRLAM 4 km (HIRLAM4), Simra, UM 1-km (UM 1-KM) and UM 4-km (UM 4- HL). The total number in each direction class is given in print. In the sentral section of the plot the number of cases with wind force below the lowest limit (0.2m/s) is given. 83
84 Figure 22 c. Verification results for Førde airport, Bringeland. Upper panel shows plot of uv s (see section 4) for SIMRA, UM 1-km and UM 4-km while lower panel shows mean error. The data are displayed as monthly mean values in both panels. Colour code given in the plot. 84

85 Figure 23 a Model area for SIMRA at Fagernes airport, Leirin. Model topography colour coded from green to brown. Isolines for each 80 meters are also given. 85
86 86
87 Figure 23 b. Distribution of wind force for Fagernes airport, Leirin, in eight direction classes for ( tidsrom ) The upper panel covers the first four months and the lower the last months. Number of cases ( Antall tilfeller ) is given in each panel. The scale of the wind force in green is given in the figure in classes with limits from 0.2m/s to above 32.6 m/s. The different windroses gives wind as observed and from the models HIRLA HIRLAM 4 km (HIRLAM4), Simra, UM 1-km (UM 1-KM) and UM 4-km (UM 4-HL). The total number in each direction class is given in print. In the sentral section of the plot the number of cases with wind force below the lowest limit (0.2m/s) is given. 87
88 Figure 23 c. Verification results for Fagernes airport, Leirin. Upper panel shows plot of uv s (see section 4) for SIMRA, UM 1-km and UM 4-km while lower panel shows mean error. The data are displayed as monthly mean values in both panels. Colour code given in the plot. 88
89 3. Observations for verification We have used three standard meteorological observation types in this study. We include a description. We have also used non-standrad wind observations from two mountain tops, namely Kjølen west of Tromsø and Gjevingåsen southwest of Værnes. The data are of the same type as the SYNOP data. Since the data are a new source of information and has another location than the runway, we have chosen to call them mountain data in the present context. The model system is designed for forecasting turbulent conditions. We have addressed the need for turbulence measurement for verification/validation. So far the observational data for verification is limited to wind observations. The observations are rather sparse. In order to get supplementary information, a trial period started in May During this period Widerøe pilots delivered special turbulence reports on how they felt the quality of the forecasts were compared to the real experience of the conditions. After the trial period the feedback from the pilots was evaluated and the overall impression was that it was good correlation between the forecast and the pilots experience of the actual wind conditions. 3.1 SYNOP SYNOP is an acronym for surface based reports. A SYNOP report contains wind measurements at 10 meter using standard traditional surface measurements for the airport at standard height 10 meter above land surface. 3.2 TEMP TEMP is an acronym for vertical soundings as measured from a balloon released and ascending due to lift of the balloon. A measurement device is attached to the balloon. Data are transmitted to the ground from this device in real time. The wind is calculated from the observed drift of the balloon relative to the ground. The observational error of wind from TEMP reports is of the order of a few m/s. 3.3 AMDAR There are available data from higher levels in the surrounding areas of some of the Norwegian airports. Some aircrafts are equipped with installations necessary to transmit meteorological observations known as AMDAR (Aircraft Meteorological DAta Relay). The following is referred from AMDAR REFERENCE MANUAL prepared by Derek Painting, World Meteorological Organization (WMO). Wind speed and direction are computed by resolution of the vectors: V = Vg Va Where V is the wind vector, Vg (ground velocity) is the velocity of the aircraft with respect to the earth and Va is the velocity of the air with respect to the aircraft. Va is calculated from true airspeed and heading. Heading and ground velocity are derived from the inertial reference unit (IRU). True airspeed is a function of Mach number and static air temperature. Errors in Mach number are the most significant. For example with a Mach number error of 0.5% at cruise level, airspeed error is some1.2m/s. Thus with zero error from the navigation system, wind vector errors up to 1.2m/s are to be 89
90 expected and are also dependent on the angle between the wind at flight level and the aircraft heading. Errors in true airspeed combine with errors from the IRU. The basic calculations assume perfect alignment of the aircraft with the airstream and zero roll, pitch, yaw and perfect inertial platform alignment. At high pitch/roll angles wind vector errors, which are proportional to true airspeed can be significant. For example at 150kt airspeed with 5 degrees pitch and 10 degrees roll a wind vector error of some 1m/s can be expected regardless of the true wind vector. At low wind speeds vector errors can lead to large errors in wind direction. Thus a more useful indication combining wind speed and direction error as vector error would suggest a typical uncertainty of 2-3m/s. In the AMDAR format there are possibilities for reporting turbulence measures. Turbulence is reported in one or more of three ways: (i)as variation in vertical acceleration experienced by the aircraft. (ii)as 'derived equivalent vertical gust'. (iii)as an index related to eddy dissipation rate (EDR). For more details see the reference manual referred to above. In Europe quite many AMDAR reports includes the index listed EDR (see list above). We have investigated the AMDAR reports presently available from aircrafts operating in for some arbitrary days in January We have for those aircrafts found only reports with this index given as missing. For the project there would be of great value if actions could be taken in order to include such an index in the AMDAR reports for Norwegian areas. 3.4 MOUNTAIN DATA As already mentioned above we have for the first time also used wind obsersvations from two mountain tops, namely Kjølen west of Tromsø amd Gjevingåsen southwest of Værnes. The data are of the same type as the SYNOP data. Since they are a new data source and has another location than the runway, we have chosen to call them mountain data. The data has been collected from via a separate system used for giving socalled TREND forecasts at met.no. The collection of data started in October 2010 and results were presented for the three last months October, November and December of 2010 in the previous report. We addressed then the possible data quality control problem connected to those data. For that reason we will come back to verification using those data in the next report. 4. Verification Basis for the verification work at the Norwegian Meteorological Institute is operational storage of both observations and model output in databases with a high level stability and with secured look up systems. In this way all data for validation and verification is available for further investigation. All model data used in the following validation is interpolated horizontally to the position of the observation with Bessel interpolation with good interpolation accuracy. In the vertical data are interpolated as linear in the logarithm of p. To compare with observations at times off the hourly available model data a linear interpolation in time is carried out. In order to summarize the results for the wind in some way, we have computed the square root ( s uv ) of the mean of the squared standard deviations of the component errors of the two wind components u and v s and s ). The formula is: ( u v 90
91 s uv 1 2 s 2 u s 2 v 5.1 Verification of horizontal wind forecasts against SYNOP reports for the airports Honningsvåg, Hammerfest, Hasvik, Tromsø, Evenes, Narvik, Mosjøen, Sandnessjøen, Brønnøysund, Værnes, Ørsta-Volda, Sandane, Førde and Fagernes. The present report is organized with several figures for each airport showing area, monthly means of verification scores and wind roses in a sequence organized by letters. Starting with Mehamn and figures 5a, 5b and 5c we end up with Fagernes, Leirin in figures 23a, 23b and 23c. Since there are two observing sites inside the Hasvik as well as the Tromsø model area, there are five figures for the two sites namely figures 8 a to e and 9 a to e respectively. We have included (as the last figure for each site) a figure showing monthly means of suv and Mean Error based on SYNOP reports for each observation site. Those two presented parameters are used as a quality indicator for the wind forecasts. Mehamn airport We refer to figures 5a, 5b and 5c for this airport. This airport is situated at the coast with open sea to the north. There is a valley south of the airport and a peninsula to the west. The distribution as given by the wind roses shows that for the first four months period UM 1-km gives the best wind distribution. There is an improvement from the 4 km models (UM 4-km and HIRLAM 4-km) by UM 1-km as a too high frequency of easterly winds in the 4-km models are reduced. For the last four months the influence of the land sea breeze is evident. Simra and UM 1-km has the most realistic wind distributions for the last four months, while the 4-km models fails to describe the high frequency of onshore northerly winds. Looking at the wind errors, SIMRA has a slightly larger error than UM 1-km and UM 4-km. The mean errors are rather similar for those models. Overall Simra and UM 1.km gives the best wind forecast at the runway. Honningsvåg airport, Valan We refer to figures 6a, 6b and 6c for this airport. This airport is situated on a peninsula at the coast with open sea to the north. For the first four month period the Um 1.km model gives the best wind distribution with rather similar results for all the other models. For the last four months for the effect of the land sea breeze is evident. The results when it comes to quality of the wind distribution is in fact more in favour of the 4-km models for the last four monyhs, although the difference is small. 91
92 Simra has a marked under-estimation of the wind. The non-systematic are errors levels vary through the year and for the period as a whole is rather similar errors for all models. Hammerfest airport We refer to figures 7a, 7b and 7c for this airport. The airport is situated in a valley with mountains of meters height situated some 700 meters to the northwest and mountains at about 200 meters height to the south only a few hundred meters away and mountains further south reaching above 600 meters height. The observation shows a clear channelling of the wind along the valley. For the first four months all models fails to describe the frequent southwesterly wind observed. The other aspects of the distribution are forecasted a little better by the 1-km models than the 4-km ones. For the last period, however, the land sea breeze is again evident and for this period SIMRA has the far best distribution. Looking at both systematic and non-systematic errors, the quality of both SIMRA and UM 1-km compared to the coarser mesh models UM 4-km and HIRLAm 4-km is evident trough smaller non-systematic errors although both Simra and UM 1-km underestimates wind in a way UM 4-km does not. Hasvik airport We refer to figures 8a-e for this airport since there at observations from the runway as well as from the mountain top Sluskfjellet (approximately 400 meters height) 15 km to the north east of the runway. The airport is situated on a peninsula with a mountain of 174 meters height to the south west. At Hasvik airport the wind rose plot shows that SIMRA resolves better the details although is has too frequent SE wind compared to the observations. At Sluksfjellet all the models has weaknesses in the wind distribution. The distribution most similar to the observed one is for Um 1-km in the first period and SIMRA in the last period. There is generally a smaller unsystematic error in SIMRA compared to UM 1km. Regarding the systematic error, SIMRA underestimates the wind while UM 1-km overestimates it for the airport while both models underestimates the wind at Sluskfjellet. This last finding is in agreement with the findings in previous reports for the mountain tops Kjølen and Gjevingåsen in the SIMRA-area for Tromsø and Værnes respectively. Tromsø airport, Langnes We refer to figures 9a-e for this airport. Tromsø airport is situated on the western side of Tromsøya. The height of the island is around 100 m. On the island to the west, however, there is a complex mountain chain at approximately 5 km distance with nearby tops of several hundred meters. The highest top Kjølen is situated to northwest and reaches 790 meters. Within the SIMRA area there is an observation site on the top of Tromsøya (at Værvarslinga for Nord- Norge). We have included this site in the verification to shed more light on the model results. For the whole period and for both stations the best wind distribution is given by SIMRA. For the last four 92
93 sommer months for Langnes, however, UM 1-km has a wind distribution rather close to SIMRA. The error plot for the runway shows quite similar results for all models as measured by the unsystematic error. SIMRA and UM 1-km has a systematic underestimation of the wind trough the year while SIMRA is the worst in this respect. At the top of the Island the wind is generally weaker and the errors are quite similar for all models at this site. Bardufoss airport We refer to figures 10a, 10b and 10c for this airport. The runway is oriented across the valley with approach areas oriented along valleys ending in the main valley. Towards southwest there is mountains some 5 km away with distant tops above 1000 meters. There is, however, mountains in all directions. Modelling and forecasting wind at the site is probably difficult. The wind roses shows that the HIRLAM 4-km model has the most realistic wind distribution. The finer mesh models are dominated by winds form south and those models is obviously not representing the observation site. Simra and UM 1-km has a rather large unsystematic error here as expected. Both models do also overestimate the wind here while the 4-km model does not. Harstad/Narvik airport, Evenes We refer to figures 11a, 11b and 11c for this airport. The airport is situated in a valley between mountains of meters height approximately 4 km away. The wind roses seems to be rather realistic for the two highest resolution models, SIMRA and Um 1-km. This is consistent with the result for this airport in the previous report. Looking at the error levels, we see that SIMRA has a somewhat larger unsystematic error at the runway compared to the other models. The errors at this airport are, however, small compared to the same for most other airports. Narvik airport, Framnes We refer to figures 12a, 12b and 12c for this airport. This airport is situated on a peninsula east of the fjord with mountains to the south and east. The minimum distance to the mountains is however more than 3 km. When looking at the wind roses for Narvik airport, Framnes, we see as reported previously that the agreement between the models and the observations are not so good. The best fit is found between the UM 4-km and the observations, in particular for the last four months. Narvik airport, Framnes represent a location where the UM 4-km has the lowest error and as stated above also has the best wind distribution. This result is probably caused by very small-scaled features in terms of terrain and shoreline at this place. Because of these details, the models perform rather different as they resolvet those details in a different but not fully realistic way. The unsystematic errors are rather large as well, demonstrating the problems modelling the 10 m wind at the runway for this site. 93
94 Svolvær airport, Helle We refer to figures 13a and 13b for this airport. The airport is situated on the eastern side of a peninsula. Locally there is flat terrain. 1-2 km to the west and northwest there are mountains reaching meters. During the first four months, all models give a reasonable wind distribution when compared to the observations while UM 1-km and Simra are best for the last four months. SIMRA underestimates the wind here. The non-systematic errors are rather large for all models. SIMRA has the largest non-systematic error. Since we now have nearly one year of data we see that the models performs in a similar way as for the other airports. Leknes airport We refer to figures 14a-c for this airport. The airport is situated on an island. Locally there is not flat, but the details in the terrain is rather smooth. 3-4 km away there are mountains of meters height. The wind roses shows that SIMRA and UM 1-km gives the best wind distribution for the first four months. For the last four month it seen that the wind distribution from SIMRA is not so good whiel UM 1km gives the best distribution. Neither SIMRA nor UM 1-km underestimates the wind here. Those two models has also a significantly smaller non-systematic error than UM 4-km. This airport is a site where 1km resolution improves the wind at the runway all year around. Mo i Rana airport, Røssvold We refer to figures 15a and 15b for this airport. The airport is situated in a complicated with mountains in nearly all directions arther close. The wind roses shows that SIMRA and UM 1-km gives the best wind distribution for the whole period. The non-systematic errors are not so large. Simra has the largest error at this site. There is for all the models a neutral to slightly over-estimation of the wind. Mosjøen airport, Kjærstad We refer to figures 16 a-c for this airport The airport is situated in a U-shaped valley oriented north sout and with mountains of meter height on both sides. There are monutains some 5 km or more away. For Mosjøen airport, Kjærstad the errors are rather small as there is often gentle wind conditions here. The observations seen in the wind rose diagram (figure 16 b) shows a marked steering of the wind along the 94
95 valley. Strong winds from the mountains (and across the valley) are however quite frequent. The Um 4km and Hirlam 4km underestimates the steering of the wind. SIMRA and UM 1-km does not and has the by far best distribution. The error plots reveals that the UM models has the smallest non-systematic although the difference in nonsystematic errors are not large. Sandnessjøen airport, Stokka We refer to figures 17a, 17b and 17c for this airport The airport is situated on a flat area along the fjord with a mountain chain reaching 1000 mters or more a few km to the southeast. The runway is oriented along both the coast and the mountain chain. The wind roses reveals that SIMRA and UM 1-KM 1 km better resembles the observed wind distribution with SIMRA being slightly better. The 4 km models overestimate the frequency of winds blowing across the runway. The turbulence problems in SE wind fields here is reported and measured to be connected to variable wind, rather weak mean wind, and strong gusts and a direction variable between 090 og 180 degrees.(dannevig and Hoem, 1978) The overestimate of SE winds in the 4km models reflects their inability to model the effect of the mountains on the wind at the runway. Looking at the unsystematic errors for, the results for SIMRA is the best all over with small non-systematic errors and close to neutral systematic error. Brønnøysund airport, Brønnøy We refer to figures 18a, 18b and 18c for this airport The airport is surrounded of rather flat terrain on an island. Across a fjord to the southeast is a mountain range some 5 km away. The chain is orientaed in a SW to NE direction and the tops are reaching 500 to 600 meters. There is reported (Dannevig and Hoem, 1978) moderate and occasionally severe turbulence in SE windsfields above 15 m/s. All the models produced wind distribution similar to the observed one for the first four months, but for the last period UM 1-km and especially SIMRA is better. Looking at both non-systematic and systematic errors, SIMRA and UM 1-km is a little better than the coarser mesh 4-km models. Trondheim airport, Værnes We refer to figures 19a, 19b and 19c for this airport The airport is situated in a flat area with Trondheimsfjorden to the west. There are mountains both south and north of the runway. There is rather narrow valley east of the runway with complicated terrain on both sides. A mountain area known as Gjevingåsen with the highest top 328 m is reaching 200 m height only 2 km south of the runway and this mountain area known to generate problematic turbulence in a complicated interaction with other mountains of meters height further away. There are rather frequent reports of moderate to strong turbulence connected to strong winds between SW and SE over the whole Sør-Trøndelag area. 95
96 For Værnes the errors are small due to generally weak surface winds. At this place all models has remarkable similar results. The wind distribution is a little better for SIMRA and the UM 1-km. In the first period UM 1-km is better in forecasting the easterly and south easterly winds on the runway. The plot of non-systematic and systematic errors for Værnes shows remarkable similar level of errors for all four models. The 4 km models resolve the wind at the runway with much the same error level as SIMRA, but the SIMRA resolution must be expected to be necessary to resolve the turbulence generated by the surrounding mountains. Ørsta-Volda airport, Hovden We refer to figures 20 a-c for this airport The airport is situated on a peninsula at 74 m height. The peninsula is oriented in a NW-SE direction. Mountains reaches 623 meters to the northwest and 807 to the southeast just 3-4 km from the runway. At Ørsta-Volda none of the models are able to produce diistributions with similarities to the observed one. In this respect the result this airport is somewhat unique in this rather broad sample of airports for which we can show up a wide variety of results. None, however, for which the similarties between observed and modelled distributions being so large. The non-systematic and systematic errors is consistent with the previous reports. The results shows that SIMRA has the largest errors at the runway at this airport. This is probably caused by detailed and complicated terrain rather close to the runway. This might in principle be a sign of not so good turbulence forecasts at this airport. The modelling of wind at the runway in such complicated terrain is difficult, and SIMRA has larger error at the specific site. We might speculate that this is due to introduction of some problematic and still not fully resolved terrain in the model close to the runway. Without further measurements this is merely a speculation. Since we do not have turbulence measurements we can not easily draw conclusions. We will however refer to positive reports for the turbulence models at Ørsta-Volda with refence to communication with ATM-staff from Ørsta -Volda at the user meeting in Bergen 13 th of September Sandane airport, Anda We refer to figures 21a, 21b and 21c for this airport The airport is situated on the tip of a peninsula with mountains abf 800 to 1255 meters height only a few kilometres away. Dannevig and Hoem state that the airport might have the most problematic location in the country when it comes to turbulence caused by the terrain. The wind distributions at this site is an example of a distribution for which none of the models produce distributions similar to the observed one. In this respect the same remark as given above about Ørsta-Volda is justified. 96
97 The non-systematic errors are largest for SIMRA and UM 1km and at this site they also overestimates the wind. The complicated results and the large errors for all models is probably caused by detailed and complicated terrain rather close to the runway. This might in principle be a sign of not so good turbulence forecasts at this airport. Since we do not have turbulence measurements we can not easily arrive at conclusiosn about reasons for this. The modelling of wind at the runway in such complicated terrain is difficult and SIMRA has larger error at the specific site. We might speculate that this is due to introduction of some problematic and still not fully resolved terrain in the model close to the runway. Without further measurements this is just a speculation. Local reports as the one mentioned above about Ørsta-Volda would be of great help to clarify this. Førde airport, Bringeland We refer to figures 22a, 22b and 22c for this airport The airport is situated in a valley and there is as seen from the observation some steering of the wind trough this valley. The wind roses for the models is not reproducing the observed structure very well for the models. There is however agreement especially for UM 1-km so the results are somewhat better in this respect then for Ørsta- Volda and Sandane discussed above. The UM 1-km has the smallest unsystematic error but the magnitude of the errors is similar for all modes. For the airport Dannevig and Hoem report small turbulence problems. We must, however, again refer to lack of measurements of turbulence for the verification of of the turbulence forecast at this site. Reports would also be most helpful. Fagernes airport, Leirin We refer to figures 23a, 23b and 23c for this airport. The airport is situated west of the valley at about 800 meters height. The terrain is rather smouth close to the runway. More than 5km to the north and east there are mountains reaching more than 100 meters. The wind roses for the first four months is rather similar for all models. For the last four months, however, SIMRA has the best frequency distribution. Looking at the errors they are remarkable similar for all models. For this airport it seems as SIMRA gives a little better wind direction on the runway. General discussion The results discussed here are consistent with the findings reported in the previous notes. At present we have accumulated data since December 2005 for a few models and nearly one year of data even for the last airports in operational trial. There are seasonal variations and also other differences from year to year as one might expect, but nevertheless monthly means are rather stable from year to year. This is comforting as it indicates that the quality of the forecasts is stable in time. An overall result is that the errors has a seasonal variation and are smallest during summer. This is a typical result As discussed in Midtbø et al. (2006), the results must be used with much care. The model is designed for 97
98 forecasting turbulence in the upper air. A verification of forecasts of surface winds should be quite relevant as it can be argued that good surface wind forecast could be used as an indication of the models wind forecasts in general. We do not, however, think that this can be fully justified without turbulence measurements. The forecasts of wind at higher levels are the basis for the turbulence forecasts and in order to say something about the turbulence forecast, turbulence and wind at higher levels has to be verified against observations from those levels. The turbulence computed by the model is a result of complicated structures and gradients in wind and temperature and thus there are those structures rather than wind near surface, which is the key to good turbulence estimates. 98
99 5.2 Verification of horizontal wind forecasts against upper air TEMP reports for Ørlandet airport in Trøndelag The model system is nested. The quality of wind forecasts in the coarser mesh models are verified against TEMP reports on a routine basis. In this report we include verification against TEMP reports for Ørlandet airport. This verification is done for UM 4-km because neither UM 1-km nor SIMRA covers the location. The observations cannot be viewed upon as what is called the true value for the model data. This has two causes: measurement errors and the model not representing a mean value for the model grid box. This means that the model represents the grid box and not always the measured quantity regardless of the observation accuracy. When we in the following compare the two values (observations and model results) we will in short call the difference for model errors. It should be kept in mind that this error has originates from observational errors and errors connected to difference in what the two values represent as explained above. We have done a separate investigation of the model errors measured by the TEMP reports for Ørlandet. The reason for this is that we want to monitor the model error in the Trøndelag area relative to an observing system like the TEMP reports. This is because a well-known and well-documented error level characterizes those reports. The station closest to Værnes is Ørlandet. As seen in figure 8 this is close to the lateral boundary for the UM 1km model for Værnes and outside the SIMRA area. Out of the results we have chosen to display data for 850 hpa, which is a level around 1500 meters above sea level. We have compared the wind from UM 4-km to the wind from TEMP reports. Similar model wind data from the European Centre (ECMWF) model is also included in the results. A selection of verification results is shown in table 1. In this table we show the verification parameters for +12 hour prognosis. We see that the error using this measure at the start is between 2 and 3 m/s for the wind force, ff. 99
100 UM 4-KM ECMWF ff ff ME 0,52-0,16 MAE 1,84 1,84 RMSE 2,37 2,34 SDE 2,31 2,33 UM 4-KM ECMWF u u ME 0,46 0,86 MAE 1,93 1,79 RMSE 2,59 2,28 SDE 2,55 2,11 UM 4-KM ECMWF v v ME -0,43-0,03 MAE 1,62 1,55 RMSE 2,12 2,11 SDE 2,08 2,11 Table 1 Verification results for wind speed (ff) and components u and v of wind for 1 st of May till 31 st of August 2011 Verification results of interpolated model data compared to horizontal wind from TEMP reports observed at Ørlandet airport. The observation level is at 850 hpa. The model data are 12 hour forecasts valid 12 UTC. The models are UM 4-KM and ECMWF (left). The parameters computed are standard statistical parameter for the value of model value minus observation. We see in the three upper tables values for wind force (FF), u-component and v-component of the wind. The parameters are mean error (ME); mean absolute error (MAE), root mean square error (RMSE) and standard deviation of error (SDE). All results are in m/s. Interpolation methods for model data are described in the text. The results are computed for models based on the 00 UTC only. The TEMP reports used for this verification are close to
101 5.3 Validation of horizontal wind forecasts against upper air AMDAR reports for the SIMRA Værnes and Tromsø areas. Among the airports Værnes airport has been the only one where there are available AMDAR reports. This has been because not all aircrafts are equipped with the necessary systems to produce and transmit AMDAR reports. Since the start of forecasts for Tromsø, we have such data for this airport as well. The data forming basis for those reports are produced continuously during the flight including approach and take off. The observed wind is subject to a sampling procedure and AMDAR reports are produced at specified time intervals. An example of measured data is shown in figures 24 and 25 for Tromsø and Værnes respectively. The observed data are irregularly distributed in space and time as a consequence of the flight regulations and the variation in the air traffic. For the data used for this verification we have selected data in the volume covered by the SIMRA model for Værnes. The model volumes extend up to approximately 1840 meters above sea level. In this way the same observations are used for validating HIRLAM 8km, UM 1-km and SIMRA. Results are presented for the first four months in tables 2a and 2b for Tromsø and table 3a and 3b for Værnes. The figures 2a and 3a covers verification based on computations from 00 UTC while the 2b and 3b covers verification from 12 UTC. For details about the results in the tables, see the table text. There are similar results for the last four months in table 4a and 4b for Tromsø and 5a and 5b for Værnes. The results are as already mentioned confined to the volume box covered by SIMRA. From the previous chapter we have the result that a 12-hour prognosis of horizontal wind has an error of 2-3 m/s at 1500 meters height when compared to TEMP reports for Ørlandet. The results in tables 2, 3, 4 and 5 are for forecast lengths of a few hours and the errors displayed are larger but of the same order of magnitude. More important is that the errors for SIMRA is of the same order as the errors for the other models. Conclusions about the value of the inner SIMRA nest as a turbulence forecasting system can first be drawn when we have observations of turbulence available for verification. There is however still a relevant argument that high quality of the wind forcast must be seen as necessary condition for high quality forecasts of turbulence. Following up this investigation can draw more distinct conclusion on a larger data set. In a larger data set there also be possible to sample data for more distinct height levels for the AMDAR investigation. The results supports the view that the UM 1-km and SIMRA (for both airports Tromsø, Langnes and Trondheim, Værnes) are able to reduce horizontal wind error compared to the coarser mesh model HIRLAM 8-km. 101
102 Statistics For 00+9,+10,+11,+12,+13,+14,+15 Number Of cases: 669 FF.H8 FF.UM 1-KM FF.SIMRA ME MAE RMSE 4, SDE U.H8 U.UM 1-KM U.SIMRA ME MAE RMSE SDE V.H8 V.UM 1-KM V.SIMRA ME MAE RMSE SDE Table 2 a Verification results for Tromsø airport for wind speed (ff) and components u and v of wind for 1 st of January till 31 st of March The computations are for 00UTC +9,+10,+11,+12,+13,+14,+15. The table contains results for wind force ff, and for the components u and v of the wind. The error measures are mean error (ME); mean absolute error (MAE), root mean square error (RMSE) and standard deviation of error (SDE). 102
103 Statistics For 12+3,+4,+5,+6,+7,+8,+9 Number Of cases: 511 FF.H8 FF.UM 1-KM FF.SIMRA ME MAE RMSE SDE U.H8 U.UM 1-KM U.SIMRA ME MAE RMSE SDE V.H8 V.UM 1-KM V.SIMRA ME MAE RMSE SDE Table 2 b Verification results for Tromsø airport for wind speed (ff) and components u and v of wind for 1 st of January till 31 st of March The computations are for 12UTC +3,+4,+5,+6,+7,+8,+9. The table contains results for wind force ff, and for the components u and v of the wind. The error measures are mean error (ME); mean absolute error (MAE), root mean square error (RMSE) and standard deviation of error (SDE). 103
104 Statistics For 00+9,+10,+11,+12,+13,+14,+15 Number Of cases: 1133 FF.H8 FF.UM 1-KM FF.SIMRA ME MAE RMSE SDE U.H8 U.UM 1-KM U.SIMRA ME MAE RMSE SDE V.H8 V.UM 1-KM V.SIMRA ME MAE RMSE SDE Table 3 a Verification results for Værnes airport for wind speed (ff) and components u and v of wind for 1 st of January till 31 st of March The computations are for 00UTC +9,+10,+11,+12,+13,+14,+15. The table contains results for wind force ff, and for the components u and v of the wind. The error measures are mean error (ME); mean absolute error (MAE), root mean square error (RMSE) and standard deviation of error (SDE). 104
105 Statistics For 12+3,+4,+5,+6,+7,+8,+9 Number Of cases: 1305 FF.H8 FF.UM 1-KM FF.SIMRA ME MAE RMSE SDE U.H8 U.UM 1-KM U.SIMRA ME MAE RMSE SDE V.H8 V.UM 1-KM V.SIMRA ME MAE RMSE SDE Table 3 b Verification results Værnes airport for wind speed (ff) and components u and v of wind for 1 st of January till 31 st of March The computations are for 12UTC +3,+4,+5,+6,+7,+8,+9. The table contains results for wind force ff, and for the components u and v of the wind. The error measures are mean error (ME); mean absolute error (MAE), root mean square error (RMSE) and standard deviation of error (SDE). 105
106 Statistics For 00+9,+10,+11,+12,+13,+14,+15 Number Of cases: 467 FF.H8 FF.UM 1-KM FF.SIMRA ME MAE RMSE SDE U.H8 U.UM 1-KM U.SIMRA ME MAE RMSE SDE V.H8 V.UM 1-KM V.SIMRA ME MAE RMSE SDE Table 4 a Verification results for Tromsø airport for wind speed (ff) and components u and v of wind for 1 st of May till 31 st of August The computations are for 00UTC +9,+10,+11,+12,+13,+14,+15. The table contains results for wind force ff, and for the components u and v of the wind. The error measures are mean error (ME); mean absolute error (MAE), root mean square error (RMSE) and standard deviation of error (SDE). 106
107 Statistics For 12+3,+4,+5,+6,+7,+8,+9 Number Of cases: 672 FF.H8 FF.UM 1-KM FF.SIMRA ME MAE RMSE SDE U.H8 U.UM 1-KM U.SIMRA ME MAE RMSE SDE V.H8 V.UM 1-KM V.SIMRA ME MAE RMSE SDE Table 4 b Verification results for Tromsø airport for wind speed (ff) and components u and v of wind for 1 st of January till 31 st of March st of May till 31 st of August The computations are for 12UTC +3,+4,+5,+6,+7,+8,+9. The table contains results for wind force ff, and for the components u and v of the wind. The error measures are mean error (ME); mean absolute error (MAE), root mean square error (RMSE) and standard deviation of error (SDE). 107
108 Statistics For 00+9,+10,+11,+12,+13,+14,+15 Number Of cases: 778 FF.H8 FF.UM 1-KM FF.SIMRA ME MAE RMSE SDE U.H8 U.UM 1-KM U.SIMRA ME MAE RMSE SDE V.H8 V.UM 1-KM V.SIMRA ME MAE RMSE SDE Table 5 a Verification results for Værnes airport for wind speed (ff) and components u and v of wind for 1 st of January till 31 st of March st of May till 31 st of August The computations are for 00UTC +9,+10,+11,+12,+13,+14,+15. The table contains results for wind force ff, and for the components u and v of the wind. The error measures are mean error (ME); mean absolute error (MAE), root mean square error (RMSE) and standard deviation of error (SDE). 108
109 Statistics For 12+3,+4,+5,+6,+7,+8,+9 Number Of cases: 778 FF.H8 FF.UM 1-KM FF.SIMRA ME MAE RMSE SDE U.H8 U.UM 1-KM U.SIMRA ME MAE RMSE SDE V.H8 V.UM 1-KM V.SIMRA ME MAE RMSE SDE Table 5 b Verification results Værnes airport for wind speed (ff) and components u and v of wind for 1 st of January till 31 st of March st of May till 31 st of August The computations are for 12UTC +3,+4,+5,+6,+7,+8,+9. The table contains results for wind force ff, and for the components u and v of the wind. The error measures are mean error (ME); mean absolute error (MAE), root mean square error (RMSE) and standard deviation of error (SDE). 109
 and wind observed from AMDAR for two different aircrafts.")
110 Figure 24. Simra domain (black square with wind inside) for Tromsø. Topography with 60 m spacing between isolines couloured from green to brown. In black wind arrows in 3000 m height from SIMRA (every eight grid point in each direction) and wind observed from AMDAR for two different aircrafts. For the observations the time of the observation and the height of the aircraft are indicated. 110
Affiliation: * The Norwegian Meteorological institute, Oslo, ** SINTEF ICT> > Applied Mathematics, Trondheim, Norway 8/15/14
 An operational system for forecasting of turbulence in the vicinity of airports in Norway WWOSC 2014, Montréal, Canada Knut Helge Midtbo*, Jakob Suild*, Karstein Soerli** and Joern Kristiansen* Affiliation:
Mode-S Enhanced Surveillance derived observations from multiple Air Traffic Control Radars and the impact in hourly HIRLAM
 Mode-S Enhanced Surveillance derived observations from multiple Air Traffic Control Radars and the impact in hourly HIRLAM 1 Introduction Upper air wind is one of the most important parameters to obtain
Project Title: Quantifying Uncertainties of High-Resolution WRF Modeling on Downslope Wind Forecasts in the Las Vegas Valley
 University: Florida Institute of Technology Name of University Researcher Preparing Report: Sen Chiao NWS Office: Las Vegas Name of NWS Researcher Preparing Report: Stanley Czyzyk Type of Project (Partners
Comparative Evaluation of High Resolution Numerical Weather Prediction Models COSMO-WRF
 3 Working Group on Verification and Case Studies 56 Comparative Evaluation of High Resolution Numerical Weather Prediction Models COSMO-WRF Bogdan Alexandru MACO, Mihaela BOGDAN, Amalia IRIZA, Cosmin Dănuţ
Wind resources map of Spain at mesoscale. Methodology and validation
 Wind resources map of Spain at mesoscale. Methodology and validation Martín Gastón Edurne Pascal Laura Frías Ignacio Martí Uxue Irigoyen Elena Cantero Sergio Lozano Yolanda Loureiro e-mail:mgaston@cener.com
An Analysis of the Rossby Wave Theory
 An Analysis of the Rossby Wave Theory Morgan E. Brown, Elise V. Johnson, Stephen A. Kearney ABSTRACT Large-scale planetary waves are known as Rossby waves. The Rossby wave theory gives us an idealized
Verification of cloud simulation in HARMONIE AROME
 METCOOP MEMO No. 01, 2013 Verification of cloud simulation in HARMONIE AROME A closer look at cloud cover, cloud base and fog in AROME Karl-Ivar Ivarsson, Morten Køltzow, Solfrid Agersten Front: Low fog
USING SIMULATED WIND DATA FROM A MESOSCALE MODEL IN MCP. M. Taylor J. Freedman K. Waight M. Brower
 USING SIMULATED WIND DATA FROM A MESOSCALE MODEL IN MCP M. Taylor J. Freedman K. Waight M. Brower Page 2 ABSTRACT Since field measurement campaigns for proposed wind projects typically last no more than
Financing Community Wind
 Financing Community Wind Wind Data and Due Diligence What is the Project's Capacity Factor? Community Wind Energy 2006 March 8, 2006 Mark Ahlstrom mark@windlogics.com Slide 1 The Need for Wind Assessment
Virtual Met Mast verification report:
 Virtual Met Mast verification report: June 2013 1 Authors: Alasdair Skea Karen Walter Dr Clive Wilson Leo Hume-Wright 2 Table of contents Executive summary... 4 1. Introduction... 6 2. Verification process...
Application of Numerical Weather Prediction Models for Drought Monitoring. Gregor Gregorič Jožef Roškar Environmental Agency of Slovenia
 Application of Numerical Weather Prediction Models for Drought Monitoring Gregor Gregorič Jožef Roškar Environmental Agency of Slovenia Contents 1. Introduction 2. Numerical Weather Prediction Models -
Near Real Time Blended Surface Winds
 Near Real Time Blended Surface Winds I. Summary To enhance the spatial and temporal resolutions of surface wind, the remotely sensed retrievals are blended to the operational ECMWF wind analyses over the
Convective Clouds. Convective clouds 1
 Convective clouds 1 Convective Clouds Introduction Convective clouds are formed in vertical motions that result from the instability of the atmosphere. This instability can be caused by: a. heating at
Requirements of Aircraft Observations data and Data Management Framework for Services and Other Data Users. (Submitted bymichael Berechree)
") WORLD METEOROLOGICAL ORGANIZATION WMO AMDAR PANEL WORKSHOP ON AIRCRAFT OBSERVING SYSTEM DATA MANAGEMENT Workshop on Aircraft Observing System Data Management/Doc.3.2 (31.V.2012) (GENEVA, SWITZERLAND, 5
WORLD METEOROLOGICAL ORGANIZATION WMO AMDAR PANEL WORKSHOP ON AIRCRAFT OBSERVING SYSTEM DATA MANAGEMENT Workshop on Aircraft Observing System Data Management/Doc.3.2 (31.V.2012) (GENEVA, SWITZERLAND, 5
An improved correction method for high quality wind and temperature observations derived from Mode-S EHS
 An improved correction method for high quality wind and temperature observations derived from Mode-S EHS Siebren de Haan De Bilt, 013 Technical report; TR-338 An Improved Correction Method for High Quality
Studying Topography, Orographic Rainfall, and Ecosystems (STORE)
") Studying Topography, Orographic Rainfall, and Ecosystems (STORE) Introduction Basic Lesson 2: Using ArcGIS Explorer to Analyze the Connection between Topography and Rainfall This lesson introduces Geographical
Studying Topography, Orographic Rainfall, and Ecosystems (STORE) Introduction Basic Lesson 2: Using ArcGIS Explorer to Analyze the Connection between Topography and Rainfall This lesson introduces Geographical
Developing sub-domain verification methods based on Geographic Information System (GIS) tools
 tools") APPROVED FOR PUBLIC RELEASE: DISTRIBUTION UNLIMITED U.S. Army Research, Development and Engineering Command Developing sub-domain verification methods based on Geographic Information System (GIS) tools
APPROVED FOR PUBLIC RELEASE: DISTRIBUTION UNLIMITED U.S. Army Research, Development and Engineering Command Developing sub-domain verification methods based on Geographic Information System (GIS) tools
Including thermal effects in CFD simulations
 Including thermal effects in CFD simulations Catherine Meissner, Arne Reidar Gravdahl, Birthe Steensen catherine@windsim.com, arne@windsim.com Fjordgaten 15, N-125 Tonsberg hone: +47 8 1800 Norway Fax:
The information in this report is provided in good faith and is believed to be correct, but the Met. Office can accept no responsibility for any
 Virtual Met Mast Version 1 Methodology and Verification January 2010 The information in this report is provided in good faith and is believed to be correct, but the Met. Office can accept no responsibility
Use of numerical weather forecast predictions in soil moisture modelling
 Use of numerical weather forecast predictions in soil moisture modelling Ari Venäläinen Finnish Meteorological Institute Meteorological research ari.venalainen@fmi.fi OBJECTIVE The weather forecast models
Visualizing of Berkeley Earth, NASA GISS, and Hadley CRU averaging techniques
 Visualizing of Berkeley Earth, NASA GISS, and Hadley CRU averaging techniques Robert Rohde Lead Scientist, Berkeley Earth Surface Temperature 1/15/2013 Abstract This document will provide a simple illustration
6.4 THE SIERRA ROTORS PROJECT, OBSERVATIONS OF MOUNTAIN WAVES. William O. J. Brown 1 *, Stephen A. Cohn 1, Vanda Grubiši 2, and Brian Billings 2
 6.4 THE SIERRA ROTORS PROJECT, OBSERVATIONS OF MOUNTAIN WAVES William O. J. Brown 1 *, Stephen A. Cohn 1, Vanda Grubiši 2, and Brian Billings 2 1 National Center for Atmospheric Research, Boulder, Colorado.
Estimation of satellite observations bias correction for limited area model
 Estimation of satellite observations bias correction for limited area model Roger Randriamampianina Hungarian Meteorological Service, Budapest, Hungary roger@met.hu Abstract Assimilation of satellite radiances
Norconsult AS Trekanten, Vestre Rosten 81, NO-7075 Tiller Memo no.: 1 Tel: +47 72 89 37 50 Fax: +47 72 88 91 09
 Norconsult AS Trekanten, Vestre Rosten 81, NO-7075 Tiller Memo no.: 1 To: Norconsult/ T Isaksen From: Arne E Lothe Date: 2014-06-25 MetOcean data at Gamnes, Kirkenes, Norway Table of Contents Versions
Wave driven wind simulations with CFD
 Wave driven wind simulations with CFD DeepWind'2013, 24-25 January, Trondheim, Norway Siri Kalvig 1, Richard Kverneland 2 and Eirik Manger 3 1 StormGeo, Norway 2 University of Stavanger, Norway 3 Acona
MOGREPS status and activities
 MOGREPS status and activities by Warren Tennant with contributions from Rob Neal, Sarah Beare, Neill Bowler & Richard Swinbank Crown copyright Met Office 32 nd EWGLAM and 17 th SRNWP meetings 1 Contents
Chapter 3: Weather Map. Weather Maps. The Station Model. Weather Map on 7/7/2005 4/29/2011
 Chapter 3: Weather Map Weather Maps Many variables are needed to described weather conditions. Local weathers are affected by weather pattern. We need to see all the numbers describing weathers at many
User manual data files meteorological mast NoordzeeWind
 User manual data files meteorological mast NoordzeeWind Document code: NZW-16-S-4-R03 Version: 2.0 Date: 1 October 2007 Author: ing. HJ Kouwenhoven User manual data files meteorological mast NoordzeeWind
This article appeared in a journal published by Elsevier. The attached copy is furnished to the author for internal non-commercial research and
 This article appeared in a journal published by Elsevier. The attached copy is furnished to the author for internal non-commercial research and education use, including for instruction at the authors institution
MM5/COSMO-DE Model Inter-Comparison and Model Validation
 MM5/COSMO-DE Model Inter-Comparison and Model Validation Klaus Dengler and Christian Keil DLR, Institute of Atmospheric Physics Assessment of forecast quality using observations of the FRA airport campaign
Physics 2A, Sec B00: Mechanics -- Winter 2011 Instructor: B. Grinstein Final Exam
 Physics 2A, Sec B00: Mechanics -- Winter 2011 Instructor: B. Grinstein Final Exam INSTRUCTIONS: Use a pencil #2 to fill your scantron. Write your code number and bubble it in under "EXAM NUMBER;" an entry
COSMO Data Assimilation. Applications for Romanian Territory
 1 Working Group on Data Assimilation 19 COSMO Data Assimilation. Applications for Romanian Territory Amalia IRIZA 1,2, Rodica Claudia DUMITRACHE 1, Cosmin Dănuţ BARBU 1, Aurelia Lupaşcu 1, Bogdan Alexandru
Parameterization of Cumulus Convective Cloud Systems in Mesoscale Forecast Models
 DISTRIBUTION STATEMENT A. Approved for public release; distribution is unlimited. Parameterization of Cumulus Convective Cloud Systems in Mesoscale Forecast Models Yefim L. Kogan Cooperative Institute
Adjustment of Anemometer Readings for Energy Production Estimates WINDPOWER June 2008 Houston, Texas
 Adjustment of Anemometer Readings for Energy Production Estimates WINDPOWER June 2008 Houston, Texas Matthew Filippelli, Julien Bouget, Michael Brower, and Dan Bernadett AWS Truewind, LLC 463 New Karner
Eco Pelmet Modelling and Assessment. CFD Based Study. Report Number 610.14351-R1D1. 13 January 2015
 EcoPelmet Pty Ltd c/- Geoff Hesford Engineering 45 Market Street FREMANTLE WA 6160 Version: Page 2 PREPARED BY: ABN 29 001 584 612 2 Lincoln Street Lane Cove NSW 2066 Australia (PO Box 176 Lane Cove NSW
Robot Perception Continued
 Robot Perception Continued 1 Visual Perception Visual Odometry Reconstruction Recognition CS 685 11 Range Sensing strategies Active range sensors Ultrasound Laser range sensor Slides adopted from Siegwart
Introduction to the forecasting world Jukka Julkunen FMI, Aviation and military WS
 Boundary layer challenges for aviation forecaster Introduction to the forecasting world Jukka Julkunen FMI, Aviation and military WS 3.12.2012 Forecast for general public We can live with it - BUT Not
Turbulent mixing in clouds latent heat and cloud microphysics effects
 Turbulent mixing in clouds latent heat and cloud microphysics effects Szymon P. Malinowski1*, Mirosław Andrejczuk2, Wojciech W. Grabowski3, Piotr Korczyk4, Tomasz A. Kowalewski4 and Piotr K. Smolarkiewicz3
The impact of window size on AMV
 The impact of window size on AMV E. H. Sohn 1 and R. Borde 2 KMA 1 and EUMETSAT 2 Abstract Target size determination is subjective not only for tracking the vector but also AMV results. Smaller target
 Mesoscale re-analysis of historical meteorological data over Europe Anna Jansson and Christer Persson, SMHI ERAMESAN A first attempt at SMHI for re-analyses of temperature, precipitation and wind over
Chapter 3: Weather Map. Station Model and Weather Maps Pressure as a Vertical Coordinate Constant Pressure Maps Cross Sections
 Chapter 3: Weather Map Station Model and Weather Maps Pressure as a Vertical Coordinate Constant Pressure Maps Cross Sections Weather Maps Many variables are needed to described dweather conditions. Local
IBM Big Green Innovations Environmental R&D and Services
 IBM Big Green Innovations Environmental R&D and Services Smart Weather Modelling Local Area Precision Forecasting for Weather-Sensitive Business Operations (e.g. Smart Grids) Lloyd A. Treinish Project
Óbuda University Power System Department. The wind. Dr. Péter Kádár Óbuda University, Power System Department, Hungary kadar.peter@kvk.uni-obuda.
 The wind Dr. Péter Kádár,, Hungary kadar.peter@kvk.uni-obuda.hu Draft Wind basics Drivers of the wind energy application The energy of the wind Dynamic simulation Wind forecast Wind basics - Patra, 2012
Monsoon Variability and Extreme Weather Events
 Monsoon Variability and Extreme Weather Events M Rajeevan National Climate Centre India Meteorological Department Pune 411 005 rajeevan@imdpune.gov.in Outline of the presentation Monsoon rainfall Variability
LIDAR and Digital Elevation Data
 LIDAR and Digital Elevation Data Light Detection and Ranging (LIDAR) is being used by the North Carolina Floodplain Mapping Program to generate digital elevation data. These highly accurate topographic
CHAPTER 7 DEAD RECKONING
 CHAPTER 7 DEAD RECKONING DEFINITION AND PURPOSE 700. Definition and Use Dead reckoning is the process of determining one s present position by projecting course(s) and speed(s) from a known past position,
Chapter 4 Atmospheric Pressure and Wind
 Chapter 4 Atmospheric Pressure and Wind Understanding Weather and Climate Aguado and Burt Pressure Pressure amount of force exerted per unit of surface area. Pressure always decreases vertically with height
Statistical Study of Magnetic Reconnection in the Solar Wind
 WDS'13 Proceedings of Contributed Papers, Part II, 7 12, 2013. ISBN 978-80-7378-251-1 MATFYZPRESS Statistical Study of Magnetic Reconnection in the Solar Wind J. Enžl, L. Přech, J. Šafránková, and Z. Němeček
How To Run A Cdef Simulation
 Simple CFD Simulations and Visualisation using OpenFOAM and ParaView Sachiko Arvelius, PhD Purpose of this presentation To show my competence in CFD (Computational Fluid Dynamics) simulation and visualisation
Forecaster comments to the ORTECH Report
 Forecaster comments to the ORTECH Report The Alberta Forecasting Pilot Project was truly a pioneering and landmark effort in the assessment of wind power production forecast performance in North America.
Cloud Model Verification at the Air Force Weather Agency
 2d Weather Group Cloud Model Verification at the Air Force Weather Agency Matthew Sittel UCAR Visiting Scientist Air Force Weather Agency Offutt AFB, NE Template: 28 Feb 06 Overview Cloud Models Ground
German Test Station for Remote Wind Sensing Devices
 German Test Station for Remote Wind Sensing Devices A. Albers, A.W. Janssen, J. Mander Deutsche WindGuard Consulting GmbH, Oldenburger Straße, D-31 Varel, Germany E-mail: a.albers@windguard.de, Tel: (++9)
How to analyze synoptic-scale weather patterns Table of Contents
 How to analyze synoptic-scale weather patterns Table of Contents Before You Begin... 2 1. Identify H and L pressure systems... 3 2. Locate fronts and determine frontal activity... 5 3. Determine surface
Titelmasterformat durch Klicken. bearbeiten
 Evaluation of a Fully Coupled Atmospheric Hydrological Modeling System for the Sissili Watershed in the West African Sudanian Savannah Titelmasterformat durch Klicken June, 11, 2014 1 st European Fully
Air Masses and Fronts
 Air Masses and Fronts Air Masses The weather of the United States east of the Rocky Mountains is dominated by large masses of air that travel south from the wide expanses of land in Canada, and north from
11.6 EVALUATING SODAR PERFORMANCE AND DATA QUALITY IN SUBARCTIC WESTERN ALASKA. Cyrena-Marie Druse * McVehil-Monnett Associates
 11.6 EVALUATING PERFORMANCE AND DATA QUALITY IN SUBARCTIC WESTERN ALASKA Cyrena-Marie Druse * McVehil-Monnett Associates 1. INTRODUCTION In September 28, a Sonic Detection and Ranging () antenna and two
Database of measurements on the offshore wind farm Egmond aan Zee
 Database of measurements on the offshore wind farm Egmond aan Zee A.J. Brand J.W. Wagenaar P.J. Eecen M.C. Holtslag 1 1 TU Delft, Faculty Aerospace Engineering Presented at the the EWEA 2012 conference,
DeepWind'2013, 24-25 January, Trondheim, Norway. Measurement of wind profile with a buoy mounted lidar. Jan-Petter Mathisen
 Available online at www.sciencedirect.com Energy Procedia 00 (2013) 000 000 Energy Procedia www.elsevier.com/locate/procedia DeepWind'2013, 24-25 January, Trondheim, Norway Measurement of wind profile
A Dynamic Programming Approach for 4D Flight Route Optimization
 A Dynamic Programming Approach for 4D Flight Route Optimization Christian Kiss-Tóth, Gábor Takács Széchenyi István University, Győr, Hungary IEEE International Conference on Big Data Oct 27-30, 2014 Washington
STATUS AND RESULTS OF OSEs. (Submitted by Dr Horst Böttger, ECMWF) Summary and Purpose of Document
 Summary and Purpose of Document") WORLD METEOROLOGICAL ORGANIZATION COMMISSION FOR BASIC SYSTEMS OPEN PROGRAMMME AREA GROUP ON INTEGRATED OBSERVING SYSTEMS EXPERT TEAM ON OBSERVATIONAL DATA REQUIREMENTS AND REDESIGN OF THE GLOBAL OBSERVING
WORLD METEOROLOGICAL ORGANIZATION COMMISSION FOR BASIC SYSTEMS OPEN PROGRAMMME AREA GROUP ON INTEGRATED OBSERVING SYSTEMS EXPERT TEAM ON OBSERVATIONAL DATA REQUIREMENTS AND REDESIGN OF THE GLOBAL OBSERVING
Practice Problems on Boundary Layers. Answer(s): D = 107 N D = 152 N. C. Wassgren, Purdue University Page 1 of 17 Last Updated: 2010 Nov 22
: D = 107 N D = 152 N. C. Wassgren, Purdue University Page 1 of 17 Last Updated: 2010 Nov 22") BL_01 A thin flat plate 55 by 110 cm is immersed in a 6 m/s stream of SAE 10 oil at 20 C. Compute the total skin friction drag if the stream is parallel to (a) the long side and (b) the short side. D =
BL_01 A thin flat plate 55 by 110 cm is immersed in a 6 m/s stream of SAE 10 oil at 20 C. Compute the total skin friction drag if the stream is parallel to (a) the long side and (b) the short side. D =
Ionosphere Properties and Behaviors - Part 2 By Marcel H. De Canck, ON5AU
 Ionosphere Properties and Behaviors - Part 2 By Marcel H. De Canck, ON5AU I n the previous issue I explained that gyrofrequency depends on the earth s magnetic field and mentioned that this magnetic field
Mixing Heights & Smoke Dispersion. Casey Sullivan Meteorologist/Forecaster National Weather Service Chicago
 Mixing Heights & Smoke Dispersion Casey Sullivan Meteorologist/Forecaster National Weather Service Chicago Brief Introduction Fire Weather Program Manager Liaison between the NWS Chicago office and local
REGIONAL CLIMATE AND DOWNSCALING
 REGIONAL CLIMATE AND DOWNSCALING Regional Climate Modelling at the Hungarian Meteorological Service ANDRÁS HORÁNYI (horanyi( horanyi.a@.a@met.hu) Special thanks: : Gabriella Csima,, Péter Szabó, Gabriella
Current posture analysis is nothing without providing bilateral feedback aiming towards improving performance through appropriate remedial actions:
 NATIONAL UPPER-AIR NETWORK PERFORMANCE MONITORING, TASKS AND EXPERIENCE A. Kats, A. Naumov, A. Ivanov Central Aerological Observatory, Roshydromet 3 Pervomaiskaya Street, Dolgoprudny, 141700, Russian Federation
Comparison of the Vertical Velocity used to Calculate the Cloud Droplet Number Concentration in a Cloud-Resolving and a Global Climate Model
 Comparison of the Vertical Velocity used to Calculate the Cloud Droplet Number Concentration in a Cloud-Resolving and a Global Climate Model H. Guo, J. E. Penner, M. Herzog, and X. Liu Department of Atmospheric,
P3.8 INTEGRATING A DOPPLER SODAR WITH NUCLEAR POWER PLANT METEOROLOGICAL DATA. Thomas E. Bellinger
 P3.8 INTEGRATING A DOPPLER SODAR WITH NUCLEAR POWER PLANT METEOROLOGICAL DATA Thomas E. Bellinger Illinois Emergency Management Agency Springfield, Illinois 1. INTRODUCTION A Doppler sodar owned by the
How To Find Out If The Winds From The Oak Ridge Site Are Calm
 EVALUATING THE WIND DATA FROM THE AUTOMATED SURFACE OBSERVING SYSTEM IN OAK RIDGE, TENNESSEE - IS KOQT THE CALMEST SITE IN THE US? Thomas E. Bellinger, CCM Y-12 National Security Complex Oak Ridge, Tennessee
AP Physics 1 and 2 Lab Investigations
 AP Physics 1 and 2 Lab Investigations Student Guide to Data Analysis New York, NY. College Board, Advanced Placement, Advanced Placement Program, AP, AP Central, and the acorn logo are registered trademarks
WIND RESOURCE OF MICROREGIONS IN SOUTH AND NOTHEAST OF BRAZIL: AN EVALUATION OF METEROLOGICAL DATA AND COMPUTACIONAL TOOL
 EWEA 211 - Europe s Premier Wind Energy Event 1-17 March 211, Brussels, Belgium WIN RESOURCE OF MICROREGIONS IN SOUTH AN NOTHEAST OF BRAZIL: AN EVALUATION OF METEROLOGICAL ATA AN COMPUTACIONAL TOOL Jorge
Lecture 3. Turbulent fluxes and TKE budgets (Garratt, Ch 2)
") Lecture 3. Turbulent fluxes and TKE budgets (Garratt, Ch 2) In this lecture How does turbulence affect the ensemble-mean equations of fluid motion/transport? Force balance in a quasi-steady turbulent boundary
Lecture 3. Turbulent fluxes and TKE budgets (Garratt, Ch 2) In this lecture How does turbulence affect the ensemble-mean equations of fluid motion/transport? Force balance in a quasi-steady turbulent boundary
A Game of Numbers (Understanding Directivity Specifications)
") A Game of Numbers (Understanding Directivity Specifications) José (Joe) Brusi, Brusi Acoustical Consulting Loudspeaker directivity is expressed in many different ways on specification sheets and marketing
A Game of Numbers (Understanding Directivity Specifications) José (Joe) Brusi, Brusi Acoustical Consulting Loudspeaker directivity is expressed in many different ways on specification sheets and marketing
RECOMMENDATION ITU-R P.1546-1. Method for point-to-area predictions for terrestrial services in the frequency range 30 MHz to 3 000 MHz
 Rec. ITU-R P.546- RECOMMENDATION ITU-R P.546- Method for point-to-area predictions for terrestrial services in the frequency range 30 MHz to 3 000 MHz (200-2003) The ITU Radiocommunication Assembly, considering
The Map Grid of Australia 1994 A Simplified Computational Manual
 The Map Grid of Australia 1994 A Simplified Computational Manual The Map Grid of Australia 1994 A Simplified Computational Manual 'What's the good of Mercator's North Poles and Equators, Tropics, Zones
DIURNAL CYCLE OF CLOUD SYSTEM MIGRATION OVER SUMATERA ISLAND
 DIURNAL CYCLE OF CLOUD SYSTEM MIGRATION OVER SUMATERA ISLAND NAMIKO SAKURAI 1, FUMIE MURATA 2, MANABU D. YAMANAKA 1,3, SHUICHI MORI 3, JUN-ICHI HAMADA 3, HIROYUKI HASHIGUCHI 4, YUDI IMAN TAUHID 5, TIEN
Reprint 934. LIDAR Windshear Alerting System. at the Hong Kong International Airport. An Application of Information and Communication Technologies
 Reprint 934 LIDAR Windshear Alerting System at the Hong Kong International Airport An Application of Information and Communication Technologies P.W. Chan ICT Conference: The Way to Digital City Sustainable
GEOENGINE MSc in Geomatics Engineering (Master Thesis) Anamelechi, Falasy Ebere
 Anamelechi, Falasy Ebere") Master s Thesis: ANAMELECHI, FALASY EBERE Analysis of a Raster DEM Creation for a Farm Management Information System based on GNSS and Total Station Coordinates Duration of the Thesis: 6 Months Completion
Master s Thesis: ANAMELECHI, FALASY EBERE Analysis of a Raster DEM Creation for a Farm Management Information System based on GNSS and Total Station Coordinates Duration of the Thesis: 6 Months Completion
4.4 GRAPHICAL AND ANALYTICAL SOFTWARE VISUALIZATION TOOLS FOR EVALUATING METEOROLOGICAL AND AIR QUALITY MODEL PERFORMANCE
 4.4 GRAPHICAL AND ANALYTICAL SOFTWARE VISUALIZATION TOOLS FOR EVALUATING METEOROLOGICAL AND AIR QUALITY MODEL PERFORMANCE Irene Lee * Exponent Inc., Natick, Massachusetts 1. INTRODUCTION A critical part
AP1 Oscillations. 1. Which of the following statements about a spring-block oscillator in simple harmonic motion about its equilibrium point is false?
 1. Which of the following statements about a spring-block oscillator in simple harmonic motion about its equilibrium point is false? (A) The displacement is directly related to the acceleration. (B) The
Using LIDAR to monitor beach changes: Goochs Beach, Kennebunk, Maine
 Geologic Site of the Month February, 2010 Using LIDAR to monitor beach changes: Goochs Beach, Kennebunk, Maine 43 o 20 51.31 N, 70 o 28 54.18 W Text by Peter Slovinsky, Department of Agriculture, Conservation
Data Review and Analysis Program (DRAP) Flight Data Visualization Program for Enhancement of FOQA
 Flight Data Visualization Program for Enhancement of FOQA") 86 Data Review and Analysis Program (DRAP) Flight Data Visualization Program for Enhancement of FOQA Koji MURAOKA and Noriaki OKADA, Flight Systems Research Center, E-mail: muraoka@nal.go.jp Keywords:
86 Data Review and Analysis Program (DRAP) Flight Data Visualization Program for Enhancement of FOQA Koji MURAOKA and Noriaki OKADA, Flight Systems Research Center, E-mail: muraoka@nal.go.jp Keywords:
When the fluid velocity is zero, called the hydrostatic condition, the pressure variation is due only to the weight of the fluid.
 Fluid Statics When the fluid velocity is zero, called the hydrostatic condition, the pressure variation is due only to the weight of the fluid. Consider a small wedge of fluid at rest of size Δx, Δz, Δs
As a minimum, the report must include the following sections in the given sequence:
 5.2 Limits for Wind Generators and Transformer Substations In cases where the noise impact at a Point of Reception is composed of combined contributions due to the Transformer Substation as well as the
COMPARISON OF LIDARS, GERMAN TEST STATION FOR REMOTE WIND SENSING DEVICES
 COMPARISON OF LIDARS, GERMAN TEST STATION FOR REMOTE WIND SENSING DEVICES A. Albers, A.W. Janssen, J. Mander Deutsche WindGuard Consulting GmbH, Oldenburger Straße, D-31 Varel, Germany E-mail: a.albers@windguard.de,
NUMERICAL ANALYSIS OF THE EFFECTS OF WIND ON BUILDING STRUCTURES
 Vol. XX 2012 No. 4 28 34 J. ŠIMIČEK O. HUBOVÁ NUMERICAL ANALYSIS OF THE EFFECTS OF WIND ON BUILDING STRUCTURES Jozef ŠIMIČEK email: jozef.simicek@stuba.sk Research field: Statics and Dynamics Fluids mechanics
Developing Continuous SCM/CRM Forcing Using NWP Products Constrained by ARM Observations
 Developing Continuous SCM/CRM Forcing Using NWP Products Constrained by ARM Observations S. C. Xie, R. T. Cederwall, and J. J. Yio Lawrence Livermore National Laboratory Livermore, California M. H. Zhang
INVISIBLE TURBULENCE IN VICINITY OF CB / CUMULUS CELL
 In the following work a new approach to understanding some hidden facts about the Turbulence associated with CB & Cumulus clouds and methods to avoid it so as to promote comfortable flights have been explained
The relationships between Argo Steric Height and AVISO Sea Surface Height
 The relationships between Argo Steric Height and AVISO Sea Surface Height Phil Sutton 1 Dean Roemmich 2 1 National Institute of Water and Atmospheric Research, New Zealand 2 Scripps Institution of Oceanography,
Can latent heat release have a negative effect on polar low intensity?
 Can latent heat release have a negative effect on polar low intensity? Ivan Føre, Jon Egill Kristjansson, Erik W. Kolstad, Thomas J. Bracegirdle and Øyvind Sætra Polar lows: are intense mesoscale cyclones
ebb current, the velocity alternately increasing and decreasing without coming to
 Slack water (slack tide): The state of a tidal current when its velocity is near zero, especially the moment when a reversing current changes its direction and its velocity is zero. The term is also applied
Chapter 07 Test A. Name: Class: Date: Multiple Choice Identify the choice that best completes the statement or answers the question.
 Class: Date: Chapter 07 Test A Multiple Choice Identify the choice that best completes the statement or answers the question. 1. An example of a vector quantity is: a. temperature. b. length. c. velocity.
APPENDIX 3-B Airplane Upset Recovery Briefing. Briefing. Figure 3-B.1
 APPENDIX 3-B Airplane Upset Recovery Briefing Industry Solutions for Large Swept-Wing Turbofan Airplanes Typically Seating More Than 100 Passengers Briefing Figure 3-B.1 Revision 1_August 2004 Airplane
RAPIDS Operational Blending of Nowcasting and NWP QPF
 RAPIDS Operational Blending of Nowcasting and NWP QPF Wai-kin Wong and Edwin ST Lai Hong Kong Observatory The Second International Symposium on Quantitative Precipitation Forecasting and Hydrology 5-8
Turbulence assessment with ground based LiDARs
 Turbulence assessment with ground based LiDARs E.T.G. Bot June 214 ECN-E--14-43 Acknowledgement The LAWINE project is partially funded by the Dutch government in the framework of TKI Wind op Zee. Abstract
WEATHER THEORY Temperature, Pressure And Moisture
 WEATHER THEORY Temperature, Pressure And Moisture Air Masses And Fronts Weather Theory- Page 77 Every physical process of weather is a result of a heat exchange. The standard sea level temperature is 59
Supporting document to NORSOK Standard C-004, Edition 2, May 2013, Section 5.4 Hot air flow
 1 of 9 Supporting document to NORSOK Standard C-004, Edition 2, May 2013, Section 5.4 Hot air flow A method utilizing Computational Fluid Dynamics (CFD) codes for determination of acceptable risk level
Synoptic assessment of AMV errors
 NWP SAF Satellite Application Facility for Numerical Weather Prediction Visiting Scientist mission report Document NWPSAF-MO-VS-038 Version 1.0 4 June 2009 Synoptic assessment of AMV errors Renato Galante
AIRCRAFT PERFORMANCE Pressure Altitude And Density Altitude
 Performance- Page 67 AIRCRAFT PERFORMANCE Pressure Altitude And Density Altitude Pressure altitude is indicated altitude corrected for nonstandard pressure. It is determined by setting 29.92 in the altimeter
This chapter discusses: 1. Definitions and causes of stable and unstable atmospheric air. 2. Processes that cause instability and cloud development
 Stability & Cloud Development This chapter discusses: 1. Definitions and causes of stable and unstable atmospheric air 2. Processes that cause instability and cloud development Stability & Movement A rock,
Straits of Mackinac Contaminant Release Scenarios: Flow Visualization and Tracer Simulations
 Straits of Mackinac Contaminant Release Scenarios: Flow Visualization and Tracer Simulations Research Report for the National Wildlife Federation Great Lakes Regional Center By David J. Schwab, Ph.D.,