What the Science Shows Us about How Sea Level Rise and Weather Events Will Affect Ports
|
|
|
- Beatrix Cross
- 7 years ago
- Views:
Transcription
1 What the Science Shows Us about How Sea Level Rise and Weather Events Will Affect Ports AAPA Climate Change Workshop January 27, 2011 Richard Edwing

2 Outline Sea Level Change Global and Relative Sea Level Trends and Projections Incorporating Sea Level Guidance Other Impacts of Climate Change


3 Sea Level Change Two Distinct Attributes Global Sea Level The average height of all the Earth's oceans Caused by the global change in the volume of water in the world s oceans in response to three climatological processes: 1. Ocean volume change associated with the ice ages 2. Density changes from total salinity 3. Heat content of the world s ocean, which recent literature suggests may be potentially accelerating due to global warming Relative Sea Level The local change in sea level relative to the elevation of the land at a specific point on the coast.
4 mm Global Sea Level The Global Mean Sea Level Trend From Tide Gauges & Altimetry Suggests a recent Acceleration Satellite altimetry (green) ~2.9 mm/yr 1993-present Holgate and Woodworth, 2004 (blue) ~1.7 mm/yr Church et al., 2006 (red) ~0.7 mm/yr, ; then 1.8 mm/yr Two primary causes of global sea level rise: Thermal expansion Addition of water volume (glaciers, ice sheets, etc)
5 Global Sea Level - The Satellite Altimeter Record The overall global rate from multiple missions. Coverage from 60N to 60S from 1993 to present. There is a diversity of regional rates from satellite altimetry that go into the computation of the overall global rate.

6 Sea Level Rise Trends and Projections IPCC, 2007 IPCC, 2001 Rahmstorf (2007) The Intergovernmental Panel on Climate Change (IPCC) 2007 report projected a 18 to 59 cm sea level rise from a 1.1 and 6.4 C temperature increase during the 21 st century. The Rahmstorf (2007) projection (in gray in the above graphic) considers potential contributions from accelerated ice melt in Greenland and Antarctica which IPCC did not consider.
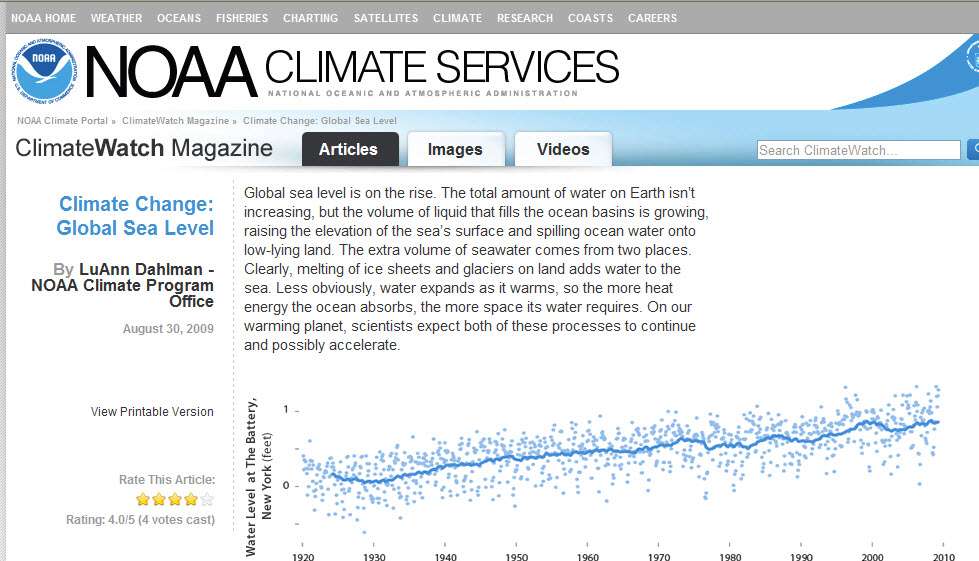
7 Global Sea Level

8 Mean sea level is locally derived through observations at tide stations and tied to bench marks on land Local mean sea level is dynamic and influenced by : Global Sea level Astronomical Tides Seasonal To Decadal Oceanographic/Meteorological Processes Local Land Movement Local Mean Sea Level National Water Level Observation Network 210 Permanent Stations Some coastal areas are particularly susceptible to local sea level rise GRAND ISLE, LOUISIANA LOWER CHESAPEAKE BAY.

9 ELEVATION DIFFERENCE (meters) National Tidal Datum Epoch (NTDE) A specific 19-year period that includes the longest periodic tidal variations caused by the astronomic tide-producing forces. Averages out seasonal meteorological, hydrologic, and oceanographic fluctuations AVERAGE DIFFERENCES IN 19-YEAR MSL BETWEEN EPOCHS USING 32 LONG TERM STATIONS m m m NTDE s are updated over time to account for sea level change relative to the land. The present NTDE is NOAA s 0 CENTER for OPERATIONAL OCEANOGRAPHIC PRODUCTS and SERVICES

10 Sea Levels Online Only source for local sea level trends in the United States Major contributor to Global Sea Level determination

11 Extremes in Relative Sea Level Trends Regional land subsidence Regional land isostatic rebound

12 Incorporating Sea Level Change into Decision-Making New Orleans Popular Island Chesapeake Bay Incorporating sea level in civil works programs Photo Credit: USACE Incorporating sea level change into restoration guidance
13 Incorporating Sea Level Change into Guidance Documents Water Resource Policies and Authorities Incorporating Sea- Level Change Considerations in Civil Works Programs (USACE) Decision-Making Programmatic Framework for Considering Climate Change Impacts in Coastal Habitat Restoration, Land Acquisition, and Facility Development Investments (NOAA)

14 USACE Engineering Guidance: EC Approach to Incorporate Projected Future Sea Level Change into the Encinitas & Solana Beach Shoreline Protection Feasibility Study.

15 US DOT Impact Study This study (October 2008) was designed to produce high level estimates of the net effect of sea level rise and storm surge on the national transportation network. It was designed primarily to aid policy makers at the U.S. Department of Transportation by providing estimates of these effects as they relate to roads, rails, airports and ports.
 to incorporate storm surge for various sea-level rise")
16 US DOT Impact Study The study applied existing predictions of global sea level rise from the Intergovernmental Panel on Climate Change s (IPCC) Third and Fourth Assessment Reports The study constructed maps based on DEM s using NOAA data for a MHHW surface and Highest Observed Water Levels (HOWL) to incorporate storm surge for various sea-level rise scenarios
 Earlier periods, such as from 1945 to 1970 (and perhaps earlier), were apparently as active as the most recent decade. The past decade has seen increased U.S.")
17 Other Climate Change Impacts Relationships to Increased Intensity and Frequency of storms Atlantic hurricane seasons since 1995 have been significantly more active, e.g. more hurricanes and more intense hurricanes, than the previous two decades. (figure 1) Earlier periods, such as from 1945 to 1970 (and perhaps earlier), were apparently as active as the most recent decade. The past decade has seen increased U.S. landfalls, however periods of even higher landfalls occurred early in the century. (figure 2)
18 Other Climate Change Impacts Relationships to Increased Intensity and Frequency of storms Our science is not mature enough to determine what percentage of anthropogenic climate change and what percentage of natural climate variability is driving our current hurricanes. Scientists disagree as to whether currently a sound basis exists for making projections on how long the current active period will last. Limited understanding of natural decadal variability, combined with its irregular temporal behavior, preclude definitive statements about how long the active period will last. Natural decadal variability suggests high levels of hurricane activity and U.S. landfalls for the next decade and beyond since the previous active period ( ) lasted at least 25 years. Warming suggests more intense hurricanes (e.g., as increasing surface temperatures provide energy for storm intensification), and some non-noaa scientists suggest global warming will cause the current active period to persist.

19 Other Climate Change Impacts Hydrologic cycles Temperature Salinity Waves Lake Huron shoreline near Georgian Bay, Canada. Researchers have found a gradual decline in water level in Lake Huron and Lake Michigan, since (Credit: istockphoto)
20 Great Lakes Great Hydrologic Lakes Hydrologic Cycles and Climate CyclesVariability LWD NOAA Chart Datum LWD NOAA Chart Datum
,")
21 Summary Wave Climate is changing in response to changes in weather (and wind) patterns and ocean temperature Expect increasing conditions Studies continue, stay tuned! Sea Level Rise impacts initially appear during events High water, high waves, high wave runup Expect increasing frequency We depend on, and are limited by existing data Short records (~35 years), gaps, few extremes Climate changing, not stationary Climate Change: Waves
22 Emerging New Products

23 Emerging New Products

24 NOAA Coastal Services Center
25
26 Additional Resources NOAA Climate Services: Useful links from the ICC: CCSP, 2009: Coastal Sensitivity to Sea-Level Rise: A Focus on the Mid-Atlantic Region. A report by the U.S. Climate Change Science Program and the Subcommittee on Global Change Research. [James G. Titus (Coordinating Lead Author), K. Eric Anderson, Donald R. Cahoon, Dean B. Gesch, Stephen K. Gill, Benjamin T. Gutierrez, E. Robert Thieler, and S. Jeffress Williams (Lead Authors)]. U.S. Environmental Protection Agency, Washington D.C., USA, 320 pp. Church, J.A., Aarup T., Woodworth P.L., Wilson W.S., Nicholls R.J., Rayner R., Lambeck K., Mitchum G.T., Steffen K., Cazenave A., Blewitt G., Mitrovica J.X. and Lowe J.A. (2010) Sea Level Rise and Variability Synthesis and Outlook for the Future. (Chapter 13 in Understanding Sea Level Rise and Variability eds. Church J.A., Woodworth P.L., Aarup T. and Wilson W.S. Wiley-Blackwell) NOAA Technical Report NOS Technical Considerations for Use of Geospatial Data in Sea Level Change Mapping and Assessment (will be available online soon). CCSP, 2008: Impacts of Climate Change and Variability on Transportation Systems and Infrastructure: Gulf Coast Study, Phase I. A Report by the U.S. Climate Change Science Program and the Subcommittee on Global Change Research [Savonis, M. J., V.R. Burkett, and J.R. Potter (eds.)]. Department of Transportation, Washington, DC, USA, 445 pp.

27 Questions
28 Background

29 SOURCE: R.S.NEREM, BOWIE LECTURE FALL AGU 2005
30 References NRC Responding to Changes in Sea Level, Engineering Implications, Committee on Engineering Implications of Changes in Relative Mean Sea Level, Marine Board, Commission on Engineering and Technical Systems, National Research Council. National Academy Press, Washington DC 1987, 148pp. IPCC Climate Change 2001: The Scientific Basis, edited by J.T. Houghton et al., Cambridge University Press, Cambridge, U.K. IPCC Climate Change 2007: The Physical Science basis. Contribution of Working Group I to the Fourth Assessment Report of the Intergovernmental Panel on Climate Change, edited by S. Solomon et al., Cambridge University press, Cambridge U.K. Rahmstorf, S A semi-empirical approach to projecting future sea level rise, Science, 315, no. 5810, pp Horton, R., et al., Sea level rise projections for current generation CGCMs based on the semiempirical method, Geophysical Research Letters, Vol. 35, L02715, Pfeffer, W.T., et al., Kinematic constraints on glacier contributions to 21 st-century sea level rise, Science, 321, no. 5894, pp Vermeer, M., and S. Rahmstorf Global sea level linked to global temperature, Proceedings of the National Academy of Sciences, Early Edition, October 2009, 6pp. Jevrejeva, S., et al., How will sea level respond to changes in natural and anthropogenic forcings by 2100?, Geophysical Research Letters, Vol. 37, L07703, 2010.
31 The ground elevation at BM 2075A will become increasingly inundated even if the present day relative sea level rise (RSLR) remains constant in the future. Estimated Effects of RSLR on Frequency and Duration of Inundation for Port Fourchon, LA Using Present Rate of Sea Level Rise Using Ground Elevation at Bench Mark 2075 A Occurrences of Inundation 5-yr Time Period RSLR rate mm/yr) (# of tides) Duration of Inundation (hours (percent of total time)) Elevation Rise Above 2010 MSL (meters) (<1%) (<1%) (19%) 0.8 Note: In , and in 2050, the average inundation above ground level occurs only during major storm events. In 2100, inundation would occur at many of the normal daily high tides as well, with average inundation of 0.10m.

32 Key Impacts Climate Change Impacts: More Intense Storm Impacts Ship and ground traffic delays Port closure Shipping service disruptions Evacuations Debris and infrastructure damage Missouri River flooding, 1993 Hurricane Ike damage (Source: NOAA)
 above Mean Higher High Water (MHHW). T he ground elevation at BM 2075A will become increasingly inundated even if the present day relative sea level rise (RSLR) of 9.")
33 Impacts of Relative Sea Level Rise at Port Fourchon, LA Tidal bench mark elevations can be used to estimate ground elevations. Bench Mark 2075A 2003 is 0.638m (2.09ft) above Mean Higher High Water (MHHW). T he ground elevation at BM 2075A will become increasingly inundated even if the present day relative sea level rise (RSLR) of 9.24 mm/yr remains constant in the future. In , and in 2050, the average inundation above ground level occurs only during major storm events. In 2100, inundation would occur at many of the normal daily high tides as well, with average inundation of 0.10m. Location of Bench Mark A 2003 In
34 Elevation relative to ground level (meters) PORT FOURCHON, LA - Observed Inundation Above Ground Level at BM "2075A" during Hurricane Gustav in September Tide gauge limit exceeded Ground at BM A was inundated only once in 5- year period : : : : : : : : :00 Time
35 Elevation above ground level (meters) PORT FOURCHON, LA - Project inundation Above Ground Level at BM "2075A" for a Gustav-type Storm in 2100 using a RSLR of 9.24 mm/yr Tide gauge limit exceeded Ground level at BM A would be inundated 569 times for a total of 405 hours for a similar 5-year period : : : : : : : : :00 Time
Sea Level Change. Miami-Dade Sea Level Rise Task Force
 Sea Level Change and LongProgram Range Everglades Restoration Climate Water Resources Planning for Florida Change Application Concerns of USACE andguidance Draft Sea Level on Sea Rise Level Planning Change
DEPARTMENT OF THE ARMY ER 1100-2-8162 U.S. Army Corps of Engineers CECW-CE Washington, DC 20314-1000 CECW-P
 DEPARTMENT OF THE ARMY ER 1100-2-8162 U.S. Army Corps of Engineers CECW-CE Washington, DC 20314-1000 CECW-P Regulation No. 1100-2-8162 31 December 2013 INCORPORATING SEA LEVEL CHANGE IN CIVIL WORKS PROGRAMS
South Florida Sea Level Rise Projections and Flood Risk Concerns
 South Florida Sea Level Rise Projections and Flood Risk Concerns MIAMI MIAMI Biscayne Bay Glenn B. Landers, P.E. Planning and Policy Division Jacksonville District EVERGLADES NATIONAL PARK USACE Flood
Changes in past, present and future sea level, focusing on the Norwegian west coast. J. E. Ø. Nilsen, K. Richter og H. Drange
 Changes in past, present and future sea level, focusing on the Norwegian west coast J. E. Ø. Nilsen, K. Richter og H. Drange Assessing sea level during the last 50 years Status for today s sea level Estimate
Impacts of Global Warming on Hurricane-related Flooding in Corpus Christi,Texas
 Impacts of Global Warming on Hurricane-related Flooding in Corpus Christi,Texas Sea-level Rise and Flood Elevation A one-foot rise in flood elevation due to both sea-level rise and hurricane intensification
How To Predict Climate Change In Tonga
 Niuatoputapu Niuafo'ou Late Island Vava u Group South Pacific Ocean Tofua Island Kotu Group Nomuka Group Ha apai Group NUKU ALOFA Eua Island Tongatapu Group Current and future climate of Tonga > Tonga
Storm tide is the water level rise during a storm due to the combination of storm surge and the astronomical tide.
 INTRODUCTION TO STORM SURGE Introduction to Storm Surge BOLIVAR PENINSULA IN TEXAS AFTER HURRICANE IKE (2008) What is Storm Surge? Inland Extent Storm surge can penetrate well inland from the coastline.
Projecting climate change in Australia s marine environment Kathleen McInnes
 Projecting climate change in Australia s marine environment Kathleen McInnes CSIRO Oceans and Atmosphere Flagship Centre for Australian Climate and Weather Research Framing of the problem IMPACTS EMISSIONS
Swedish Sea Level Series. A Climate Indicator
 Swedish Sea Level Series - A Climate Indicator THOMAS HAMMARKLINT Swedish Meteorological and Hydrological Institute (SMHI) December 2009 The mareograph building on the island Skeppsholmen in Stockholm,
Storm tide is the water level rise during a storm due to the combination of storm surge and the astronomical tide.
 INTRODUCTION TO STORM SURGE Introduction to Storm Surge National Hurricane Center Storm Surge Unit BOLIVAR PENINSULA IN TEXAS AFTER HURRICANE IKE (2008) What is Storm Surge? Inland Extent Storm surge can
Sea-level & Climate Change in NJ: Should I Sell My Shore House?!
 Sea-level & Climate Change in NJ: Should I Sell My Shore House?! Ken Miller, Dept. Earth & Planetary Sciences, Rutgers! School of Arts and Sciences Hurricane Isabelle, Avalon, 9/18/2003! http://www.geocities.com/jfm292/lbi92storm/lbi92storm1.htm!
Jessica Blunden, Ph.D., Scientist, ERT Inc., Climate Monitoring Branch, NOAA s National Climatic Data Center
 Kathryn Sullivan, Ph.D, Acting Under Secretary of Commerce for Oceans and Atmosphere and NOAA Administrator Thomas R. Karl, L.H.D., Director,, and Chair of the Subcommittee on Global Change Research Jessica
Data Sets of Climate Science
 The 5 Most Important Data Sets of Climate Science Photo: S. Rahmstorf This presentation was prepared on the occasion of the Arctic Expedition for Climate Action, July 2008. Author: Stefan Rahmstorf, Professor
Tide - rhythmic oscillation of the ocean surface due to gravitational & centrifugal forces ( inertia ) between the Earth, Moon and Sun.
 between the Earth, Moon and Sun.") Chapter 4: The Changing Level of the Sea Tides Longer Scale Variations Influence on Beaches Tide - rhythmic oscillation of the ocean surface due to gravitational & centrifugal forces ( inertia ) between
Chapter 4: The Changing Level of the Sea Tides Longer Scale Variations Influence on Beaches Tide - rhythmic oscillation of the ocean surface due to gravitational & centrifugal forces ( inertia ) between
Climate Ready Tools & Resources
 August 2, 2013 Mission Statement To provide the water sector (drinking water, wastewater, and stormwater utilities) with the practical tools, training, and technical assistance needed to adapt to climate
Impacts of Sea-Level Rise on National Wildlife Refuges
 Impacts of Sea-Level Rise on National Wildlife Refuges Considerations for Land Protection Priorities Photo: National Oceanic and Atmospheric Administration O ne of the well-documented impacts of climate
Sea-Level Rise in Florida the Facts and Science
 Florida Sea Grant College Program Building 803 McCarty Drive A statewide university program for P O Box 110400 Coastal Research, Education & Extension Gainesville, FL 32611-0400 U.S.A. www.flseagrant.org
Tools from the US EPA s Climate Ready Water Utilities Initiative (CRWU) EPA Region 3 Conference Extreme Weather Events: Adapt, Mitigate, and Survive
 EPA Region 3 Conference Extreme Weather Events: Adapt, Mitigate, and Survive") Tools from the US EPA s Climate Ready Water Utilities Initiative (CRWU) EPA Region 3 Conference Extreme Weather Events: Adapt, Mitigate, and Survive May 9, 2013 1 Presentation Overview Background on EPA
Tools from the US EPA s Climate Ready Water Utilities Initiative (CRWU) EPA Region 3 Conference Extreme Weather Events: Adapt, Mitigate, and Survive May 9, 2013 1 Presentation Overview Background on EPA
Sea Level Rise and Coastal Flood Web Tools Comparison Matrix - Oregon GENERAL
 Geographic Scope Organization/Sponsor Link Geographic extent the tool defines or covers (i.e. national, statewide, county ) The organization and/or sponsor of the mapping tool. The URL or link where the
climate science A SHORT GUIDE TO This is a short summary of a detailed discussion of climate change science.
 A SHORT GUIDE TO climate science This is a short summary of a detailed discussion of climate change science. For more information and to view the full report, visit royalsociety.org/policy/climate-change
Future needs of remote sensing science in Antarctica and the Southern Ocean: A report to support the Horizon Scan activity of COMNAP and SCAR
 Future needs of remote sensing science in Antarctica and the Southern Ocean: A report to support the Horizon Scan activity of COMNAP and SCAR Thomas Wagner (thomas.wagner@nasa.gov) Charles Webb NASA Cryospheric
Climate Extremes Research: Recent Findings and New Direc8ons
 Climate Extremes Research: Recent Findings and New Direc8ons Kenneth Kunkel NOAA Cooperative Institute for Climate and Satellites North Carolina State University and National Climatic Data Center h#p://assessment.globalchange.gov
A Project to Create Bias-Corrected Marine Climate Observations from ICOADS
 A Project to Create Bias-Corrected Marine Climate Observations from ICOADS Shawn R. Smith 1, Mark A. Bourassa 1, Scott Woodruff 2, Steve Worley 3, Elizabeth Kent 4, Simon Josey 4, Nick Rayner 5, and Richard
Sea level scenarios and extreme weather events
 Extreme weather and nuclear power plants (EXWE) Sea level scenarios and extreme weather events Milla Johansson, Kimmo Kahma, Hilkka Pellikka, Hanna Tietäväinen, Seppo Saku and Kirsti Jylhä Finnish Meteorological
Global Sea Level Rise Scenarios for the United States National Climate Assessment. December 6, 2012
 Global Sea Level Rise Scenarios for the United States National Climate Assessment December 6, 2012 Photo P Ph ho ott o p pr provided ro ov v iid d ed de ed b by y tth the he G Gr Greater re ea a te t e
ARI: The water-mass signature and pathways of Greenland Ice Sheet meltwater in the Arctic and North Atlantic as inferred by an inverse method
 Final Report ARI: The water-mass signature and pathways of Greenland Ice Sheet meltwater in the Arctic and North Atlantic as inferred by an inverse method Geoffrey Gebbie Department of Physical Oceanography
Climate Change and Infrastructure Planning Ahead
 Climate Change and Infrastructure Planning Ahead Climate Change and Infrastructure Planning Ahead Infrastructure the physical facilities that support our society, such as buildings, roads, railways, ports
with Climate Change Risk: MWCOG Climate Impacts Symposium May 21, 2012
 Storm Sewer Infrastructure Planning with Climate Change Risk: A Case Study from Alexandria VA Laurens van der Tak, PE, D.WRE MWCOG Climate Impacts Symposium May 21, 2012 Presentation Topics Overview of
INCORPORATING SEA LEVEL CHANGE SCENARIOS AT THE LOCAL LEVEL
 INCORPORATING SEA LEVEL CHANGE SCENARIOS AT THE LOCAL LEVEL THIS REPORT PREPARED BY THE FOLLOWING AGENCIES: NOAA Coastal Services Center Margaret Davidson, Director www.csc.noaa.gov NOAA Center for Operational
Estimates of Future Sea-Level Changes for Norway
 Estimates of Future Sea-Level Changes for Norway March 26, 2012 Matthew Simpson, Kristian Breili, Halfdan Pascal Kierulf, Dagny Lysaker, Mohammed Ouassou and Even Haug Please reference this report as Simpson,
The GLOSS Delayed Mode Data Centre and the GLOSS Implementation Plan 2012
 doi:10.5194/piahs-365-6-2015 6 Complex Interfaces Under Change: Sea River Groundwater Lake Proceedings of HP2/HP3, IAHS-IAPSO-IASPEI Assembly, Gothenburg, Sweden, July 2013 (IAHS Publ. 365, 2014). The
Jurisdictional Boundaries. And. Establishment of Mean Low Water
 Jurisdictional Boundaries And Establishment of 28.2-1202. Rights of owners to extend to mean low-water mark. A. The limits or bounds of the tracts of land lying on the bays, rivers, creeks and shores within
Geohazards: Minimizing Risk, Maximizing Awareness The Role of the Insurance Industry
 Geohazards: Minimizing Risk, Maximizing Awareness The Role of the Insurance Industry Prof. Dr. Peter Hoeppe Head of Geo Risks Research Munich Re International Year of Planet Earth, Paris, 13 February 2008
Climate Change in Coastal Florida: Economic Impacts of Sea Level Rise
 Climate Change in Coastal Florida: Economic Impacts of Sea Level Rise CLIMTE CHNGE IN COSTL FLORID: ECONOMIC IMPCTS OF SE LEVEL RISE Context Global warming is expected to cause: Sea level rise Increased
CIESIN Columbia University
 Conference on Climate Change and Official Statistics Oslo, Norway, 14-16 April 2008 The Role of Spatial Data Infrastructure in Integrating Climate Change Information with a Focus on Monitoring Observed
NOAA s National Climatic Data Center
 NOAA s National Climatic Data Center World s Largest Archive of Climate and Weather Data Presented to: Quarterly Meeting, Subcommittee of Hydrology, ACWI 23 October 2014 Dongsoo Kim, Ph.D. Project Scientist
Sea-level Rise Projections
 Updating Maryland s Sea-level Rise Projections Scientific and Technical Working Group Maryland Climate Change Commission June 26, 2013 1 5 8 16 18 Table of contents Introduction 1 Sea-level Rise and the
Impacts of Global Warming on North Carolina s Coastal Economy
 Impacts of Global Warming on North Carolina s Coastal Economy IMPACTS OF GLOBAL WARMING ON NORTH CAROLINA S COASTAL ECONOMY Key Findings Global warming is projected to have significant impacts on North
Hurricanes and Storm Surge www.hcfcd.org/tropicalweather
 Hurricanes and Storm Surge www.hcfcd.org High-level winds fl ow outward Strong surface winds spiral inward EYE Calm, sometimes cloudfree, sinking air Air sinks in calm area at the storm s eye THUNDERSTORMS
Community Engagement and Cost Benefit Analysis for Sea Level Rise and Storm Surge Adaptation
 Community Engagement and Cost Benefit Analysis for Sea Level Rise and Storm Surge Adaptation Methods, Case Studies, and Wetland-specific Opportunities Samuel B. Merrill, Ph.D. December 10, 2012 Muskie
Malcolm L. Spaulding Professor Emeritus, Ocean Engineering University of Rhode Island Narragansett, RI 02881
 Malcolm L. Spaulding Professor Emeritus, Ocean Engineering University of Rhode Island Narragansett, RI 02881 USACE Coastal and Hydraulics Laboratory(CHL) Data Infrastructure Workshop January 23, 2014 Overview
Climate Change: A Local Focus on a Global Issue Newfoundland and Labrador Curriculum Links 2010-2011
 Climate Change: A Local Focus on a Global Issue Newfoundland and Labrador Curriculum Links 2010-2011 HEALTH Kindergarten: Grade 1: Grade 2: Know that litter can spoil the environment. Grade 3: Grade 4:
AIR TEMPERATURE IN THE CANADIAN ARCTIC IN THE MID NINETEENTH CENTURY BASED ON DATA FROM EXPEDITIONS
 PRACE GEOGRAFICZNE, zeszyt 107 Instytut Geografii UJ Kraków 2000 Rajmund Przybylak AIR TEMPERATURE IN THE CANADIAN ARCTIC IN THE MID NINETEENTH CENTURY BASED ON DATA FROM EXPEDITIONS Abstract: The paper
W.C. Rusty Riese, PhD Adjunct Professor, Rice University
 W.C. Rusty Riese, PhD Adjunct Professor, Rice University What are we being told? What are the data? What are the take-aways? What are your responsibilities? Mann Hockey Stick Curve The Arctic is melting
Extra-Tropical Cyclones in a Warming Climate:
 Extra-Tropical Cyclones in a Warming Climate: Observational Evidence of Trends in Frequencies and Intensities in the North Pacific, North Atlantic, & Great Lakes Regions David Levinson Scientific Services
UK sea level 26 June 2013
 26 June 213 Change in sea level since 192 Change in sea level since 192 Data summary This report reviews the five longest sea level records in the UK; namely those are in Aberdeen (1862-211), Liverpool
Climate Change in North Carolina
 Climate Change in North Carolina Dr. Chip Konrad Director of the The Southeast Regional Climate Center Associate Professor Department of Geography University of North Carolina at Chapel Hill The Southeast
A Self Assessment to Address Climate Change Readiness in Your Community Midwest Region
 A Self Assessment to Address Climate Change Readiness in Your Community Midwest Region 0 Climate Change Readiness Index A Self Assessment to Address Climate Change Readiness in Your Community Communities
United States Postal Service Climate Change Adaptation Plan
 United States Postal Service Climate Change Adaptation Plan Version: June 29, 2012 USPS Climate Change Adaptation Plan 1. Introduction...2 2. Policy Framework...3 Vision & Goals...3 Objectives...3 Responsible
NCDC Strategic Vision
 NOAA s National Climatic Data Center World s Largest Archive of Climate and Weather Data Presented to: Coastal Environmental Disasters Data Management Workshop September 16, 2014 Stephen Del Greco Deputy
Federal Emergency Management Agency (FEMA) Preliminary Flood Insurance Rate Maps (FIRMs) and Preliminary Flood Insurance Study (FIS) for New York City
 Preliminary Flood Insurance Rate Maps (FIRMs) and Preliminary Flood Insurance Study (FIS) for New York City") March 10, 2014 Submitted electronically via http://www.nyc.gov Mayor s Office of Long Term Planning and Sustainability c/o Flood Map Comments 253 Broadway, 10th Floor New York, NY 10007 Federal Emergency
March 10, 2014 Submitted electronically via http://www.nyc.gov Mayor s Office of Long Term Planning and Sustainability c/o Flood Map Comments 253 Broadway, 10th Floor New York, NY 10007 Federal Emergency
SECTION 3.2 CLIMATE AND PRECIPITATION
 SECTION 3.2 CLIMATE AND PRECIPITATION Ulster County Climate Data A preliminary analysis of the Preserve s weather data shows that the average temperature has risen about two degrees over the past 114 years.
FRENCH ARCTIC INITIATIVE SCIENTIFIC PRIORITIES
 FRENCH ARCTIC INITIATIVE SCIENTIFIC PRIORITIES J.J. Pangrazi / Biosphoto J.J. Pangrazi / Biosphoto Conference audience Edouard Bard introductory lecture Dr. Denis-Didier Rousseau (CNRS Senior Research
Basic Climatological Station Metadata Current status. Metadata compiled: 30 JAN 2008. Synoptic Network, Reference Climate Stations
 Station: CAPE OTWAY LIGHTHOUSE Bureau of Meteorology station number: Bureau of Meteorology district name: West Coast State: VIC World Meteorological Organization number: Identification: YCTY Basic Climatological
Water Monitoring System Website User Guide www.fldep-stevens.com
 Florida Department of Environmental Protection Division of State Lands Bureau of Survey and Mapping Water Monitoring System Website User Guide www.fldep-stevens.com Provided by Stevens Water Monitoring
Monsoon Variability and Extreme Weather Events
 Monsoon Variability and Extreme Weather Events M Rajeevan National Climate Centre India Meteorological Department Pune 411 005 rajeevan@imdpune.gov.in Outline of the presentation Monsoon rainfall Variability
Real-time Ocean Forecasting Needs at NCEP National Weather Service
 Real-time Ocean Forecasting Needs at NCEP National Weather Service D.B. Rao NCEP Environmental Modeling Center December, 2005 HYCOM Annual Meeting, Miami, FL COMMERCE ENVIRONMENT STATE/LOCAL PLANNING HEALTH
Vulnerability of Major Wastewater Facilities to Flooding from Sea-Level Rise. July 2008
 Vulnerability of Major Wastewater Facilities to Flooding from Sea-Level Rise July 2008 King County's Wastewater Treatment Division maintains 77 major facilities, 40 of which are situated adjacent to tidally
Planning for sea level rise. Assessing development in areas prone to tidal inundation from sea level rise in the Port Phillip and Westernport Region
 Planning for sea level rise Assessing development in areas prone to tidal inundation from sea level rise in the Port Phillip and Westernport Region Table of contents Introduction 1 New flood levels for
Storm Surge: A Rising Danger by Andrew M. Dzambo
 Storm Surge: A Rising Danger by Andrew M. Dzambo Citizens of the United States are migrating towards the nation s coasts; according to the U.S. Census Bureau, the U.S. coastal watershed county population
ebb current, the velocity alternately increasing and decreasing without coming to
 Slack water (slack tide): The state of a tidal current when its velocity is near zero, especially the moment when a reversing current changes its direction and its velocity is zero. The term is also applied
Norconsult AS Trekanten, Vestre Rosten 81, NO-7075 Tiller Memo no.: 1 Tel: +47 72 89 37 50 Fax: +47 72 88 91 09
 Norconsult AS Trekanten, Vestre Rosten 81, NO-7075 Tiller Memo no.: 1 To: Norconsult/ T Isaksen From: Arne E Lothe Date: 2014-06-25 MetOcean data at Gamnes, Kirkenes, Norway Table of Contents Versions
Submission by the United States of America to the UN Framework Convention on Climate Change Communication of U.S. Adaptation Priorities May 29, 2015
 Submission by the United States of America to the UN Framework Convention on Climate Change Communication of U.S. Adaptation Priorities May 29, 2015 Adaptation is a challenge for all Parties. In addition
Coastal Risk Management Guide. Incorporating sea level rise benchmarks in coastal risk assessments
 Coastal Risk Management Guide Incorporating sea level rise benchmarks in coastal risk assessments Published by: Department of Environment, Climate Change and Water NSW 59 61 Goulburn Street PO Box A290
GUIDANCE FOR INCORPORATING SEA LEVEL RISE INTO CAPITAL PLANNING IN SAN FRANCISCO: ASSESSING VULNERABILITY, RISK, AND ADAPTATION (DRAFT)
") GUIDANCE FOR INCORPORATING SEA LEVEL RISE INTO CAPITAL PLANNING IN SAN FRANCISCO: ASSESSING VULNERABILITY, RISK, AND ADAPTATION (DRAFT) Prepared by the Sea Level Rise Committee of SF Adapt for the San
GUIDANCE FOR INCORPORATING SEA LEVEL RISE INTO CAPITAL PLANNING IN SAN FRANCISCO: ASSESSING VULNERABILITY, RISK, AND ADAPTATION (DRAFT) Prepared by the Sea Level Rise Committee of SF Adapt for the San
New Coastal Study for Puerto Rico FIRMs. Paul Weberg, FEMA RII Mat Mampara, Dewberry Jeff Gangai, Dewberry Krista Collier, Baker
 New Coastal Study for Puerto Rico FIRMs Paul Weberg, FEMA RII Mat Mampara, Dewberry Jeff Gangai, Dewberry Krista Collier, Baker September 2007 Project Team FEMA Region II Program Manager Collaboration
Southern AER Atmospheric Education Resource
 Southern AER Atmospheric Education Resource Vol. 9 No. 5 Spring 2003 Editor: Lauren Bell In this issue: g Climate Creations exploring mother nature s remote control for weather and Climate. g Crazy Climate
City of Cambridge Climate Protection Action Committee. Recommendations for Adaptation to Climate Change. Purpose
 City of Cambridge Climate Protection Action Committee Recommendations for Adaptation to Climate Change Purpose The Climate Protection Action Committee (CPAC) is an advisory body to the City Manager on
New Brunswick s Flood Risk Reduction Strategy. Province of New Brunswick PO 6000, Fredericton NB E3B 5H1. www.gnb.ca
 New Brunswick s Flood Risk Reduction Strategy i New Brunswick s Flood Risk Reduction Strategy Province of New Brunswick PO 6000, Fredericton NB E3B 5H1 2014 www.gnb.ca ISBN 978-1-4605-0533-5 (print edition)
New York Sea Grant Strategic Plan
 New York Sea Grant Strategic Plan Introduction and Process This is the new strategic plan for New York Sea Grant (NYSG) for the years 2010-2013 as requested by the National Sea Grant Office. This plan
5 day Training on Climate Change and Adaptation
 Training Programme 5 day Training on and Adaptation Developed by: Bangladesh Centre for Advanced Studies (BCAS) [A comprehensive training module along with guideline for trainers aiming to enhance capacity
Climate, water and renewable energy in the Nordic countries
 102 Regional Hydrological Impacts of Climatic Change Hydroclimatic Variability (Proceedings of symposium S6 held during the Seventh IAHS Scientific Assembly at Foz do Iguaçu, Brazil, April 2005). IAHS
THE STRATEGIC PLAN OF THE HYDROMETEOROLOGICAL PREDICTION CENTER
 THE STRATEGIC PLAN OF THE HYDROMETEOROLOGICAL PREDICTION CENTER FISCAL YEARS 2012 2016 INTRODUCTION Over the next ten years, the National Weather Service (NWS) of the National Oceanic and Atmospheric Administration
STATUS REPORT FOR THE SUBMERGED REEF BALL TM ARTIFICIAL REEF SUBMERGED BREAKWATER BEACH STABILIZATION PROJECT FOR THE GRAND CAYMAN MARRIOTT HOTEL
 STATUS REPORT FOR THE SUBMERGED REEF BALL TM ARTIFICIAL REEF SUBMERGED BREAKWATER BEACH STABILIZATION PROJECT FOR THE GRAND CAYMAN MARRIOTT HOTEL performed by Lee E. Harris, Ph.D., P.E. Consulting Coastal
How do abiotic factors and physical processes impact life in the ocean?
 This website would like to remind you: Your browser (Apple Safari 7) is out of date. Update your browser for more security, comfort and the best experience on this site. Activitydevelop Ocean Abiotic Factors
MiSP WEATHER WIND SPEED AND DIRECTION Teacher Guide, L1 L3. Introduction
 MiSP WEATHER WIND SPEED AND DIRECTION Teacher Guide, L1 L3 Introduction This MiSP unit can be included in a standard weather and climate unit. Some teachers may like it as part of the introduction. Others
Therefore, this is a very important question, which encourages consideration of the current management of the resource.
 Aalisarnermut, Piniarnermut Nunalerinermullu Naalakkersuisoqarfik Department of Fisheries, Hunting and Agriculture Finn's speech to NAFMC Climate change in the North Atlantic has become a reality which
The First State of the Sea-Level Rise: The North A American Focus on Carbon the Budget. Global Carbon Cycle
 The First State of the Carbon Coastal Cycle Sensitivity Report to Sea-Level Rise: The North A American Focus on Carbon the Budget and Mid-Atlantic Implications Region for the Global Carbon Cycle U.S. Climate
AP ENVIRONMENTAL SCIENCE 2010 SCORING GUIDELINES
 AP ENVIRONMENTAL SCIENCE 2010 SCORING GUIDELINES Question 4 (a) Based on the rate cited above, calculate the expected increase in sea level, in meters, during the next 50 years. One point can be earned
In Coastal Virginia, flooding
 Fall 2012, Vol. 7, No. 2 In Coastal Virginia, flooding has been an on-going issue. Flooding is caused by precipitation events, high tides or storm surge. Although flooding has occurred throughout recorded
Norfolk Flooding Strategy Update. Presentation to Norfolk City Council March 27, 2012
 Norfolk Flooding Strategy Update Presentation to Norfolk City Council March 27, 2012 Presentation Overview The purpose of this presentation is to provide City Council an update on activities carried out
4.14 Netherlands. Interactive flood risk map of a part of the province of Gelderland in the Netherlands. Atlas of Flood Maps
 4.14 Netherlands The Netherlands is flood prone for about 60% of its surface. 95 so-called dike-rings protect the polders from being flooded from the North Sea, rivers or lakes. The protection level has
Establishing a Geospatial Intelligence Pipeline through Earth SySTEM Education
 Establishing a Geospatial Intelligence Pipeline through Earth SySTEM Education NOAA/NESDIS CoRP Science Symposium University of Maryland September 17, 2015 Peter Dorofy dorofyp@students.rowan.edu Rouzbeh
How To Use The Climate Ready Utilities Program
 Introduction to the Climate Resilience Evaluation & Awareness Tool Climate Ready Water Utilities Webinar Series Curt Baranowski, US EPA Jim Hawhee, Albemarle-Pamlico NEP February 27, 2013 Use your mouse
SIXTH GRADE WEATHER 1 WEEK LESSON PLANS AND ACTIVITIES
 SIXTH GRADE WEATHER 1 WEEK LESSON PLANS AND ACTIVITIES WATER CYCLE OVERVIEW OF SIXTH GRADE WATER WEEK 1. PRE: Evaluating components of the water cycle. LAB: Experimenting with porosity and permeability.
Atmospheric Dynamics of Venus and Earth. Institute of Geophysics and Planetary Physics UCLA 2 Lawrence Livermore National Laboratory
 Atmospheric Dynamics of Venus and Earth G. Schubert 1 and C. Covey 2 1 Department of Earth and Space Sciences Institute of Geophysics and Planetary Physics UCLA 2 Lawrence Livermore National Laboratory
Why Demographic Data are not Up to the Challenge of Measuring Climate Risks, and What to do about it. CIESIN Columbia University
 UN Conference on Climate Change and Official Statistics Oslo, Norway, 14-16 April 2008 Why Demographic Data are not Up to the Challenge of Measuring Climate Risks, and What to do about it CIESIN Columbia
How Do Oceans Affect Weather and Climate?
 How Do Oceans Affect Weather and Climate? In Learning Set 2, you explored how water heats up more slowly than land and also cools off more slowly than land. Weather is caused by events in the atmosphere.
Flood Damage Mitigation And Insurance Costs
 Flood Damage Mitigation And Insurance Costs Friday, September 25, 2015 at 7:00 PM Saturday, September 26, 2015 at 10:00 AM This presentation was prepared by the Town of South Bethany using Federal Funds
Coastal Erosion Risk Mitigation Strategies applied in a Small Island Developing State: The Barbados Model
 Coastal Erosion Risk Mitigation Strategies applied in a Small Island Developing State: The Barbados Model BY Dr. Leo Brewster, Director Coastal Zone Management Unit, Barbados Presented At UNFCCC Expert
Armenian State Hydrometeorological and Monitoring Service
 Armenian State Hydrometeorological and Monitoring Service Offenbach 1 Armenia: IN BRIEF Armenia is located in Southern Caucasus region, bordering with Iran, Azerbaijan, Georgia and Turkey. The total territory
Climate Change. Lauma M. Jurkevics - DWR, Southern Region Senior Environmental Scientist
 Climate Change A n o t h e r F a c t o r i n M a n a g i n g S o u t h e r n C a l i f o r n i a s W a t e r R e s o u r c e s Lauma M. Jurkevics - DWR, Southern Region Senior Environmental Scientist USEPA-Region
Climate Change is Underway Lesson Plan
 Climate Change is Underway Lesson Plan For Teachers: The following is a lesson plan designed to be used with section of the Climate Change material entitled Climate Change is Underway from the After Earth
TIDES. 1. Tides are the regular rise and fall of sea level that occurs either once a day (every 24.8 hours) or twice a day (every 12.4 hours).
 or twice a day (every 12.4 hours).") TIDES What causes tides? How are tides predicted? 1. Tides are the regular rise and fall of sea level that occurs either once a day (every 24.8 hours) or twice a day (every 12.4 hours). Tides are waves
TIDES What causes tides? How are tides predicted? 1. Tides are the regular rise and fall of sea level that occurs either once a day (every 24.8 hours) or twice a day (every 12.4 hours). Tides are waves
Trends of Natural Disasters the Role of Global Warming
 Trends of Natural Disasters the Role of Global Warming Prof. Dr. Peter Hoeppe Geo Risks Research Munich Reinsurance Company Geo Risks Research Department of Munich Re - Analyses of natural disasters since
HAZUS 2014. 7 th Annual Conference
 HAZUS 2014 7 th Annual Conference HAZUS Comparison of Storm Surge Levels from Different Hurricanes to the Newest SLOSH Models for Berkeley, Charleston, & Dorchester Counties Along the SC Coastline. Charlie
climate change Houston-Galveston, 15 Texas Observed Climate Houston-Galveston Area (1901 2010) Observed Trends and Projected 67 Future
 Observed Trends and Projected 67 Future") Climate change, once considered an issue for a distant future, has moved firmly into the present. Houston-Galveston area residents are vulnerable to disruptions in essential services because the urban
Climate change, once considered an issue for a distant future, has moved firmly into the present. Houston-Galveston area residents are vulnerable to disruptions in essential services because the urban
Systems Thinking and Modeling Climate Change Amy Pallant, Hee-Sun Lee, and Sarah Pryputniewicz
 Systems Thinking and Modeling Climate Change Amy Pallant, Hee-Sun Lee, and Sarah Pryputniewicz You know the effects of the proverbial butterfly flapping its wings. But what about an automobile driver?
WEATHER AND CLIMATE WHY DOES IT MATTER?
 WEATHER AND CLIMATE Rising global average temperature is associated with widespread changes in weather patterns. Scientific studies indicate that extreme weather events such as heat waves and large storms
Climate Change and Adaptive Strategies in Sub-national Transportation Planning Agencies in the United States
 Climate Change and Adaptive Strategies in Sub-national Transportation Planning Agencies in the United States Eric Lindquist, Ph.D. Institute for Science, Technology and Public Policy Texas A&M University