Identify Significant Features Using Concentration Data
|
|
|
- Kristin Booth
- 7 years ago
- Views:
Transcription
1 Identify Significant Features Using Concentration Data By Jianguo Xia Last update: 4/15/2009 This tutorial shows how to identify significant features using methods provided in MetaboAnalyst. The example used is compound concentration data obtained by targeted (i.e. quantitative) metabolic profiling of 1 H NMR spectra of urine samples collected from 57 cancer patients. There are two groups of patients Cachexia (Y) refers to the group with significant skeletal muscle loss; Cachexia (N) refers to the group with no obvious skeletal muscle loss. Cachexia is defined as the loss of weight, muscle atrophy, fatigue, weakness and significant loss of appetite in someone who is not actively trying to lose weight. Cachexia is often seen in end-stage cancer, and in that context is called "cancer cachexia". The exact mechanism behind cachexia is poorly understood, but there is probably a role for inflammatory cytokines, such as tumor necrosis factor-alpha (TNF-α) - which is also nicknamed cachexin, Interferon gamma (IFNγ), and Interleukin 6 (IL-6). The goal in this tutorial is to identify metabolites that are significantly different between these two groups of cancer patients (cachexic vs. non-cachexic). These metabolites could serve as potential early-stage biomarkers for detecting cachexia and for exploring its underlying metabolic basis. 1
, click the download link after the Compound concentration data option to")
2 Step 1. Go to the Data Formats page (found by clicking on the Data Formats hyperlink on MetaboAnalyst s home page), click the download link after the Compound concentration data option to download the compressed zip file. Unzip the file and save as compounds.csv. Step 2. Go the MetaboAnalyst Home page and click click here to start to enter the data upload page. 2

3 Step 3. In the Upload page, go to the Upload your data panel, select the options as indicated below and click Submit Note: Alternatively, you can directly select the first option in the Try our test data without downloading the example. 3
, determine whether the data is paired or determine if")
4 Step 4. The data integrity check will run automatically and the result is shown below. For lists of concentrations the data integrity check will assess the content (look for consistent formatting and the presence of two groups), determine whether the data is paired or determine if negative numbers exists. In this case, 869 zero values and no missing values were identified in the data. Since zero values may cause some algorithms not to work properly, MetaboAnalyst will replace these zero values with a small positive value (the half of the minimum positive number detected in the data). Click Skip to go to normalization step. If missing values had been detected, then the most appropriate from a variety of methods provided by MetboAnalyst could have been used to deal with this issue (for such an example, see MetaboAnalyst Tutorial 4). Note: missing values are represented as NA (no quotes) or empty values. 4
5 Step 5. Now we arrive at the data normalization step. The internal data structure is transformed now to a table with each row representing a urine sample (from a patient) and each column representing a feature (a compound with a concentration). With the data structured in this format, two types of data normalization protocols - row-wise normalization and column-wise normalization -- may be used. These are often applied sequentially to reduce systematic variance and to improve the performance for downstream statistical analysis. Row-wise normalization aims to normalize each sample (row) so that that they are comparable to each other. For row-wise normalization MetaboAnalyst supports normalization to a constant sum, normalization to a reference sample (probabilistic quotient normalization), normalization to a reference feature (creatinine or an internal standard) and samplespecific normalization (dry weight or tissue volume). In contrast to row-wise normalization, columnwise normalization aims to make each feature (column) more comparable in magnitude to each other. Four widely-used methods are offered in MetaboAnalyst - log transformation, auto-scaling, Pareto scaling, and range scaling. Urine concentrations are usually normalized by creatinine concentration to adjust for dilution effects (select option 4 - Normalization by a reference feature and choose creatinine ). However, in this case, creatinine is the product of protein breakdown and is related to the skeletal muscle loss. Since normalizing to a metabolite that might be important for understanding this disorder might introduce biological bias, we need to choose another kind of normalization process. As a result we choose to normalize by a reference sample NETCR4 (a general rule is to choose a sample in the control group with the fewest missing values). After deciding to normalize by reference sample for our row-wise (sample) normalization we then choose Log normalization for our column normalization to make the metabolite concentration values more comparable among different compounds. 5

6 Hint: Remember to click on Normalization by a reference sample and not only select NETCR4 6
 of the data after normalization.")
7 The normalization result is shown below. On the left is a plot (box-whisker plot on top, linear distribution plot on the bottom) of the data prior to normalization. On the right is a plot (box-whisker plot on top, linear distribution plot on the bottom) of the data after normalization. As can be seen by comparing the linear concentration curve on the left (which has an exponential decay character) to the log-transformed curve on the right (which looks reasonably Gaussian), the log normalization step along with the reference sample normalization makes the concentration data reasonably normal. You can also try other normalization approaches and compare their results. 7

8 Step 6. Now we have finished data processing and normalization. The data are now suitable for different statistical analyses. There are many feature selection methods available in MetaboAnalyst. Here we will only show results from Volcano Plot, PLS-DA and SAM methods. The screen shot below shows MetaboAnalyst s analysis view. Please note the navigation panel on the left. A color change indicates the corresponding step has been successfully performed. All the data analysis methods can be directly accessed by clicking the corresponding hyperlink. 8
9 Step 7. Generally the simplest kind of analysis that can be performed on this type of metabolomic data is univariate data analysis. Univariate analyses are often first used to obtain an overview of the data or a rough ranking of potentially important features before applying more sophisticated data analysis tools. Univariate analysis examines each variable separately without taking into account the effect of multiple comparisons. MetaboAnalyst s univariate analysis path supports three commonly used methods - fold-change analysis, t-tests, and volcano plots. To begin the univariate analysis, click the Univariate link on the navigation panel to the left. From here we will perform a volcano plot analysis. Volcano plots are used to compare the size of the fold change to the statistical significance level. The X axis plots the fold change between the two groups (on a log scale), while the Y axis represents the p-value for a t-test of differences between samples (on a negative log scale). To start a volcano plot click the Volcano tab. Adjust the fold change (FC) threshold to 1.8 and click Submit. As can be seen by the figure below, eight features are detected as significant and colored in red. Click the View the selected features link to view the names/identities of these features. The table at the bottom shows these eight features. These include glycolate, fumarate, 3-methylhistidine, glucose, etc. 9

10 10
11 Step 8. The Volcano plot has provided some intriguing results. We may now want to examine whether these metabolites are also detected as being significant using a slightly more sophisticated analysis tool. In particular we will use Partial-Least Squares Discriminant Analysis (PLS-DA). As a supervised method, PLS-DA can perform both classification and feature selection. The algorithm uses cross-validation to select an optimal number of components for classification. Two feature importance measures are commonly used in PLS-DA. Variable Importance in Projection or VIP score is a weighted sum of squares of the PLS loadings. The weights are based on the amount of explained Y-variance in each dimension. The other importance measure is based on the weighted sum of PLS-regression coefficients. The weights are a function of the reduction of the sums of squares across the number of PLS components. More details about these two methods can be obtained by placing your mouse over the About PLS link. Go back to the Analysis window and click the PLSDA link on the navigation panel and then click the Var.Importance tab. You will see the result as shown below. The graphs rank the different metabolites (the top 15) according to the VIP score on the left and according to the coefficient score on the right. 11
12 Click the View details link to see the data table that was used to produce the graph. Note that the VIP score is not normalized. The VIP scores tend to be 200X larger than the coefficient scores, but the relative ranking of significant metabolites is largely the same. VIP is a weighted sum of squares of the PLS weight, which indicates the importance of the variable to the whole model. In many studies VIP values >2.0 are selected and used for further data analysis, but this cut-off depends on the number of variables used. Since the number of variables in this study is less than 100, we can use a more relaxed VIP cutoff of around
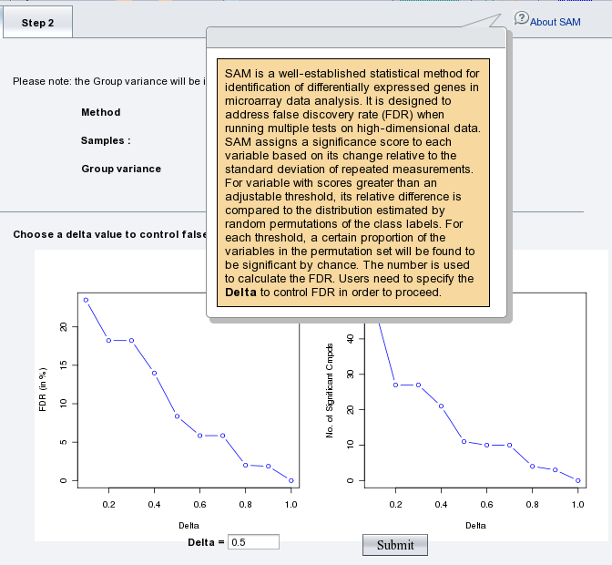
13 Step 9. With the completion of the PLS-DA analysis, we can try another approach to select interesting or significant features that distinguish between cachexic and non-cachexic patients. Here we ll attempt to use Significance Analysis of Microarray (SAM). SAM is designed to address False Discovery Rate (FDR) problems when running multiple tests on high-dimensional data. It first assigns a significance score to each variable based on its change relative to the standard deviation of repeated measurements. Then it chooses variables with scores greater than an adjustable threshold and compares their relative difference to the distribution estimated by random permutations of the class labels. For each threshold, a certain proportion of the variables in the permutation set will be found to be significant by chance. This number is used to calculate the FDR. To use SAM analysis, go back and click the SAM link on the navigational panel; you will see the following set of Delta plots. The Delta plots are a visualization of the table generated by SAM that contains the estimated FDR and the number of identified metabolites for a set of Delta values. Note the pop-up help balloon when you place the mouse over About SAM. The default Delta value (0.5) has an FDR of 12% and identifies ~10 significant compounds above this threshold, as seen on the left plot. You can increase the Delta to reduce the FDR. The figure below shows that when Delta is above 0.7, FDR approaches to 0 (left panel). However, no significant compound will be identified (right panel). The default 0.5 is a compromise between the FDR and the number of compounds detected. Click 'Submit' in the bottom panel to go to Step 2 to view the result. 13
14 14
15 The Step 2 tab shows a typical SAM plot with Delta = 0.5. Click the View details of the... button to see the SAM results table (next page). A SAM plot displays a positive metabolite set and a negative metabolite set. In the positive metabolite set, higher levels of these metabolites correlate with higher values for the cachexia phenotype. In the negative metabolite set, lower levels of these metabolites correlate with higher values for the cachexia phenotype. A total of 11 compounds were identified above the chosen threshold. 15

16 Significant compounds identified by SAM with delta = 0.5. Note that the term rawp refers to the raw p-values from regular t-tests. 16

17 Step 10. Based on the result from the Volcano Plot, PLS-DA and SAM, several compounds are consistently identified as being significant by different approaches. Using 3-methylhistine and glycolate as examples, let us further check which pathways they are involved in. To do so, we can use MetaboAnalyst s data annotation tools. Click the Pathway mapping link on the left navigation panel, enter the two compound names separated by a semicolon (i.e. ;) and then click the Search button. The result shows only the pathway for Glycolate. No entry was found for 3-Methylhistidine in the pathway library of the Human Metabolome Database (HMDB). By clicking on the relative links in the resulting table, you will access the corresponding pathway as well as detailed information about the metabolite (Metabocard). 17

18 Step 11. Now, we want to find out about the biological function of 3-melthylhistidine. Go to the HMDB ( and enter 3-methylhistdine and click Search button. The result is shown below. Click the MetaboCard on the left panel; the result is shown below. As indicated, this compound can be used as an index of muscle protein breakdown which is relevant to the cachexia patients with significant skeletal muscle loss. 18
 containing introductions and results from every steps you have performed. Now, you can directly click Download.zip file to download all the processed data, images and the PDF report.")
19 Step 12. Now, assume we have finished the analysis. Click the Download link on the navigation panel. A detailed analysis report will be generated (MetaboAnalystReport.pdf) containing introductions and results from every steps you have performed. Now, you can directly click Download.zip file to download all the processed data, images and the PDF report. Alternatively, you can ask MetaboAnalyst to send you the result via by entering your address. The data will remain on the server for 72 hours before being automatically deleted End of tutorial
Tutorial for proteome data analysis using the Perseus software platform
 Tutorial for proteome data analysis using the Perseus software platform Laboratory of Mass Spectrometry, LNBio, CNPEM Tutorial version 1.0, January 2014. Note: This tutorial was written based on the information
Statistical Analysis. NBAF-B Metabolomics Masterclass. Mark Viant
 Statistical Analysis NBAF-B Metabolomics Masterclass Mark Viant 1. Introduction 2. Univariate analysis Overview of lecture 3. Unsupervised multivariate analysis Principal components analysis (PCA) Interpreting
Scatter Plots with Error Bars
 Chapter 165 Scatter Plots with Error Bars Introduction The procedure extends the capability of the basic scatter plot by allowing you to plot the variability in Y and X corresponding to each point. Each
AAFCO Check Sample Program New Data Reporting Website Manual Date of Issue: March 1 st 2014
 Victoria S. Siegel, Ph.D., Chair Collaborative Check Sample Program Committee AAFCO Check Sample Program New Data Reporting Website Manual Date of Issue: March 1 st 2014 1. Registered participants in any
This chapter will demonstrate how to perform multiple linear regression with IBM SPSS
 CHAPTER 7B Multiple Regression: Statistical Methods Using IBM SPSS This chapter will demonstrate how to perform multiple linear regression with IBM SPSS first using the standard method and then using the
The KaleidaGraph Guide to Curve Fitting
 The KaleidaGraph Guide to Curve Fitting Contents Chapter 1 Curve Fitting Overview 1.1 Purpose of Curve Fitting... 5 1.2 Types of Curve Fits... 5 Least Squares Curve Fits... 5 Nonlinear Curve Fits... 6
MarkerView Software 1.2.1 for Metabolomic and Biomarker Profiling Analysis
 MarkerView Software 1.2.1 for Metabolomic and Biomarker Profiling Analysis Overview MarkerView software is a novel program designed for metabolomics applications and biomarker profiling workflows 1. Using
Hierarchical Clustering Analysis
 Hierarchical Clustering Analysis What is Hierarchical Clustering? Hierarchical clustering is used to group similar objects into clusters. In the beginning, each row and/or column is considered a cluster.
Scientific Graphing in Excel 2010
 Scientific Graphing in Excel 2010 When you start Excel, you will see the screen below. Various parts of the display are labelled in red, with arrows, to define the terms used in the remainder of this overview.
Example: Credit card default, we may be more interested in predicting the probabilty of a default than classifying individuals as default or not.
 Statistical Learning: Chapter 4 Classification 4.1 Introduction Supervised learning with a categorical (Qualitative) response Notation: - Feature vector X, - qualitative response Y, taking values in C
City of De Pere. Halogen How To Guide
 City of De Pere Halogen How To Guide Page1 (revised 12/14/2015) Halogen Performance Management website address: https://global.hgncloud.com/cityofdepere/welcome.jsp The following steps take place to complete
Univariate Regression
 Univariate Regression Correlation and Regression The regression line summarizes the linear relationship between 2 variables Correlation coefficient, r, measures strength of relationship: the closer r is
There are six different windows that can be opened when using SPSS. The following will give a description of each of them.
 SPSS Basics Tutorial 1: SPSS Windows There are six different windows that can be opened when using SPSS. The following will give a description of each of them. The Data Editor The Data Editor is a spreadsheet
Factor Analysis. Chapter 420. Introduction
 Chapter 420 Introduction (FA) is an exploratory technique applied to a set of observed variables that seeks to find underlying factors (subsets of variables) from which the observed variables were generated.
ModEco Tutorial In this tutorial you will learn how to use the basic features of the ModEco Software.
 ModEco Tutorial In this tutorial you will learn how to use the basic features of the ModEco Software. Contents: Getting Started Page 1 Section 1: File and Data Management Page 1 o 1.1: Loading Single Environmental
Dealing with Data in Excel 2010
 Dealing with Data in Excel 2010 Excel provides the ability to do computations and graphing of data. Here we provide the basics and some advanced capabilities available in Excel that are useful for dealing
Petrel TIPS&TRICKS from SCM
 Petrel TIPS&TRICKS from SCM Knowledge Worth Sharing Histograms and SGS Modeling Histograms are used daily for interpretation, quality control, and modeling in Petrel. This TIPS&TRICKS document briefly
One-Way ANOVA using SPSS 11.0. SPSS ANOVA procedures found in the Compare Means analyses. Specifically, we demonstrate
 1 One-Way ANOVA using SPSS 11.0 This section covers steps for testing the difference between three or more group means using the SPSS ANOVA procedures found in the Compare Means analyses. Specifically,
Tutorial Overview Quick Tips on Using the ONRR Statistical Information Website
 Tutorial Overview Quick Tips on Using the ONRR Statistical Information Website We have added several upgrades to the ONRR Statistical Information Website. The new interactive map on the home page allows
MultiExperiment Viewer Quickstart Guide
 MultiExperiment Viewer Quickstart Guide Table of Contents: I. Preface - 2 II. Installing MeV - 2 III. Opening a Data Set - 2 IV. Filtering - 6 V. Clustering a. HCL - 8 b. K-means - 11 VI. Modules a. T-test
Summary of important mathematical operations and formulas (from first tutorial):
:") EXCEL Intermediate Tutorial Summary of important mathematical operations and formulas (from first tutorial): Operation Key Addition + Subtraction - Multiplication * Division / Exponential ^ To enter a
EXCEL Intermediate Tutorial Summary of important mathematical operations and formulas (from first tutorial): Operation Key Addition + Subtraction - Multiplication * Division / Exponential ^ To enter a
Using BlueHornet Statistics Sent Message Reporting Message Summary Section Advanced Reporting Basics Delivery Tab
 Using BlueHornet Statistics BlueHornet provides a feature that allows message senders to gage the effectiveness of their messages by reporting message statistics that are tracked by the system. For quick
Gephi Tutorial Quick Start
 Gephi Tutorial Welcome to this introduction tutorial. It will guide you to the basic steps of network visualization and manipulation in Gephi. Gephi version 0.7alpha2 was used to do this tutorial. Get
Figure 1. An embedded chart on a worksheet.
 8. Excel Charts and Analysis ToolPak Charts, also known as graphs, have been an integral part of spreadsheets since the early days of Lotus 1-2-3. Charting features have improved significantly over the
Data representation and analysis in Excel
 Page 1 Data representation and analysis in Excel Let s Get Started! This course will teach you how to analyze data and make charts in Excel so that the data may be represented in a visual way that reflects
Factor Analysis Using SPSS
 Psychology 305 p. 1 Factor Analysis Using SPSS Overview For this computer assignment, you will conduct a series of principal factor analyses to examine the factor structure of a new instrument developed
Reliability Analysis
 Measures of Reliability Reliability Analysis Reliability: the fact that a scale should consistently reflect the construct it is measuring. One way to think of reliability is that other things being equal,
Using MS Excel to Analyze Data: A Tutorial
 Using MS Excel to Analyze Data: A Tutorial Various data analysis tools are available and some of them are free. Because using data to improve assessment and instruction primarily involves descriptive and
ABSORBENCY OF PAPER TOWELS
 ABSORBENCY OF PAPER TOWELS 15. Brief Version of the Case Study 15.1 Problem Formulation 15.2 Selection of Factors 15.3 Obtaining Random Samples of Paper Towels 15.4 How will the Absorbency be measured?
Point Biserial Correlation Tests
 Chapter 807 Point Biserial Correlation Tests Introduction The point biserial correlation coefficient (ρ in this chapter) is the product-moment correlation calculated between a continuous random variable
DeCyder Extended Data Analysis module Version 1.0
 GE Healthcare DeCyder Extended Data Analysis module Version 1.0 Module for DeCyder 2D version 6.5 User Manual Contents 1 Introduction 1.1 Introduction... 7 1.2 The DeCyder EDA User Manual... 9 1.3 Getting
Step-by-Step Guide to Basic Expression Analysis and Normalization
 Step-by-Step Guide to Basic Expression Analysis and Normalization Page 1 Introduction This document shows you how to perform a basic analysis and normalization of your data. A full review of this document
Creating and Managing Online Surveys LEVEL 2
 Creating and Managing Online Surveys LEVEL 2 Accessing your online survey account 1. If you are logged into UNF s network, go to https://survey. You will automatically be logged in. 2. If you are not logged
Directions for using SPSS
 Directions for using SPSS Table of Contents Connecting and Working with Files 1. Accessing SPSS... 2 2. Transferring Files to N:\drive or your computer... 3 3. Importing Data from Another File Format...
Introduction to Exploratory Data Analysis
 Introduction to Exploratory Data Analysis A SpaceStat Software Tutorial Copyright 2013, BioMedware, Inc. (www.biomedware.com). All rights reserved. SpaceStat and BioMedware are trademarks of BioMedware,
After you complete the survey, compare what you saw on the survey to the actual questions listed below:
 Creating a Basic Survey Using Qualtrics Clayton State University has purchased a campus license to Qualtrics. Both faculty and students can use Qualtrics to create surveys that contain many different types
EXCEL Tutorial: How to use EXCEL for Graphs and Calculations.
 EXCEL Tutorial: How to use EXCEL for Graphs and Calculations. Excel is powerful tool and can make your life easier if you are proficient in using it. You will need to use Excel to complete most of your
Dimensionality Reduction: Principal Components Analysis
 Dimensionality Reduction: Principal Components Analysis In data mining one often encounters situations where there are a large number of variables in the database. In such situations it is very likely
Time Clock Import Setup & Use
 Time Clock Import Setup & Use Document # Product Module Category CenterPoint Payroll Processes (How To) This document outlines how to setup and use of the Time Clock Import within CenterPoint Payroll.
KSTAT MINI-MANUAL. Decision Sciences 434 Kellogg Graduate School of Management
 KSTAT MINI-MANUAL Decision Sciences 434 Kellogg Graduate School of Management Kstat is a set of macros added to Excel and it will enable you to do the statistics required for this course very easily. To
2/24/2010 ClassApps.com
 SelectSurvey.NET Training Manual This document is intended to be a simple visual guide for non technical users to help with basic survey creation, management and deployment. 2/24/2010 ClassApps.com Getting
Axis 360 Administrator User Manual. May 2015
 Axis 360 Administrator User Manual May 2015 Table of Contents 1 Introduction... 4 1.1 Site Access and Home Page... 4 2 Settings... 5 2.1 Library Settings... 5 2.1.1 Library Site Settings...5 2.1.2 Lending
Creating Online Surveys with Qualtrics Survey Tool
 Creating Online Surveys with Qualtrics Survey Tool Copyright 2015, Faculty and Staff Training, West Chester University. A member of the Pennsylvania State System of Higher Education. No portion of this
Statistics. Measurement. Scales of Measurement 7/18/2012
 Statistics Measurement Measurement is defined as a set of rules for assigning numbers to represent objects, traits, attributes, or behaviors A variableis something that varies (eye color), a constant does
Using Excel (Microsoft Office 2007 Version) for Graphical Analysis of Data
 for Graphical Analysis of Data") Using Excel (Microsoft Office 2007 Version) for Graphical Analysis of Data Introduction In several upcoming labs, a primary goal will be to determine the mathematical relationship between two variable
Using Excel (Microsoft Office 2007 Version) for Graphical Analysis of Data Introduction In several upcoming labs, a primary goal will be to determine the mathematical relationship between two variable
Session 7 Bivariate Data and Analysis
 Session 7 Bivariate Data and Analysis Key Terms for This Session Previously Introduced mean standard deviation New in This Session association bivariate analysis contingency table co-variation least squares
MASCOT Search Results Interpretation
 The Mascot protein identification program (Matrix Science, Ltd.) uses statistical methods to assess the validity of a match. MS/MS data is not ideal. That is, there are unassignable peaks (noise) and usually
The Center for Teaching, Learning, & Technology
 The Center for Teaching, Learning, & Technology Instructional Technology Workshops Microsoft Excel 2010 Formulas and Charts Albert Robinson / Delwar Sayeed Faculty and Staff Development Programs Colston
Homework 11. Part 1. Name: Score: / null
 Name: Score: / Homework 11 Part 1 null 1 For which of the following correlations would the data points be clustered most closely around a straight line? A. r = 0.50 B. r = -0.80 C. r = 0.10 D. There is
Adobe Conversion Settings in Word. Section 508: Why comply?
 It s the right thing to do: Adobe Conversion Settings in Word Section 508: Why comply? 11,400,000 people have visual conditions not correctible by glasses. 6,400,000 new cases of eye disease occur each
Creating Database Model Diagrams in Microsoft Visio Jeffery S. Horsburgh
 Creating Database Model Diagrams in Microsoft Visio Jeffery S. Horsburgh Visio is a software tool created by Microsoft that contains tools for creating many different types of diagrams. Visio s drawing
ITCS QUICK REFERENCE GUIDE: EXPRESSION WEB SITE
 Create a One-Page Website Using Microsoft Expression Web This tutorial uses Microsoft Expression Web 3 Part 1. Create the Site on your computer Create a folder in My Documents to house the Web files. Save
Calibration and Linear Regression Analysis: A Self-Guided Tutorial
 Calibration and Linear Regression Analysis: A Self-Guided Tutorial Part 1 Instrumental Analysis with Excel: The Basics CHM314 Instrumental Analysis Department of Chemistry, University of Toronto Dr. D.
Absorbance Spectrophotometry: Analysis of FD&C Red Food Dye #40 Calibration Curve Procedure
 Absorbance Spectrophotometry: Analysis of FD&C Red Food Dye #40 Calibration Curve Procedure Note: there is a second document that goes with this one! 2046 - Absorbance Spectrophotometry. Make sure you
Principal Component Analysis
 Principal Component Analysis Principle Component Analysis: A statistical technique used to examine the interrelations among a set of variables in order to identify the underlying structure of those variables.
A Brief Introduction to SPSS Factor Analysis
 A Brief Introduction to SPSS Factor Analysis SPSS has a procedure that conducts exploratory factor analysis. Before launching into a step by step example of how to use this procedure, it is recommended
VISUAL ALGEBRA FOR COLLEGE STUDENTS. Laurie J. Burton Western Oregon University
 VISUAL ALGEBRA FOR COLLEGE STUDENTS Laurie J. Burton Western Oregon University VISUAL ALGEBRA FOR COLLEGE STUDENTS TABLE OF CONTENTS Welcome and Introduction 1 Chapter 1: INTEGERS AND INTEGER OPERATIONS
Facebook Friend Suggestion Eytan Daniyalzade and Tim Lipus
 Facebook Friend Suggestion Eytan Daniyalzade and Tim Lipus 1. Introduction Facebook is a social networking website with an open platform that enables developers to extract and utilize user information
STATISTICA Formula Guide: Logistic Regression. Table of Contents
 : Table of Contents... 1 Overview of Model... 1 Dispersion... 2 Parameterization... 3 Sigma-Restricted Model... 3 Overparameterized Model... 4 Reference Coding... 4 Model Summary (Summary Tab)... 5 Summary
January 26, 2009 The Faculty Center for Teaching and Learning
 THE BASICS OF DATA MANAGEMENT AND ANALYSIS A USER GUIDE January 26, 2009 The Faculty Center for Teaching and Learning THE BASICS OF DATA MANAGEMENT AND ANALYSIS Table of Contents Table of Contents... i
Analyzing the Effect of Treatment and Time on Gene Expression in Partek Genomics Suite (PGS) 6.6: A Breast Cancer Study
 6.6: A Breast Cancer Study") Analyzing the Effect of Treatment and Time on Gene Expression in Partek Genomics Suite (PGS) 6.6: A Breast Cancer Study The data for this study is taken from experiment GSE848 from the Gene Expression
Analyzing the Effect of Treatment and Time on Gene Expression in Partek Genomics Suite (PGS) 6.6: A Breast Cancer Study The data for this study is taken from experiment GSE848 from the Gene Expression
Tutorial 2: Using Excel in Data Analysis
 Tutorial 2: Using Excel in Data Analysis This tutorial guide addresses several issues particularly relevant in the context of the level 1 Physics lab sessions at Durham: organising your work sheet neatly,
Two-Sample T-Tests Assuming Equal Variance (Enter Means)
") Chapter 4 Two-Sample T-Tests Assuming Equal Variance (Enter Means) Introduction This procedure provides sample size and power calculations for one- or two-sided two-sample t-tests when the variances of
Chapter 4 Two-Sample T-Tests Assuming Equal Variance (Enter Means) Introduction This procedure provides sample size and power calculations for one- or two-sided two-sample t-tests when the variances of
To launch the Microsoft Excel program, locate the Microsoft Excel icon, and double click.
 EDIT202 Spreadsheet Lab Assignment Guidelines Getting Started 1. For this lab you will modify a sample spreadsheet file named Starter- Spreadsheet.xls which is available for download from the Spreadsheet
THE TOP TEN TIPS FOR USING QUALTRICS AT BYU
 THE TOP TEN TIPS FOR USING QUALTRICS AT BYU TIP #1: CREATING A SURVEY FROM A COPY AND COLLABORATING ON SURVEYS TIP #2: CREATING AND USING PANELS TIP #3: LIBRARIES AND HOW TO USE THEM TIP #4: BASIC SKIP
Assets, Groups & Networks
 Complete. Simple. Affordable Copyright 2014 AlienVault. All rights reserved. AlienVault, AlienVault Unified Security Management, AlienVault USM, AlienVault Open Threat Exchange, AlienVault OTX, Open Threat
Intellect Platform - Tables and Templates Basic Document Management System - A101
 Intellect Platform - Tables and Templates Basic Document Management System - A101 Interneer, Inc. 4/12/2010 Created by Erika Keresztyen 2 Tables and Templates - A101 - Basic Document Management System
Excel Basics By Tom Peters & Laura Spielman
 Excel Basics By Tom Peters & Laura Spielman What is Excel? Microsoft Excel is a software program with spreadsheet format enabling the user to organize raw data, make tables and charts, graph and model
MARS STUDENT IMAGING PROJECT
 MARS STUDENT IMAGING PROJECT Data Analysis Practice Guide Mars Education Program Arizona State University Data Analysis Practice Guide This set of activities is designed to help you organize data you collect
Introduction to SPSS 16.0
 Introduction to SPSS 16.0 Edited by Emily Blumenthal Center for Social Science Computation and Research 110 Savery Hall University of Washington Seattle, WA 98195 USA (206) 543-8110 November 2010 http://julius.csscr.washington.edu/pdf/spss.pdf
Two-Sample T-Tests Allowing Unequal Variance (Enter Difference)
") Chapter 45 Two-Sample T-Tests Allowing Unequal Variance (Enter Difference) Introduction This procedure provides sample size and power calculations for one- or two-sided two-sample t-tests when no assumption
Chapter 45 Two-Sample T-Tests Allowing Unequal Variance (Enter Difference) Introduction This procedure provides sample size and power calculations for one- or two-sided two-sample t-tests when no assumption
Excel Tutorial. Bio 150B Excel Tutorial 1
 Bio 15B Excel Tutorial 1 Excel Tutorial As part of your laboratory write-ups and reports during this semester you will be required to collect and present data in an appropriate format. To organize and
WISE Sampling Distribution of the Mean Tutorial
 Name Date Class WISE Sampling Distribution of the Mean Tutorial Exercise 1: How accurate is a sample mean? Overview A friend of yours developed a scale to measure Life Satisfaction. For the population
Excel -- Creating Charts
 Excel -- Creating Charts The saying goes, A picture is worth a thousand words, and so true. Professional looking charts give visual enhancement to your statistics, fiscal reports or presentation. Excel
Beginner s Matlab Tutorial
 Christopher Lum lum@u.washington.edu Introduction Beginner s Matlab Tutorial This document is designed to act as a tutorial for an individual who has had no prior experience with Matlab. For any questions
State of Michigan Data Exchange Gateway. Web-Interface Users Guide 12-07-2009
 State of Michigan Data Exchange Gateway Web-Interface Users Guide 12-07-2009 Page 1 of 21 Revision History: Revision # Date Author Change: 1 8-14-2009 Mattingly Original Release 1.1 8-31-2009 MM Pgs 4,
Adobe Acrobat 6.0 Professional
 Adobe Acrobat 6.0 Professional Manual Adobe Acrobat 6.0 Professional Manual Purpose The will teach you to create, edit, save, and print PDF files. You will also learn some of Adobe s collaborative functions,
SAM Brief Student User Guide
 SAM Assessment, Training and Projects for Microsoft Office December 2015 SAM Brief Student User Guide Contents Introduction 1 How to Use SAM 2 Logging in the First Time as a Pre-registered Student 2 Profile
STATGRAPHICS Online. Statistical Analysis and Data Visualization System. Revised 6/21/2012. Copyright 2012 by StatPoint Technologies, Inc.
 STATGRAPHICS Online Statistical Analysis and Data Visualization System Revised 6/21/2012 Copyright 2012 by StatPoint Technologies, Inc. All rights reserved. Table of Contents Introduction... 1 Chapter
Comparison of Non-linear Dimensionality Reduction Techniques for Classification with Gene Expression Microarray Data
 CMPE 59H Comparison of Non-linear Dimensionality Reduction Techniques for Classification with Gene Expression Microarray Data Term Project Report Fatma Güney, Kübra Kalkan 1/15/2013 Keywords: Non-linear
CALCULATIONS & STATISTICS
 CALCULATIONS & STATISTICS CALCULATION OF SCORES Conversion of 1-5 scale to 0-100 scores When you look at your report, you will notice that the scores are reported on a 0-100 scale, even though respondents
STT315 Chapter 4 Random Variables & Probability Distributions KM. Chapter 4.5, 6, 8 Probability Distributions for Continuous Random Variables
 Chapter 4.5, 6, 8 Probability Distributions for Continuous Random Variables Discrete vs. continuous random variables Examples of continuous distributions o Uniform o Exponential o Normal Recall: A random
one Managing your PBX Administrator ACCESSING YOUR PBX ACCOUNT CHECKING ACCOUNT ACTIVITY
 one Managing your PBX Administrator ACCESSING YOUR PBX ACCOUNT Navigate to https://portal.priorityonenet.com/ and log in to the PriorityOne portal account. If you would like your web browser to keep you
Chapter 2: Getting Started
 Chapter 2: Getting Started Once Partek Flow is installed, Chapter 2 will take the user to the next stage and describes the user interface and, of note, defines a number of terms required to understand
Back Analysis of Material Properties
 Back Analysis of Material Properties 23-1 Back Analysis of Material Properties This tutorial will demonstrate how to perform back analysis of material properties using sensitivity analysis or probabilistic
Using Excel for inferential statistics
 FACT SHEET Using Excel for inferential statistics Introduction When you collect data, you expect a certain amount of variation, just caused by chance. A wide variety of statistical tests can be applied
Two-Way ANOVA tests. I. Definition and Applications...2. II. Two-Way ANOVA prerequisites...2. III. How to use the Two-Way ANOVA tool?...
 Two-Way ANOVA tests Contents at a glance I. Definition and Applications...2 II. Two-Way ANOVA prerequisites...2 III. How to use the Two-Way ANOVA tool?...3 A. Parametric test, assume variances equal....4
LEGENDplex Data Analysis Software
 LEGENDplex Data Analysis Software Version 7.0 User Guide Copyright 2013-2014 VigeneTech. All rights reserved. Contents Introduction... 1 Lesson 1 - The Workspace... 2 Lesson 2 Quantitative Wizard... 3
EPay Online Payment Services
 EPay User Guide Welcome to Explorer s EPay Online payment services. We offer our payment services in partnership with Bank of America, and hope that you find EPay easy to use! This guide provides an overview
Company Setup 401k Tab
 Reference Sheet Company Setup 401k Tab Use this page to define company level 401(k) information, including employee status codes, 401(k) sources, and 401(k) funds. The definitions you create here become
5 Correlation and Data Exploration
 5 Correlation and Data Exploration Correlation In Unit 3, we did some correlation analyses of data from studies related to the acquisition order and acquisition difficulty of English morphemes by both
Sample Table. Columns. Column 1 Column 2 Column 3 Row 1 Cell 1 Cell 2 Cell 3 Row 2 Cell 4 Cell 5 Cell 6 Row 3 Cell 7 Cell 8 Cell 9.
 Working with Tables in Microsoft Word The purpose of this document is to lead you through the steps of creating, editing and deleting tables and parts of tables. This document follows a tutorial format
1) Write the following as an algebraic expression using x as the variable: Triple a number subtracted from the number
 Write the following as an algebraic expression using x as the variable: Triple a number subtracted from the number") 1) Write the following as an algebraic expression using x as the variable: Triple a number subtracted from the number A. 3(x - x) B. x 3 x C. 3x - x D. x - 3x 2) Write the following as an algebraic expression
1) Write the following as an algebraic expression using x as the variable: Triple a number subtracted from the number A. 3(x - x) B. x 3 x C. 3x - x D. x - 3x 2) Write the following as an algebraic expression
Interactive Excel Spreadsheets:
 Interactive Excel Spreadsheets: Constructing Visualization Tools to Enhance Your Learner-centered Math and Science Classroom Scott A. Sinex Department of Physical Sciences and Engineering Prince George
Using SPSS, Chapter 2: Descriptive Statistics
 1 Using SPSS, Chapter 2: Descriptive Statistics Chapters 2.1 & 2.2 Descriptive Statistics 2 Mean, Standard Deviation, Variance, Range, Minimum, Maximum 2 Mean, Median, Mode, Standard Deviation, Variance,
Welcome to PowerClaim Net Services!
 Welcome to PowerClaim Net Services! PowerClaim Net Services provides a convenient means to manage your claims over the internet and provides detailed reporting services. You can access PowerClaim Net Services
Tutorial on Using Excel Solver to Analyze Spin-Lattice Relaxation Time Data
 Tutorial on Using Excel Solver to Analyze Spin-Lattice Relaxation Time Data In the measurement of the Spin-Lattice Relaxation time T 1, a 180 o pulse is followed after a delay time of t with a 90 o pulse,
Installing Drupal on Your Local Computer
 Installing Drupal on Your Local Computer This tutorial will help you install Drupal on your own home computer and allow you to test and experiment building a Web site using this open source software. This
Social Work Portfolio Help Guide. Table of Contents. (click anything from the list below to skip to the correct information)
") Social Work Portfolio Help Guide Table of Contents (click anything from the list below to skip to the correct information) Steps to creating your Social Work portfolio Security settings for your portfolio
Social Work Portfolio Help Guide Table of Contents (click anything from the list below to skip to the correct information) Steps to creating your Social Work portfolio Security settings for your portfolio
SPSS Tests for Versions 9 to 13
 SPSS Tests for Versions 9 to 13 Chapter 2 Descriptive Statistic (including median) Choose Analyze Descriptive statistics Frequencies... Click on variable(s) then press to move to into Variable(s): list