Experiment FLU: Excitation and emission spectra, determination of quinine in tonic water
|
|
|
- Roland Cunningham
- 7 years ago
- Views:
Transcription
1 Experiment FLU: Excitation and emission spectra, determination of quinine in tonic water Learning Goals: to learn to use a fluorometer to learn to normalize results obtained on different scales to improve volumetric technique to calculate dilution factors and results correctly Flu-1 Pre-lab Assignment: 1. In your notebook, prepare a flowchart for the experiment 2. Write pre-lab calculations for standard curve preparation and sample dilution for this experiment in your notebook. 3. On looseleaf: 1. Use diagrams to describe the phenomenon of fluorescence. How is fluorescence different from absorbance spectroscopy? Discuss instrumentation, the theory of fluorescence/absorbance, advantages and disadvantages of both methods with reference to atomic energy levels. 2. What food products contain quinine? 3. If a sample shows an intensity reading of 30 on the 10% scale, what reading would it show on the 30% scale? The 100% scale? The 3% scale? 4. Why is it important to close the fluorometer shutter before opening the sample compartment lid? 5. Calculate the volume of sulfuric acid needed to prepare 2 L of 0.05 M H2SO 4. The Handbook of Chemistry and Physics lists the molarity of concentrated acids Calculate the mass of Quinine Sulfate (C20H24N2O 2) 2H2SO42H2O), MW = g required to prepare 1 L of a 0.1 g/l solution of Quinine (C20H24N2O 2), MW = g. Introduction The small number of compounds which fluoresce both limits the scope of the method and provides its greatest advantage-specificity. If a fluorometric procedure can be devised for an analysis, it is often the most simple and fastest method, and as such it is common to find fluorometric procedures used in clinical labs, radiochemical labs, and pollution control labs. The most common type of instrument is the filter fluorometer, which relies on the specificity of the compounds being analysed for its usefulness. In addition to analytical information, a large amount of information can be obtained about the electronic properties of fluorescing compounds by using double monochromator fluorescence spectrometers. The Aminco SPF 125 is used for this experiment. Fluorescence spectroscopy is extremely sensitive, usually several orders of magnitude more sensitive than UV/Vis. Where multiple methods exist for a particular determination, fluorescence is usually the most sensitive. Other advantages of fluorescence are selectivity and an extremely large linear dynamic range. Most aromatic compounds fluoresce, often with very high quantum efficiencies. Although
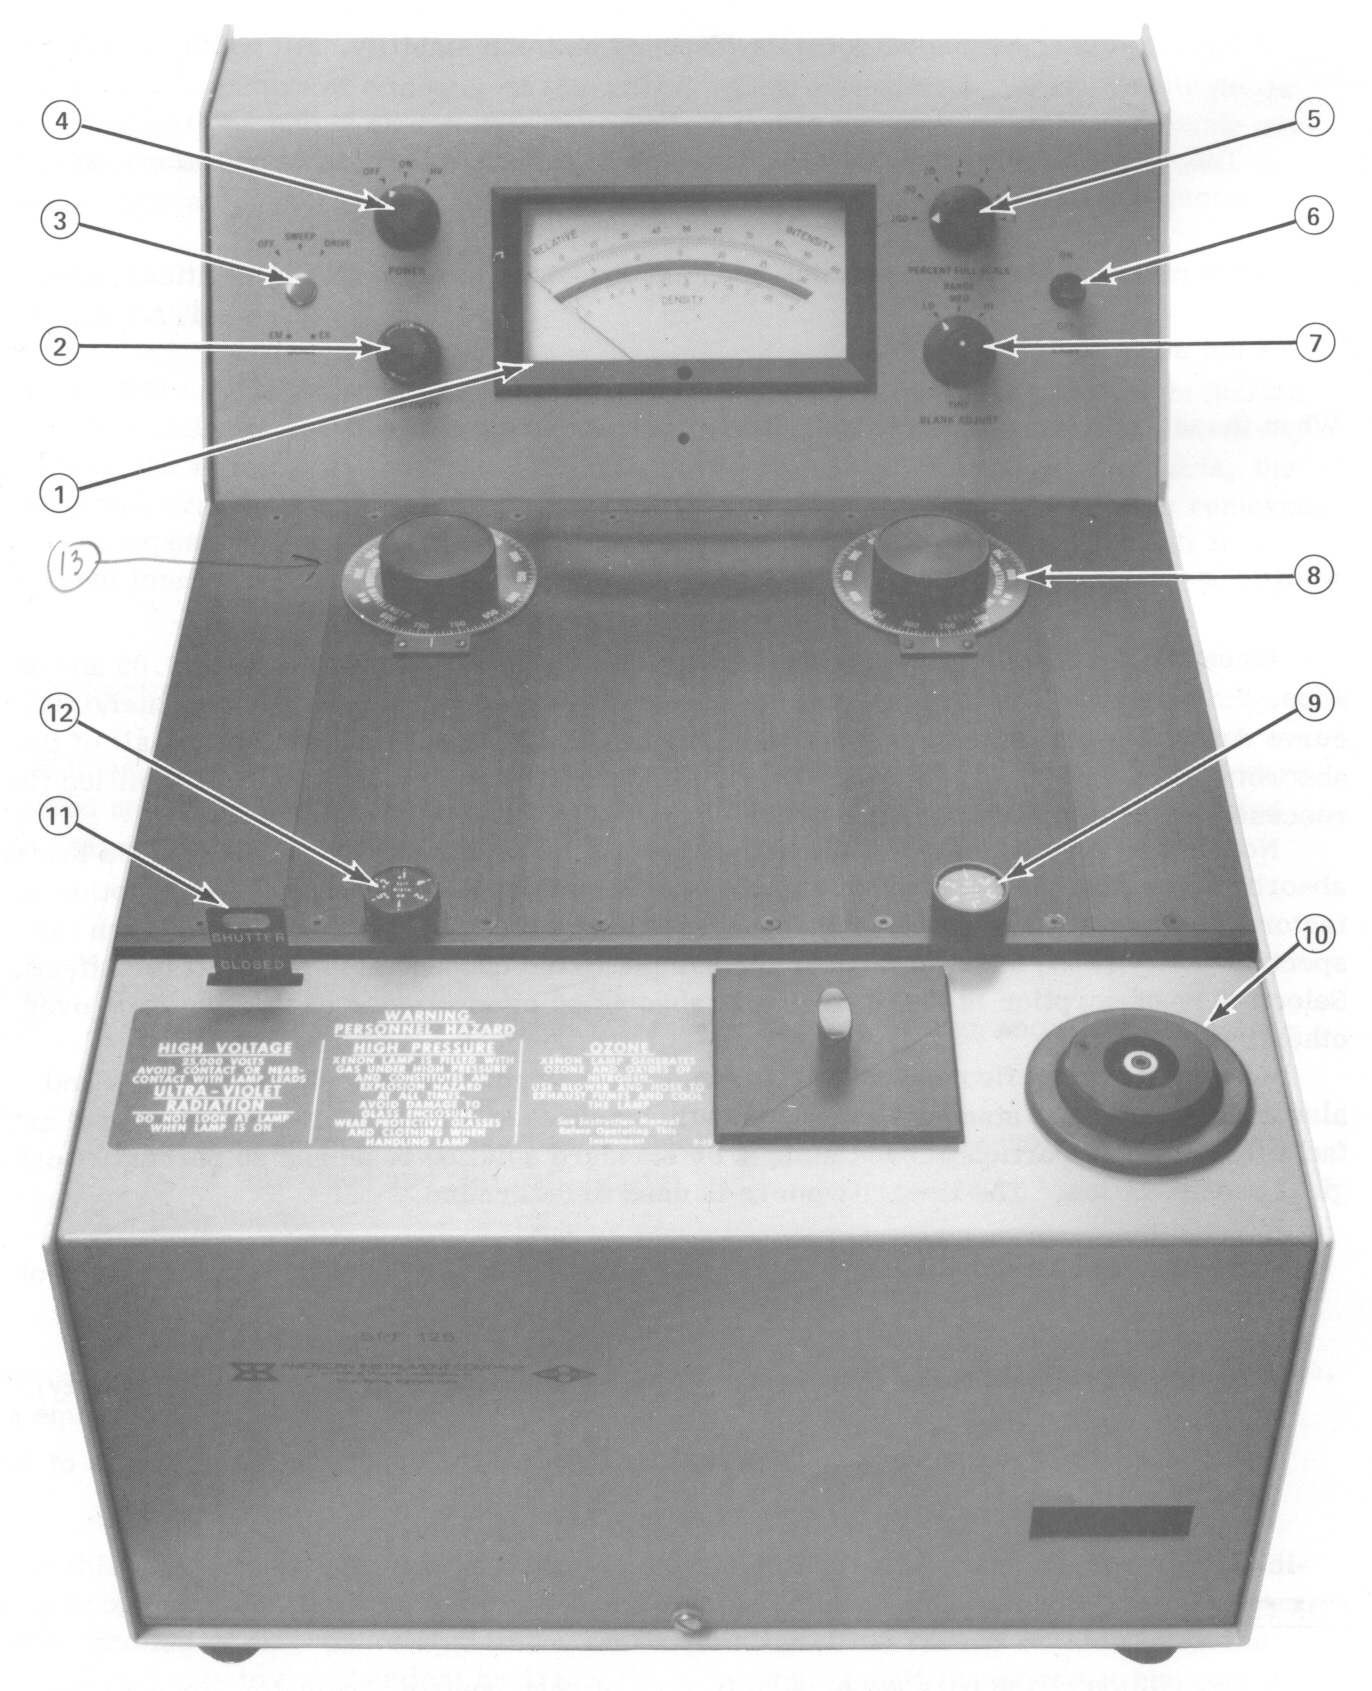
2 Flu-2 aliphatic and cyclic carbonyl compounds, as well as highly-conjugated compounds also fluoresce, it is the aromatics which are the most important, partly because most molecules of biological interest are aromatic or contain multiple aromatic rings, and thus exhibit high quantum efficiencies for fluorescence. If the compound being analyzed for natural fluorescence, as in the case of quinine, very little work-up is required for the analysis. In other cases, such as many main-group cations, the addition of organic chelating groups provides a fluorescent species in solution. This is the case for the determination of calcium, for example. Until the advent of atomic absorption methods, such fluorometric methods were very common. Theoretical considerations show that fluorescent output varies linearly with concentration only at low concentrations. This results in a number of design criteria for fluorometers. Detection Limits Detection limits for quinine are in the order of 0.05 g/ml. Applications Figure Flu-1: Optics of Fluorometer Quinine or its derivatives are used in many different products. The web site has an informative summary of the history and applications of quinine, with links to medical pages. Also, try using Google to search for quinine using the advanced search; look for quinine, but exclude malaria. The average threshold concentration of the standards used to test taste perception in humans are : sucrose (sweetness) 0.7%; sodium chloride (saltiness) 0.2%; hydrochloric acid (sourness) 0.007%; quinine sulfate (bitterness) %. Instrumentation The SPF-125 Spectrophotofluorometer is composed of three units; the main spectrometer, a lamp power supply (on a shelf to the right) and a small starter unit. The lamp power supply provides power to the lamp (duh). The lamp also requires a separate starter unit, which rests on the benchtop beside the instrument (you don t have to do anything with it, it just sits there). Refer to figures 1 through 5. The instrument can separately scan the excitation and emission wavelengths from 200 to 800 nanometers or observe the fluorescence at fixed wavelengths in that region. Note the geometry of the beam of radiation from the source, and how it differs from the straight-

3 through geometry used for UV/Vis. The reason for reading the fluorescence intensity at right angles is that scattering is a minimum at 90 ; it is a maximum at 180. Flu-3 Figure Flu-2b: % full scale Figure Flu-2a: Relative intensity scales on fluorometer. Figure Flu-2a shows the fluorometer meter display; figure Flu-2b shows the % relative full scale switch, with settings (from right side, reading counterclockwise) of 0.1, 0.3, 1, 3, 10, 30 and 100. When using the 0.1, 1, 10 or 100% full scale settings, read the top scale (from 0-100). The maximum reading of the meter is the number of the full scale setting; for example, if you are using the 0.1 scale, the maximum reading is 0.1. You would divide all of your readings by 1000 to get the absolute intensity (why?). When using the 0.3, 3 or 30 settings, use the bottom scale (from 0 to 33.3). When calculating absolute intensity for the 3 scales, use 30 as the maximum reading - not 33.
4 Flu-4
5 Flu-5 Table 1: Listing of Spectrometer Components 1. RELATIVE Indicates intensity of light detected by the photomultiplier tube. The INTENSITY meter RELATIVE INTENSITY scales are read in conjunction with the PERCENT FULL SCALE multiplier switch position. 2. SENSITIVITY control Increase measuring circuit sensitivity from times when rotated from completely (calibrate position) counterclockwise to completely clockwise. 3. SCAN controls The OFF position disconnects the scanning motor and the DC voltage. The SWEEP position connects the proportional DC voltage to the SWEEP jacks for application to the X-axis of a recorder. The drive position activates the scanning motor for either the excitation or the emission monochromator. The scan rate is 2.5 nm per second. The EM position on the inner switch selects the emission monochromator for scanning when the SCAN control is set to DRIVE. The EX position on the inner switch selects the excitation monochromator for scanning when the SCAN control is set to DRIVE. 4. POWER control Controls application of power to SPF-125. ON position places instrument in a standby condition. HV position applies high voltage to the PM tube and enables the instrument to make measurements. 5. PERCENT FULL SCALE switch 6. Lamp Cooling Fan switch 7. BLANK ADJUST RANGE switch and FINE control 8. EXCITATION WAVELENGTH The 100 through.1 positions select the calibrated sensitivity of the microphotometer's measuring circuit. This switch selects the meter scale read and the scaling factor used. Controls application of power to the lamp blower and to rear panel convenience outlet, thus applying power to the Xenon Lamp Power Supply. This switch selects the coarse range (i.e., low, medium or high) for nullification of PM tube dark current and the fluorescence/scatter generated by a blank. The FINE control is a ten-turn potentiometer used for fine nullification of these currents. These controls apply an internally generated current that is subtracted from the PM tube output signal. Enables selection and visual observation of excitation monochromator wavelength setting. Number's are in nm. 9. Excitation slit Adjusts width of excitation monochromator entrance and exit slits in the following increments: 0.1 mm (1.5 nm bandpass), 0.2 mm (2.2 nm), 0.5 mm (5.5 nm), 1 mm (11nm), 2 mm (22 nm), and 4mm (44 nm). 10 Lamp vertical Knurled knob is used to adjust vertical alignment of Xenon lamp adjustment control 11 PM shutter When up, shutter is closed, thus preventing light radiation from reaching photomultiplier tube. When pushed down, shutter is opened, thus enabling the passage of light to the PMT. 12 Emission slit width control 13 Emission Wavelength control Adjusts width of emission monochromator entrance and exit slits in the following increments: 0.1 mm (1.5 nm bandpass), 0.2 mm (2.2 nm), 0.5 mm (5.5 nm), 1 mm (11nm), 2 mm (22 nm), and 4mm (44 nm). Enables selection and visual observation of emission monochromator wavelength setting. Number's are in nm.
6 Flu-6 Figure Flu-4: Lamp Power Supply Figure Flu-5: Lamp Starter Unit Experimental procedure Solutions Preparation Dilute Sulfuric Acid, 0.05M: Dilute the appropriate volume of concentrated sulfuric acid (Caution - add acid to a large quantity of water) to 2 liters; there are 2 L volumetric flasks in the cupboard next to the sink in ELL 336 that can be used). Standard quinine solution: Prepare 1 L of a 0.1 g/l solution of Quinine solution in 0.05 M H2SO 4; verify the compound and the purity used to prepare the standard and adjust the mass as required. Quinine sulfate photo decomposes. Stock solutions should be made up fresh daily or stored in brown bottles in a cool place. If stored in brown bottles in the fridge, quinine sulfate is stable for several months. Prepare a series of standards containing between 0.1 mg/l and 0.5 mg/l Quinine in 0.05 M H SO solution. 2 4 Dilute 1.00 ml of unknown tonic water to ml with 0.05 M H2SO 4 in a volumetric flask. Prepare duplicate samples, a method spike and a sample spike for this experiment.
7 Flu-7 Instrumental Procedure Do not forget to close the PM shutter when changing samples. The fluorescence of quinine is constant in the concentration range from to 0.1M H SO. 2 4 Rinse the cell several times with each new solution between samples. Before lighting the lamp check the following: Fluorometer shutter is closed. If the fluorometer shutter is left open when the sample compartment is also open, a surge of light (from the room lights) will hit the photomultiplier tube (PMT) and swamp it. It takes the PMT about 15 minutes to recover after this happens, and causes it to age prematurely. Fluorometer scan switch is off. Fluorometer power switch is off. Exhaust vent damper is open. (Door marked Vent on the front right corner of the fluorometer). Analysis Turn on the lamp power supply (to the right of the fluorometer, on a shelf) and the lamp cooling fan switch (top right side of fluorometer). Press the "ignite" button on the lamp power supply momentarily, until the red light over the power switch lights up. Do not hold the button depressed for more than 3 seconds at a time. Turn the fluorometer power switch on (top left side of fluorometer). Allow the instrument to warm up for 15 minutes before switching to HV. This applies a warmup current to the detector (photomultiplier tube, or PMT), to help reduce the shock of the HV power application. Start with the following settings on the instrument: percent full scale 10 blank adjustment low slit widths both set at 2 emission wavelength 450 nm excitation wavelength 350 nm Note that the quartz fluorescence cuvette will be marked with a letter "Q" in one corner; always insert the cuvette the same way each time. With the shutter closed, insert the cuvette containing the blank and set the reading to zero. Use the most sensitive scale (e.g., 0.1) and leave the blank adjust control on low. Set the blank reading to zero by using the small knob in the center of the blank adjust control. Open the shutter and rezero. Close the shutter and remove the blank. Record the excitation and emission spectra of quinine as follows. With the shutter closed, insert the cuvette containing the 0.5 mg/l standard, replace the cover and then open the shutter. Adjust the % Full Scale until the reading is less than the maximum of the dial. Manually adjust the 2 monochromators to obtain the maximum intensity. If the reading goes off scale (is pinned at the far right side) then increase the %Full Scale and
8 Flu-8 continue adjusting the two monochomators. Then, turn on the chart recorder. Make sure the clip is on the end of the chart paper. The recorder will start running automatically once the instrument begins scanning. Mark the starting/ending positions and the starting/ending wavelengths on the spectrum. Record the EXcitation spectrum: leave the emission wavelength at the wavelength giving maximum intensity, and set the excitation wavelength to the minimum value on the monochromator dial. Set the inner scan knob to EX. The scan is started by turning the outer scan knob to Drive ; simultaneously start the chart recorder. When finished, turn the outer scan knob back to Off Record the EMission spectrum: set the excitation wavelength to the wavelength giving maximum intensity and then set the emission wavelength to the minimum value on the monochromator dial. Set the inner scan knob to EM, and scan as above. When you have completed the two spectra, set the monochromators to give the maximum intensity for the sample; then adjust the sensitivity control so that the maximum reading of the high standard is between 90 and 100. These wavelengths will be used for the remainder of the experiment. Close the shutter and remove the sample. Next, insert the blank again. Close the sample compartment, open the shutter and adjust the blank to zero on the most sensitive scale (i.e., 0.1%) using the fine blank adjust inner knob (leave the outer Range knob set to Low ). 1 Now, begin using the GLP order as you measure the relative intensities of the emission of the blank, standards and unknown. Adjust the percent-full-scale control to get the highest reading for each solution, without it going off scale. Make sure that you record both the percent-full-scale and the displayed intensity from the correct meter scale. When reading the sensitivity on the meter: use the display scale that corresponds with the percent-full-scale switch setting. The top scale (0-100) is used if the percent full scale is on any multiple of 10. The middle scale (0-33) is used if the percent-full-scale switch is on any multiple of 3. Supposing on the 10 scale the intensity of a sample is about 15 %; in this case you should switch to the next most sensitive scale, which is the 3 scale. To read the intensity using the 3 scale or multiples thereof use the middle scale, the intensity should still be about 15 % but you may see that now it is actually 15.5 or 16.0 % instead of just 15 %. Note that for the 3 scale the maximum reading possible is 33 1/3 %, compared with 100 % on the 10 scale. Set the %full scale to get the maximum reading, without having the needle read off scale. If the sample does not read within the range of the standard curve, you will need to reevaluate your dilution calculations; prepare a different dilution of the sample and run it again. 1 see GLP appendix.
9 Flu-9 Instrument Shutdown Shut down the instrument as follows: Switch off the lamp power supply. Switch off the fluorometer power. Allow the blower to cool the lamp for 10 minutes before switching off the fluorometer lamp fan. Close the fluorometer shutter after switching off the fan power. Treatment of Data/Reporting A full report is required for this experiment. 1. Convert all the relative intensity readings to absolute intensity. 2. Hand in the excitation spectrum and the emission spectrum. From the spectra, measure and calculate max. Compare the max/min of the spectra; do you see any correlations or similarities? Explain. 3. Plot an analytical calibration curve. 4. Determine the concentration of quinine (mg/l) in the original unknown. Also determine the concentration of quinine in the QC sample. Calculate and report your spike recoveries. 5. Calculate and report the results from the quality control sample. Record your results in the QC Data binder.
EXPERIMENT 11 UV/VIS Spectroscopy and Spectrophotometry: Spectrophotometric Analysis of Potassium Permanganate Solutions.
 EXPERIMENT 11 UV/VIS Spectroscopy and Spectrophotometry: Spectrophotometric Analysis of Potassium Permanganate Solutions. Outcomes After completing this experiment, the student should be able to: 1. Prepare
University of Wisconsin Chemistry 524 Spectroscopic Applications (GFAA, ICP, UV/Vis, Fluorescence)
") University of Wisconsin Chemistry 524 Spectroscopic Applications (GFAA, ICP, UV/Vis, Fluorescence) For this laboratory exercise, you will explore a variety of spectroscopic methods used in an analytical
University of Wisconsin Chemistry 524 Spectroscopic Applications (GFAA, ICP, UV/Vis, Fluorescence) For this laboratory exercise, you will explore a variety of spectroscopic methods used in an analytical
Austin Peay State University Department of Chemistry Chem 1111. The Use of the Spectrophotometer and Beer's Law
 Purpose To become familiar with using a spectrophotometer and gain an understanding of Beer s law and it s relationship to solution concentration. Introduction Scientists use many methods to determine
Spectrophotometry and the Beer-Lambert Law: An Important Analytical Technique in Chemistry
 Spectrophotometry and the Beer-Lambert Law: An Important Analytical Technique in Chemistry Jon H. Hardesty, PhD and Bassam Attili, PhD Collin College Department of Chemistry Introduction: In the last lab
Shimadzu UV-VIS User s Guide
 Shimadzu UV-VIS User s Guide 1) Push the F4 button on the UV-VIS instrument keypad. This will enable PC control. Push the F4 Button 2) Log into the UV-VIS software with your username and password. 3) After
Experiment #5: Qualitative Absorption Spectroscopy
 Experiment #5: Qualitative Absorption Spectroscopy One of the most important areas in the field of analytical chemistry is that of spectroscopy. In general terms, spectroscopy deals with the interactions
Using the Spectrophotometer
 Using the Spectrophotometer Introduction In this exercise, you will learn the basic principals of spectrophotometry and and serial dilution and their practical application. You will need these skills to
A Beer s Law Experiment
 A Beer s Law Experiment Introduction There are many ways to determine concentrations of a substance in solution. So far, the only experiences you may have are acid-base titrations or possibly determining
ATOMIC ABSORTION SPECTROSCOPY: rev. 4/2011 ANALYSIS OF COPPER IN FOOD AND VITAMINS
 1 ATOMIC ABSORTION SPECTROSCOPY: rev. 4/2011 ANALYSIS OF COPPER IN FOOD AND VITAMINS Buck Scientific Atomic Absorption Spectrophotometer, Model 200 Atomic absorption spectroscopy (AAS) has for many years
Problem Set 6 UV-Vis Absorption Spectroscopy. 13-1. Express the following absorbances in terms of percent transmittance:
 Problem Set 6 UV-Vis Absorption Spectroscopy 13-1. Express the following absorbances in terms of percent transmittance: a 0.051 b 0.918 c 0.379 d 0.261 e 0.485 f 0.072 A = log P o /P = log1/t = - log T
Chem 131A: Absorbance of Riboflavin
 Chem 131A: Absorbance of Riboflavin Purpose: The purpose of this experiment is to: 1) Familiarize the student with the use of the HP 8452 diode array spectrophotometer, 2) examine the limitations of the
EXPERIMENT 5. Molecular Absorption Spectroscopy: Determination of Iron With 1,10-Phenanthroline
 EXPERIMENT 5 Molecular Absorption Spectroscopy: Determination of Iron With 1,10-Phenanthroline UNKNOWN Submit a clean, labeled 100-mL volumetric flask to the instructor so that your unknown iron solution
Determining the Quantity of Iron in a Vitamin Tablet. Evaluation copy
 Determining the Quantity of Iron in a Vitamin Tablet Computer 34 As biochemical research becomes more sophisticated, we are learning more about the role of metallic elements in the human body. For example,
What s in the Mix? Liquid Color Spectroscopy Lab (Randy Landsberg & Bill Fisher)
") What s in the Mix? Liquid Color Spectroscopy Lab (Randy Landsberg & Bill Fisher) Introduction: There is more to a color than a name. Color can tell us lots of information. In this lab you will use a spectrophotometer
What s in the Mix? Liquid Color Spectroscopy Lab (Randy Landsberg & Bill Fisher) Introduction: There is more to a color than a name. Color can tell us lots of information. In this lab you will use a spectrophotometer
The Determination of an Equilibrium Constant
 The Determination of an Equilibrium Constant Computer 10 Chemical reactions occur to reach a state of equilibrium. The equilibrium state can be characterized by quantitatively defining its equilibrium
Colorimetric Determination of Iron in Vitamin Tablets
 Cautions: 6 M hydrochloric acid is corrosive. Purpose: To colorimetrically determine the mass of iron present in commercial vitamin tablets using a prepared calibration curve. Introduction: Iron is considered
Chemistry 111 Lab: Intro to Spectrophotometry Page E-1
 Chemistry 111 Lab: Intro to Spectrophotometry Page E-1 SPECTROPHOTOMETRY Absorption Measurements & their Application to Quantitative Analysis study of the interaction of light (or other electromagnetic
Lab #11: Determination of a Chemical Equilibrium Constant
 Lab #11: Determination of a Chemical Equilibrium Constant Objectives: 1. Determine the equilibrium constant of the formation of the thiocyanatoiron (III) ions. 2. Understand the application of using a
Graphite Furnace AA, Page 1 DETERMINATION OF METALS IN FOOD SAMPLES BY GRAPHITE FURNACE ATOMIC ABSORPTION SPECTROSCOPY (VERSION 1.
 Graphite Furnace AA, Page 1 DETERMINATION OF METALS IN FOOD SAMPLES BY GRAPHITE FURNACE ATOMIC ABSORPTION SPECTROSCOPY I. BACKGROUND (VERSION 1.0) Atomic absorption spectroscopy (AAS) is a widely used
ATOMIC SPECTRA. Apparatus: Optical spectrometer, spectral tubes, power supply, incandescent lamp, bottles of dyed water, elevating jack or block.
 1 ATOMIC SPECTRA Objective: To measure the wavelengths of visible light emitted by atomic hydrogen and verify the measured wavelengths against those predicted by quantum theory. To identify an unknown
The Measurement of Sensitivity in Fluorescence Spectroscopy
 The Measurement of Sensitivity in Fluorescence Spectroscopy Among instrumental techniques, fluorescence spectroscopy is recognized as one of the more sensitive. In fluorescence, the intensity of the emission
Spectroscopy. Biogeochemical Methods OCN 633. Rebecca Briggs
 Spectroscopy Biogeochemical Methods OCN 633 Rebecca Briggs Definitions of Spectrometry Defined by the method used to prepare the sample 1. Optical spectrometry Elements are converted to gaseous atoms or
2 Spectrophotometry and the Analysis of Riboflavin
 2 Spectrophotometry and the Analysis of Riboflavin Objectives: A) To become familiar with operating the Platereader; B) to learn how to use the Platereader in determining the absorption spectrum of a compound
MCAL Spectrophotometry. Spectrophotometry
 MCAL Spectrophotometry Instruments include: Cary 50 UV-vis Spectrophotometer Eclipse Spectrofluorometer HPLC Diode Array and Fluorescence ICP-OES with CCD detection Spectrophotometry The instruments all
KINETIC DETERMINATION OF SELENIUM BY VISIBLE SPECTROSCOPY (VERSION 1.8)
") Selenium Determination, Page 1 KINETIC DETERMINATION OF SELENIUM BY VISIBLE SPECTROSCOPY I. BACKGROUND. (VERSION 1.8) The majority of reactions used in analytical chemistry possess the following characteristics:
Selenium Determination, Page 1 KINETIC DETERMINATION OF SELENIUM BY VISIBLE SPECTROSCOPY I. BACKGROUND. (VERSION 1.8) The majority of reactions used in analytical chemistry possess the following characteristics:
Fundamentals of modern UV-visible spectroscopy. Presentation Materials
 Fundamentals of modern UV-visible spectroscopy Presentation Materials The Electromagnetic Spectrum E = hν ν = c / λ 1 Electronic Transitions in Formaldehyde 2 Electronic Transitions and Spectra of Atoms
Determining the Free Chlorine Content of Swimming Pool Water. HOCl H + + OCl. Evaluation copy
 Determining the Free Chlorine Content of Swimming Pool Water Computer 33 Physicians in the nineteenth century used chlorine water as a disinfectant. Upon the discovery that certain diseases were transmitted
Copyright 1999 2010 by Mark Brandt, Ph.D. 12
 Introduction to Absorbance Spectroscopy A single beam spectrophotometer is comprised of a light source, a monochromator, a sample holder, and a detector. An ideal instrument has a light source that emits
Beckman Coulter DTX 880 Multimode Detector Bergen County Technical Schools Stem Cell Lab
 Beckman Coulter DTX 880 Multimode Detector Bergen County Technical Schools Stem Cell Lab Room 213 Beckman Coulter DTX 880 Multimode Detector Information The Beckman Coulter DTX 880 Multimode Detector is
SPECTROSCOPY. Light interacting with matter as an analytical tool
 SPECTROSCOPY Light interacting with matter as an analytical tool Electronic Excitation by UV/Vis Spectroscopy : X-ray: core electron excitation UV: valance electronic excitation IR: molecular vibrations
The photoionization detector (PID) utilizes ultraviolet
 utilizes ultraviolet") Chapter 6 Photoionization Detectors The photoionization detector (PID) utilizes ultraviolet light to ionize gas molecules, and is commonly employed in the detection of volatile organic compounds (VOCs).
Chapter 6 Photoionization Detectors The photoionization detector (PID) utilizes ultraviolet light to ionize gas molecules, and is commonly employed in the detection of volatile organic compounds (VOCs).
Appendix C. Vernier Tutorial
 C-1. Vernier Tutorial Introduction: In this lab course, you will collect, analyze and interpret data. The purpose of this tutorial is to teach you how to use the Vernier System to collect and transfer
Reaction Stoichiometry and the Formation of a Metal Ion Complex
 Reaction Stoichiometry and the Formation of a Metal Ion Complex Objectives The objectives of this laboratory are as follows: To use the method of continuous variation to determine the reaction stoichiometry
Absorbance Spectrophotometry: Analysis of FD&C Red Food Dye #40
 Absorbance Spectrophotometry: Analysis of FD&C Red Food Dye #40 Note: there is a second document that goes with this one! 2046 - Absorbance Spectrophotometry - Calibration Curve Procedure. The second document
3 - Atomic Absorption Spectroscopy
 3 - Atomic Absorption Spectroscopy Introduction Atomic-absorption (AA) spectroscopy uses the absorption of light to measure the concentration of gas-phase atoms. Since samples are usually liquids or solids,
Determination of the Mass Percentage of Copper in a Penny. Introduction
 Determination of the Mass Percentage of Copper in a Penny Introduction This experiment will cost you one penny ($0.01). The penny must be minted after 1983. Any penny will do; for best results the penny
The purposes of this experiment are to test Faraday's Law qualitatively and to test Lenz's Law.
 260 17-1 I. THEORY EXPERIMENT 17 QUALITATIVE STUDY OF INDUCED EMF Along the extended central axis of a bar magnet, the magnetic field vector B r, on the side nearer the North pole, points away from this
Phenolphthalein-NaOH Kinetics
 Phenolphthalein-NaOH Kinetics Phenolphthalein is one of the most common acid-base indicators used to determine the end point in acid-base titrations. It is also the active ingredient in some laxatives.
22.302 Experiment 5. Strain Gage Measurements
 22.302 Experiment 5 Strain Gage Measurements Introduction The design of components for many engineering systems is based on the application of theoretical models. The accuracy of these models can be verified
Chem 1B Saddleback College Dr. White 1. Experiment 8 Titration Curve for a Monoprotic Acid
 Chem 1B Saddleback College Dr. White 1 Experiment 8 Titration Curve for a Monoprotic Acid Objectives To learn the difference between titration curves involving a strong acid with a strong base and a weak
Ultraviolet Spectroscopy
 Ultraviolet Spectroscopy The wavelength of UV and visible light are substantially shorter than the wavelength of infrared radiation. The UV spectrum ranges from 100 to 400 nm. A UV-Vis spectrophotometer
Hitachi U-4100 UV-vis-NIR spectrophotometer (341-F)
") Hitachi U-4100 UV-vis-NIR spectrophotometer (341-F) Please contact Dr. Amanda Young for training requests and assistance: 979-862-6845, amandayoung@tamu.edu Hardware Our spectrophotometer is made up of
Hitachi U-4100 UV-vis-NIR spectrophotometer (341-F) Please contact Dr. Amanda Young for training requests and assistance: 979-862-6845, amandayoung@tamu.edu Hardware Our spectrophotometer is made up of
Experiment 13H THE REACTION OF RED FOOD COLOR WITH BLEACH 1
 Experiment 13H FV 1/25/2011(2-run) THE REACTION OF RED FOOD COLOR WITH BLEACH 1 PROBLEM: Determine the rate law for the chemical reaction between FD&C Red Dye #3 and sodium hypochlorite. LEARNING OBJECTIVES:
Lab 3 - DC Circuits and Ohm s Law
 Lab 3 DC Circuits and Ohm s Law L3-1 Name Date Partners Lab 3 - DC Circuits and Ohm s Law OBJECTIES To learn to apply the concept of potential difference (voltage) to explain the action of a battery in
Colorimetry Extinction coefficient (ε) Lambda max (λ max ) Qualitative vs. quantitative analysis
 Lambda max (λ max ) Qualitative vs. quantitative analysis") Lab Week 2 - Spectrophotometry Purpose: Introduce students to the use of spectrophotometry for qualitative (what is it) and quantitative (how much is there of it) analysis of biological samples and molecules.
Lab Week 2 - Spectrophotometry Purpose: Introduce students to the use of spectrophotometry for qualitative (what is it) and quantitative (how much is there of it) analysis of biological samples and molecules.
Quantitation of Peptides and Amino Acids with a Synergy HT using UV Fluorescence
 Quantitation of Peptides and Amino Acids with a Synergy HT using UV Fluorescence Introduction Eukaryotic and prokaryotic cells contain a number of compounds that are fluorescent with UV light excitation.
Experiment 5. Lasers and laser mode structure
 Northeastern University, PHYS5318 Spring 2014, 1 1. Introduction Experiment 5. Lasers and laser mode structure The laser is a very important optical tool that has found widespread use in science and industry,
Time out states and transitions
 Time out states and transitions Spectroscopy transitions between energy states of a molecule excited by absorption or emission of a photon hn = DE = E i - E f Energy levels due to interactions between
E/M Experiment: Electrons in a Magnetic Field.
 E/M Experiment: Electrons in a Magnetic Field. PRE-LAB You will be doing this experiment before we cover the relevant material in class. But there are only two fundamental concepts that you need to understand.
Experiment 2 Kinetics II Concentration-Time Relationships and Activation Energy
 2-1 Experiment 2 Kinetics II Concentration-Time Relationships and Activation Energy Introduction: The kinetics of a decomposition reaction involving hydroxide ion and crystal violet, an organic dye used
CHEM 161: Beer s Law and Analysis of a Sports Drink
 CHEM 161: Beer s Law and Analysis of a Sports Drink Introduction Although sunlight appears white, it contains a spectrum of colors. A rainbow actually shows this range of colors in visible light: violet,
Lab 5: Quantitative Analysis- Phosphates in Water By: A Generous Student. LBS 171L Section 9 TA: Dana October 27, 2005
 How uch Phosphate is the Body Being Exposed to During a Lifetime by Showering? Lab 5: Quantitative Analysis- Phosphates in Water By: A Generous Student LBS 171L Section 9 TA: Dana October 7, 005 [Note:
Flame Direct Attach UV-VIS Integrated Sampling System Installation and Operation Instructions
 Flame Direct Attach UV-VIS Integrated Sampling System Installation and Operation Instructions Description The Flame Integrated Sampling System (FLAME-DA-CUV-UV-VIS) is a snap-on, direct-attach 1 cm cuvette
Spectrophotometry Practical Lesson on Medical Chemistry and Biochemistry
 Spectrophotometry Practical Lesson on Medical Chemistry and Biochemistry General Medicine Jiřina Crkovská (translated by Jan Pláteník) 2010/2011 1 Spectrophotometry is one of the most widely used instrumental
Lab 2. Spectrophotometric Measurement of Glucose
 Lab 2 Spectrophotometric Measurement of Glucose Objectives 1. Learn how to use a spectrophotometer. 2. Produce a glucose standard curve. 3. Perform a glucose assay. Safety Precautions Glucose Color Reagent
Chapter 5 -- The Spectrophotometric Determination of the ph of a Buffer. NAME: Lab Section: Date: Sign-Off:
 Chapter 5 -- The Spectrophotometric Determination of the ph of a Buffer NAME: Lab Section: Date: Sign-Off: Chapter 5 -- The Spectrophotometric Determination of the ph of a Buffer Introduction Weak acids,
Measuring Protein Concentration through Absorption Spectrophotometry
 Measuring Protein Concentration through Absorption Spectrophotometry In this lab exercise you will learn how to homogenize a tissue to extract the protein, and then how to use a protein assay reagent to
UV-Vis spectrophotometers
 UV-Vis spectrophotometers an Advanced Digital Technology EXPERIENCE SECOMAM is proud to provide the new fourthgeneration UVIKON ultraviolet-visible spectrophotometers.with more than five decades of experience
Physics 41, Winter 1998 Lab 1 - The Current Balance. Theory
 Physics 41, Winter 1998 Lab 1 - The Current Balance Theory Consider a point at a perpendicular distance d from a long straight wire carrying a current I as shown in figure 1. If the wire is very long compared
COMMON LABORATORY APPARATUS
 COMMON LABORATORY APPARATUS Beakers are useful as a reaction container or to hold liquid or solid samples. They are also used to catch liquids from titrations and filtrates from filtering operations. Bunsen
ESS Method 130.1: General Auto Analyzer Procedures
 ESS Method 130.1: General Auto Analyzer Procedures Environmental Sciences Section Inorganic Chemistry Unit Wisconsin State Lab of Hygiene 465 Henry Mall Madison, WI 53706 Revised October 1992 ESS Method
Pesticide Analysis by Mass Spectrometry
 Pesticide Analysis by Mass Spectrometry Purpose: The purpose of this assignment is to introduce concepts of mass spectrometry (MS) as they pertain to the qualitative and quantitative analysis of organochlorine
GRID AND PRISM SPECTROMETERS
 FYSA230/2 GRID AND PRISM SPECTROMETERS 1. Introduction Electromagnetic radiation (e.g. visible light) experiences reflection, refraction, interference and diffraction phenomena when entering and passing
THE BOHR QUANTUM MODEL
 THE BOHR QUANTUM MODEL INTRODUCTION When light from a low-pressure gas is subject to an electric discharge, a discrete line spectrum is emitted. When light from such a low-pressure gas is examined with
COLORIMETER. Description 0358BT. Figure 1. The Colorimeter
 COLORIMETER Description 0358BT Figure 1. The Colorimeter Introduction The Colorimeter is designed to determine the concentration of a solution by analyzing its color intensity. Monochromatic light from
ELECTRON SPIN RESONANCE Last Revised: July 2007
 QUESTION TO BE INVESTIGATED ELECTRON SPIN RESONANCE Last Revised: July 2007 How can we measure the Landé g factor for the free electron in DPPH as predicted by quantum mechanics? INTRODUCTION Electron
Agilent Cary 60 UV-Vis
 Agilent Cary 60 UV-Vis Efficient. Accurate. Flexible. Specifications Introduction The Agilent Cary 60 UV-Vis spectrophotometer is efficient, accurate and flexible, and is designed to meet both current
Ultraviolet-Visible (UV-Vis) Spectroscopy Background Information
 Spectroscopy Background Information") 1 Ultraviolet-Visible (UV-Vis) Spectroscopy Background Information Instructions for the Operation of the Cary 300 Bio UV-Visible Spectrophotometer See the Thermo OMNIC Help reference on page 49. Ultraviolet-Visible
1 Ultraviolet-Visible (UV-Vis) Spectroscopy Background Information Instructions for the Operation of the Cary 300 Bio UV-Visible Spectrophotometer See the Thermo OMNIC Help reference on page 49. Ultraviolet-Visible
Upon completion of this lab, the student will be able to:
 1 Learning Outcomes EXPERIMENT B4: CHEMICAL EQUILIBRIUM Upon completion of this lab, the student will be able to: 1) Analyze the absorbance spectrum of a sample. 2) Calculate the equilibrium constant for
Spectrophotometer - Milton Roy Spectronic 21D or equivalent.
 3M COMPANY OCCUPATIONAL HEALTH AND ENVIRONMENTAL SAFETY DIVISION DETERMINATION OF FORMALDEHYDE VAPORS IN AIR USING 3M 3721 FORMALDEHYDE MONITORS May, 2002 SCOPE This procedure covers the method of collecting
UV/VIS/IR SPECTROSCOPY ANALYSIS OF NANOPARTICLES
 UV/VIS/IR SPECTROSCOPY ANALYSIS OF NANOPARTICLES SEPTEMBER 2012, V 1.1 4878 RONSON CT STE K SAN DIEGO, CA 92111 858-565 - 4227 NANOCOMPOSIX.COM Note to the Reader: We at nanocomposix have published this
Experiment #3, Ohm s Law
 Experiment #3, Ohm s Law 1 Purpose Physics 182 - Summer 2013 - Experiment #3 1 To investigate the -oltage, -, characteristics of a carbon resistor at room temperature and at liquid nitrogen temperature,
Spectrophotometric Determination of the pka of Bromothymol Blue
 Spectrophotometric Determination of the pka of Bromothymol Blue INRODUCION cidbase indicators are compounds that are simply weak acids (or bases) that exhibit different colors depending on whether they
Beer's Law: Colorimetry of Copper(II) Solutions
 Solutions") Exercise 11 Page 1 Illinois Central College CHEMISTRY 130 Name: Beer's Law: Colorimetry of Copper(II) Solutions Objectives In this experiment, we will use Beer's Law to determine the unknown concentrations
Exercise 11 Page 1 Illinois Central College CHEMISTRY 130 Name: Beer's Law: Colorimetry of Copper(II) Solutions Objectives In this experiment, we will use Beer's Law to determine the unknown concentrations
Infrared Spectroscopy: Theory
 u Chapter 15 Infrared Spectroscopy: Theory An important tool of the organic chemist is Infrared Spectroscopy, or IR. IR spectra are acquired on a special instrument, called an IR spectrometer. IR is used
VCR Ion Beam Sputter Coater
 VCR Ion Beam Sputter Coater Sputtering Process and Rates 2 Vacuum System 3 Loading the Sputter Chamber 4 Sputter Coating 5 Removing Samples from Chamber 6 Appendix A: VCR High Vacuum Gauge Conditioning
Factors Affecting Enzyme Activity
 INTRODUCTION Factors Affecting Enzyme Activity The chemical reactions occurring in living things are controlled by enzymes. An enzyme is a protein in the cell which lowers the activation energy of a catalyzed
Interferometers. OBJECTIVES To examine the operation of several kinds of interferometers. d sin = n (1)
") Interferometers The true worth of an experimenter consists in his pursuing not only what he seeks in his experiment, but also what he did not seek. Claude Bernard (1813-1878) OBJECTIVES To examine the
Interferometers The true worth of an experimenter consists in his pursuing not only what he seeks in his experiment, but also what he did not seek. Claude Bernard (1813-1878) OBJECTIVES To examine the
Phosphorus, colorimetry, phosphomolybdate, automated-segmented flow
 Phosphorus, colorimetry, phosphomolybdate, automated-segmented flow Parameter and code: Phosphorus, total-in-bottom-material, dry weight, I-6600-88 (mg/kg as P): 00668 1. Application This method is used
O6: The Diffraction Grating Spectrometer
 2B30: PRACTICAL ASTROPHYSICS FORMAL REPORT: O6: The Diffraction Grating Spectrometer Adam Hill Lab partner: G. Evans Tutor: Dr. Peter Storey 1 Abstract The calibration of a diffraction grating spectrometer
Becton-Dickinson FACSCalibur Flow Cytometer Instructions
 Start-up 1. Turn on flow cytometer by pushing green button on right side of instrument, toward the back. Give it 30 minutes to warm up before collecting data. 2. Turn on monitor. 3. Turn on computer. If
LIQUID CHROMATOGRAPHY HOW MUCH ASPIRIN, ACETAMINOPHEN, AND CAFFEINE ARE IN YOUR PAIN RELIEVER? USING HPLC TO QUANTITATE SUBSTANCES (Revised: 1-13-93)
") INTRODUCTION HOW MUCH ASPIRIN, ACETAMINOPHEN, AND CAFFEINE ARE IN YOUR PAIN RELIEVER? USING HPLC TO QUANTITATE SUBSTANCES (Revised: 1-13-93) Headache, sore muscles, arthritis pain... How do you spell relief?
INTRODUCTION HOW MUCH ASPIRIN, ACETAMINOPHEN, AND CAFFEINE ARE IN YOUR PAIN RELIEVER? USING HPLC TO QUANTITATE SUBSTANCES (Revised: 1-13-93) Headache, sore muscles, arthritis pain... How do you spell relief?
Micromass LCT User s Guide
 Micromass LCT User s Guide 1) Log on to MassLynx with your username & password. 2) After you have logged in, the MassLynx software will automatically run. 3) After MassLynx has come up, open your project
GENERAL SCIENCE LABORATORY 1110L Lab Experiment 6: Ohm s Law
 GENERAL SCIENCE LABORATORY 1110L Lab Experiment 6: Ohm s Law OBJECTIVES: To verify Ohm s law, the mathematical relationship among current, voltage or potential difference, and resistance, in a simple circuit.
Chemistry 112 Laboratory Experiment 6: The Reaction of Aluminum and Zinc with Hydrochloric Acid
 Chemistry 112 Laboratory Experiment 6: The Reaction of Aluminum and Zinc with Hydrochloric Acid Introduction Many metals react with acids to form hydrogen gas. In this experiment, you will use the reactions
Cary 100 Bio UV-Vis Operating Instructions 09/25/2012 S.V.
 1234 Hach Hall 515-294-5805 www.cif.iastate.edu Cary 100 Bio UV-Vis Operating Instructions 09/25/2012 S.V. Location: Contact: 1240 Hach Hall Steve Veysey, 1234 Hach Hall Safety All researchers working
Calibration and Use of a Strain-Gage-Instrumented Beam: Density Determination and Weight-Flow-Rate Measurement
 Chapter 2 Calibration and Use of a Strain-Gage-Instrumented Beam: Density Determination and Weight-Flow-Rate Measurement 2.1 Introduction and Objectives This laboratory exercise involves the static calibration
FIBRE-OPTICS POWER METER INSTRUCTION MANUAL
 FIBRE-OPTICS POWER METER INSTRUCTION MANUAL FIBRE-OPTICS POWER METER ELLMAX ELECTRONICS LTD. Unit 29, Leyton Business Centre, Etloe Road, Leyton, London E10 7BT, England Tel: 020-8539 0136 Fax: 020-8539
Project 2B Building a Solar Cell (2): Solar Cell Performance
: Solar Cell Performance") April. 15, 2010 Due April. 29, 2010 Project 2B Building a Solar Cell (2): Solar Cell Performance Objective: In this project we are going to experimentally measure the I-V characteristics, energy conversion
April. 15, 2010 Due April. 29, 2010 Project 2B Building a Solar Cell (2): Solar Cell Performance Objective: In this project we are going to experimentally measure the I-V characteristics, energy conversion
The Determination of an Equilibrium Constant
 The Determination of an Equilibrium Constant Chemical reactions occur to reach a state of equilibrium. The equilibrium state can be characterized by quantitatively defining its equilibrium constant, K
Cadmium Reduction Method Method 8039 0.3 to 30.0 mg/l NO 3 N (HR) Powder Pillows or AccuVac Ampuls
 Powder Pillows or AccuVac Ampuls") Nitrate DOC316.53.01066 Cadmium Reduction Method Method 8039 0.3 to 30.0 mg/l NO 3 N (HR) Powder Pillows or AccuVac Ampuls Scope and application: For water, wastewater and seawater. Test preparation Instrument-specific
Nitrate DOC316.53.01066 Cadmium Reduction Method Method 8039 0.3 to 30.0 mg/l NO 3 N (HR) Powder Pillows or AccuVac Ampuls Scope and application: For water, wastewater and seawater. Test preparation Instrument-specific
Building your own Spectroscope
 Building your own Spectroscope 0-0.341-0.445-0.606-0.872-1.36 Lyman Balmer Paschen n=4 n=8 n=7 n=6 n=5 n=4 ENERGY/10-19 J -2.42-5.45 E 5 2 E 4 2 E 3 2 E E 5 3 4 3 n=3 n=2 (Many other transitions beyond
Coordination Compounds with Copper (II) Prelab (Week 2)
 Prelab (Week 2)") Coordination Compounds with Copper (II) Prelab (Week 2) Name Total /10 SHOW ALL WORK NO WORK = NO CREDIT 1. What is the purpose of this experiment? 2. Write the generic chemical formula for the coordination
Coordination Compounds with Copper (II) Prelab (Week 2) Name Total /10 SHOW ALL WORK NO WORK = NO CREDIT 1. What is the purpose of this experiment? 2. Write the generic chemical formula for the coordination
Experiment 3: Magnetic Fields of a Bar Magnet and Helmholtz Coil
 MASSACHUSETTS INSTITUTE OF TECHNOLOGY Department of Physics 8.02 Spring 2006 Experiment 3: Magnetic Fields of a Bar Magnet and Helmholtz Coil OBJECTIVES 1. To learn how to visualize magnetic field lines
Parallel Plate Capacitor
 Parallel Plate Capacitor Capacitor Charge, Plate Separation, and Voltage A capacitor is used to store electric charge. The more voltage (electrical pressure) you apply to the capacitor, the more charge
Molecular Spectroscopy
 Molecular Spectroscopy UV-Vis Spectroscopy Absorption Characteristics of Some Common Chromophores UV-Vis Spectroscopy Absorption Characteristics of Aromatic Compounds UV-Vis Spectroscopy Effect of extended
Electrical Resonance
 Electrical Resonance (R-L-C series circuit) APPARATUS 1. R-L-C Circuit board 2. Signal generator 3. Oscilloscope Tektronix TDS1002 with two sets of leads (see Introduction to the Oscilloscope ) INTRODUCTION
where h = 6.62 10-34 J s
 Electromagnetic Spectrum: Refer to Figure 12.1 Molecular Spectroscopy: Absorption of electromagnetic radiation: The absorptions and emissions of electromagnetic radiation are related molecular-level phenomena
Chemistry 118 Laboratory University of Massachusetts Boston Beer s Law
 Name: LEARNING GOALS: Chemistry 118 Laboratory University of Massachusetts Boston Beer s Law 1. Become familiar with the concept of concentration and molarity. 2. Become familiar with making dilutions
6/2016 E&M forces-1/8 ELECTRIC AND MAGNETIC FORCES. PURPOSE: To study the deflection of a beam of electrons by electric and magnetic fields.
 6/016 E&M forces-1/8 ELECTRIC AND MAGNETIC FORCES PURPOSE: To study the deflection of a beam of electrons by electric and magnetic fields. APPARATUS: Electron beam tube, stand with coils, power supply,