Lecture 6 Statistical Tests. Confidence intervals Student test ANOVA test Fisher test for variances Nonparametric tests
|
|
|
- Gillian Wendy Fletcher
- 7 years ago
- Views:
Transcription
1 Lecture 6 Statistical Tests Confidence intervals Student test ANOVA test Fisher test for variances Nonparametric tests

2 Gauss Curve Average=100, Standard deviation=15
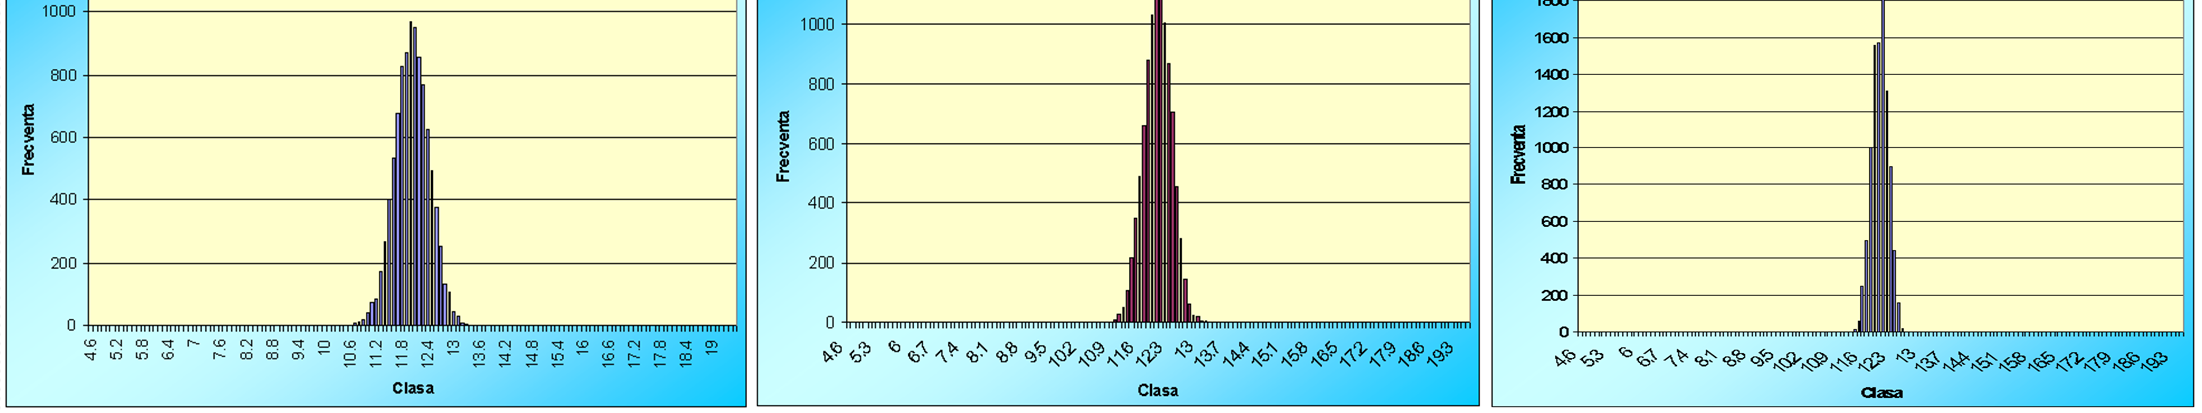
3 Sample from a normal population In the following 9 images you will see: In the first one the distribution of values for a Gauss population In the second - the distribution of averages computed for groups of two individuals In the next images, the distribution of averages computed for groups of 3, 4, 9, 16, 25, 36 and 100 individuals
4
5 Conclusion: Averages calculated on a sample of size n drawn from a Gaussian distributed population have: A Gaussian distribution An average equal to the average of the population of origin Standard deviation equal to the deviation of the population divided by square root of n= STANDARD ERROR! Err = σ / n
6 Confidence interval- definition We call confidence interval for the mean an interval of real numbers where we are almost certain that the real mean is located. The level of confidence can be chosen; usually it is 95% or 99% P m t c s n m t c s n 0,95
7 Example: CI 95% Values: Latencies measured over the optic nerve Average: 112,2 Standard deviation: 12,5 Number of cases: 156 Standard error: Coefficient used for 95% confidence: The limits of the interval are: => CI 95% =[110.24; 114,16]
8 What is a statistical test? It is a decision method that helps us to validate or invalidate a statistical hypothesis with a certain degree of confidence.
9 Statistical tests Statistical tests verify the truthfulness of statistical hypotheses => a process called statistical inference hypothesis H0 (or null hypothesis) data have no connections between them/ compared values do not differ hypothesis H1 (or alternate hypothesis) data have connections between them/ compared values do differ
10 Statistical tests The result of the test is denoted as p. p is a number between 0 and 1 (or 0% and 100%), and it represents the probability to make an error if we reject H0, the null hypothesis. Interpreting p (the same for all statistical tests): p > 0.05, the statistical relationship is not significant (NS). p < 0.05, the statistical relationship is significant (S, 95% confidence). p < 0.01, the statistical relationship is significant (S, 99% confidence). p < 0.001, the statistical relationship is highly significant (HS, 99.9% confidence).
11 Student t test Test for comparing two means when the standard deviations are equal It can be used if: 1. measurements from the two samples are independent 2. the samples come from populations that are normally distributed (which must be verified before applying the test) 3. the populations from which the samples are drawn have equal dispersions (or standard deviations)
12 Student t test We call H0 the null hypothesis - the assumption that the averages of the populations (from which the samples are drawn) are equal -----H 0 : m 1 = m 2 We call H1 the alternate hypothesis - the assumption that the averages of the populations are different H 1 : m 1 m 2 If the test doesn t reject H 0, we say that data do not support the hypothesis that the populations means are different If the test rejects H 0, we say that data support the hypothesis that the populations means are different
13 Example We analyzed 25 patients with localised infection and 25 with sepsis, among other measurements we recorded ESR value. Pacient No. Localised infection Sepsis Media Deviaţia standard Dispersia C.V. (%) 44.67% 34.81% Mean ± standard deviation t Test: Two Sample Assuming Equal Variances Localised infection ESR p<0,05 we reject H 0 with a confidence of 95% Sepsis p test Student = S Localised infection Sepsis EXPLANATIONS Mean Samples averages Variance Samples variance Observations Number of patients Pooled Variance Hypothesized Mean Difference 0 df 48 Degrees of freedom: t Stat Computed t value P(T<=t) one tail t Critical one tail P(T<=t) two tail p test result t Critical two tail Theoretical t value)
14 Confidence interval analysis Parameter Localised infection Sepsis No. of patients Mean value Standard deviation Standard error t 95% for df= Error level for 95% conf Lower limit Upper limit We notice that the upper limit of the 95% confidence interval for the lower average is below the lower limit of the 95% for the higher average. In conclusion, we can say that the two averages are different with a confidence level of 95% - which we did using Student s t test.
15 Student s t test - variants t test for samples with equal variances t test for samples with unequal variances t test for samples with paired measurements These variants differ in how the coefficient t is calculated, and thus the p-value.
16 ANOVA test Compares the averages of several samples simultaneously. H0: m1 = m2 = m3 = m4 (for 4 samples) H1: at least two averages are significantly different The result is a number p that is interpreted as follows: If p> 0.05 we do not reject H0, we say that the difference is not significant with 95% confidence If p <0.05 H0 is rejected with a confidence level of 95% - At least two averrages are significantly different If p <0.001 H0 is rejected with a confidence level of 99.9%. The difference is highly significant
17 Exemplu In three cities from Dolj county data were taken on dietary habits and their relationship to obesity and diabetes. Among other data we collected the weight of individuals as well as data on smoking Individuals, regardless of gender or age group, were divided into four categories: non-smokers, former smokers, light smokers (less than 10 cigarettes per day) and smokers (more than 10 cigarettes per day) An interesting question is whether there was a link between smoking habit and body weight in these individuals. H0: Whether or not smoking, body weight is the same H1: At least two of the four categories had different body weights

18 ANOVA test - results
19 Variance comparison tests Fischer s test is used to verify the equality of variances for two normally distributed independent variables. Null hypothesis is H 0 : σ 12 =σ 2 2 Bartlett's test is used to verify the equality of variances for several normally distributed independent variables Null hypothesis is H 0 : σ 12 =σ 22 =...=σ k 2 THEY ARE PARAMETRIC TESTS
20 Nonparametric tests These are tests that do not make assumptions about data distribution. They can be applied in all circumstances, if the measurements are independent Usually they are used when we are not allowed to apply a parametric test These tests have less accurate results than parametric tests, so we apply them only when it is not possible to apply a parametric test
21 Nonparametric tests Comparing means Random data Paired data 2 samples Mann-Whitney Wilcoxon >2 samples Kruskal-Wallis Friedman Comparing variances Levene
Chapter 2 Probability Topics SPSS T tests
 Chapter 2 Probability Topics SPSS T tests Data file used: gss.sav In the lecture about chapter 2, only the One-Sample T test has been explained. In this handout, we also give the SPSS methods to perform
Statistical tests for SPSS
 Statistical tests for SPSS Paolo Coletti A.Y. 2010/11 Free University of Bolzano Bozen Premise This book is a very quick, rough and fast description of statistical tests and their usage. It is explicitly
SCHOOL OF HEALTH AND HUMAN SCIENCES DON T FORGET TO RECODE YOUR MISSING VALUES
 SCHOOL OF HEALTH AND HUMAN SCIENCES Using SPSS Topics addressed today: 1. Differences between groups 2. Graphing Use the s4data.sav file for the first part of this session. DON T FORGET TO RECODE YOUR
Chapter 5 Analysis of variance SPSS Analysis of variance
 Chapter 5 Analysis of variance SPSS Analysis of variance Data file used: gss.sav How to get there: Analyze Compare Means One-way ANOVA To test the null hypothesis that several population means are equal,
Introduction to Analysis of Variance (ANOVA) Limitations of the t-test
 Limitations of the t-test") Introduction to Analysis of Variance (ANOVA) The Structural Model, The Summary Table, and the One- Way ANOVA Limitations of the t-test Although the t-test is commonly used, it has limitations Can only
Introduction to Analysis of Variance (ANOVA) The Structural Model, The Summary Table, and the One- Way ANOVA Limitations of the t-test Although the t-test is commonly used, it has limitations Can only
Chapter 7 Section 7.1: Inference for the Mean of a Population
 Chapter 7 Section 7.1: Inference for the Mean of a Population Now let s look at a similar situation Take an SRS of size n Normal Population : N(, ). Both and are unknown parameters. Unlike what we used
1. What is the critical value for this 95% confidence interval? CV = z.025 = invnorm(0.025) = 1.96
 = 1.96") 1 Final Review 2 Review 2.1 CI 1-propZint Scenario 1 A TV manufacturer claims in its warranty brochure that in the past not more than 10 percent of its TV sets needed any repair during the first two years
1 Final Review 2 Review 2.1 CI 1-propZint Scenario 1 A TV manufacturer claims in its warranty brochure that in the past not more than 10 percent of its TV sets needed any repair during the first two years
Comparing Means in Two Populations
 Comparing Means in Two Populations Overview The previous section discussed hypothesis testing when sampling from a single population (either a single mean or two means from the same population). Now we
Sample Size and Power in Clinical Trials
 Sample Size and Power in Clinical Trials Version 1.0 May 011 1. Power of a Test. Factors affecting Power 3. Required Sample Size RELATED ISSUES 1. Effect Size. Test Statistics 3. Variation 4. Significance
Independent t- Test (Comparing Two Means)
") Independent t- Test (Comparing Two Means) The objectives of this lesson are to learn: the definition/purpose of independent t-test when to use the independent t-test the use of SPSS to complete an independent
Independent t- Test (Comparing Two Means) The objectives of this lesson are to learn: the definition/purpose of independent t-test when to use the independent t-test the use of SPSS to complete an independent
INTERPRETING THE ONE-WAY ANALYSIS OF VARIANCE (ANOVA)
") INTERPRETING THE ONE-WAY ANALYSIS OF VARIANCE (ANOVA) As with other parametric statistics, we begin the one-way ANOVA with a test of the underlying assumptions. Our first assumption is the assumption of
INTERPRETING THE ONE-WAY ANALYSIS OF VARIANCE (ANOVA) As with other parametric statistics, we begin the one-way ANOVA with a test of the underlying assumptions. Our first assumption is the assumption of
Descriptive Statistics
 Descriptive Statistics Primer Descriptive statistics Central tendency Variation Relative position Relationships Calculating descriptive statistics Descriptive Statistics Purpose to describe or summarize
12: Analysis of Variance. Introduction
 1: Analysis of Variance Introduction EDA Hypothesis Test Introduction In Chapter 8 and again in Chapter 11 we compared means from two independent groups. In this chapter we extend the procedure to consider
LAB 4 INSTRUCTIONS CONFIDENCE INTERVALS AND HYPOTHESIS TESTING
 LAB 4 INSTRUCTIONS CONFIDENCE INTERVALS AND HYPOTHESIS TESTING In this lab you will explore the concept of a confidence interval and hypothesis testing through a simulation problem in engineering setting.
THE KRUSKAL WALLLIS TEST
 THE KRUSKAL WALLLIS TEST TEODORA H. MEHOTCHEVA Wednesday, 23 rd April 08 THE KRUSKAL-WALLIS TEST: The non-parametric alternative to ANOVA: testing for difference between several independent groups 2 NON
Multivariate Analysis of Variance. The general purpose of multivariate analysis of variance (MANOVA) is to determine
 is to determine") 2 - Manova 4.3.05 25 Multivariate Analysis of Variance What Multivariate Analysis of Variance is The general purpose of multivariate analysis of variance (MANOVA) is to determine whether multiple levels
2 - Manova 4.3.05 25 Multivariate Analysis of Variance What Multivariate Analysis of Variance is The general purpose of multivariate analysis of variance (MANOVA) is to determine whether multiple levels
Regression Analysis: A Complete Example
 Regression Analysis: A Complete Example This section works out an example that includes all the topics we have discussed so far in this chapter. A complete example of regression analysis. PhotoDisc, Inc./Getty
Statistics Review PSY379
 Statistics Review PSY379 Basic concepts Measurement scales Populations vs. samples Continuous vs. discrete variable Independent vs. dependent variable Descriptive vs. inferential stats Common analyses
T test as a parametric statistic
 KJA Statistical Round pissn 2005-619 eissn 2005-7563 T test as a parametric statistic Korean Journal of Anesthesiology Department of Anesthesia and Pain Medicine, Pusan National University School of Medicine,
Biostatistics: Types of Data Analysis
 Biostatistics: Types of Data Analysis Theresa A Scott, MS Vanderbilt University Department of Biostatistics theresa.scott@vanderbilt.edu http://biostat.mc.vanderbilt.edu/theresascott Theresa A Scott, MS
Class 19: Two Way Tables, Conditional Distributions, Chi-Square (Text: Sections 2.5; 9.1)
") Spring 204 Class 9: Two Way Tables, Conditional Distributions, Chi-Square (Text: Sections 2.5; 9.) Big Picture: More than Two Samples In Chapter 7: We looked at quantitative variables and compared the
Spring 204 Class 9: Two Way Tables, Conditional Distributions, Chi-Square (Text: Sections 2.5; 9.) Big Picture: More than Two Samples In Chapter 7: We looked at quantitative variables and compared the
Principles of Hypothesis Testing for Public Health
 Principles of Hypothesis Testing for Public Health Laura Lee Johnson, Ph.D. Statistician National Center for Complementary and Alternative Medicine johnslau@mail.nih.gov Fall 2011 Answers to Questions
A POPULATION MEAN, CONFIDENCE INTERVALS AND HYPOTHESIS TESTING
 CHAPTER 5. A POPULATION MEAN, CONFIDENCE INTERVALS AND HYPOTHESIS TESTING 5.1 Concepts When a number of animals or plots are exposed to a certain treatment, we usually estimate the effect of the treatment
2 Sample t-test (unequal sample sizes and unequal variances)
") Variations of the t-test: Sample tail Sample t-test (unequal sample sizes and unequal variances) Like the last example, below we have ceramic sherd thickness measurements (in cm) of two samples representing
Variations of the t-test: Sample tail Sample t-test (unequal sample sizes and unequal variances) Like the last example, below we have ceramic sherd thickness measurements (in cm) of two samples representing
UNDERSTANDING THE DEPENDENT-SAMPLES t TEST
 UNDERSTANDING THE DEPENDENT-SAMPLES t TEST A dependent-samples t test (a.k.a. matched or paired-samples, matched-pairs, samples, or subjects, simple repeated-measures or within-groups, or correlated groups)
How To Test For Significance On A Data Set
 Non-Parametric Univariate Tests: 1 Sample Sign Test 1 1 SAMPLE SIGN TEST A non-parametric equivalent of the 1 SAMPLE T-TEST. ASSUMPTIONS: Data is non-normally distributed, even after log transforming.
Multiple-Comparison Procedures
 Multiple-Comparison Procedures References A good review of many methods for both parametric and nonparametric multiple comparisons, planned and unplanned, and with some discussion of the philosophical
1 Nonparametric Statistics
 1 Nonparametric Statistics When finding confidence intervals or conducting tests so far, we always described the population with a model, which includes a set of parameters. Then we could make decisions
One-Way Analysis of Variance
 One-Way Analysis of Variance Note: Much of the math here is tedious but straightforward. We ll skim over it in class but you should be sure to ask questions if you don t understand it. I. Overview A. We
Rank-Based Non-Parametric Tests
 Rank-Based Non-Parametric Tests Reminder: Student Instructional Rating Surveys You have until May 8 th to fill out the student instructional rating surveys at https://sakai.rutgers.edu/portal/site/sirs
Unit 31 A Hypothesis Test about Correlation and Slope in a Simple Linear Regression
 Unit 31 A Hypothesis Test about Correlation and Slope in a Simple Linear Regression Objectives: To perform a hypothesis test concerning the slope of a least squares line To recognize that testing for a
Two-Sample T-Tests Assuming Equal Variance (Enter Means)
") Chapter 4 Two-Sample T-Tests Assuming Equal Variance (Enter Means) Introduction This procedure provides sample size and power calculations for one- or two-sided two-sample t-tests when the variances of
Chapter 4 Two-Sample T-Tests Assuming Equal Variance (Enter Means) Introduction This procedure provides sample size and power calculations for one- or two-sided two-sample t-tests when the variances of
UNIVERSITY OF NAIROBI
 UNIVERSITY OF NAIROBI MASTERS IN PROJECT PLANNING AND MANAGEMENT NAME: SARU CAROLYNN ELIZABETH REGISTRATION NO: L50/61646/2013 COURSE CODE: LDP 603 COURSE TITLE: RESEARCH METHODS LECTURER: GAKUU CHRISTOPHER
Two-Sample T-Tests Allowing Unequal Variance (Enter Difference)
") Chapter 45 Two-Sample T-Tests Allowing Unequal Variance (Enter Difference) Introduction This procedure provides sample size and power calculations for one- or two-sided two-sample t-tests when no assumption
Chapter 45 Two-Sample T-Tests Allowing Unequal Variance (Enter Difference) Introduction This procedure provides sample size and power calculations for one- or two-sided two-sample t-tests when no assumption
Lesson 1: Comparison of Population Means Part c: Comparison of Two- Means
 Lesson : Comparison of Population Means Part c: Comparison of Two- Means Welcome to lesson c. This third lesson of lesson will discuss hypothesis testing for two independent means. Steps in Hypothesis
Study Guide for the Final Exam
 Study Guide for the Final Exam When studying, remember that the computational portion of the exam will only involve new material (covered after the second midterm), that material from Exam 1 will make
Erik Parner 14 September 2016. Basic Biostatistics - Day 2-21 September, 2016 1
 PhD course in Basic Biostatistics Day Erik Parner, Department of Biostatistics, Aarhus University Log-transformation of continuous data Exercise.+.4+Standard- (Triglyceride) Logarithms and exponentials
CHAPTER 13 SIMPLE LINEAR REGRESSION. Opening Example. Simple Regression. Linear Regression
 Opening Example CHAPTER 13 SIMPLE LINEAR REGREION SIMPLE LINEAR REGREION! Simple Regression! Linear Regression Simple Regression Definition A regression model is a mathematical equation that descries the
QUANTITATIVE METHODS BIOLOGY FINAL HONOUR SCHOOL NON-PARAMETRIC TESTS
 QUANTITATIVE METHODS BIOLOGY FINAL HONOUR SCHOOL NON-PARAMETRIC TESTS This booklet contains lecture notes for the nonparametric work in the QM course. This booklet may be online at http://users.ox.ac.uk/~grafen/qmnotes/index.html.
Introduction. Hypothesis Testing. Hypothesis Testing. Significance Testing
 Introduction Hypothesis Testing Mark Lunt Arthritis Research UK Centre for Ecellence in Epidemiology University of Manchester 13/10/2015 We saw last week that we can never know the population parameters
One-Way Analysis of Variance (ANOVA) Example Problem
 Example Problem") One-Way Analysis of Variance (ANOVA) Example Problem Introduction Analysis of Variance (ANOVA) is a hypothesis-testing technique used to test the equality of two or more population (or treatment) means
One-Way Analysis of Variance (ANOVA) Example Problem Introduction Analysis of Variance (ANOVA) is a hypothesis-testing technique used to test the equality of two or more population (or treatment) means
Statistics. One-two sided test, Parametric and non-parametric test statistics: one group, two groups, and more than two groups samples
 Statistics One-two sided test, Parametric and non-parametric test statistics: one group, two groups, and more than two groups samples February 3, 00 Jobayer Hossain, Ph.D. & Tim Bunnell, Ph.D. Nemours
NCSS Statistical Software
 Chapter 06 Introduction This procedure provides several reports for the comparison of two distributions, including confidence intervals for the difference in means, two-sample t-tests, the z-test, the
UNDERSTANDING THE TWO-WAY ANOVA
 UNDERSTANDING THE e have seen how the one-way ANOVA can be used to compare two or more sample means in studies involving a single independent variable. This can be extended to two independent variables
Testing Group Differences using T-tests, ANOVA, and Nonparametric Measures
 Testing Group Differences using T-tests, ANOVA, and Nonparametric Measures Jamie DeCoster Department of Psychology University of Alabama 348 Gordon Palmer Hall Box 870348 Tuscaloosa, AL 35487-0348 Phone:
Simple Linear Regression Inference
 Simple Linear Regression Inference 1 Inference requirements The Normality assumption of the stochastic term e is needed for inference even if it is not a OLS requirement. Therefore we have: Interpretation
Chapter 8 Hypothesis Testing Chapter 8 Hypothesis Testing 8-1 Overview 8-2 Basics of Hypothesis Testing
 Chapter 8 Hypothesis Testing 1 Chapter 8 Hypothesis Testing 8-1 Overview 8-2 Basics of Hypothesis Testing 8-3 Testing a Claim About a Proportion 8-5 Testing a Claim About a Mean: s Not Known 8-6 Testing
SPSS 3: COMPARING MEANS
 SPSS 3: COMPARING MEANS UNIVERSITY OF GUELPH LUCIA COSTANZO lcostanz@uoguelph.ca REVISED SEPTEMBER 2012 CONTENTS SPSS availability... 2 Goals of the workshop... 2 Data for SPSS Sessions... 3 Statistical
Analysis of Variance ANOVA
 Analysis of Variance ANOVA Overview We ve used the t -test to compare the means from two independent groups. Now we ve come to the final topic of the course: how to compare means from more than two populations.
Hypothesis testing - Steps
 Hypothesis testing - Steps Steps to do a two-tailed test of the hypothesis that β 1 0: 1. Set up the hypotheses: H 0 : β 1 = 0 H a : β 1 0. 2. Compute the test statistic: t = b 1 0 Std. error of b 1 =
COMPARING DATA ANALYSIS TECHNIQUES FOR EVALUATION DESIGNS WITH NON -NORMAL POFULP_TIOKS Elaine S. Jeffers, University of Maryland, Eastern Shore*
 COMPARING DATA ANALYSIS TECHNIQUES FOR EVALUATION DESIGNS WITH NON -NORMAL POFULP_TIOKS Elaine S. Jeffers, University of Maryland, Eastern Shore* The data collection phases for evaluation designs may involve
Chapter 9. Two-Sample Tests. Effect Sizes and Power Paired t Test Calculation
 Chapter 9 Two-Sample Tests Paired t Test (Correlated Groups t Test) Effect Sizes and Power Paired t Test Calculation Summary Independent t Test Chapter 9 Homework Power and Two-Sample Tests: Paired Versus
Tutorial 5: Hypothesis Testing
 Tutorial 5: Hypothesis Testing Rob Nicholls nicholls@mrc-lmb.cam.ac.uk MRC LMB Statistics Course 2014 Contents 1 Introduction................................ 1 2 Testing distributional assumptions....................
COMPARISONS OF CUSTOMER LOYALTY: PUBLIC & PRIVATE INSURANCE COMPANIES.
 277 CHAPTER VI COMPARISONS OF CUSTOMER LOYALTY: PUBLIC & PRIVATE INSURANCE COMPANIES. This chapter contains a full discussion of customer loyalty comparisons between private and public insurance companies
CHAPTER 13. Experimental Design and Analysis of Variance
 CHAPTER 13 Experimental Design and Analysis of Variance CONTENTS STATISTICS IN PRACTICE: BURKE MARKETING SERVICES, INC. 13.1 AN INTRODUCTION TO EXPERIMENTAL DESIGN AND ANALYSIS OF VARIANCE Data Collection
THE FIRST SET OF EXAMPLES USE SUMMARY DATA... EXAMPLE 7.2, PAGE 227 DESCRIBES A PROBLEM AND A HYPOTHESIS TEST IS PERFORMED IN EXAMPLE 7.
 THERE ARE TWO WAYS TO DO HYPOTHESIS TESTING WITH STATCRUNCH: WITH SUMMARY DATA (AS IN EXAMPLE 7.17, PAGE 236, IN ROSNER); WITH THE ORIGINAL DATA (AS IN EXAMPLE 8.5, PAGE 301 IN ROSNER THAT USES DATA FROM
Chapter G08 Nonparametric Statistics
 G08 Nonparametric Statistics Chapter G08 Nonparametric Statistics Contents 1 Scope of the Chapter 2 2 Background to the Problems 2 2.1 Parametric and Nonparametric Hypothesis Testing......................
II. DISTRIBUTIONS distribution normal distribution. standard scores
 Appendix D Basic Measurement And Statistics The following information was developed by Steven Rothke, PhD, Department of Psychology, Rehabilitation Institute of Chicago (RIC) and expanded by Mary F. Schmidt,
EPS 625 INTERMEDIATE STATISTICS FRIEDMAN TEST
 EPS 625 INTERMEDIATE STATISTICS The Friedman test is an extension of the Wilcoxon test. The Wilcoxon test can be applied to repeated-measures data if participants are assessed on two occasions or conditions
Projects Involving Statistics (& SPSS)
") Projects Involving Statistics (& SPSS) Academic Skills Advice Starting a project which involves using statistics can feel confusing as there seems to be many different things you can do (charts, graphs,
Projects Involving Statistics (& SPSS) Academic Skills Advice Starting a project which involves using statistics can feel confusing as there seems to be many different things you can do (charts, graphs,
NCSS Statistical Software
 Chapter 06 Introduction This procedure provides several reports for the comparison of two distributions, including confidence intervals for the difference in means, two-sample t-tests, the z-test, the
Recall this chart that showed how most of our course would be organized:
 Chapter 4 One-Way ANOVA Recall this chart that showed how most of our course would be organized: Explanatory Variable(s) Response Variable Methods Categorical Categorical Contingency Tables Categorical
CHAPTER 14 NONPARAMETRIC TESTS
 CHAPTER 14 NONPARAMETRIC TESTS Everything that we have done up until now in statistics has relied heavily on one major fact: that our data is normally distributed. We have been able to make inferences
Nonparametric Statistics
 Nonparametric Statistics J. Lozano University of Goettingen Department of Genetic Epidemiology Interdisciplinary PhD Program in Applied Statistics & Empirical Methods Graduate Seminar in Applied Statistics
Post-hoc comparisons & two-way analysis of variance. Two-way ANOVA, II. Post-hoc testing for main effects. Post-hoc testing 9.
 Two-way ANOVA, II Post-hoc comparisons & two-way analysis of variance 9.7 4/9/4 Post-hoc testing As before, you can perform post-hoc tests whenever there s a significant F But don t bother if it s a main
Week 4: Standard Error and Confidence Intervals
 Health Sciences M.Sc. Programme Applied Biostatistics Week 4: Standard Error and Confidence Intervals Sampling Most research data come from subjects we think of as samples drawn from a larger population.
An Introduction to Statistics Course (ECOE 1302) Spring Semester 2011 Chapter 10- TWO-SAMPLE TESTS
 Spring Semester 2011 Chapter 10- TWO-SAMPLE TESTS") The Islamic University of Gaza Faculty of Commerce Department of Economics and Political Sciences An Introduction to Statistics Course (ECOE 130) Spring Semester 011 Chapter 10- TWO-SAMPLE TESTS Practice
The Islamic University of Gaza Faculty of Commerce Department of Economics and Political Sciences An Introduction to Statistics Course (ECOE 130) Spring Semester 011 Chapter 10- TWO-SAMPLE TESTS Practice
Non-Parametric Tests (I)
") Lecture 5: Non-Parametric Tests (I) KimHuat LIM lim@stats.ox.ac.uk http://www.stats.ox.ac.uk/~lim/teaching.html Slide 1 5.1 Outline (i) Overview of Distribution-Free Tests (ii) Median Test for Two Independent
Lecture 5: Non-Parametric Tests (I) KimHuat LIM lim@stats.ox.ac.uk http://www.stats.ox.ac.uk/~lim/teaching.html Slide 1 5.1 Outline (i) Overview of Distribution-Free Tests (ii) Median Test for Two Independent
Lecture Notes Module 1
 Lecture Notes Module 1 Study Populations A study population is a clearly defined collection of people, animals, plants, or objects. In psychological research, a study population usually consists of a specific
Parametric and non-parametric statistical methods for the life sciences - Session I
 Why nonparametric methods What test to use? Rank Tests Parametric and non-parametric statistical methods for the life sciences - Session I Liesbeth Bruckers Geert Molenberghs Interuniversity Institute
August 2012 EXAMINATIONS Solution Part I
 August 01 EXAMINATIONS Solution Part I (1) In a random sample of 600 eligible voters, the probability that less than 38% will be in favour of this policy is closest to (B) () In a large random sample,
Introduction to Statistics and Quantitative Research Methods
 Introduction to Statistics and Quantitative Research Methods Purpose of Presentation To aid in the understanding of basic statistics, including terminology, common terms, and common statistical methods.
Statistics for Sports Medicine
 Statistics for Sports Medicine Suzanne Hecht, MD University of Minnesota (suzanne.hecht@gmail.com) Fellow s Research Conference July 2012: Philadelphia GOALS Try not to bore you to death!! Try to teach
HYPOTHESIS TESTING (ONE SAMPLE) - CHAPTER 7 1. used confidence intervals to answer questions such as...
 - CHAPTER 7 1. used confidence intervals to answer questions such as...") HYPOTHESIS TESTING (ONE SAMPLE) - CHAPTER 7 1 PREVIOUSLY used confidence intervals to answer questions such as... You know that 0.25% of women have red/green color blindness. You conduct a study of men
HYPOTHESIS TESTING (ONE SAMPLE) - CHAPTER 7 1 PREVIOUSLY used confidence intervals to answer questions such as... You know that 0.25% of women have red/green color blindness. You conduct a study of men
NAG C Library Chapter Introduction. g08 Nonparametric Statistics
 g08 Nonparametric Statistics Introduction g08 NAG C Library Chapter Introduction g08 Nonparametric Statistics Contents 1 Scope of the Chapter... 2 2 Background to the Problems... 2 2.1 Parametric and Nonparametric
" Y. Notation and Equations for Regression Lecture 11/4. Notation:
 Notation: Notation and Equations for Regression Lecture 11/4 m: The number of predictor variables in a regression Xi: One of multiple predictor variables. The subscript i represents any number from 1 through
Skewed Data and Non-parametric Methods
 0 2 4 6 8 10 12 14 Skewed Data and Non-parametric Methods Comparing two groups: t-test assumes data are: 1. Normally distributed, and 2. both samples have the same SD (i.e. one sample is simply shifted
Having a coin come up heads or tails is a variable on a nominal scale. Heads is a different category from tails.
 Chi-square Goodness of Fit Test The chi-square test is designed to test differences whether one frequency is different from another frequency. The chi-square test is designed for use with data on a nominal
Come scegliere un test statistico
 Come scegliere un test statistico Estratto dal Capitolo 37 of Intuitive Biostatistics (ISBN 0-19-508607-4) by Harvey Motulsky. Copyright 1995 by Oxfd University Press Inc. (disponibile in Iinternet) Table
Section 13, Part 1 ANOVA. Analysis Of Variance
 Section 13, Part 1 ANOVA Analysis Of Variance Course Overview So far in this course we ve covered: Descriptive statistics Summary statistics Tables and Graphs Probability Probability Rules Probability
In the general population of 0 to 4-year-olds, the annual incidence of asthma is 1.4%
 Hypothesis Testing for a Proportion Example: We are interested in the probability of developing asthma over a given one-year period for children 0 to 4 years of age whose mothers smoke in the home In the
Interaction between quantitative predictors
 Interaction between quantitative predictors In a first-order model like the ones we have discussed, the association between E(y) and a predictor x j does not depend on the value of the other predictors
Stat 411/511 THE RANDOMIZATION TEST. Charlotte Wickham. stat511.cwick.co.nz. Oct 16 2015
 Stat 411/511 THE RANDOMIZATION TEST Oct 16 2015 Charlotte Wickham stat511.cwick.co.nz Today Review randomization model Conduct randomization test What about CIs? Using a t-distribution as an approximation
DATA ANALYSIS. QEM Network HBCU-UP Fundamentals of Education Research Workshop Gerunda B. Hughes, Ph.D. Howard University
 DATA ANALYSIS QEM Network HBCU-UP Fundamentals of Education Research Workshop Gerunda B. Hughes, Ph.D. Howard University Quantitative Research What is Statistics? Statistics (as a subject) is the science
Regression step-by-step using Microsoft Excel
 Step 1: Regression step-by-step using Microsoft Excel Notes prepared by Pamela Peterson Drake, James Madison University Type the data into the spreadsheet The example used throughout this How to is a regression
Types of Data, Descriptive Statistics, and Statistical Tests for Nominal Data. Patrick F. Smith, Pharm.D. University at Buffalo Buffalo, New York
 Types of Data, Descriptive Statistics, and Statistical Tests for Nominal Data Patrick F. Smith, Pharm.D. University at Buffalo Buffalo, New York . NONPARAMETRIC STATISTICS I. DEFINITIONS A. Parametric
Chapter 7. Comparing Means in SPSS (t-tests) Compare Means analyses. Specifically, we demonstrate procedures for running Dependent-Sample (or
 Compare Means analyses. Specifically, we demonstrate procedures for running Dependent-Sample (or") 1 Chapter 7 Comparing Means in SPSS (t-tests) This section covers procedures for testing the differences between two means using the SPSS Compare Means analyses. Specifically, we demonstrate procedures
1 Chapter 7 Comparing Means in SPSS (t-tests) This section covers procedures for testing the differences between two means using the SPSS Compare Means analyses. Specifically, we demonstrate procedures
Difference tests (2): nonparametric
: nonparametric") NST 1B Experimental Psychology Statistics practical 3 Difference tests (): nonparametric Rudolf Cardinal & Mike Aitken 10 / 11 February 005; Department of Experimental Psychology University of Cambridge
NST 1B Experimental Psychology Statistics practical 3 Difference tests (): nonparametric Rudolf Cardinal & Mike Aitken 10 / 11 February 005; Department of Experimental Psychology University of Cambridge
Nonparametric Two-Sample Tests. Nonparametric Tests. Sign Test
 Nonparametric Two-Sample Tests Sign test Mann-Whitney U-test (a.k.a. Wilcoxon two-sample test) Kolmogorov-Smirnov Test Wilcoxon Signed-Rank Test Tukey-Duckworth Test 1 Nonparametric Tests Recall, nonparametric
Two-sample inference: Continuous data
 Two-sample inference: Continuous data Patrick Breheny April 5 Patrick Breheny STA 580: Biostatistics I 1/32 Introduction Our next two lectures will deal with two-sample inference for continuous data As
DATA INTERPRETATION AND STATISTICS
 PholC60 September 001 DATA INTERPRETATION AND STATISTICS Books A easy and systematic introductory text is Essentials of Medical Statistics by Betty Kirkwood, published by Blackwell at about 14. DESCRIPTIVE
Bivariate Statistics Session 2: Measuring Associations Chi-Square Test
 Bivariate Statistics Session 2: Measuring Associations Chi-Square Test Features Of The Chi-Square Statistic The chi-square test is non-parametric. That is, it makes no assumptions about the distribution
t Tests in Excel The Excel Statistical Master By Mark Harmon Copyright 2011 Mark Harmon
 t-tests in Excel By Mark Harmon Copyright 2011 Mark Harmon No part of this publication may be reproduced or distributed without the express permission of the author. mark@excelmasterseries.com www.excelmasterseries.com
Hypothesis testing. c 2014, Jeffrey S. Simonoff 1
 Hypothesis testing So far, we ve talked about inference from the point of estimation. We ve tried to answer questions like What is a good estimate for a typical value? or How much variability is there
Estimation of σ 2, the variance of ɛ
 Estimation of σ 2, the variance of ɛ The variance of the errors σ 2 indicates how much observations deviate from the fitted surface. If σ 2 is small, parameters β 0, β 1,..., β k will be reliably estimated
MODIFIED PARAMETRIC BOOTSTRAP: A ROBUST ALTERNATIVE TO CLASSICAL TEST
 MODIFIED PARAMETRIC BOOTSTRAP: A ROBUST ALTERNATIVE TO CLASSICAL TEST Zahayu Md Yusof, Nurul Hanis Harun, Sharipah Sooad Syed Yahaya & Suhaida Abdullah School of Quantitative Sciences College of Arts and
How To Check For Differences In The One Way Anova
 MINITAB ASSISTANT WHITE PAPER This paper explains the research conducted by Minitab statisticians to develop the methods and data checks used in the Assistant in Minitab 17 Statistical Software. One-Way
Chapter 13 Introduction to Linear Regression and Correlation Analysis
 Chapter 3 Student Lecture Notes 3- Chapter 3 Introduction to Linear Regression and Correlation Analsis Fall 2006 Fundamentals of Business Statistics Chapter Goals To understand the methods for displaing
One-Way Analysis of Variance: A Guide to Testing Differences Between Multiple Groups
 One-Way Analysis of Variance: A Guide to Testing Differences Between Multiple Groups In analysis of variance, the main research question is whether the sample means are from different populations. The
T-test & factor analysis
 Parametric tests T-test & factor analysis Better than non parametric tests Stringent assumptions More strings attached Assumes population distribution of sample is normal Major problem Alternatives Continue