Pair-copula constructions: even more flexible than copulas
|
|
|
- Ralph Douglas
- 7 years ago
- Views:
Transcription


1 Pair-copula constructions: even more flexible than copulas Workshop on Copulas and Extremes Grenoble, France, November 19th, 2013 Kjersti Aas Norwegian Computing Center Joint work with: Claudia Czado, Ingrid Hobæk Haff, Arnoldo Frigessi, Daniel Berg, Eike C. Brechmann
2 Pair-copula construction While there is a multitude of bivariate copula, the class of multivariate copulae is still quite restricted. Hence, if the dependency structures of different pairs of variables in a multivariate problem are very different, not even the copula approach will allow for the construction of an appropriate model. In this talk I will describe an extension to the stateof-the-art theory of copulas, modelling multivariate data using a so-called pair-copula construction.
3 Copula The Sklar s theorem states that every multivariate distribution F with marginals F 1 (x 1 ),,F n (x n ) can be written as for some appropriate n-dimensional copula C. Using the chain rule, for an absolutely continuous joint distribution F with strictly increasing, continuous marginal distribution functions F 1, F n it holds that for some n-variate copula density.
4 Pair-copula constructions (I) For two random variables X 1 and X 2 we have Further, for three random variables X 1, X 2 and X 3 we have It follows that for every j we have
5 Pair-copula construction (II) We denote a such decomposition a pair-copula construction (PCC) Joe (1996) was the first to give a probabilistic construction of multivariate distribution functions based on pair-copulas, while Aas et. al. (2009) were the first to set the PCC in an inferential context.
6 PCC in three dimensions A pair-copula construction of a three-dimensional density is given by: Special case: Trivariate normal distribution If the marginal distributions are standard normal, and c 12, c 23 and c 13 2 are bivariate Gaussian copula densities, the resulting distribution is trivariate standard normal.
7 PCC in five dimensions A possible pair-copula construction for a five-dimensional density is: There are as many as 480 different such constructions in the five-dimensional case, 23,040 in the 6-dimensional case and 2,580,480 in the 7-dimensional case.....

8 Vines Hence, for high-dimensional distributions, there are a significant number of possible pair-copula constructions. To help organising them, Bedford and Cooke (2001) introduced graphical models denoted regular vines (Rvines).

9 Example in five dimensions

10 Matrix representation

11 Special case: C-vine Each tree has a unique node that is connected to n-j edges. f = f 1 f 2 f 3 f 4 f 5 c 12 c 13 c 14 c 15 c 23;1 c 24;1 c 25;1 c 34;12 c 35;12 c 45;123 Useful for ordering of importance

12 Special case: D-vine No node in any tree is connected to more than two edges. f 1234 = f 1 f 2 f 3 f 4 f 5 c 12 c 23 c 34 c 45 c 13;2 c 24;3 c 35;4 c 14;23 c 25;34 c 15;234 Useful for temporal ordering.
13 General density expressions
14 Conditional distribution functions The conditional distributions needed as copula arguments at level j are obtained as partial derivatives of the copulae at level j-1 This is due to the following result of Joe (1996) stating that under regularity conditions we have: The terms tree and level are used as synonyms in this talk
15 The h-function It turns out that we only need the special case of F(x v) when v is univariate and x and v are uniformly distributed on [0,1], i.e. where is the set of copula parameters. From now on F(x v) is denoted the h-function:
16 Building blocs The resulting multivariate distribution will be valid even if the bivariate copulae involved in the pair-copula construction are of different type. One may for instance combine the following types of paircopulae Gaussian (no tail dependence) Clayton (lower tail dependence) Gumbel (upper tail dependence) Student (upper and lower tail dependence)
17 Parameter estimation

18 Three elements Full inference for a pair-copula decomposition should consider the following three tasks: 1. The selection of a specific factorisation. 2. The choice of pair-copula types. 3. The estimation of the parameters of the chosen pair-copulae.
19 Which factorisation? The current idea is to capture the strongest pairwise dependencies in the first levels. Hence, for each tree we first calculate an empirical dependence measure (e.g. Kendall s tau) for all variable pairs, and then we select the tree on all nodes that maximizes the sum of absolute empirical dependencies using the spanning tree algorithm of Prim.
20 How does this look like for Tree 1?
21 Choice of copula-types The following procedure may be used to select copula types: This procedure is also denoted sequential or stepwise semiparametric estimation.

22 Example c SM c MT c TB Level I Level II c ST M c MB T c SB MT Level III
23 Likelihood evaluation
24 The SSP-estimator Full semi-parametric maximum likelihood estimation (SP) has shown to be consistent and asymptotically normal (Genest, 1995, Tsukahara, 2005). However, it is computationally too heavy in high dim. Hence, people tend to use the stepwise semiparametric (SSP-) approach (Aas et. al., 2009) instead. In the SSP approach, the parameters of the vine are sequentially estimated starting from the top tree. The performance of SSP and SP is quite similar, but SSP is computationally much faster than SP.
25 Properties of the SSP-estimator Hobæk Haff (2011a) have shown that The SSP-estimator is less efficient than the SPestimator in general. This loss of efficiency may however be rather low. The SSP-estimator is semiparametrically efficient for the Gaussian copula. Hobæk Haff (2011b) have shown that The finite sample bias and MSE of SSP are higher than those of SP (the difference increases with increasing dependency). With a small sample size or misspecification of the model, the difference between SP and SSP however becomes smaller.
26 Simplifying assumption Generally, the parameters of the conditional density depends on the value of x 2. Inference requires however the simplifying assumption that all pair copulae depend on the conditioning variables through the two conditional distribution functions that constitute their arguments only, and not directly. As shown in Hobæk Haff et. al. (2010), this seems not to be a severe restriction.
27 Application: Market risk model for the largest Norwegian bank, DNB

28 Data set 19 financial variables that constitute the market portfolio of DNB. Daily log returns from March 2003 to March 2008 (1107 obs.) are used.
29 Modelling procedure Fit appropriate ARMA-GARCH models for logreturn time series. Fit an R-vine as well as a multivariate Student-t copula (for comparison) to standardized residuals Pair-copulas are selected from a range of 11 bivariate families using AIC: Independence copula, Gaussian, t, Clayton, rotated Clayton (90 ), Gumbel, rotated Gumbel (90 ), Frank, Joe, Clayton-Gumbel (BB1), Joe-Clayton (BB7).

30 First tree of R-vine EUR3M YEN EUR GBP USD3M USD NIBOR3M Int. bonds Real estate Pengem. FINX Gov. bonds. USD5Y EUR5Y No. stocks NIBOR5Y Int. stocks HTM Hedgefond
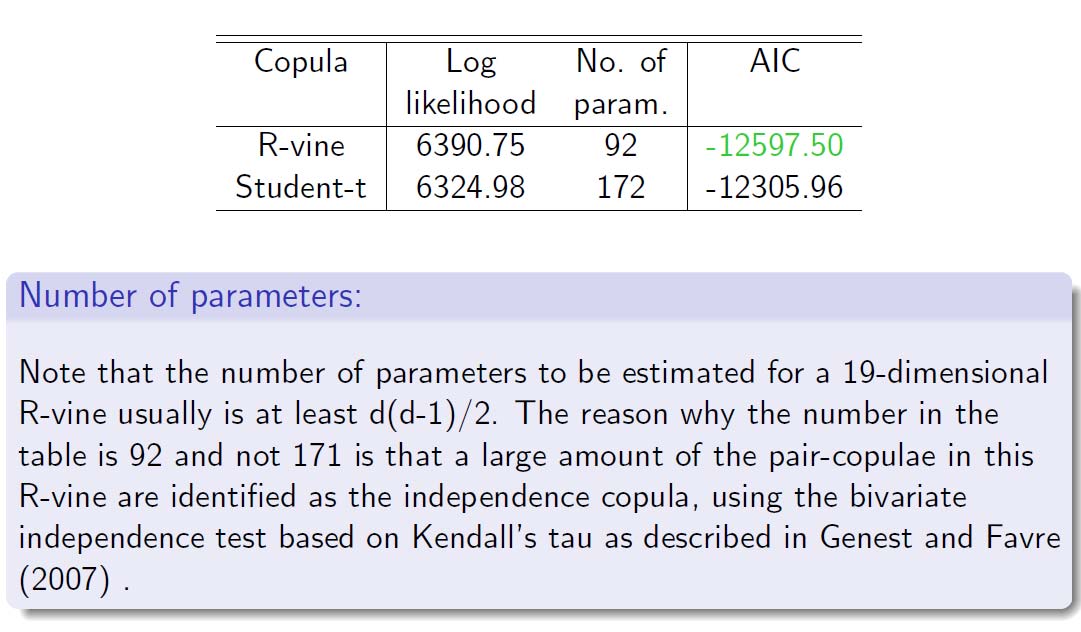
31 Results
32 Truncation (I) The number of parameters in an R-vine grows quadratically with the dimension. Hence, it would be useful to be able to reduce the model complexity. In Brechmann et. al (2012) we have studied the problem of determining whether an R-vine may be truncated. By a truncated R-vine at level K, we mean an R-vine with all pair-copulae with conditioning set larger than or equal to K set to independence copulae.
33 Truncation (II) We fit one tree at a time and use the likelihood ratio test of Vuong (1989) to determine whether an additional tree provides a significant gain in the model fit.

34 Truncation (III)
35 Recent advances connected to PCC


36 Applications Finance Insurance Genetics Marketing Health Hydrology Infrastructure modeling Image analysis
37 PCC types Non-simplified PCC (Acar et. al., 2012). PCC with time-varying parameters (Almeida et. al., 2012, So & Yeung, 2013). Regime-switching PCC (Chollete et. al., 2008, Stӧber & Czado, 2013). Non-parametric PCC (Haff & Segers, 2013, Kauermann & Schellhase, 2013). Spatial PCC (Grӓler & Pebesma, 2011). PCC with discrete margins (Panagiotelis et. al., 2012). PCC for longitudinal data (Smith et. al., 2010). PCC with Lévy copulas (Grothe & Nicklas, 2013).
38 Summary
39 Summary Pair-copula decomposed models represent a very flexible and intuitive way of constructing higherdimensional copulae. Simulation and inference are straight-forward (but time-consuming in higher dimensions). Sequential and MLE parameter estimation of C-, D- and R-vines are available in R packages CDVine and VineCopula.
Pair-copula constructions of multiple dependence
 Pair-copula constructions of multiple dependence Kjersti Aas The Norwegian Computing Center, Oslo, Norway Claudia Czado Technische Universität, München, Germany Arnoldo Frigessi University of Oslo and
Multivariate Option Pricing Using Copulae
 Multivariate Option Pricing Using Copulae Carole Bernard and Claudia Czado February 10, 2012 Abstract: The complexity of financial products significantly increased in the past ten years. In this paper
Working Paper: Extreme Value Theory and mixed Canonical vine Copulas on modelling energy price risks
 Working Paper: Extreme Value Theory and mixed Canonical vine Copulas on modelling energy price risks Authors: Karimalis N. Emmanouil Nomikos Nikos London 25 th of September, 2012 Abstract In this paper
The relationship between WIG-subindexes: evidence from the Warsaw Stock Exchange
 Managerial Economics 2014, vol. 15, no. 2, pp. 149 164 http://dx.doi.org/10.7494/manage.2014.15.2.149 Henryk Gurgul*, Robert Syrek** The relationship between WIG-subindexes: evidence from the Warsaw Stock
Copula-Based Models of Systemic Risk in U.S. Agriculture: Implications for Crop Insurance and Reinsurance Contracts
 Copula-Based Models of Systemic Risk in U.S. Agriculture: Implications for Crop Insurance and Reinsurance Contracts Barry K. Goodwin October 22, 2012 Abstract The federal crop insurance program has been
Package CoImp. February 19, 2015
 Title Copula based imputation method Date 2014-03-01 Version 0.2-3 Package CoImp February 19, 2015 Author Francesca Marta Lilja Di Lascio, Simone Giannerini Depends R (>= 2.15.2), methods, copula Imports
Penalized Splines - A statistical Idea with numerous Applications...
 Penalized Splines - A statistical Idea with numerous Applications... Göran Kauermann Ludwig-Maximilians-University Munich Graz 7. September 2011 1 Penalized Splines - A statistical Idea with numerous Applications...
TotalRisk Statistics for modelling the risk of financial institutions
 TotalRisk Statistics for modelling the risk of financial institutions Innovation area: Finance Key Innovator: Kjersti Aas Partners: DNB, NR, UiO, NTNU Research staff scientists: Kjersti Aas (NR, principle
Pricing of a worst of option using a Copula method M AXIME MALGRAT
 Pricing of a worst of option using a Copula method M AXIME MALGRAT Master of Science Thesis Stockholm, Sweden 2013 Pricing of a worst of option using a Copula method MAXIME MALGRAT Degree Project in Mathematical
Copula Graphical Models for Wind Resource Estimation
 Proceedings of the Twenty-Fourth International Joint onference on Artificial Intelligence (IJAI 2015) opula Graphical Models for Wind Resource Estimation Kalyan Veeramachaneni SAIL, MIT ambridge, MA kalyan@csail.mit.edu
Operational Risk Management: Added Value of Advanced Methodologies
 Operational Risk Management: Added Value of Advanced Methodologies Paris, September 2013 Bertrand HASSANI Head of Major Risks Management & Scenario Analysis Disclaimer: The opinions, ideas and approaches
Non Linear Dependence Structures: a Copula Opinion Approach in Portfolio Optimization
 Non Linear Dependence Structures: a Copula Opinion Approach in Portfolio Optimization Jean- Damien Villiers ESSEC Business School Master of Sciences in Management Grande Ecole September 2013 1 Non Linear
Tail-Dependence an Essential Factor for Correctly Measuring the Benefits of Diversification
 Tail-Dependence an Essential Factor for Correctly Measuring the Benefits of Diversification Presented by Work done with Roland Bürgi and Roger Iles New Views on Extreme Events: Coupled Networks, Dragon
Statistics Graduate Courses
 Statistics Graduate Courses STAT 7002--Topics in Statistics-Biological/Physical/Mathematics (cr.arr.).organized study of selected topics. Subjects and earnable credit may vary from semester to semester.
How To Analyze The Time Varying And Asymmetric Dependence Of International Crude Oil Spot And Futures Price, Price, And Price Of Futures And Spot Price
 Send Orders for Reprints to reprints@benthamscience.ae The Open Petroleum Engineering Journal, 2015, 8, 463-467 463 Open Access Asymmetric Dependence Analysis of International Crude Oil Spot and Futures
Introduction to General and Generalized Linear Models
 Introduction to General and Generalized Linear Models General Linear Models - part I Henrik Madsen Poul Thyregod Informatics and Mathematical Modelling Technical University of Denmark DK-2800 Kgs. Lyngby
Spatial Statistics Chapter 3 Basics of areal data and areal data modeling
 Spatial Statistics Chapter 3 Basics of areal data and areal data modeling Recall areal data also known as lattice data are data Y (s), s D where D is a discrete index set. This usually corresponds to data
Multivariate Option Pricing Using Copulae
 Multivariate Option Pricing Using Copulae Carole Bernard and Claudia Czado November 23, 2010 Abstract: The complexity of financial products significantly increased in the past ten years. In this paper
Dynamic Linkages in the Pairs (GBP/EUR, USD/EUR) and (GBP/USD, EUR/USD): How Do They Change During a Day?
 and (GBP/USD, EUR/USD): How Do They Change During a Day?") Central European Journal of Economic Modelling and Econometrics Dynamic Linkages in the Pairs (GBP/EUR, USD/EUR) and (GBP/USD, EUR/USD): How Do They Change During a Day? Małgorzata Doman, Ryszard Doman
Central European Journal of Economic Modelling and Econometrics Dynamic Linkages in the Pairs (GBP/EUR, USD/EUR) and (GBP/USD, EUR/USD): How Do They Change During a Day? Małgorzata Doman, Ryszard Doman
CONDITIONAL, PARTIAL AND RANK CORRELATION FOR THE ELLIPTICAL COPULA; DEPENDENCE MODELLING IN UNCERTAINTY ANALYSIS
 CONDITIONAL, PARTIAL AND RANK CORRELATION FOR THE ELLIPTICAL COPULA; DEPENDENCE MODELLING IN UNCERTAINTY ANALYSIS D. Kurowicka, R.M. Cooke Delft University of Technology, Mekelweg 4, 68CD Delft, Netherlands
Basics of Statistical Machine Learning
 CS761 Spring 2013 Advanced Machine Learning Basics of Statistical Machine Learning Lecturer: Xiaojin Zhu jerryzhu@cs.wisc.edu Modern machine learning is rooted in statistics. You will find many familiar
itesla Project Innovative Tools for Electrical System Security within Large Areas
 itesla Project Innovative Tools for Electrical System Security within Large Areas Samir ISSAD RTE France samir.issad@rte-france.com PSCC 2014 Panel Session 22/08/2014 Advanced data-driven modeling techniques
Chapter 4: Vector Autoregressive Models
 Chapter 4: Vector Autoregressive Models 1 Contents: Lehrstuhl für Department Empirische of Wirtschaftsforschung Empirical Research and und Econometrics Ökonometrie IV.1 Vector Autoregressive Models (VAR)...
Package depend.truncation
 Type Package Package depend.truncation May 28, 2015 Title Statistical Inference for Parametric and Semiparametric Models Based on Dependently Truncated Data Version 2.4 Date 2015-05-28 Author Takeshi Emura
Estimation of the Dependence Parameter in Bivariate Archimedean Copula Models Under Misspecification
 Estimation of the Dependence Parameter in Bivariate Archimedean Copula Models Under Misspecification Master s Thesis submitted to Prof. Dr. Ostap Okhrin Humboldt-Universität zu Berlin School of Business
Actuarial and Financial Mathematics Conference Interplay between finance and insurance
 KONINKLIJKE VLAAMSE ACADEMIE VAN BELGIE VOOR WETENSCHAPPEN EN KUNSTEN Actuarial and Financial Mathematics Conference Interplay between finance and insurance CONTENTS Invited talk Optimal investment under
Copula Simulation in Portfolio Allocation Decisions
 Copula Simulation in Portfolio Allocation Decisions Gyöngyi Bugár Gyöngyi Bugár and Máté Uzsoki University of Pécs Faculty of Business and Economics This presentation has been prepared for the Actuaries
Uncertainty quantification for the family-wise error rate in multivariate copula models
 Uncertainty quantification for the family-wise error rate in multivariate copula models Thorsten Dickhaus (joint work with Taras Bodnar, Jakob Gierl and Jens Stange) University of Bremen Institute for
Modeling Operational Risk: Estimation and Effects of Dependencies
 Modeling Operational Risk: Estimation and Effects of Dependencies Stefan Mittnik Sandra Paterlini Tina Yener Financial Mathematics Seminar March 4, 2011 Outline Outline of the Talk 1 Motivation Operational
ON MODELING INSURANCE CLAIMS
 ON MODELING INSURANCE CLAIMS USING COPULAS FILIP ERNTELL Master s thesis 213:E55 Faculty of Science Centre for Mathematical Sciences Mathematical Statistics CENTRUM SCIENTIARUM MATHEMATICARUM ON MODELING
Wealth inequality: Britain in international perspective. Frank Cowell: Wealth Seminar June 2012
 Wealth inequality: Britain in international perspective Frank Cowell: Wealth Seminar June 2012 Questions What does UK wealth inequality look like in context? What is role of inequality among the rich?
Modelling the dependence structure of financial assets: A survey of four copulas
 Modelling the dependence structure of financial assets: A survey of four copulas Gaussian copula Clayton copula NORDIC -0.05 0.0 0.05 0.10 NORDIC NORWAY NORWAY Student s t-copula Gumbel copula NORDIC NORDIC
GENERATING SIMULATION INPUT WITH APPROXIMATE COPULAS
 GENERATING SIMULATION INPUT WITH APPROXIMATE COPULAS Feras Nassaj Johann Christoph Strelen Rheinische Friedrich-Wilhelms-Universitaet Bonn Institut fuer Informatik IV Roemerstr. 164, 53117 Bonn, Germany
Tail Dependence among Agricultural Insurance Indices: The Case of Iowa County-Level Rainfalls
 Tail Dependence among Agricultural Insurance Indices: The Case of Iowa County-Level Rainfalls Pu Liu Research Assistant, Department of Agricultural, Environmental and Development Economics, The Ohio State
Modelling the Dependence Structure of MUR/USD and MUR/INR Exchange Rates using Copula
 International Journal of Economics and Financial Issues Vol. 2, No. 1, 2012, pp.27-32 ISSN: 2146-4138 www.econjournals.com Modelling the Dependence Structure of MUR/USD and MUR/INR Exchange Rates using
Fitting Subject-specific Curves to Grouped Longitudinal Data
 Fitting Subject-specific Curves to Grouped Longitudinal Data Djeundje, Viani Heriot-Watt University, Department of Actuarial Mathematics & Statistics Edinburgh, EH14 4AS, UK E-mail: vad5@hw.ac.uk Currie,
Exchange Rates Dependence: What Drives it?
 Board of Governors of the Federal Reserve System International Finance Discussion Papers Number 969 March 29 Exchange Rates Dependence: What Drives it? Sigríður Benediktsdóttir Chiara Scotti NOTE: International
SAS Certificate Applied Statistics and SAS Programming
 SAS Certificate Applied Statistics and SAS Programming SAS Certificate Applied Statistics and Advanced SAS Programming Brigham Young University Department of Statistics offers an Applied Statistics and
Fairfield Public Schools
 Mathematics Fairfield Public Schools AP Statistics AP Statistics BOE Approved 04/08/2014 1 AP STATISTICS Critical Areas of Focus AP Statistics is a rigorous course that offers advanced students an opportunity
3. The Junction Tree Algorithms
 A Short Course on Graphical Models 3. The Junction Tree Algorithms Mark Paskin mark@paskin.org 1 Review: conditional independence Two random variables X and Y are independent (written X Y ) iff p X ( )
The Basics of Graphical Models
 The Basics of Graphical Models David M. Blei Columbia University October 3, 2015 Introduction These notes follow Chapter 2 of An Introduction to Probabilistic Graphical Models by Michael Jordan. Many figures
Forecasting commodity futures using Principal Component Analysis and Copula. Martin Jacobsson
 Forecasting commodity futures using Principal Component Analysis and Copula Martin Jacobsson May 20, 2015 Abstract The ever ongoing battle to beat the market is in this thesis fought with the help of mathematics
Dependency Analysis between Foreign Exchange Rates: A Semi-Parametric Copula Approach
 Dependency Analysis between Foreign Exchange Rates: A Semi-Parametric Copula Approach Kazim Azam Abstract Not only currencies are assets in investors s portfolio, central banks use them for implementing
STA 4273H: Statistical Machine Learning
 STA 4273H: Statistical Machine Learning Russ Salakhutdinov Department of Statistics! rsalakhu@utstat.toronto.edu! http://www.cs.toronto.edu/~rsalakhu/ Lecture 6 Three Approaches to Classification Construct
The VAR models discussed so fare are appropriate for modeling I(0) data, like asset returns or growth rates of macroeconomic time series.
 data, like asset returns or growth rates of macroeconomic time series.") Cointegration The VAR models discussed so fare are appropriate for modeling I(0) data, like asset returns or growth rates of macroeconomic time series. Economic theory, however, often implies equilibrium
Cointegration The VAR models discussed so fare are appropriate for modeling I(0) data, like asset returns or growth rates of macroeconomic time series. Economic theory, however, often implies equilibrium
APPLYING COPULA FUNCTION TO RISK MANAGEMENT. Claudio Romano *
 APPLYING COPULA FUNCTION TO RISK MANAGEMENT Claudio Romano * Abstract This paper is part of the author s Ph. D. Thesis Extreme Value Theory and coherent risk measures: applications to risk management.
Statistics and Probability Letters. Goodness-of-fit test for tail copulas modeled by elliptical copulas
 Statistics and Probability Letters 79 (2009) 1097 1104 Contents lists available at ScienceDirect Statistics and Probability Letters journal homepage: www.elsevier.com/locate/stapro Goodness-of-fit test
BayesX - Software for Bayesian Inference in Structured Additive Regression
 BayesX - Software for Bayesian Inference in Structured Additive Regression Thomas Kneib Faculty of Mathematics and Economics, University of Ulm Department of Statistics, Ludwig-Maximilians-University Munich
Probabilistic Models for Big Data. Alex Davies and Roger Frigola University of Cambridge 13th February 2014
 Probabilistic Models for Big Data Alex Davies and Roger Frigola University of Cambridge 13th February 2014 The State of Big Data Why probabilistic models for Big Data? 1. If you don t have to worry about
Chapter 6. Modeling the Volatility of Futures Return in Rubber and Oil
 Chapter 6 Modeling the Volatility of Futures Return in Rubber and Oil For this case study, we are forecasting the volatility of Futures return in rubber and oil from different futures market using Bivariate
Bayesian Estimation of Joint Survival Functions in Life Insurance
 ISBA 2, Proceedings, pp. ISBA and Eurostat, 21 Bayesian Estimation of Joint Survival Functions in Life Insurance ARKADY SHEMYAKIN and HEEKYUNG YOUN University of St. Thomas, Saint Paul, MN, USA Abstract:
Multiple Regression: What Is It?
 Multiple Regression Multiple Regression: What Is It? Multiple regression is a collection of techniques in which there are multiple predictors of varying kinds and a single outcome We are interested in
Multivariate Analysis of Ecological Data
 Multivariate Analysis of Ecological Data MICHAEL GREENACRE Professor of Statistics at the Pompeu Fabra University in Barcelona, Spain RAUL PRIMICERIO Associate Professor of Ecology, Evolutionary Biology
SENSITIVITY ANALYSIS AND INFERENCE. Lecture 12
 This work is licensed under a Creative Commons Attribution-NonCommercial-ShareAlike License. Your use of this material constitutes acceptance of that license and the conditions of use of materials on this
Chapter 6: Multivariate Cointegration Analysis
 Chapter 6: Multivariate Cointegration Analysis 1 Contents: Lehrstuhl für Department Empirische of Wirtschaftsforschung Empirical Research and und Econometrics Ökonometrie VI. Multivariate Cointegration
Linear Threshold Units
 Linear Threshold Units w x hx (... w n x n w We assume that each feature x j and each weight w j is a real number (we will relax this later) We will study three different algorithms for learning linear
Goodness of fit assessment of item response theory models
 Goodness of fit assessment of item response theory models Alberto Maydeu Olivares University of Barcelona Madrid November 1, 014 Outline Introduction Overall goodness of fit testing Two examples Assessing
Why Taking This Course? Course Introduction, Descriptive Statistics and Data Visualization. Learning Goals. GENOME 560, Spring 2012
 Why Taking This Course? Course Introduction, Descriptive Statistics and Data Visualization GENOME 560, Spring 2012 Data are interesting because they help us understand the world Genomics: Massive Amounts
An analysis of the dependence between crude oil price and ethanol price using bivariate extreme value copulas
 The Empirical Econometrics and Quantitative Economics Letters ISSN 2286 7147 EEQEL all rights reserved Volume 3, Number 3 (September 2014), pp. 13-23. An analysis of the dependence between crude oil price
Quantitative Methods for Finance
 Quantitative Methods for Finance Module 1: The Time Value of Money 1 Learning how to interpret interest rates as required rates of return, discount rates, or opportunity costs. 2 Learning how to explain
Least Squares Estimation
 Least Squares Estimation SARA A VAN DE GEER Volume 2, pp 1041 1045 in Encyclopedia of Statistics in Behavioral Science ISBN-13: 978-0-470-86080-9 ISBN-10: 0-470-86080-4 Editors Brian S Everitt & David
Portfolio Distribution Modelling and Computation. Harry Zheng Department of Mathematics Imperial College h.zheng@imperial.ac.uk
 Portfolio Distribution Modelling and Computation Harry Zheng Department of Mathematics Imperial College h.zheng@imperial.ac.uk Workshop on Fast Financial Algorithms Tanaka Business School Imperial College
Contributions to high dimensional statistical learning
 Contributions to high dimensional statistical learning Stéphane Girard INRIA Rhône-Alpes & LJK (team MISTIS). 655, avenue de l Europe, Montbonnot. 38334 Saint-Ismier Cedex, France Stephane.Girard@inria.fr
A Copula-based Approach to Option Pricing and Risk Assessment
 Journal of Data Science 6(28), 273-31 A Copula-based Approach to Option Pricing and Risk Assessment Shang C. Chiou 1 and Ruey S. Tsay 2 1 Goldman Sachs Group Inc. and 2 University of Chicago Abstract:
Current Standard: Mathematical Concepts and Applications Shape, Space, and Measurement- Primary
 Shape, Space, and Measurement- Primary A student shall apply concepts of shape, space, and measurement to solve problems involving two- and three-dimensional shapes by demonstrating an understanding of:
 Copulas in Financial Risk Management Dr Jorn Rank Department for Continuing Education University of Oxford A thesis submitted for the diploma in Mathematical Finance 4 August 2000 Diploma in Mathematical
Overview of Violations of the Basic Assumptions in the Classical Normal Linear Regression Model
 Overview of Violations of the Basic Assumptions in the Classical Normal Linear Regression Model 1 September 004 A. Introduction and assumptions The classical normal linear regression model can be written
Week 1. Exploratory Data Analysis
 Week 1 Exploratory Data Analysis Practicalities This course ST903 has students from both the MSc in Financial Mathematics and the MSc in Statistics. Two lectures and one seminar/tutorial per week. Exam
A Primer on Mathematical Statistics and Univariate Distributions; The Normal Distribution; The GLM with the Normal Distribution
 A Primer on Mathematical Statistics and Univariate Distributions; The Normal Distribution; The GLM with the Normal Distribution PSYC 943 (930): Fundamentals of Multivariate Modeling Lecture 4: September
BNG 202 Biomechanics Lab. Descriptive statistics and probability distributions I
 BNG 202 Biomechanics Lab Descriptive statistics and probability distributions I Overview The overall goal of this short course in statistics is to provide an introduction to descriptive and inferential
An Internal Model for Operational Risk Computation
 An Internal Model for Operational Risk Computation Seminarios de Matemática Financiera Instituto MEFF-RiskLab, Madrid http://www.risklab-madrid.uam.es/ Nicolas Baud, Antoine Frachot & Thierry Roncalli
Dependence Concepts. by Marta Monika Wawrzyniak. Master Thesis in Risk and Environmental Modelling Written under the direction of Dr Dorota Kurowicka
 Dependence Concepts by Marta Monika Wawrzyniak Master Thesis in Risk and Environmental Modelling Written under the direction of Dr Dorota Kurowicka Delft Institute of Applied Mathematics Delft University
PATTERN RECOGNITION AND MACHINE LEARNING CHAPTER 4: LINEAR MODELS FOR CLASSIFICATION
 PATTERN RECOGNITION AND MACHINE LEARNING CHAPTER 4: LINEAR MODELS FOR CLASSIFICATION Introduction In the previous chapter, we explored a class of regression models having particularly simple analytical
Lecture 3: Linear methods for classification
 Lecture 3: Linear methods for classification Rafael A. Irizarry and Hector Corrada Bravo February, 2010 Today we describe four specific algorithms useful for classification problems: linear regression,
Big Data Interpolation: An Effcient Sampling Alternative for Sensor Data Aggregation
 Big Data Interpolation: An Effcient Sampling Alternative for Sensor Data Aggregation Hadassa Daltrophe, Shlomi Dolev, Zvi Lotker Ben-Gurion University Outline Introduction Motivation Problem definition
Master s Theory Exam Spring 2006
 Spring 2006 This exam contains 7 questions. You should attempt them all. Each question is divided into parts to help lead you through the material. You should attempt to complete as much of each problem
Bayesian Stomping Models and Multivariate Loss Res reserving Models
 PREDICTING MULTIVARIATE INSURANCE LOSS PAYMENTS UNDER THE BAYESIAN COPULA FRAMEWORK YANWEI ZHANG CNA INSURANCE COMPANY VANJA DUKIC APPLIED MATH UNIVERSITY OF COLORADO-BOULDER Abstract. The literature of
A teaching experience through the development of hypertexts and object oriented software.
 A teaching experience through the development of hypertexts and object oriented software. Marcello Chiodi Istituto di Statistica. Facoltà di Economia-Palermo-Italy 1. Introduction (1) This paper is concerned
Lecture 2 ESTIMATING THE SURVIVAL FUNCTION. One-sample nonparametric methods
 Lecture 2 ESTIMATING THE SURVIVAL FUNCTION One-sample nonparametric methods There are commonly three methods for estimating a survivorship function S(t) = P (T > t) without resorting to parametric models:
Multivariate Negative Binomial Models for Insurance Claim Counts
 Multivariate Negative Binomial Models for Insurance Claim Counts Peng Shi Division of Statistics Northern Illinois University DeKalb, IL 0 Email: pshi@niu.edu Emiliano A. Valdez Department of Mathematics
Java Modules for Time Series Analysis
 Java Modules for Time Series Analysis Agenda Clustering Non-normal distributions Multifactor modeling Implied ratings Time series prediction 1. Clustering + Cluster 1 Synthetic Clustering + Time series
NEW YORK STATE TEACHER CERTIFICATION EXAMINATIONS
 NEW YORK STATE TEACHER CERTIFICATION EXAMINATIONS TEST DESIGN AND FRAMEWORK September 2014 Authorized for Distribution by the New York State Education Department This test design and framework document
New Work Item for ISO 3534-5 Predictive Analytics (Initial Notes and Thoughts) Introduction
 Introduction") Introduction New Work Item for ISO 3534-5 Predictive Analytics (Initial Notes and Thoughts) Predictive analytics encompasses the body of statistical knowledge supporting the analysis of massive data sets.
Introduction New Work Item for ISO 3534-5 Predictive Analytics (Initial Notes and Thoughts) Predictive analytics encompasses the body of statistical knowledge supporting the analysis of massive data sets.
Measuring Portfolio Value at Risk
 Measuring Portfolio Value at Risk Chao Xu 1, Huigeng Chen 2 Supervisor: Birger Nilsson Department of Economics School of Economics and Management, Lund University May 2012 1 saintlyjinn@hotmail.com 2 chenhuigeng@gmail.com
Common Core Unit Summary Grades 6 to 8
 Common Core Unit Summary Grades 6 to 8 Grade 8: Unit 1: Congruence and Similarity- 8G1-8G5 rotations reflections and translations,( RRT=congruence) understand congruence of 2 d figures after RRT Dilations
Bayesian networks - Time-series models - Apache Spark & Scala
 Bayesian networks - Time-series models - Apache Spark & Scala Dr John Sandiford, CTO Bayes Server Data Science London Meetup - November 2014 1 Contents Introduction Bayesian networks Latent variables Anomaly
Statistics in Retail Finance. Chapter 6: Behavioural models
 Statistics in Retail Finance 1 Overview > So far we have focussed mainly on application scorecards. In this chapter we shall look at behavioural models. We shall cover the following topics:- Behavioural
Service courses for graduate students in degree programs other than the MS or PhD programs in Biostatistics.
 Course Catalog In order to be assured that all prerequisites are met, students must acquire a permission number from the education coordinator prior to enrolling in any Biostatistics course. Courses are
Multivariate Normal Distribution
 Multivariate Normal Distribution Lecture 4 July 21, 2011 Advanced Multivariate Statistical Methods ICPSR Summer Session #2 Lecture #4-7/21/2011 Slide 1 of 41 Last Time Matrices and vectors Eigenvalues
General Sampling Methods
 General Sampling Methods Reference: Glasserman, 2.2 and 2.3 Claudio Pacati academic year 2016 17 1 Inverse Transform Method Assume U U(0, 1) and let F be the cumulative distribution function of a distribution
Measuring Economic Capital: Value at Risk, Expected Tail Loss and Copula Approach
 Measuring Economic Capital: Value at Risk, Expected Tail Loss and Copula Approach by Jeungbo Shim, Seung-Hwan Lee, and Richard MacMinn August 19, 2009 Please address correspondence to: Jeungbo Shim Department
Quantitative Operational Risk Management
 Quantitative Operational Risk Management Kaj Nyström and Jimmy Skoglund Swedbank, Group Financial Risk Control S-105 34 Stockholm, Sweden September 3, 2002 Abstract The New Basel Capital Accord presents
Monte Carlo and Empirical Methods for Stochastic Inference (MASM11/FMS091)
") Monte Carlo and Empirical Methods for Stochastic Inference (MASM11/FMS091) Magnus Wiktorsson Centre for Mathematical Sciences Lund University, Sweden Lecture 5 Sequential Monte Carlo methods I February
Monte Carlo and Empirical Methods for Stochastic Inference (MASM11/FMS091) Magnus Wiktorsson Centre for Mathematical Sciences Lund University, Sweden Lecture 5 Sequential Monte Carlo methods I February
Computational Foundations of Cognitive Science
 Computational Foundations of Cognitive Science Lecture 15: Convolutions and Kernels Frank Keller School of Informatics University of Edinburgh keller@inf.ed.ac.uk February 23, 2010 Frank Keller Computational
THE POSITION OF THE WIG INDEX IN COMPARISON WITH SELECTED MARKET INDICES IN BOOM AND BUST PERIODS
 STATISTICS IN TRANSITION new series, Summer 2014 427 STATISTICS IN TRANSITION new series, Summer 2014 Vol. 15, No. 3, pp. 427 436 THE POSITION OF THE WIG INDEX IN COMPARISON WITH SELECTED MARKET INDICES
OPTIMIZATION AND FORECASTING WITH FINANCIAL TIME SERIES
 OPTIMIZATION AND FORECASTING WITH FINANCIAL TIME SERIES Allan Din Geneva Research Collaboration Notes from seminar at CERN, June 25, 2002 General scope of GRC research activities Econophysics paradigm
Contents. List of Figures. List of Tables. List of Examples. Preface to Volume IV
 Contents List of Figures List of Tables List of Examples Foreword Preface to Volume IV xiii xvi xxi xxv xxix IV.1 Value at Risk and Other Risk Metrics 1 IV.1.1 Introduction 1 IV.1.2 An Overview of Market
Statistical machine learning, high dimension and big data
 Statistical machine learning, high dimension and big data S. Gaïffas 1 14 mars 2014 1 CMAP - Ecole Polytechnique Agenda for today Divide and Conquer principle for collaborative filtering Graphical modelling,
Institute of Actuaries of India Subject CT3 Probability and Mathematical Statistics
 Institute of Actuaries of India Subject CT3 Probability and Mathematical Statistics For 2015 Examinations Aim The aim of the Probability and Mathematical Statistics subject is to provide a grounding in
Average Redistributional Effects. IFAI/IZA Conference on Labor Market Policy Evaluation
 Average Redistributional Effects IFAI/IZA Conference on Labor Market Policy Evaluation Geert Ridder, Department of Economics, University of Southern California. October 10, 2006 1 Motivation Most papers