Continuous monitoring of forest disturbance using all available Landsat imagery
|
|
|
- Ilene Lloyd
- 7 years ago
- Views:
Transcription

1 Continuous monitoring of forest disturbance using all available Landsat imagery Zhe Zhu, Curtis E. Woodcock, and Pontus Olofsson Dept. of Geography and Environment, Boston University 675 Commonwealth Avenue, Boston, MA 02215, USA Corresponding authors


2 Study area includes commercial timber land, agriculture and urban areas Study area (subset of November 23 rd 2002 Landsat ETM+ image Band 432 composites)
3 Steps of Continuous Monitoring of Forest Disturbance Algorithm (CMFDA) 1. Remove clouds and cloud shadows 2. Estimate surface reflectance model from past observations (LEDAPS for atmospheric correction) 3. Predict surface reflectance assuming no land cover change (forest clearing) 4. Define a forest mask 5. Compare predicted and observed images to find forest disturbance


4 Study area (all available Landsat ETM+ image from 2001 to 2002 with cloud cover less than 90%)
5 Two-step cloud/cloud shadow screening Step one global algorithm : Single-date based cloud and cloud shadow masking (Fmask freely available) Step two pixel-based algorithm : Multitemporal cloud and cloud shadow masking based using a robust fitting of TOA reflectances of the clear pixels clouds and shadows are ephemeral outliers
6 Results after initial screening and then multitemporal results Illustration of the two-step cloud, cloud shadow, and snow masking results. Left image shows a small piece of a Landsat image (shown with Bands 4, 3, and 2 in red, green, and blue). Middle image shows the results of the Fmask algorithm. Clouds are yellow and shadows are blue. Right image shows the results after use of the multi-temporal approach. Notice that the cloud and cloud shadow missed in Fmask were found in the multi-temporal approach.
7 Estimate time series models for Landsat surface reflectances Where, x = Julian date N = number of years T = number of days per year (=365) = coefficient for overall reflectance = coefficients capture the changes over i th year = coefficients for bimodal variations of surface reflectance each year.
8 Predicting surface reflectances Take away the coefficients for capturing interannual changes
9
10 Visual comparison of the observed and predicted surface reflectance for Landsat images
11
12 Two algorithms tested Two algorithms have been developed: Single-date differencing: Multi-date differencing:
13 Reference map A total of 21 rectangular areas, each with width and length larger than 3 km, were carefully interpreted to determine precisely the location and timing of forest disturbances. The reference rectangles were divided into two groups: one group used for training CMFDA and one group used for evaluating CMFDA accuracy. The reference rectangles were sorted and ranked by size and the odd number ranked rectangles (in blue) were used for help training CMFDA, and the even number ranked rectangles (in red) were used for evaluating CMFDA
14 Reference Map when and where for forest clearing
15 1. Spatial accuracies Results of single-date differencing: Testing on unseen data Reference data Single-date differencing Forest disturbance Others Total User s (%) Forest disturbance Others Total Producer s (%) Overall (%) Temporal accuracy = 90% This table shows the confusion matrix for the accuracy assessment of the single-date differencing algorithm. The overall accuracy results are not terribly revealing, as after excluding the edges of the change polygons, the change pixels left are only about 3% of the total interpreted pixels.
16 1. Spatial accuracies Results of multi-date differencing Testing unseen data Reference data Single-date differencing Forest disturbance Others Total User s (%) Forest disturbance Others Total Producer s (%) Overall (%) Temporal accuracy = 94% This table shows the confusion matrix for the accuracy assessment of the single-date differencing algorithm. The overall accuracy results are not terribly revealing, as after excluding the edges of the change polygons, the change pixels left are only about 3% of the total interpreted pixels.

17 Map of location and timing of forest clearing (over reference areas)
18 Zoom in of reference and accuracy maps. The colors show different types of errors.


19 Examples of continuous monitoring of forest disturbance using all available Landsat images in 2003
20 Discussion and conclusions (Part I) CMFDA is accurate in detecting forest disturbance both spatially and temporally, with producer s and user s accuracies above 95% and the temporal accuracy of approximately 94%. The continuous character of the monitoring makes the algorithm capable of indentifying disturbance soon after Landsat observations are available. It can be transferred to monitoring other land cover changes by applying different land cover masks. The SLC-off problem in Landsat 7 is not nearly as significant for CMFDA as compared with more conventional approaches. The expected time to find probable change and change in CMFDA is still too long to monitor changes as they are occurring. To achieve goal of global near-real time monitoring of land cover change, using more Landsat-like sensors or fusion with higher temporal frequency sensors like MODIS are choices in future studies.
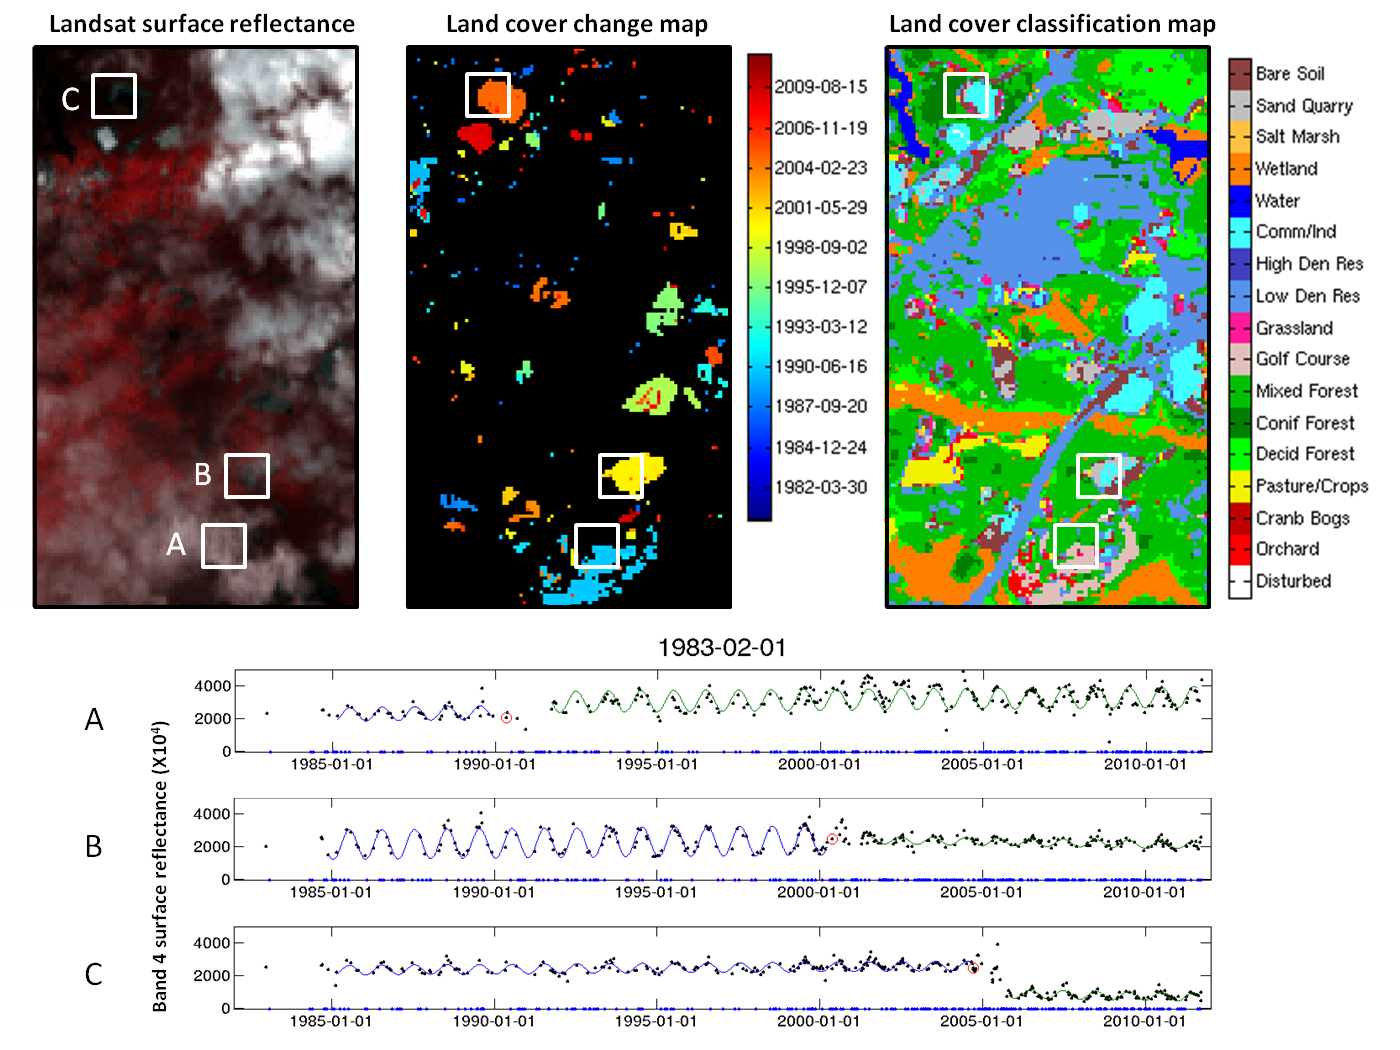
21 Continuous land cover classification and change detection We processed a total of 532 Landsat TM/ETM+ images for path 12 row 31 at Eastern Massachusetts started from 1982 to Land cover changes are detected continuously using all spectral bands. The type of land cover for each curve are classified using the parameters of the time series model.
22 Community Goals? Reconstruct the history of the surface of Earth Provide maps of surface characteristics at any time (where maps change between dates correspond to locations of land cover change!!) Monitor change as it is occurring management relevant In interesting ways, there are part of the same process!
23 Study Area Path/Row =12/31
24

25 Landsat surface reflectance Band 4 surface reflectance (X10 4 ) Land cover change map Land cover classification map C B A A B C
26
27 Conclusions: Comments and Lessons for Sentinel-2 Better use of the time domain improves consistency, accuracy, timeliness and thematic detail in land cover data Dependent on ability to easily analyze free images (Landsat L1T format, easy conversion to surface reflectance via LEDAPS, automated cloud and shadow screening) Images with lots of clouds are useful as they also have lots of clear observations (getting roughly 25% of observations from images with >25% cloud cover) To extend the Landsat time series with Sentinel, we need to able to overlay images at the pixel scale! Historical observations are extremely valuable, particularly when processed consistently through time (please help the USGS effort to build a consistent dataset of all existing Landsat images)
Cloud Detection for Sentinel 2. Curtis Woodcock, Zhe Zhu, Shixiong Wang and Chris Holden
 Cloud Detection for Sentinel 2 Curtis Woodcock, Zhe Zhu, Shixiong Wang and Chris Holden Background 3 primary spectral regions useful for cloud detection Optical Thermal Cirrus bands Legacy Landsats have
Virtual constellations, time series, and cloud screening opportunities for Sentinel 2 and Landsat
 Virtual constellations, time series, and cloud screening opportunities for Sentinel 2 and Landsat Sentinel 2 for Science Workshop 20 22 May 2014 ESA ESRIN, Frascati (Rome), Italy 1 Part 1: Title: Towards
Review for Introduction to Remote Sensing: Science Concepts and Technology
 Review for Introduction to Remote Sensing: Science Concepts and Technology Ann Johnson Associate Director ann@baremt.com Funded by National Science Foundation Advanced Technological Education program [DUE
Application of Remotely Sensed Data and Technology to Monitor Land Change in Massachusetts
 Application of Remotely Sensed Data and Technology to Monitor Land Change in Massachusetts Sam Blanchard, Nick Bumbarger, Joe Fortier, and Alina Taus Advisor: John Rogan Geography Department, Clark University
ANALYSIS OF FOREST CHANGE IN FIRE DAMAGE AREA USING SATELLITE IMAGES
 ANALYSIS OF FOREST CHANGE IN FIRE DAMAGE AREA USING SATELLITE IMAGES Joon Mook Kang, Professor Joon Kyu Park, Ph.D Min Gyu Kim, Ph.D._Candidate Dept of Civil Engineering, Chungnam National University 220
WATER BODY EXTRACTION FROM MULTI SPECTRAL IMAGE BY SPECTRAL PATTERN ANALYSIS
 WATER BODY EXTRACTION FROM MULTI SPECTRAL IMAGE BY SPECTRAL PATTERN ANALYSIS Nguyen Dinh Duong Department of Environmental Information Study and Analysis, Institute of Geography, 18 Hoang Quoc Viet Rd.,
Remote Sensing Method in Implementing REDD+
 Remote Sensing Method in Implementing REDD+ FRIM-FFPRI Research on Development of Carbon Monitoring Methodology for REDD+ in Malaysia Remote Sensing Component Mohd Azahari Faidi, Hamdan Omar, Khali Aziz
Generation of Cloud-free Imagery Using Landsat-8
 Generation of Cloud-free Imagery Using Landsat-8 Byeonghee Kim 1, Youkyung Han 2, Yonghyun Kim 3, Yongil Kim 4 Department of Civil and Environmental Engineering, Seoul National University (SNU), Seoul,
The USGS Landsat Big Data Challenge
 The USGS Landsat Big Data Challenge Brian Sauer Engineering and Development USGS EROS bsauer@usgs.gov U.S. Department of the Interior U.S. Geological Survey USGS EROS and Landsat 2 Data Utility and Exploitation
Geospatial intelligence and data fusion techniques for sustainable development problems
 Geospatial intelligence and data fusion techniques for sustainable development problems Nataliia Kussul 1,2, Andrii Shelestov 1,2,4, Ruslan Basarab 1,4, Sergii Skakun 1, Olga Kussul 2 and Mykola Lavreniuk
EO based glacier monitoring
 EO based glacier monitoring THEMES 1. WGMS & GLIMS within GTN G: strategic set up 2. GlobGlacier & Glaciers_cci: EO based products 3. LDCM & Sentinel 2: future monitoring perspectives Frank Paul* Department
Land Use/Land Cover Map of the Central Facility of ARM in the Southern Great Plains Site Using DOE s Multi-Spectral Thermal Imager Satellite Images
 Land Use/Land Cover Map of the Central Facility of ARM in the Southern Great Plains Site Using DOE s Multi-Spectral Thermal Imager Satellite Images S. E. Báez Cazull Pre-Service Teacher Program University
ENVI Classic Tutorial: Atmospherically Correcting Multispectral Data Using FLAASH 2
 ENVI Classic Tutorial: Atmospherically Correcting Multispectral Data Using FLAASH Atmospherically Correcting Multispectral Data Using FLAASH 2 Files Used in this Tutorial 2 Opening the Raw Landsat Image
SAMPLE MIDTERM QUESTIONS
 Geography 309 Sample MidTerm Questions Page 1 SAMPLE MIDTERM QUESTIONS Textbook Questions Chapter 1 Questions 4, 5, 6, Chapter 2 Questions 4, 7, 10 Chapter 4 Questions 8, 9 Chapter 10 Questions 1, 4, 7
Big data and Earth observation New challenges in remote sensing images interpretation
 Big data and Earth observation New challenges in remote sensing images interpretation Pierre Gançarski ICube CNRS - Université de Strasbourg 2014 Pierre Gançarski Big data and Earth observation 1/58 1
Resolutions of Remote Sensing
 Resolutions of Remote Sensing 1. Spatial (what area and how detailed) 2. Spectral (what colors bands) 3. Temporal (time of day/season/year) 4. Radiometric (color depth) Spatial Resolution describes how
Moderate- and high-resolution Earth Observation data based forest and agriculture monitoring in Russia using VEGA Web-Service
 Moderate- and high-resolution Earth Observation data based forest and agriculture monitoring in Russia using VEGA Web-Service Sergey BARTALEV and Evgeny LOUPIAN Space Research Institute, Russian Academy
Calculation of Minimum Distances. Minimum Distance to Means. Σi i = 1
 Minimum Distance to Means Similar to Parallelepiped classifier, but instead of bounding areas, the user supplies spectral class means in n-dimensional space and the algorithm calculates the distance between
SPOT4 (Take 5) first validation and application results
 first validation and application results") SPOT4 (Take 5) first validation and application results O.Hagolle CESBIO/CNES, M.Huc CESBIO/CNRS, M.Kadiri CESBIO/THEIA ; J.Inglada CESBIO/CNES, C. Marais-Sicre CESBIO/CNRS, J.Osman CESBIO/CNES (PhD),
SPOT4 (Take 5) first validation and application results O.Hagolle CESBIO/CNES, M.Huc CESBIO/CNRS, M.Kadiri CESBIO/THEIA ; J.Inglada CESBIO/CNES, C. Marais-Sicre CESBIO/CNRS, J.Osman CESBIO/CNES (PhD),
Data Processing Flow Chart
 Legend Start V1 V2 V3 Completed Version 2 Completion date Data Processing Flow Chart Data: Download a) AVHRR: 1981-1999 b) MODIS:2000-2010 c) SPOT : 1998-2002 No Progressing Started Did not start 03/12/12
APPLICATION OF MULTITEMPORAL LANDSAT DATA TO MAP AND MONITOR LAND COVER AND LAND USE CHANGE IN THE CHESAPEAKE BAY WATERSHED
 APPLICATION OF MULTITEMPORAL LANDSAT DATA TO MAP AND MONITOR LAND COVER AND LAND USE CHANGE IN THE CHESAPEAKE BAY WATERSHED S. J. GOETZ Woods Hole Research Center Woods Hole, Massachusetts 054-096 USA
Automatic land-cover map production of agricultural areas using supervised classification of SPOT4(Take5) and Landsat-8 image time series.
 and Landsat-8 image time series.") Automatic land-cover map production of agricultural areas using supervised classification of SPOT4(Take5) and Landsat-8 image time series. Jordi Inglada 2014/11/18 SPOT4/Take5 User Workshop 2014/11/18
Automatic land-cover map production of agricultural areas using supervised classification of SPOT4(Take5) and Landsat-8 image time series. Jordi Inglada 2014/11/18 SPOT4/Take5 User Workshop 2014/11/18
A KNOWLEDGE-BASED APPROACH FOR REDUCING CLOUD AND SHADOW ABSTRACT
 A KNOWLEDGE-BASED APPROACH FOR REDUCING CLOUD AND SHADOW Mingjun Song, Graduate Research Assistant Daniel L. Civco, Director Laboratory for Earth Resources Information Systems Department of Natural Resources
Spectral Response for DigitalGlobe Earth Imaging Instruments
 Spectral Response for DigitalGlobe Earth Imaging Instruments IKONOS The IKONOS satellite carries a high resolution panchromatic band covering most of the silicon response and four lower resolution spectral
Using Remote Sensing Imagery to Evaluate Post-Wildfire Damage in Southern California
 Graham Emde GEOG 3230 Advanced Remote Sensing February 22, 2013 Lab #1 Using Remote Sensing Imagery to Evaluate Post-Wildfire Damage in Southern California Introduction Wildfires are a common disturbance
Environmental Remote Sensing GEOG 2021
 Environmental Remote Sensing GEOG 2021 Lecture 4 Image classification 2 Purpose categorising data data abstraction / simplification data interpretation mapping for land cover mapping use land cover class
TerraColor White Paper
 TerraColor White Paper TerraColor is a simulated true color digital earth imagery product developed by Earthstar Geographics LLC. This product was built from imagery captured by the US Landsat 7 (ETM+)
Supervised Classification workflow in ENVI 4.8 using WorldView-2 imagery
 Supervised Classification workflow in ENVI 4.8 using WorldView-2 imagery WorldView-2 is the first commercial high-resolution satellite to provide eight spectral sensors in the visible to near-infrared
A remote sensing instrument collects information about an object or phenomenon within the
 Satellite Remote Sensing GE 4150- Natural Hazards Some slides taken from Ann Maclean: Introduction to Digital Image Processing Remote Sensing the art, science, and technology of obtaining reliable information
Analysis of Landsat ETM+ Image Enhancement for Lithological Classification Improvement in Eagle Plain Area, Northern Yukon
 Analysis of Landsat ETM+ Image Enhancement for Lithological Classification Improvement in Eagle Plain Area, Northern Yukon Shihua Zhao, Department of Geology, University of Calgary, zhaosh@ucalgary.ca,
Operational Space- Based Crop Mapping Protocols at AAFC A. Davidson, H. McNairn and T. Fisette.
 Operational Space- Based Crop Mapping Protocols at AAFC A. Davidson, H. McNairn and T. Fisette. Science & Technology Branch. Agriculture and Agri-Food Canada. 1. Introduction Space-Based Crop Mapping at
Report 2005 EUR 21579 EN
 Feasibility study on the use of medium resolution satellite data for the detection of forest cover change caused by clear cutting of coniferous forests in the northwest of Russia Report 2005 EUR 21579
How Landsat Images are Made
 How Landsat Images are Made Presentation by: NASA s Landsat Education and Public Outreach team June 2006 1 More than just a pretty picture Landsat makes pretty weird looking maps, and it isn t always easy
RESOLUTION MERGE OF 1:35.000 SCALE AERIAL PHOTOGRAPHS WITH LANDSAT 7 ETM IMAGERY
 RESOLUTION MERGE OF 1:35.000 SCALE AERIAL PHOTOGRAPHS WITH LANDSAT 7 ETM IMAGERY M. Erdogan, H.H. Maras, A. Yilmaz, Ö.T. Özerbil General Command of Mapping 06100 Dikimevi, Ankara, TURKEY - (mustafa.erdogan;
VCS REDD Methodology Module. Methods for monitoring forest cover changes in REDD project activities
 1 VCS REDD Methodology Module Methods for monitoring forest cover changes in REDD project activities Version 1.0 May 2009 I. SCOPE, APPLICABILITY, DATA REQUIREMENT AND OUTPUT PARAMETERS Scope This module
Methods for Monitoring Forest and Land Cover Changes and Unchanged Areas from Long Time Series
 Methods for Monitoring Forest and Land Cover Changes and Unchanged Areas from Long Time Series Project using historical satellite data from SACCESS (Swedish National Satellite Data Archive) for developing
Object-Oriented Approach of Information Extraction from High Resolution Satellite Imagery
 IOSR Journal of Computer Engineering (IOSR-JCE) e-issn: 2278-0661,p-ISSN: 2278-8727, Volume 17, Issue 3, Ver. IV (May Jun. 2015), PP 47-52 www.iosrjournals.org Object-Oriented Approach of Information Extraction
2.3 Spatial Resolution, Pixel Size, and Scale
 Section 2.3 Spatial Resolution, Pixel Size, and Scale Page 39 2.3 Spatial Resolution, Pixel Size, and Scale For some remote sensing instruments, the distance between the target being imaged and the platform,
Remote Sensing and Land Use Classification: Supervised vs. Unsupervised Classification Glen Busch
 Remote Sensing and Land Use Classification: Supervised vs. Unsupervised Classification Glen Busch Introduction In this time of large-scale planning and land management on public lands, managers are increasingly
Forest Service Southern Region Jess Clark & Kevin Megown USFS Remote Sensing Applications Center (RSAC)
") Hurricane Katrina Damage Assessment on Lands Managed by the Desoto National Forest using Multi-Temporal Landsat TM Imagery and High Resolution Aerial Photography Renee Jacokes-Mancini Forest Service Southern
Hurricane Katrina Damage Assessment on Lands Managed by the Desoto National Forest using Multi-Temporal Landsat TM Imagery and High Resolution Aerial Photography Renee Jacokes-Mancini Forest Service Southern
An Assessment of the Effectiveness of Segmentation Methods on Classification Performance
 An Assessment of the Effectiveness of Segmentation Methods on Classification Performance Merve Yildiz 1, Taskin Kavzoglu 2, Ismail Colkesen 3, Emrehan K. Sahin Gebze Institute of Technology, Department
MOD09 (Surface Reflectance) User s Guide
 User s Guide") MOD09 (Surface ) User s Guide MODIS Land Surface Science Computing Facility Principal Investigator: Dr. Eric F. Vermote Web site: http://modis-sr.ltdri.org Correspondence e-mail address: mod09@ltdri.org
MOD09 (Surface ) User s Guide MODIS Land Surface Science Computing Facility Principal Investigator: Dr. Eric F. Vermote Web site: http://modis-sr.ltdri.org Correspondence e-mail address: mod09@ltdri.org
Selecting the appropriate band combination for an RGB image using Landsat imagery
 Selecting the appropriate band combination for an RGB image using Landsat imagery Ned Horning Version: 1.0 Creation Date: 2004-01-01 Revision Date: 2004-01-01 License: This document is licensed under a
Satellite Snow Monitoring Activities Project CRYOLAND
 Satellite Snow Monitoring Activities Project CRYOLAND Background material for participants to the Workshop on European Snow Monitoring Perspectives, Darmstadt, 4-5 December 2012. CryoLand provides Snow,
The Idiots Guide to GIS and Remote Sensing
 The Idiots Guide to GIS and Remote Sensing 1. Picking the right imagery 1 2. Accessing imagery 1 3. Processing steps 1 a. Geocorrection 2 b. Processing Landsat images layerstacking 4 4. Landcover classification
Landsat Monitoring our Earth s Condition for over 40 years
 Landsat Monitoring our Earth s Condition for over 40 years Thomas Cecere Land Remote Sensing Program USGS ISPRS:Earth Observing Data and Tools for Health Studies Arlington, VA August 28, 2013 U.S. Department
Cloud-based Geospatial Data services and analysis
 Cloud-based Geospatial Data services and analysis Xuezhi Wang Scientific Data Center Computer Network Information Center Chinese Academy of Sciences 2014-08-25 Outlines 1 Introduction of Geospatial Data
PIXEL-LEVEL IMAGE FUSION USING BROVEY TRANSFORME AND WAVELET TRANSFORM
 PIXEL-LEVEL IMAGE FUSION USING BROVEY TRANSFORME AND WAVELET TRANSFORM Rohan Ashok Mandhare 1, Pragati Upadhyay 2,Sudha Gupta 3 ME Student, K.J.SOMIYA College of Engineering, Vidyavihar, Mumbai, Maharashtra,
Digital image processing
 746A27 Remote Sensing and GIS Lecture 4 Digital image processing Chandan Roy Guest Lecturer Department of Computer and Information Science Linköping University Digital Image Processing Most of the common
and satellite image download with the USGS GloVis portal
 Tutorial: NDVI calculation with SPRING GIS and satellite image download with the USGS GloVis portal Content overview: Downloading data from GloVis: p 2 Using SPRING GIS: p 11 This document is meant to
Land Use/ Land Cover Mapping Initiative for Kansas and the Kansas River Watershed
 Land Use/ Land Cover Mapping Initiative for Kansas and the Kansas River Watershed Kansas Biological Survey Kansas Applied Remote Sensing Program April 2008 Previous Kansas LULC Projects Kansas LULC Map
Multiscale Object-Based Classification of Satellite Images Merging Multispectral Information with Panchromatic Textural Features
 Remote Sensing and Geoinformation Lena Halounová, Editor not only for Scientific Cooperation EARSeL, 2011 Multiscale Object-Based Classification of Satellite Images Merging Multispectral Information with
Measurement of the effect of biomass burning aerosol on inhibition of cloud formation over the Amazon
 Supporting Online Material for Koren et al. Measurement of the effect of biomass burning aerosol on inhibition of cloud formation over the Amazon 1. MODIS new cloud detection algorithm The operational
Development of an Impervious-Surface Database for the Little Blackwater River Watershed, Dorchester County, Maryland
 Development of an Impervious-Surface Database for the Little Blackwater River Watershed, Dorchester County, Maryland By Lesley E. Milheim, John W. Jones, and Roger A. Barlow Open-File Report 2007 1308
Evaluation of Wildfire Duration Time Over Asia using MTSAT and MODIS
 Evaluation of Wildfire Duration Time Over Asia using MTSAT and MODIS Wataru Takeuchi * and Yusuke Matsumura Institute of Industrial Science, University of Tokyo, Japan Ce-504, 6-1, Komaba 4-chome, Meguro,
LANDSAT 8 Level 1 Product Performance
 Réf: IDEAS-TN-10-QualityReport LANDSAT 8 Level 1 Product Performance Quality Report Month/Year: January 2016 Date: 26/01/2016 Issue/Rev:1/9 1. Scope of this document On May 30, 2013, data from the Landsat
Myths and misconceptions about remote sensing
 Myths and misconceptions about remote sensing Ned Horning (graphics support - Nicholas DuBroff) Version: 1.0 Creation Date: 2004-01-01 Revision Date: 2004-01-01 License: This document is licensed under
Understanding Raster Data
 Introduction The following document is intended to provide a basic understanding of raster data. Raster data layers (commonly referred to as grids) are the essential data layers used in all tools developed
GIS Lesson 6 MAPS WITH RASTER IMAGES III: SATELLITE IMAGERY TEACHER INFORMATION
 GIS Lesson 6 MAPS WITH RASTER IMAGES III: SATELLITE IMAGERY TEACHER INFORMATION Lesson Summary: During this lesson students use GIS to load and view truecolor and enhanced satellite images of Alaska. Based
Lab #8: Introduction to ENVI (Environment for Visualizing Images) Image Processing
 Image Processing") Lab #8: Introduction to ENVI (Environment for Visualizing Images) Image Processing ASSIGNMENT: Display each band of a satellite image as a monochrome image and combine three bands into a color image, and
Lab #8: Introduction to ENVI (Environment for Visualizing Images) Image Processing ASSIGNMENT: Display each band of a satellite image as a monochrome image and combine three bands into a color image, and
Accuracy Assessment of Land Use Land Cover Classification using Google Earth
 American Journal of Environmental Protection 25; 4(4): 9-98 Published online July 2, 25 (http://www.sciencepublishinggroup.com/j/ajep) doi:.648/j.ajep.2544.4 ISSN: 228-568 (Print); ISSN: 228-5699 (Online)
Preparing Landsat Image Time Series (LITS) for Monitoring Changes in Vegetation Phenology in Queensland, Australia
 for Monitoring Changes in Vegetation Phenology in Queensland, Australia") Remote Sens. 2012, 4, 1856-1886; doi:10.3390/rs4061856 Article OPEN ACCESS Remote Sensing ISSN 2072-4292 www.mdpi.com/journal/remotesensing Preparing Landsat Image Time Series (LITS) for Monitoring Changes
Remote Sens. 2012, 4, 1856-1886; doi:10.3390/rs4061856 Article OPEN ACCESS Remote Sensing ISSN 2072-4292 www.mdpi.com/journal/remotesensing Preparing Landsat Image Time Series (LITS) for Monitoring Changes
HANDBOOK for detecting land cover changes with Landsat data archive
 HANDBOOK for detecting land cover changes with Landsat data archive Jan 2011 Northwest Pacific Region Environmental Cooperation Center Table of Contents 1. Introduction 1 2. Obtaining Landsat data 2 2.1
PROYECTO DE FORTALECIMIENTO PARA LA PREPARACIÓN REDD+ Y LA COOPERACIÓN SUR SUR. 24 Enero de 2012,
 PROYECTO DE FORTALECIMIENTO PARA LA PREPARACIÓN REDD+ Y LA COOPERACIÓN SUR SUR 24 Enero de 2012, MARCO DEL PROYECTO Cambios importantes en el marcolegal Metas, Sistemasde Información, Registro, Avanceen
Earth Data Science in The Era of Big Data and Compute
 Earth Data Science in The Era of Big Data and Compute E. Lynn Usery U.S. Geological Survey usery@usgs.gov http://cegis.usgs.gov U.S. Department of the Interior U.S. Geological Survey Board on Earth Sciences
Introduction to Imagery and Raster Data in ArcGIS
 Esri International User Conference San Diego, California Technical Workshops July 25, 2012 Introduction to Imagery and Raster Data in ArcGIS Simon Woo slides Cody Benkelman - demos Overview of Presentation
Remote Sensing and GIS Application In Change Detection Study In Urban Zone Using Multi Temporal Satellite
 Remote Sensing and GIS Application In Change Detection Study In Urban Zone Using Multi Temporal Satellite R.Manonmani, G.Mary Divya Suganya Institute of Remote Sensing, Anna University, Chennai 600 025
Monitoring Overview with a Focus on Land Use Sustainability Metrics
 Monitoring Overview with a Focus on Land Use Sustainability Metrics Canadian Roundtable for Sustainable Crops. Nov 26, 2014 Agriclimate, Geomatics, and Earth Observation Division (ACGEO). Presentation
Electromagnetic Radiation (EMR) and Remote Sensing
 and Remote Sensing") Electromagnetic Radiation (EMR) and Remote Sensing 1 Atmosphere Anything missing in between? Electromagnetic Radiation (EMR) is radiated by atomic particles at the source (the Sun), propagates through
Electromagnetic Radiation (EMR) and Remote Sensing 1 Atmosphere Anything missing in between? Electromagnetic Radiation (EMR) is radiated by atomic particles at the source (the Sun), propagates through
Darrel L. Williams 1, Samuel N. Goward 2, and Ta9ana Loboda 2
 Darrel L. Williams 1, Samuel N. Goward 2, and Ta9ana Loboda 2 1 Global Science & Technology, Inc., 7855 Walker Drive, Suite 200, Greenbelt, MD 20770 2 U. of Maryland College Park, Department of Geographical
ArcGIS Agricultural Land Use Maps from the Mississippi Cropland Data Layer
 ArcGIS Agricultural Land Use Maps from the Mississippi Cropland Data Layer Fred L. Shore, Ph.D. Mississippi Department of Agriculture and Commerce Jackson, MS, USA fred_shore@nass.usda.gov Rick Mueller
Cloud Masking and Cloud Products
 Cloud Masking and Cloud Products MODIS Operational Algorithm MOD35 Paul Menzel, Steve Ackerman, Richard Frey, Kathy Strabala, Chris Moeller, Liam Gumley, Bryan Baum MODIS Cloud Masking Often done with
Rapid Assessment of Annual Deforestation in the Brazilian Amazon Using MODIS Data
 Earth Interactions Volume 9 (2005) Paper No. 8 Page 1 Copyright 2005, Paper 09-008; 8,957 words, 5 Figures, 0 Animations, 7 Tables. http://earthinteractions.org Rapid Assessment of Annual Deforestation
Reprojecting MODIS Images
 Reprojecting MODIS Images Why Reprojection? Reasons why reprojection is desirable: 1. Removes Bowtie Artifacts 2. Allows geographic overlays (e.g. coastline, city locations) 3. Makes pretty pictures for
Multi-Temporal Wild Fire Monitoring in Lao PDR using MODIS Data
 Multi-Temporal Wild Fire Monitoring in Lao PDR using MODIS Data Vivarad Phonekeo Ph. D. Geoinformatics Center (GIC) Asian Institute of Technology vivarad@ait.ac.th, vivarad@gmail.com www.vivarad.info Thatheva
Mosaicking and Subsetting Images
 Mosaicking and Subsetting Images Using SAGA GIS Tutorial ID: IGET_RS_005 This tutorial has been developed by BVIEER as part of the IGET web portal intended to provide easy access to geospatial education.
ENVI THE PREMIER SOFTWARE FOR EXTRACTING INFORMATION FROM GEOSPATIAL IMAGERY.
 ENVI THE PREMIER SOFTWARE FOR EXTRACTING INFORMATION FROM GEOSPATIAL IMAGERY. ENVI Imagery Becomes Knowledge ENVI software uses proven scientific methods and automated processes to help you turn geospatial
Adaptive HSI Data Processing for Near-Real-time Analysis and Spectral Recovery *
 Adaptive HSI Data Processing for Near-Real-time Analysis and Spectral Recovery * Su May Hsu, 1 Hsiao-hua Burke and Michael Griffin MIT Lincoln Laboratory, Lexington, Massachusetts 1. INTRODUCTION Hyperspectral
SEMI-AUTOMATED CLOUD/SHADOW REMOVAL AND LAND COVER CHANGE DETECTION USING SATELLITE IMAGERY
 SEMI-AUTOMATED CLOUD/SHADOW REMOVAL AND LAND COVER CHANGE DETECTION USING SATELLITE IMAGERY A. K. Sah a, *, B. P. Sah a, K. Honji a, N. Kubo a, S. Senthil a a PASCO Corporation, 1-1-2 Higashiyama, Meguro-ku,
CLOUD MASKING AND CLOUD PRODUCTS ROUNDTABLE EXPECTED PARTICIPANTS: ACKERMAN, HALL, WAN, VERMOTE, BARKER, HUETE, BROWN, GORDON, KAUFMAN, SCHAAF, BAUM
 CLOUD MASKING AND CLOUD PRODUCTS ROUNDTABLE EXPECTED PARTICIPANTS: ACKERMAN, HALL, WAN, VERMOTE, BARKER, HUETE, BROWN, GORDON, KAUFMAN, SCHAAF, BAUM NOMINAL PURPOSE: DISCUSSION OF TESTS FOR ACCURACY AND
Overview. 1. Types of land dynamics 2. Methods for analyzing multi-temporal remote sensing data:
 Vorlesung Allgemeine Fernerkundung, Prof. Dr. C. Schmullius Change detection and time series analysis Lecture by Martin Herold Wageningen University Geoinformatik & Fernerkundung, Friedrich-Schiller-Universität
Finding and Downloading Landsat Data from the U.S. Geological Survey s Global Visualization Viewer Website
 January 1, 2013 Finding and Downloading Landsat Data from the U.S. Geological Survey s Global Visualization Viewer Website All Landsat data are available to the public at no cost from U.S. Geological Survey
OBJECT BASED IMAGE CLASSIFICATION AND WEB-MAPPING TECHNIQUES FOR FLOOD DAMAGE ASSESSMENT
 OBJECT BASED IMAGE CLASSIFICATION AND WEB-MAPPING TECHNIQUES FOR FLOOD DAMAGE ASSESSMENT Ejaz Hussain, KyoHyouk Kim, Jie Shan {ehussain, kim458, jshan}@ecn.purdue.edu Geomatics Engineering, School of Civil
Received in revised form 24 March 2004; accepted 30 March 2004
 Remote Sensing of Environment 91 (2004) 237 242 www.elsevier.com/locate/rse Cloud detection in Landsat imagery of ice sheets using shadow matching technique and automatic normalized difference snow index
Assessing Hurricane Katrina Damage to the Mississippi Gulf Coast Using IKONOS Imagery
 Assessing Hurricane Katrina Damage to the Mississippi Gulf Coast Using IKONOS Imagery Joseph P. Spruce Science Systems and Applications, Inc. John C., MS 39529 Rodney McKellip NASA Project Integration
The Wildland-Urban Interface in the United States
 The Wildland-Urban Interface in the United States Susan I. Stewart Northern Research Station, USDA Forest Service, Evanston, IL (sistewart@fs.fed.us) Volker C. Radeloff Department of Forestry, University
STAR Algorithm and Data Products (ADP) Beta Review. Suomi NPP Surface Reflectance IP ARP Product
 Beta Review. Suomi NPP Surface Reflectance IP ARP Product") STAR Algorithm and Data Products (ADP) Beta Review Suomi NPP Surface Reflectance IP ARP Product Alexei Lyapustin Surface Reflectance Cal Val Team 11/26/2012 STAR ADP Surface Reflectance ARP Team Member
STAR Algorithm and Data Products (ADP) Beta Review Suomi NPP Surface Reflectance IP ARP Product Alexei Lyapustin Surface Reflectance Cal Val Team 11/26/2012 STAR ADP Surface Reflectance ARP Team Member
Advanced Image Management using the Mosaic Dataset
 Esri International User Conference San Diego, California Technical Workshops July 25, 2012 Advanced Image Management using the Mosaic Dataset Vinay Viswambharan, Mike Muller Agenda ArcGIS Image Management
SMEX04 Land Use Classification Data
 Notice to Data Users: The documentation for this data set was provided solely by the Principal Investigator(s) and was not further developed, thoroughly reviewed, or edited by NSIDC. Thus, support for
Land Cover Mapping of the Comoros Islands: Methods and Results. February 2014. ECDD, BCSF & Durrell Lead author: Katie Green
 Land Cover Mapping of the Comoros Islands: Methods and Results February 2014 ECDD, BCSF & Durrell Lead author: Katie Green About the ECDD project The ECDD project was run by Bristol Conservation & Science
Nature Values Screening Using Object-Based Image Analysis of Very High Resolution Remote Sensing Data
 Nature Values Screening Using Object-Based Image Analysis of Very High Resolution Remote Sensing Data Aleksi Räsänen*, Anssi Lensu, Markku Kuitunen Environmental Science and Technology Dept. of Biological
Relating Land Cover Changes to Stream Water Quality in North Carolina
 Relating Land Cover Changes to Stream Water Quality in North Carolina STUDENT HANDOUT! Central Question How has land cover within Long Creek Watershed in Charlotte, NC changed between 1988 and 2008? Overview
EO Information Services in support of West Africa Coastal vulnerability - Service Utility Review -
 EO Information Services in support of West Africa Coastal vulnerability - Service Utility Review - Christian Hoffmann, GeoVille World Bank HQ, Washington DC Date : 24 February 2012 Content - Project background
A STRATEGY FOR ESTIMATING TREE CANOPY DENSITY USING LANDSAT 7 ETM+ AND HIGH RESOLUTION IMAGES OVER LARGE AREAS
 A STRATEGY FOR ESTIMATING TREE CANOPY DENSITY USING LANDSAT 7 ETM+ AND HIGH RESOLUTION IMAGES OVER LARGE AREAS Chengquan Huang*, Limin Yang, Bruce Wylie, Collin Homer Raytheon ITSS EROS Data Center, Sioux
2002 URBAN FOREST CANOPY & LAND USE IN PORTLAND S HOLLYWOOD DISTRICT. Final Report. Michael Lackner, B.A. Geography, 2003
 2002 URBAN FOREST CANOPY & LAND USE IN PORTLAND S HOLLYWOOD DISTRICT Final Report by Michael Lackner, B.A. Geography, 2003 February 2004 - page 1 of 17 - TABLE OF CONTENTS Abstract 3 Introduction 4 Study
APPLICATION OF GOOGLE EARTH FOR THE DEVELOPMENT OF BASE MAP IN THE CASE OF GISH ABBAY SEKELA, AMHARA STATE, ETHIOPIA
 APPLICATION OF GOOGLE EARTH FOR THE DEVELOPMENT OF BASE MAP IN THE CASE OF GISH ABBAY SEKELA, AMHARA STATE, ETHIOPIA Abineh Tilahun Department of Geography and environmental studies, Adigrat University,
Some elements of photo. interpretation
 Some elements of photo Shape Size Pattern Color (tone, hue) Texture Shadows Site Association interpretation Olson, C. E., Jr. 1960. Elements of photographic interpretation common to several sensors. Photogrammetric
Closest Spectral Fit for Removing Clouds and Cloud Shadows
 Closest Spectral Fit for Removing Clouds and Cloud Shadows Qingmin Meng, Bruce E. Borders, Chris J. Cieszewski, and Marguerite Madden Abstract Completely cloud-free remotely sensed images are preferred,
How To Map Land Cover In The Midatlantic Region
 ADVANCES IN LAND COVER CLASSIFICATION FOR APPLICATIONS RESEARCH: A CASE STUDY FROM THE MID-ATLANTIC RESAC Dmitry L. Varlyguin, Robb K. Wright, Scott J. Goetz, Stephen D. Prince Mid-Atlantic Regional Earth
Lake Monitoring in Wisconsin using Satellite Remote Sensing
 Lake Monitoring in Wisconsin using Satellite Remote Sensing D. Gurlin and S. Greb Wisconsin Department of Natural Resources 2015 Wisconsin Lakes Partnership Convention April 23 25, 2105 Holiday Inn Convention