ANNUAL REPORT as of 26 March 2015
|
|
|
- Marcus Carter
- 8 years ago
- Views:
Transcription
1 ANNUAL REPORT 2014 as of 26 March 2015

2 HISTORY OF TORM ON 14 JANUARY 2014, TORM CELEBRATES 125 YEARS OF SHIPPING WITH PRIDE. IN 2012, TORM COMPLETES A RESTRUCTURING IN COOPERATION WITH TIME CHARTER OWNERS, LENDERS AND SHAREHOLDERS WITH THE ACQUISITION OF OMI IN 2007, TORM REALIZES THE GREATEST FLEET INCREASE IN TORM S RECENT HISTORY IN THE EARLY 1990S, TORM MAKES SHIPPING HISTORY WHEN IT ESTABLISHES A POOL PARTNER COLLABORATION TORM S FIRST DOUBLE-HULL TANKERS ARE DELIVERED, AND WASTE WATER TREATMENT SYSTEMS ARE INSTALLED ON THE OLDER VESSELS MERGERS AND EFFICIENCY IMPROVEMENTS HELP STREAMLINING OPERATIONS. IN 1974, TORM MERG- ES WITH THE STEAMSHIP COMPANY BORNHOLM OF A NUMBER OF THE OLDER SHIPS ARE SOLD OFF. TORM TAKES DELIVERY OF ITS FIRST PRODUCT TANKER DESIGN AND ENGINEERING DEVELOPMENTS IN THE SHIPBUILDING INDUSTRY MEAN BETTER CONDITIONS FOR TORM S CREW MEMBERS. THE TORM FLEET CONTINUES TO INCREASE THE POST-WAR PERIOD WAS A PERI- OD OF GROWTH AND CONSOLIDATION. GUNHILD TORM, DENMARK S LARGEST DRY BULK CARRIER AT THAT TIME, JOINS THE FLEET DURING WORLD WAR II, TORM LOSES SEVERAL VESSELS AND EMPLOYEES. HOWEVER, TORM RECOVERS AND INCREASES THE NUMBER OF SAILING ROUTES. THE COMPANY ESTABLISHES WHAT TODAY IS KNOWN AS THE TORM FOUNDATION TORM EXPANDS OPERATIONS AND TAKES DELIVERY OF ITS FIRST MOTORIZED VESSEL THE COMPANY CARRIES ITS FIRST CARGO OF FRUIT FROM THE MIDDLE EAST TO ENGLAND AND ORDERS ITS FIRST REFRIGERATED VESSEL TORM CONTINUES TO EXPAND ITS SHIPPING OPERATIONS. TORM VESSELS BEGIN TO SAIL INTERNATIONAL VOYAGES THE COMPANY GROWS RAPIDLY. TORM IS LISTED ON THE COPENHAGEN STOCK EXCHANGE IN 1889, TORM IS FOUNDED BY CAPTAIN DITLEV E. TORM AND CHRISTIAN SCHMIEGELOW. THE TORM FLEET GROWS TO FOUR VESSELS DURING THE FIRST TEN YEARS

3 3 CONTENTS INTRODUCTION 4 PEOPLE 20 TANKER SEGMENT 12 FINANCIAL REVIEW 38 HIGHLIGHTS Introduction 4 Five-year key figures highlights 7 Outlook One TORM - a world-class operational platform 11 ABOUT TORM TORM s 125 th anniversary 18 People 20 Corporate Social Responsibility 22 Risk management 25 Corporate governance 28 Board of Directors 31 Executive Management and Chief Financial Officer 32 Investor information 33 SEGMENTS Tanker Segment 12 Tanker Segment supply and demand 14 Bulk Segment 16 FINANCIAL STATEMENTS Financial review 38 Consolidated income statement 44 Consolidated statement of comprehensive income 45 Consolidated balance sheet 46 Consolidated statement of changes in equity 48 Consolidated cash flow statement 49 Notes 50 Statement by Management 80 Independent auditor s report 81 Parent Company 83 Fleet overview 96 Glossary 98 TORM A/S Tuborg Havnevej 18 DK-2900 Hellerup Denmark Tel.: Founded: 1889 CVR:

4 4 Highlights INTRODUCTION TORM has been sailing the world seas since 1889, and in January 2014, the Company hosted the first reception to celebrate and commemorate 125 years of TORM history. Such a long history is both a source of motivation and a great asset for TORM in the daily business. It has been a privilege and a unique occasion to mark the anniversary at different customer events throughout Furthermore, TORM paid tribute to the Company s approx. 3,000 employees worldwide at sea and ashore as well as the many customers, investors, authorities and many others who have influenced the development of TORM through the years PERFORMANCE In 2014, TORM s product tanker fleet realized average spot TCE earnings of USD/day 15,968 or up 6% year-on-year driven by a strong market towards the end of the year. The overall operational result (EBITDA) was positive with USD 77m, which is a decline of USD 19m and mainly driven by 12,187 fewer earning days. The unsatisfactory loss before tax of USD 283m (2013: USD -166m) included impairment charges of USD 192m related to vessel sales (USD 60m). In the first part of 2014, the product tanker freight rates were under pressure especially from low European demand, limited arbitrage trades and lower ton-mile on US exports. The second part of the year saw a market recovery initially in the LR segment, which later spilled over into the other segments leading to the highest freight rates obtained since The main drivers were open arbitrage trades, new refinery capacity in the Middle East and lower oil prices. During 2014, TORM remained focused on optimizing the fully integrated operational platform to ensure flexible commercial trading and a higher contribution margin. TORM was well- positioned to take advantage of the stronger market towards the end of the year and leveraged the Company s strong operational platform to perform well against the commercial benchmarks. In 2014, the dry bulk freight rates continued to be under pressure and were at historically low levels according to the Baltic Dry Index. TORM has for a period maintained a cautious view on the dry bulk markets in the short to medium term, and the Company has previously decided to focus all available resources on its scale and operational platform in the product tanker segment. Consequently, since the summer of 2013, TORM has minimized market risk by redelivering bulk vessels and maintaining a relatively high coverage. During 2014, TORM continued to scale down its bulk activities. TORM has therefore only been operating the existing core bulk fleet of approx. eight vessels on time charter contracts. This has resulted in TORM delivering TCE levels significantly above the prevailing spot market in With the One TORM framework in place, TORM s organization has continued to drive performance improvements, i.e. forging closer customer relations, reaping continuous quality improvements, maintaining the highest safety, environment and CSR standards, while delivering costefficient operations. In 2014, TORM s cost program delivered savings of USD 44m mainly related to fuel, administration and CAPEX, whereas OPEX trended up. This means that TORM has generated savings of USD 99m between 2012 and 2014, which is in line with the target communicated in CAPITAL LOSS IN MARCH 2014 As part of the Restructuring Agreement from November 2012, three banks were granted certain specific option rights until July 2014 that could trigger a sales process for up to 22 vessels and repayment of the related debt. In March 2014, the third bank exercised its option rights leading to the sale of ten MR and three LR2 product tankers financed by this bank facility. Consequently, TORM concluded an agreement to sell the product tankers to entities controlled by Oaktree Capital Management (Oaktree), whereby the 13 vessels remained under TORM s commercial management and utilized TORM s integrated operating platform for technical management. Following this transaction, the associated vessel financing was fully repaid, thereby reducing the Company s debt by USD 223m. This transaction also led to an impairment charge of USD 192m that resulted in negative equity on TORM s balance sheet. When a company recognizes a capital loss, the Board of Directors has an obligation to test whether the justification for the company s operations as a going concern is sufficiently solid, while the possibilities for a recapitalization is investigated and implemented. TORM s Board of Directors assessed that it has been and remains completely justifiable to continue TORM s operations in an intermediate period whilst finalizing the ongoing restructuring efforts. RESTRUCTURING On 27 October 2014, TORM entered into an agreement with a group of its lenders, representing 61% of TORM s ship financing, and Oaktree regarding a financial restructuring. The parties have substantially reached an agreement that will secure the lender support to implement a restructuring. The terms are set out in a New Restructuring Agreement (cf. company announcement no. 4 dated 26 March 2015). The restructuring will include that the lenders will initially write down the debt to the current asset values in exchange for warrants. In addition, they may choose to convert part of the remaining debt into new equity in the Company. Oaktree will contribute product tankers in exchange for a controlling equity stake in the combined

5 Highlights 5 Chairman of the Board, Flemming Ipsen (right), and CEO of TORM, Jacob Meldgaard (left). Company, which will strengthen TORM s position as one of the largest product tanker owners. The agreement envisages a new Working Capital Facility of USD 75m as a replacement of the current Facility. It is anticipated that existing shareholders would retain approximately 0.8% of the ordinary share capital. No later than 23 April 2015, TORM expects to have reached the minimum required lender support (75% by value and 50% by number) to be able to implement the proposed agreement NEW HORIZONS Already now, it is clear that 2015 will be a significant period in the Company s history where the organization will continue the work on three important dimensions. First, TORM has entered into the above-mentioned agreement with its lenders and Oaktree regarding a financial restructuring of the Company, which will secure the future, long-term capital structure. This will give TORM financial and strategic agility to navigate towards new horizons. Secondly, TORM has taken a cautious view on the dry bulk markets, and the decision to scale down the bulk activities has proven correct. In 2015, TORM will continue the orientation towards being a pure product tanker company, as this segment offers a promising market outlook. Thirdly, TORM will continue to optimize the Company s operational performance through the framework called One TORM. The overall objective is to operationally position TORM as the reference company in the product tanker industry, and the framework serves as a scoreboard to measure progress on a number of key performance indicators. In 2015, TORM will remain focused on delivering industry-leading results via a number of measures designed to support the strong integrated commercial and technical platform. We are convinced that superior operational results and a new capital structure will serve as the long-term foundation for TORM. TORM would like to thank all stakeholders for their continued support. Jacob Meldgaard, CEO Flemming Ipsen, Chairman of the Board
 to be able to implement the proposed agreement.")
6 6 Highlights FIVE-YEAR KEY FIGURES INCOME STATEMENT (USDm) Revenue ,121 1, Time charter equivalent earnings (TCE) Gross profit EBITDA Operating profit/(loss) (EBIT) Financial items Profit/(loss) before tax Net profit/(loss) for the year Net profit/(loss) for the year excl. impairment charges and restructuring costs BALANCE SHEET (USDm) Non-current assets 1,231 1,712 1,971 2,410 2,984 Total assets 1,384 2,008 2,355 2,779 3,286 Equity ,115 Total liabilities 1,548 1,890 2,088 2,135 2,171 Invested capital 1,219 1,823 2,128 2,425 2,987 Net interest-bearing debt 1,394 1,718 1,868 1,787 1,875 Cash and cash equivalents CASH FLOW (USDm) From operating activities From investing activities, thereof investment in tangible fixed assets From financing activities Total net cash flow KEY FINANCIAL FIGURES*) Gross margins: TCE 52.2% 44.7% 41.5% 49.4% 65.5% Gross profit 19.7% 15.2% -8.3% 6.2% 21.0% EBITDA 12.3% 9.7% -17.3% -3.4% 11.3% Operating profit -33.8% -9.1% -40.0% -29.8% -9.3% Return on Equity (RoE) % % -51.5% -11.4% Return on Invested Capital (RoIC) **) -13.9% -4.6% -19.7% -14.4% -2.7% Equity ratio -11.8% 5.9% 11.4% 23.2% 33.9% Exchange rate DKK/USD, end of period Exchange rate DKK/USD, average SHARE-RELATED KEY FIGURES*) Earnings/(loss) per share, EPS (USD) Diluted earnings/(loss) per share, EPS (USD) Cash flow per share, CFPS (USD) Share price in DKK, end of period (per share of DKK 0.01 each) ***) Number of shares, end of period (million) Number of shares (excl. treasury shares), average (million) *) Key figures are calculated in accordance with recommendations from the Danish Society of Financial Analysts. **) Return on Invested Capital is defined as: Operating profit divided by average Invested capital, defined as average of beginning and ending balances of (equity plus Net interest bearing debt less Non-operating assets). ***) : Per share of DKK 5.00 each.
 Non-current assets 1,231 1,712 1,971 2,410 2,984 Total assets 1,384 2,008 2,355 2,779 3,286 Equity -164 118 267")
7 Highlights HIGHLIGHTS In the fourth quarter of 2014, the product tanker freight rates reached the highest level since 2008 and the positive market sentiments have continued in TORM s integrated platform has managed to take advantage of the stronger market, says CEO Jacob Meldgaard. In 2014, the Company realized a positive EBITDA of USD 77m (USD 96m) and a loss before tax of USD 283m (USD -166m). The performance is in line with the revised forecasts of 6 November The result before tax was negatively affected by special items of USD 192m (USD -60m). In the first part of 2014, the product tanker freight rates were under pressure especially from low European demand, limited arbitrage trades and lower ton-mile on US exports. The second half of the year saw a market recovery initially in the LR segment, which later spilled over into the other segments leading to the highest freight rates experienced since The main drivers were open arbitrage trades, new refinery capacity in the Middle East and lower oil prices. In 2014, TORM s largest segment, MRs, achieved spot rates of USD/day 15,224 (USD/day 15,914). The gross profit for the Tanker Division was USD 123m (USD 172m), which was a decline of USD 49m year-on-year primarily caused by 22% fewer earning days and higher OPEX. In 2014, the dry bulk freight rates continued to be under pressure and were at historically low levels. TORM had expected a soft market and taken time charter coverage, which means that the Company s largest segment, Panamax, achieved TCE earnings of USD/day 10,477 (USD/day 8,019) despite the weak spot market that averaged USD/day 7,800. The gross profit for the bulk activities was USD 0m (USD -22m), despite the historically low freight rates. During 2014, TORM continued to scale down its bulk activities to operating the existing core fleet of approx. eight vessels, which are on time charter contracts. In March 2014, one bank exercised its option rights leading to the sale of ten MR and three LR2 product tankers financed by this bank. Consequently, TORM concluded an agreement to sell these product tankers to entities controlled by Oaktree Capital Management, whereby the 13 vessels remained under TORM s commercial management and utilized TORM s integrated operating platform for technical management. Following this transaction, the associated vessel financing was fully repaid, thereby reducing the Company s debt by USD 223m. This transaction also led to an impairment charge of USD 192m that resulted in negative equity on TORM s balance sheet. On 27 October 2014, TORM entered into an agreement with a group of its lenders, representing 61% of TORM s ship financing, and Oaktree regarding a financial restructuring. The parties have substantially reached an agreement that will secure the lender support to implement a restructuring. The terms are set out in a New Restructuring Agreement (cf. company announcement no. 4 dated 26 March 2015). The restructuring will include that the lenders will initially write down the debt to the current asset values in exchange for warrants. In addition, they may choose to convert part of the remaining debt into new equity in the Company. Oaktree will contribute product tankers in exchange for a controlling equity stake in the combined Company. No later than 23 April 2015, TORM expects to have reached the minimum required lender support (75% by value and 50% by number) to be able to implement the proposed agreement. The final implementation of a restructuring would be subject to shareholder approval by means of authorizations at the Annual General Meeting on 26 March 2015 and certain conditions precedent, including required approvals from public authorities. The Company s continuing operation is dependent on the outcome of the ongoing recapitalization process. As of 31 December 2014, TORM s available liquidity was USD 65m consisting of USD 45m in cash and USD 20m in undrawn credit facilities. There are no newbuildings on order or CAPEX commitments related hereto. The book value of the fleet was USD 1,215m as of 31 December Based on broker valuations, TORM s fleet had a market value of USD 859m as of 31 December In accordance with IFRS, TORM estimates the product tanker fleet s total long-term earning potential each quarter based on discounted future cash flow. The estimated value of the fleet as of 31 December 2014 supports the carrying amount. As of 31 December 2014, net interest-bearing debt amounted to USD 1,394m (USD 1,718m). TORM s equity is negative at USD 164m as of 31 December 2014 (positive at USD 118m). As of 31 December 2014, 4% of the total earning days in the Tanker Division for 2015 were covered at a rate of USD/day 23,140 and 64% of the total earning days for the bulk activities at USD/day 8,454. The financial results for 2015 are subject to considerable uncertainty related to the completion of the proposed Restructuring Agreement. Consequently, TORM has decided not to provide earnings guidance for The Board of Directors proposes that no dividend be distributed for 2014.
.")
8 8 Highlights OUTLOOK 2015 EARNINGS AND COVERAGE FOR 2015 The financial results for 2015 are subject to considerable uncertainty related to the completion of the proposed Restructuring Agreement. Consequently, TORM has decided not to provide earnings guidance for As 16,669 earning days are uncovered at year-end 2014, a change in freight rates of USD/day 1,000 would impact the financial results by USD 17m. As of 31 December 2014, the Tanker Division had covered 4% of the total earning days in 2015 at an average rate of USD/day 23,140 (8% at an average rate of USD/day 14,908 in 2013). As of 31 December 2014, the bulk activities had covered 64% of the total earning days in 2015 at an average rate of USD/day 8,454 (56% at an average rate of USD/day 11,350 in 2013). The table on this page shows the effect of variations in freight rates for product tankers and bulk carriers on the EBITDA result and the result before tax for The most important factors affecting TORM s earnings in 2015 are: Global economic growth Consumption of refined oil products Oil trading activity and developments in ton-mile Bunker price developments Fleet growth from addition of vessels, scrapping of vessels and delays to deliveries from the order book One-off market shaping events such as strikes, embargoes, political instability, weather conditions, etc. Potential difficulties of major business partners TORM s profile as a counterpart OUTLOOK FOR THE TANKER SEGMENT The product tanker market is expected to see a gradually improving supply and demand balance. Going forward, TORM expects increasing oil consumption and increased ton-mile effects from relocation of refinery capacity to have a positive effect on the demand for product tankers. The product tanker ton-mile demand is estimated to grow by a compound annual rate of 6% during , exceeding the estimated net growth in tonnage supply of approximately 5% and subsequently contributing to a positive development in the product tanker fleet utilization during that period. Going forward, the freight rates are expected to be gradually improving although volatility is still anticipated. TORM does not publish its freight rate forecast, but instead provides market expectations as of 23 February 2015 on page 10. OUTLOOK FOR THE BULK SEGMENT TORM maintains a cautious view on the dry bulk markets for the coming period. Consequently, since the summer of 2013, the Company has minimized market risk by redelivering bulk vessels and maintaining a relatively high coverage of 64% for 2015 from T/C activity. TORM will continue to scale down the Company s bulk activities in PROFIT SENSITIVITY TO CHANGES IN FREIGHT RATES Change in freight rates (USD/day) USDm -2,000-1,000 1,000 2,000 LR LR MR Handysize Tanker Segment Panamax Handymax Bulk Segment Total
.")
9 Highlights 9 COVERED AND CHARTERED-IN DAYS IN TORM DATA AS OF 31 DECEMBER Owned days LR2 1,782 1,815 1,825 LR1 2,510 2,546 2,555 MR 7,077 7,155 7,186 Handysize 3,797 3,960 4,015 Tanker Division 15,166 15,476 15,581 Panamax Handymax Bulk activities Total 15,892 16,204 16,311 T/C-in days at fixed rate T/C-in costs, USD/day LR LR MR ,697 16,000 - Handysize Tanker Division ,697 16,000 - Panamax 1, ,458 11,000 11,000 Handymax Bulk activities 1, ,458 11,000 11,000 Total 1, ,678 11,600 11,000 T/C-in days at floating rate LR LR MR Handysize Tanker Division Panamax Handymax Bulk activities Total Total physical days Total covered days LR2 2,509 2,499 2, LR1 2,510 2,546 2, MR 7,829 7,259 7, Handysize 3,797 3,960 4, Tanker Division 16,644 16,263 16, Panamax 1,971 1,488 1,460 1, Handymax Bulk activities 2,011 1,501 1,460 1, Total 18,656 17,764 17,771 1, Covered, % Coverage rates, USD/day LR2 5% , LR1 3% , MR 2% , Handysize 8% , Tanker Division 4% , Panamax 65% - - 8, Handymax Bulk activities 64% - - 8, Total 11% , Fair value of freight rate contracts that are mark-to-market in the income statement: Contracts not included above USD -1.6m, contracts included above USD -0.1m. Notes: Actual no. of days can vary from projected no. of days primarily due to vessel sales and delays of vessel deliveries. T/C-in days at fixed rate do not include effects from profit split arrangements. T/C-in days at floating rate determine rates at the entry of each half year, and then TORM will recieve approx. 10% profit/loss compared to this rate.

10 10 Highlights TCE RATES IN THE FORWARD CONTRACT MARKET FOR THE PRODUCT TANKER AND THE BULK SEGMENTS AS OF 23 FEBRUARY USD/day realized Q2 Q3 Q4 Product tankers LR2 15, LR1 17,556 18,300 19,200 19,300 MR 14,697 16,500 15,500 18,300 Handysize 15, Dry bulk vessels Panamax 10,477 6,850 6,800 7,875 Handymax 12,748 5,825 5,825 6,300 Bulk based on SSY Dry FFA Report LR is based on T/C5 roundtrip, MR is based on mix of West, T/C14+T/C2 and East, modified T/C12 SAFE HARBOR STATEMENTS AS TO THE FUTURE Matters discussed in this release may constitute forwardlooking statements. Forward-looking statements reflect our current views with respect to future events and financial performance and may include statements concerning plans, objectives, goals, strategies, future events or performance, and underlying assumptions and statements other than statements of historical facts. The Company desires to take advantage of the safe harbor provisions of the Private Securities Litigation Reform Act of 1995 and is including this cautionary statement in connection with this safe harbor legislation. The words believe, anticipate, intend, estimate, forecast, project, plan, potential, may, should, expect, pending and similar expressions identify forward-looking statements. Forward-looking statements in this company announcement reflect our current views with respect to future events and financial performance and may include statements concerning plans, objectives, goals, strategies, future events or performance, and underlying assumptions and statements other than statements of historical facts. The forward-looking statements in this release are based upon various assumptions, many of which are based, in turn, upon further assumptions, including without limitation, management s examination of historical operating trends, data contained in our records and other data available from third parties. Although the Company believes that these assumptions were reasonable when made, because these assumptions are inherently subject to significant uncertainties and contingencies which are difficult or impossible to predict and are beyond our control, the Company cannot guarantee that it will achieve or accomplish these expectations, beliefs or projections. Important factors that, in our view, could cause actual results to differ materially from those discussed in the forward- looking statements include the strength of the world economy and currencies, changes in charter hire rates and vessel values, changes in demand for tonne miles of oil carried by oil tankers, the effect of changes in OPEC s petroleum production levels and worldwide oil consumption and storage, changes in demand that may affect attitudes of time charterers to scheduled and unscheduled dry-docking, changes in TORM s operating expenses, including bunker prices, dry-docking and insurance costs, changes in the regulation of shipping operations, including requirements for double hull tankers or actions taken by regulatory authorities, potential liability from pending or future litigation, domestic and international political conditions, potential disruption of shipping routes due to accidents and political events or acts by terrorists. Forward-looking statements are based on management s current evaluation, and TORM is only under an obligation to update and change the listed expectations to the extent required by law.

11 Highlights 11 ONE TORM A WORLD-CLASS OPERATIONAL PLATFORM TORM will be a pure product tanker company The product tanker fleet is spot-oriented One TORM platform integrates commercial and technical management Long-term capital structure addressed CAPITAL STRUCTURE TORM has for a number of years been operating under the constraints of an inadequate capital structure. On 27 October 2014, TORM entered into an agreement with a group of its lenders, representing 61% of TORM s ship financing, and Oaktree regarding a financial restructuring. The parties have substantially reached an agreement that will secure the lender support to implement a restructuring on terms to be set out in a New Restructuring Agreement (cf. company announcement no. 4 dated 26 March 2015). The restructuring will include that the lenders will initially write down the debt to the current asset values in exchange for warrants. In addition, they may choose to convert part of the remaining debt into new equity in the Company. Oaktree will contribute product tankers in exchange for a controlling equity stake in the combined Company, which will reinforce TORM s position as one of the largest product tanker owners. The agreement also envisages a new Working Capital Facility of USD 75m as a replacement of the current Facility. The final implementation of a restructuring would be subject to shareholder approval by means of authorizations at the Annual General Meeting on 26 March 2015 and certain conditions precedent, including required approvals from public authorities. ONE TORM Since the beginning of 2013, TORM has pursued a framework for TORM s operational performance which focuses on four common goals named One TORM: Acting responsibly to maintain the highest safety, environment and CSR standards Putting customers first and thereby enabling TORM to outperform available earnings benchmarks Ensuring quality in everything, e.g. by improving technical and commercial tradability and delivering optimized processes across the entire value chain Operating in a cost-efficient manner to deliver a competitive cost base The overall objective is to operationally position TORM as the reference company in the product tanker industry, and the framework serves as a scoreboard to measure progress on a number of key performance indicators (KPIs). These KPIs are cascaded in the organization and have enabled the employees to deliver noticeable improvements on for instance: Product tanker spot rates significantly above available benchmarks Record-high oil major approval rate also called tradability above 97.5% Highest safety standards Savings from cost program of USD 99m for the period administrative expenses reduced by 10% year-on-year PRODUCT TANKER SEGMENT TORM s business model in this segment centers on continued presence in the spot market. This will allow the Company to take advantage of the anticipated volatility and the stronger market fundamentals observed especially towards the end of In the short term, TORM will not seek to increase the current cover level, as the Company is of the opinion that there is an upside potential in the market. However, TORM will seek to take coverage if market conditions provide sufficiently attractive rate levels. As of 31 December 2014, TORM owned 43 product tankers. In addition, TORM had chartered-in seven product tankers and had 22 product tankers under commercial management. BULK SEGMENT TORM continues to have a cautious view on the dry bulk markets for the coming period. Therefore, the Company will minimize market risk by redelivering vessels and maintaining a high coverage for 2015, primarily from period activity. Since the summer of 2013, TORM has gradually scaled down the Company s bulk activities. TORM has decided to focus all available resources on its scale and operational platform in the product tanker segment. As of 31 December 2014, TORM s bulk fleet counted two owned vessels and five time charter vessels with expiry over the coming years.

12 12 Segments TANKER SEGMENT Strong freight rates in the second half of 2014 TORM outperforms commercial benchmarks Simplification of the Company s One TORM platform In the first part of 2014, the product tanker freight rates were under pressure especially from low European demand, limited arbitrage trades and lower ton-mile on US exports. The second part of the year saw a market recovery in the LR segment, which spilled over into the other segments leading to the highest freight rates experienced since The main drivers were open arbitrage trades, new refinery capacity in the Middle East and lower oil prices. In 2014, TORM s largest segment, MRs, achieved spot rates of USD/day 15,224 (USD/day 15,914). The gross profit for the Tanker Division was USD 123m (USD 172m), which was a decline of USD 49m year-on-year primarily caused by 22% fewer earning days and higher OPEX. The first quarter of the year is usually a strong period for product tankers. However, in the West, the MR activity was negatively impacted by the cold weather in the US, resulting in increased domestic demand for heating oil and reduced export of diesel. The mild weather in Europe caused the reverse situation with reduced demand for heating oil, less imports and subsequently reduced activity levels. In the East, the LR market was negatively impacted by the middle distillate arbitrage to Europe being closed for long periods. In the second quarter of 2014, the product tanker market saw increased US export volumes, but this was partly offset by shorter transportation distances. The MR freight rates were negatively impacted by shorter ton-mile effect especially in the West. The LR vessels captured a larger part of the export market to West Africa and Europe, which had a positive impact on LR1 freight rates. Nevertheless, the LR market was negatively impacted by continued tonnage overhang and the fact that the naphtha arbitrage from Europe to the Far East was closed for long periods. The pressure on LR freight rates spilled over into the MRs in the East. During the third quarter of 2014, the product tanker market showed signs of recovery for the LRs. In the West, the freight rates were negatively impacted by weak demand in Europe and refinery maintenance in the US. The Atlantic Basin experienced an oversupply of tonnage and freight rates remained subdued for most of the quarter. In the East, especially the LR freight rates in the Arabian Gulf improved as a result of increased demand in general and for naphtha in particular as well as new refinery capacity coming on stream. The MR freight rates followed suit in the North East and in the Middle East. The fourth quarter of the year is usually a strong period for product tankers, and the market continued to strengthen due to the opening of several long-haul arbitrage trades. A significant decrease in oil prices resulted in lower bunker TANKER FREIGHT RATES 2014 Source: Clarksons ASSET PRICES ON FIVE-YEAR-OLD SECOND-HAND PRODUCT TANKERS IN 2014 Source: Clarksons USD/day 40,000 35,000 30,000 25,000 20,000 15,000 10,000 USDm ,000 0 Jan Feb Mar Apr May Jun Jul Aug Sep Oct Nov Dec Ras Tanura Chiba Clean 75K Average Earnings - LR2 Ras Tanura Chiba Clean 55K Average Earnings - LR1 Rotterdam New York Clean 37K Average Earnings - MR 10 0 Jan Feb Mar Apr May Jun Jul Aug Sep Oct Nov Dec LR2 LR1 MR Handysize

13 Divisions 13 LR1 product tanker TORM Estrid at Proevestenen in Denmark discharging vacuum gasoil. costs, increased oil demand and stock building. In the West, a decrease in the price for light distillates opened up further arbitrage in the Atlantic Basin. Unplanned maintenance of South American refineries led to increased import demand and ton-mile. In the East, the earnings for the LRs peaked in November due to continued strong demand and LR2 congestion. The difference between earnings in the East and the West became significant in the fourth quarter. In December 2014, the product tanker market reached the highest level since 2008 (source: Clarksons). In the volatile market, TORM s Tanker Division outperformed commercial spot benchmarks by 47% for MRs and 17% for LR1s, whereas TORM s LR2 spot rates were 8% below spot benchmarks (source: Clarksons). Houston, Texas, is increasingly becoming a hub for shipping customers in the US, and therefore TORM relocated its office from Stamford to Houston in order to be closer to the customers. During the year, TORM focused on optimizing processes and simplifying the One TORM platform. Furthermore, TORM and Maersk Tankers dissolved the LR2 Pool cooperation which enabled TORM to take full strategic and commercial control of the Company s LR2 vessels. This is a further step towards simplifying the set-up of the One TORM platform. Going forward, TORM will cross-sell all vessel segments and offer customers a full range of services from the four product tanker segments. During 2014, TORM entered into an agreement to sell a total of 13 product tankers, ten MRs and three LR2s, to entities owned by Oaktree. According to the agreement, all 13 vessels will remain with TORM for commercial and technical management. At year-end, TORM operated a total of 72 product tankers, of which 43 are owned, seven are chartered-in and 22 are under commercial management. There were no newbuildings on order. TORM S RESULTS IN THE TANKER SEGMENT USDm Total Q1 Q2 Q3 Q4 Total INCOME STATEMENT Revenue Port expenses, bunkers and commissions Freight and bunker derivatives Time charter equivalent earnings Charter hire Operating expenses Gross profit/(loss) (Net earnings from shipping activities) Impairment losses Operating profit/(loss) (EBIT)

14 14 Segments TANKER SEGMENT SUPPLY AND DEMAND Current order book indicates high number of deliveries in Higher ton-mile demand driven by increased oil consumption and relocation of refineries SUPPLY In 2014, the global product tanker fleet grew by 3.8% in terms of capacity and 3.4% in terms of number of vessels. This was the highest growth since 2011, but the figure covers considerable differences in the individual segments. The growth was ranging from 0.2% for the LR1 segment to 5.8% for MR vessels, and while all other segments have seen an increasing growth trend in recent years, the LR1 segment stands out as growth has stagnated. At the end of 2014, the global product tanker fleet totaled 2,635 vessels, counting 259 LR2 vessels, 328 LR1 vessels, 1,397 MR vessels and 651 Handysize vessels. CURRENT NEWBUILDING ORDER BOOK New contracting in 2014 declined by 56% compared to the 7-year high ordering activity in 2013, yet ordering activity in 2014 was higher than in any of the years It was especially the first quarter which saw a high ordering activity, however, a number of LR1 orders placed in the second half of the year took new ordering in the LR1 segment to a 8-year high. At the end of 2014, the existing order book for deliveries in totaled 459 vessels, including 75 LR2 vessels, 38 LR1 vessels, 236 MR vessels and 110 Handysize vessels. CANCELLATIONS AND POSTPONEMENTS In 2014, only 73% of the deliveries scheduled for the year actually materialized, with the remaining 27% being split between order cancellations (5%) and order delays/ postponements (22%) as of 1 February For 2015, TORM expects a delivery slippage of approximately 20%. SCRAPPING In 2014, almost 1.7m dwt of product tanker capacity was scrapped, corresponding to approx. 1.2% of the fleet capacity at the beginning of the year. Compared to 2013, scrapping activity slowed down, yet remained above the average scrapping level during It is expected that approx. 3% of the existing capacity in the global fleet will be phased out or scrapped during NEW CONTRACTING OF NEWBUILDINGS TORM anticipates limited ordering of new product tankers with delivery before the end of The Company expects the ordering activity in 2015 to be at around the average level, which is considerably lower than what was seen in 2013 and also marks a slowdown from the 2014 level. During , the product tanker fleet capacity is estimated to grow by a compound annual rate of approx. 6%. However, taking expected vessel migration between dirty and clean segments into account, the total product tanker supply available for transportation of clean products is estimated to increase by an annual rate of approx. 5% during the same period. YEARLY NET FLEET GROWTH (BASED ON NO. OF VESSELS) Source: TORM % of existing fleet 20 PRODUCT TANKER UTILIZATION RATE Source: TORM Index 2000 = F 2016F 2015F 2014F 2013E LR2 LR1 MR Handysize Product tanker utilization rate

15 Segments 15 DEMAND Global oil demand growth in 2014 fell short of expectations due to lower-than-expected economic growth in the Eurozone, China and most of the emerging economies. Yet, global macroeconomic momentum is set to gather strength in Consequently, global oil demand is expected to grow by 0.9m barrels/day (1.0%) in 2015 after only 0.6m barrels/ day (0.7%) in 2014 (source: IEA January 2015). Whereas much of the oil demand weakness in 2014 was due to deteriorated demand for gasoil/diesel in the non-oecd countries, this type of demand is anticipated to become the largest contributor to accelerating oil demand in 2015 with a product switch in the bunker fuel market from heavier fuel oil to marine gasoil as one of the key contributors. Nevertheless, there is some upside to the oil demand growth, were the currently low crude oil prices to stay for a longer period. The non-oecd areas, especially China and the Middle East, followed by Africa and Latin America, are expected to drive growth in global oil demand, whereas demand in the OECD economies as a group will continue to slide despite stronger-than-expected demand from the US in REFINERY CAPACITY AND TRANSPORTATION According to TORM estimates, the net global refinery capacity is expected to grow by approximately 4.4m barrels/ day during The majority of the refinery additions are in China and in the Middle East. In the latter region, a significant part of the additional supply is likely to be transported long-haul by product tankers to regions where demand outpaces local refinery capacity or refineries are being closed. Several new condensate splitter capacity projects are underway in the US in 2015 and 2016, helping to absorb the abundant domestic supplies of light tight oil (LTO) and condensates. This will likely lead to increased export capacity of light end products. At the same time, the traditional role of the US as an importer of Europe s excess gasoline continues to decline, as vehicle efficiency gains are anticipated to exceed any potential gains in miles travelled, the latter being a result of improved economic situation and lower gasoline prices. European refiners face increasing competition from new refining capacity on their traditional export markets in Africa and the rest of the Americas, offsetting the gains experienced in the fourth quarter of 2014 from lower crude costs. TORM expects this to lead to further cuts in refinery runs in Europe, if not refinery shutdowns. European diesel imports from Russia, the US Gulf and increasingly from the new refineries in the Middle East will grow, underpinned by increase in demand for ultra-low sulphur diesel as a result of a change in bunker fuel rules in the North Sea Emission Control Area. Despite new refining capacity coming online in South America, the regions import needs remain high, only temporarily disrupted by new regional refinery capacity additions in 2015/2016. Imports to Australia will increase, mainly met by South East Asia and the North Pacific. A sustained demand for naphtha imports in the North Pacific will increasingly be met by supplies from Europe and the US, the latter potentially supported by the expansion of the Panama Canal. Consequently, the product tanker ton-mile demand is estimated to grow by a compound annual rate of around 6% during , exceeding growth in tonnage supply and subsequently contributing to a positive development in the product tanker fleet utilization during that period. SWING FACTORS The main swing factors, that can change this outlook in either negative or positive direction, include the impact of sustained low oil prices on demand and trade patterns, higher-than-expected newbuilding contracting activity, lacking or slower refining industry rationalization in Europe, the level of compliance with the new ECA (Emission Control Area) rules, a total or partial relaxation of the US crude oil export ban, the export strategy of the new Middle East refineries, slower-than-forecast shift in Russia s refining sector s exports between fuel oil and cleaner products as well as uncertainty around China s new refinery projects. Similarly, product price volatility and arbitrage are potential swing factors. Other swing factors affecting the supply of vessels available for transportation of clean products are substitution of tonnage between dirty and clean product transportation and the use of vessels for floating storage purposes as seen in 2009 and With a possible crude market recovery, a larger number of product tankers will likely switch to the dirty segment. Furthermore, slow-steaming is a factor although the effect is likely to be less pronounced the smaller the vessels.

16 16 Segments BULK SEGMENT Financial result in break-even despite freight and charter rates at historically low levels Continued scale-down of TORM s bulk activities Remaining fleet employed on time charter contracts The dry bulk market was at historically low levels during The average spot freight rates in the Panamax segment were approx. 67% below the 10-year historical average (source: Baltic Panamax Index). A declining spot market during the first half of the year led the period market to gradually erode and the second-hand asset market to decline. In line with the general market expectations, the global bulk fleet grew by approx. 4.4% in 2014 net after scrapping. Trade volumes increased by approx. 4.2%, which was less than market expectations and partly explained by slowing demand for coal from China. During the year, the spot freight rates in the Panamax segment varied from USD/day 3,500 to USD/day 14,000 with an average market level of USD/day 7,800, which was 20% below 2013 levels (source: Baltic Panamax Index). The one-year time charter rate for Panamax averaged around USD/day 12,000, which was also approx. 20% above the level for The period market was relatively strong during the first half of 2014, upheld by expectations of a firming forward market, but eventually the depressed spot market led the period market to fall to USD/day 10,000 in the second half of the year. The second-hand market for bulk vessels reversed the positive trend from 2013, and the price for a five-year-old second-hand Panamax bulk carrier declined by almost 20% during the year (source: Clarksons). As previously announced, TORM has continued to scale down the Company s bulk activities, and the remaining fleet will continue to be employed in the long-term period market. BULK FREIGHT RATES 2014 Source: Clarksons ASSET PRICES ON FIVE-YEAR-OLD SECOND-HAND DRY BULK CARRIERS IN 2014 Source: Clarksons TCE in USD/day 18,000 16,000 14,000 12,000 10,000 8,000 6,000 USDm ,000 2, Jan Feb Mar Apr May Jun Jul Aug Sep Oct Nov Dec 10 Jan Feb Mar Apr May Jun Jul Aug Sep Oct Nov Dec Panamax Handymax Panamax Handymax

17 Divisions 17 The bulk vessel TORM Anholt carrying out a discharge operation in Asia. The gross profit for the Company s bulk activities was USD 0m (USD -22) despite freight and charter rates at historically low levels. In the Panamax segment, TORM achieved average earnings of USD/day 10,477, which was 30% higher than in the same period last year and 36% above the average spot market (source: Baltic Panamax Index). The improvement is a result of the Company s high coverage policy. As of 31 December 2014, TORM s active bulk fleet consisted of two owned vessels and five long-term time charter vessels. TORM expects to have approx. 2,000 bulk earning days in 2015 (-33%). There are no bulk vessels on order. TORM S RESULTS IN THE BULK SEGMENT USDm Total Q1 Q2 Q3 Q4 Total INCOME STATEMENT Revenue Port expenses, bunkers and commissions Freight and bunker derivatives Time charter equivalent earnings Charter hire Operating expenses Gross profit/(loss) (Net earnings from shipping activities) Depreciation incl. impairment losses Operating profit/(loss) (EBIT)

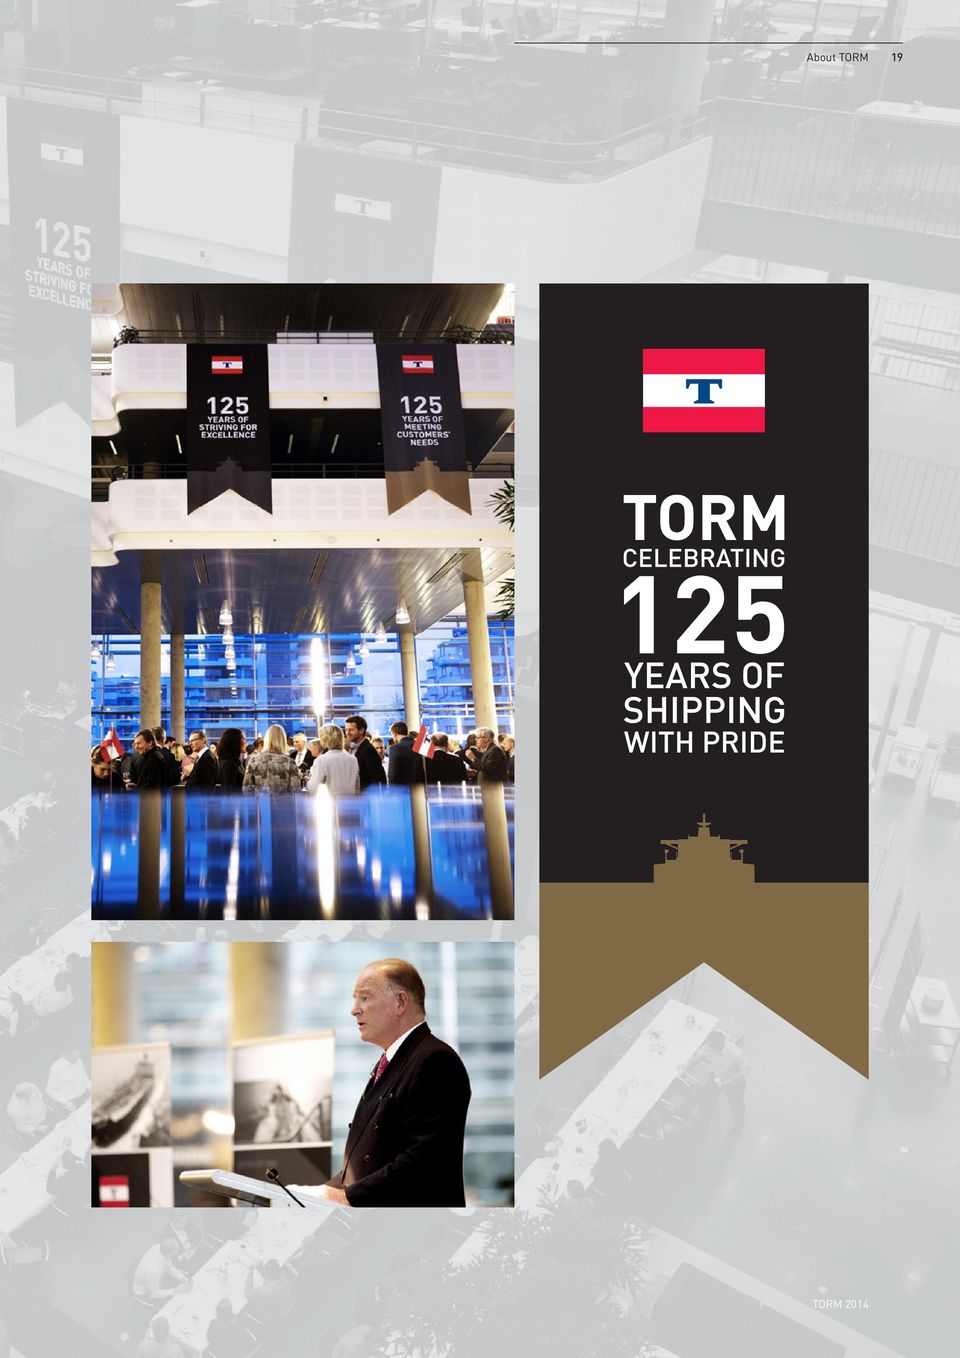
18 18 About TORM TORM S 125 TH ANNIVERSARY On 14 January 1889, Captain Ditlev E. Torm and Christian Schmiegelow founded the Company and later the same year, TORM s first vessel, TORM Alice, was delivered. This year, the Company celebrated its 125 th anniversary. TORM benefits from a strong heritage and many years of embedded know-how. The Company has been shipping with pride throughout the changing times and the cyclical nature of the shipping industry. TORM has celebrated this historical milestone worldwide throughout the year externally with customers and business partners and internally with the Company s employees. During the year, TORM hosted receptions in Singapore, Dubai, Geneva, Houston and London for the Company s customers. At TORM s headquarters in Copenhagen, a reception was held for the Company s external business partners and employees with more than 300 visitors. Furthermore, TORM created a 125 th anniversary film made by the Company s employees. All employees, ashore and at sea, were encouraged to use their smartphones and upload video clips demonstrating what TORM is or means to them. More than 350 video clips were received from all parts of the organization, and these clips were transformed into an anniversary film. On the day of the anniversary, TORM hosted an internal celebration event including the Company s five offices worldwide via a live Skype connection. The anniversary film was released during this event. In close cooperation with the TORM Foundation, the Training Ship DANMARK anchored outside TORM s premises in Tuborg Havn for a special employee event. At sea, the anniversary was celebrated with a get-together on board almost all vessels. The vessels also received a link to the anniversary film showing the spirit of TORM. TORM has achieved remarkable results over the years which have made the Company what it is today one of the world s leading shipping companies within the product tanker segment with a strong integrated operational platform. Pictures from the anniversary reception at TORM s headquarters in Copenhagen on 17 January The reception was held for TORM s external business partners and employees.

19 About TORM 19
20 20 About TORM PEOPLE Employee satisfaction surveys demonstrate dedication and understanding of the One TORM strategic direction Performance Leadership focus in the Technical Division and on board TORM s vessels SEAFARERS The positive commitment and engagement from seafarers continued throughout 2014 with a strong retention level of 99% for Senior Officers and 99% compliance with customer requirements (the so-called officer matrix compliance). Dedication amongst seafarers was also demonstrated in the Company s seafarer survey that is carried out every third year. This year, the survey showed an overall improvement in all four measures (Satisfaction, Engagement, Loyalty and Reputation). In 2014, TORM implemented the TORM Evaluation and Leadership Development Program, which is an assessment program for the Company s Senior Officers. In total, 90 Captains, Chief Engineers, Chief Officers and Second Engineers participated in the program. The purpose is to exemplify how TORM expects Senior Officers to act as leaders on board the Company s vessels and to increase awareness about individual competences. As part of this program, all Senior Officers will have a development plan, which will be followed up regularly. In 2014, TORM continued to focus on integrating the TORM Leadership Philosophy and on increasing awareness and understanding of the One TORM strategic direction. In line with the TORM Leadership Philosophy and One TORM, the Company has introduced the Performance Leadership project in the Technical Division and on board the vessels. This includes a number of KPIs for TORM s vessels and is divided into six overall areas: Energy efficiency, reliability, cost, operations, safety and tradability. Each KPI area has a number of directly related action points for the vessels. Furthermore, TORM has developed a global cadet program to ensure alignment and quality in the way the Company recruits and develops cadets. Performance was also an important topic on the four officers seminars which were conducted in Denmark, Croatia, India and the Philippines during SHORE ORGANIZATION In 2014, TORM continued to focus on employee performance which is a central part of the One TORM strategic direction. In the beginning of the year, TORM s Senior Management hosted workshops for all employees, where the objectives of all departments were shared and linked to the One TORM framework in order to create transparency around the overall objectives of the Company. TORM conducts an annual employee satisfaction survey for all land-based employees. In 2014, 95% of the employees participated in the survey that included One TORM as one of the focus areas. The results demonstrated that TORM s employees have a high level of understanding of One TORM and know how they can contribute to the strategic direction of the Company. TORM experienced a satisfactory employee retention rate for 2014 of 84%. Retaining motivated employees is central to the Company s continued ability to deliver to customers. When it comes to attraction and recruitment of new employees, TORM has also received a satisfactory number of qualified applications to the vacant positions during the year. GEOGRAPHICAL DISTRIBUTION OF SEAFARES IN % 100% = 2,729 seafarers ultimo 2014 incl. contracted crew GEOGRAPHICAL DISTRIBUTION OF LAND-BASED EMPLOYEES IN % 100% = 278 employees ultimo % Croatia 1% Poland 6% Denmark 11% The Philippines 5% Singapore 3% USA 49% The Philippines 52% Denmark 39% India 29% India
.")
Second quarter report 2014
 Second quarter report 2014 In the second quarter of 2014, TORM has continued to deliver competitive results and positive cash flow from operations after full interest payment even though the product tanker
Product tanker Industry - First Quarter
 First quarter report 2015 The combination of lower oil prices and wider refinery margins boosted the demand for transportation of refined oil products in the first quarter of 2015, says CEO Jacob Meldgaard
1. TORM s financial results for 2014 and the Company s financial position
 In connection with TORM A/S Annual General Meeting today, the Board of Directors report is hereby made public. Contact TORM A/S Flemming Ipsen, Chairman, tel.: +45 3917 9200 Jacob Meldgaard, CEO, tel.:
TORM signs restructuring agreement with its banks and time charter partners
 The restructuring agreement secures TORM substantial deferral of bank debt, new liquidity and savings from the restructured time charter book. This will enable TORM to become cash flow positive even at
FRONTLINE LTD. INTERIM REPORT JULY - SEPTEMBER 2005. Highlights
 FRONTLINE LTD. INTERIM REPORT JULY - SEPTEMBER Highlights Frontline reports net income of $73.8 million and earnings per share of $0.99 for the third quarter of. Frontline reports nine month results of
NORDEN RESULTS. 1 st quarter of 2013. Hellerup, Denmark 15 May 2013. Our business is global tramp shipping. NORDEN 1st quarter of 2013 results 1
 NORDEN RESULTS 1 st quarter of 2013 Hellerup, Denmark 15 May 2013 NORDEN 1st quarter of 2013 results 1 AGENDA Group highlights Financial highlights Market update Full year financial guidance Q & A NORDEN
Tuborg Havnevej 18 DK-2900 Hellerup, Denmark Tel.: +45 3917 9200 / Fax: +45 3917 9393 www.torm.com
 TORM A/S Notice and complete proposals for an Extraordinary General Meeting on 7 July 2015 which replaces the Extraordinary General Meeting on 29 June 2015 Enclosed please find the notice of and the complete
TORM A/S Notice and complete proposals for an Extraordinary General Meeting on 29 June 2015
 TORM A/S Notice and complete proposals for an Extraordinary General Meeting on 29 June 2015 Enclosed please find the notice of and the complete proposals for an Extraordinary General Meeting of TORM A/S
Nordic American Tanker Shipping Ltd. (NAT) (NYSE: NAT) Announces 3 rd quarter 2005 Results
 (NYSE: NAT) Announces 3 rd quarter 2005 Results") Nordic American Tanker Shipping Ltd. (NAT) (NYSE: NAT) Announces 3 rd quarter Results Hamilton, Bermuda, October 10 th, Nordic American Tanker Shipping Ltd (the Company ) today announced its result for
Nordic American Tanker Shipping Ltd. (NAT) (NYSE: NAT) Announces 3 rd quarter Results Hamilton, Bermuda, October 10 th, Nordic American Tanker Shipping Ltd (the Company ) today announced its result for
NORDIC SHIPHOLDING. Interim Report H1 2015. 26 August 2015 CVR-no. 76 35 17 16
 NORDIC SHIPHOLDING Interim Report H1 2015 26 August 2015 CVR-no. 76 35 17 16 Summary The comparison figures for period ended 30 June 2014 are stated in parenthesis. The Group generated a profit before
Navig8 Product Tankers Inc. Reports Results for the Three and Nine Months Ended September 30, 2015
 NOT FOR DISTRIBUTION OR RELEASE, DIRECTLY OR INDIRECTLY, IN OR TO U.S. NEWS WIRE SERVICES OR FOR DISSEMINATION IN OR INTO THE UNITED STATES (INCLUDING ITS TERRITORIES AND THE DISTRICT OF COLUMBIA) OR ANY
Earnings Conference Call Second Quarter & 6 Months Ended June 30, 2015
 Earnings Conference Call Second Quarter & 6 Months Ended June 30, 2015 Forward Looking Statements This presentation contains certain statements that may be deemed to be forward-looking statements within
Earnings Conference Call First Quarter Ended March 31, 2015
 Earnings Conference Call First Quarter Ended March 31, 2015 Forward Looking Statements This presentation contains certain statements that may be deemed to be forward-looking statements within the meaning
Interim financial report for the period 1 January to 30 September 2011
 Company announcement no. 11/ 18 November Page 1 of 9 Interim financial report for the period 1 January to 30 September Highlights Results improved in the third quarter with a gross profit of USD 8 million
Reports Results for First Quarter 2007 and Declares Quarterly Dividend
 Ship Finance International Limited (NYSE: SFL) Reports Results for First Quarter and Declares Quarterly Dividend Ship Finance International Limited ( Ship Finance or the Company ) announces today the financial
Frontline The Fleet. 40 + 1 N/B VLCCs incl. 11 J/V Equals 34.6 vessels on a 100% basis. 8 Suezmax OBOs
 A Changing Company The Company The world s largest tanker company listed NYSE and Oslo Current Market Cap USD 900 million Daily trading volume in excess of USD 20 million Total fleet 72 vessels VLCC /
Investor Presentation. September 2015
 Investor Presentation September 2015 Forward looking statements 1 Euronav Largest independent quoted tanker company in world IEA forecast 1.6m bpd growth 2015 & 2016; base case of 1m bpd 2017-2020 Lower
Euronav Q1 2015 Results (unaudited) 30 th April 2015
 30 th April 2015") Euronav Q1 2015 Results (unaudited) 30 th April 2015 Forward looking statements Matters discussed in this presentation may constitute forward-looking statements under U.S. federal securities laws, including
Euronav Q1 2015 Results (unaudited) 30 th April 2015 Forward looking statements Matters discussed in this presentation may constitute forward-looking statements under U.S. federal securities laws, including
EARNINGS CONFERENCE CALL Second Quarter Ended June 30, 2015
 EARNINGS CONFERENCE CALL Second Quarter Ended June 30, 2015 Disclosures and Forward Looking Statements This presentation contains certain statements that may be deemed to be forward-looking statements
Golden Ocean Group Limited Q3 2006 results December 1, 2006
 Golden Ocean Group Limited Q3 2006 results December 1, 2006 PROFIT & LOSS 2005 2006 (in thousands of $) 2006 2005 2005 Jul-Sep Jul-Sep Jan - Sep Jan - Sep Jan - Dec Operating Revenues 26,265 66,431 Time
Ship Finance International Limited (NYSE: SFL) - Earnings Release. Reports second quarter results and quarterly dividend of $0.
 - Earnings Release. Reports second quarter results and quarterly dividend of $0.") Ship Finance International Limited (NYSE: SFL) - Earnings Release Reports second quarter results and quarterly dividend of $0.55 per share Ship Finance International Limited ( Ship Finance or the Company
Ship Finance International Limited (NYSE: SFL) - Earnings Release Reports second quarter results and quarterly dividend of $0.55 per share Ship Finance International Limited ( Ship Finance or the Company
Scorpio Tankers, Inc. Q1 2013 Conference Call. April 29, 2013
 1 Scorpio Tankers, Inc. Q1 2013 Conference Call April 29, 2013 Disclaimer COMPANY OVERVIEW 2 This presentation contains certain statements that may be deemed to be forward-looking statements within the
FOURTH QUARTER RESULTS 2015
 FOURTH QUARTER RESULTS 2015 HIGHLIGHTS EBITDA USD 160.6 million: highest quarterly result since Q3 2008 Tanker fundamentals: remain healthy and look sustainable Ship sales: old vessels sold reducing average
Clear weather on the horizon?
 PwC annual Global Shipping Benchmarking Analysis Market Developments p / Sustainability p1 / Financial Performance review p17 / Companies covered by the analysis p Clear weather on the horizon? 3% of the
CAPITAL MARKETS DAY DRY CARGO
 CAPITAL MARKETS DAY DRY CARGO THE PREFERRED PARTNER IN GLOBAL TRAMP SHIPPING UNIQUE PEOPLE, OPEN MINDED TEAM SPIRIT, NUMBER ONE New York City, 22 January 2008 1 GUIDANCE AGENDA Norden Dry cargo Organization
Heidmar Tanker Pools Trading insights from the front line: Strategies for maximizing returns in shifting markets
 Heidmar Tanker Pools Trading insights from the front line: Strategies for maximizing returns in shifting markets June 2013 2 About Heidmar Heidmar is the world s leading independent tanker pool manager
Annual Report 2006. "We seek excellence through a dedicated team effort from competent and motivated people" Dampskibsselskabet NORDEN A/S
 Dampskibsselskabet NORDEN A/S Annual Report 2006 Annual Report 2006 "We seek excellence through a dedicated team effort from competent and motivated people" Dampskibsselskabet NORDEN A/S Contents Highlights
CORRAL PETROLEUM HOLDINGS AB (publ)
") CORRAL PETROLEUM HOLDINGS AB (publ) REPORT FOR THE FOURTH QUARTER AND YEAR ENDED DECEMBER 31, 2011 FOR IMMEDIATE RELEASE Date: March 30, 2012 London Nr. of pages 14 This report includes unaudited consolidated
CORRAL PETROLEUM HOLDINGS AB (publ) REPORT FOR THE FOURTH QUARTER AND YEAR ENDED DECEMBER 31, 2011 FOR IMMEDIATE RELEASE Date: March 30, 2012 London Nr. of pages 14 This report includes unaudited consolidated
Aegean Marine Petroleum Network Inc. Announces Fourth Quarter 2014 Financial Results
 Aegean Marine Petroleum Network Inc. Announces Fourth Quarter 2014 Financial Results PIRAEUS, Greece, March 16, 2015 Aegean Marine Petroleum Network Inc. (NYSE: ANW) ( Aegean or the Company ) today announced
Earnings Conference Call Third Quarter & 9 Months Ended September 30, 2014
 Earnings Conference Call Third Quarter & 9 Months Ended September 30, 2014 Forward Looking Statements This presentation contains certain statements that may be deemed to be forward-looking statements within
Höegh LNG Partners LP. Höegh LNG Partners LP Fourth Quarter Financial Results February 26, 2015
 Höegh LNG Partners LP Höegh LNG Partners LP Fourth Quarter Financial Results February 26, 2015 Forward-Looking Statements This presentation contains certain forward-looking statements concerning future
2011 Interim Results Presentation. Athens, 31 August 2011
 2011 Interim Results Presentation Athens, 31 August 2011 AGENDA Results Highlights Business Units Performance Financial Results Q&A 1 RESULTS HIGHLIGHTS INDUSTRY ENVIRONMENT: Conditions remain difficult
Oceaneering Reports First Quarter 2016 Results
 PRESS RELEASE Oceaneering Reports First Quarter 2016 Results April 25, 2016 Houston, Texas Oceaneering International, Inc. ( Oceaneering or the Company ) (NYSE:OII) today reported net income of $25.1 million,
Box 6 International Oil Prices: 2002-03
 Annual Report 2002-03 International Oil Prices: 2002-03 Box 6 International Oil Prices: 2002-03 Notwithstanding the state of the world economy, characterised by sluggish growth in 2002, the world crude
Q1 2010 Results Analyst Presentation Henk van Dalen, CFO 3 May 2010
 Q1 2010 Results Analyst Presentation Henk van Dalen, CFO 3 May 2010 Overall trading conditions continue to improve GROUP Operating income 251 million ( 163 million in Q1 20); quarter benefited from four
AnnuAl RepoRt 2014. DampSKibSSelSKabeT NORDeN a/s
 AnnuAl RepoRt 2014 DampSKibSSelSKabeT NORDeN a/s CONTeNTS management COmmeNTaRy 2014-15 at a glance 3 Highlights 2014-15 4 Key figures and financial ratios for the Group 5 outlook for 2015 6 Strategy update
FRANKLIN ELECTRIC REPORTS RECORD SECOND QUARTER 2013 SALES AND EARNINGS
 For Immediate Release For Further Information Refer to: John J. Haines 260-824-2900 FRANKLIN ELECTRIC REPORTS RECORD SECOND QUARTER 2013 SALES AND EARNINGS Bluffton, Indiana July 30, 2013 - Franklin Electric
Wilh. Wilhelmsen ASA. > Third Quarter 2014. Jan Eyvin Wang President and CEO. 11 November 2014, Lysaker
 Wilh. Wilhelmsen ASA > Third Quarter 214 Jan Eyvin Wang President and CEO 11 November 214, Lysaker Disclaimer This presentation contains forward-looking expectations which are subject to risk and uncertainties
Presentation on Results for FY 2015. Idemitsu Kosan Co.,Ltd. May 10, 2016
 Presentation on Results for FY 2015 Idemitsu Kosan Co.,Ltd. May 10, 2016 Table of Contents 1. FY 2015 Financials (1) Overview (2) Segment Information 2. Forecast for FY 2016 Performance (1) Overview (2)
Second Quarter Results of Operations
 PRESS RELEASE Besi Posts Strong Q2 and H1-15 Results. Significant Expansion of Net Cash Position vs. 14 Duiven, the Netherlands, July 23, - BE Semiconductor Industries N.V. (the Company" or "Besi") (Euronext
Download Full Financial Release (PDF) Download Slides (PDF)
 Download Slides (PDF)") Oct 30, 2012 Ford Earns Record Third Quarter 2012 Pre-Tax Operating Profit of $2.2 Billion, Net Income of $1.6 Billion+ Download Full Financial Release (PDF) Download Slides (PDF) Best-ever third quarter
Oct 30, 2012 Ford Earns Record Third Quarter 2012 Pre-Tax Operating Profit of $2.2 Billion, Net Income of $1.6 Billion+ Download Full Financial Release (PDF) Download Slides (PDF) Best-ever third quarter
W.W. Grainger, Inc. First Quarter 2015 Results Page 1 of 9
 W.W. Grainger, Inc. First Quarter 2015 Results Page 1 of 9 News Release GRAINGER REPORTS RESULTS FOR THE 2015 FIRST QUARTER Revises 2015 Guidance Quarterly Summary Sales of $2.4 billion, up 2 percent Operating
TomTom reports first quarter 2012 results
 De Ruyterkade 154 1011 AC Amsterdam, The Netherlands corporate.tomtom.com ir@tomtom.com 25 April 2012 TomTom reports first quarter 2012 results Financial headlines - Group revenue of 233 million - Content
Spectra Energy Reports Fourth Quarter and Year-End 2011 Results
 Media: Analysts: Wendy Olson (713) 627-4072 (713) 627-4747 (24-hour media line) John Arensdorf (713) 627-4600 Date: February 2, 2012 Spectra Energy Reports Fourth Quarter and Year-End 2011 Results Company
Presentation on Results for the 2nd Quarter FY 2015. Idemitsu Kosan Co.,Ltd. November 4, 2015
 Presentation on Results for the 2nd Quarter FY 2015 Idemitsu Kosan Co.,Ltd. November 4, 2015 Table of Contents 1. 2 nd Quarter FY 2015 Financials (1) Overview (2) Segment Information (3) Streamlining 2.
3. Forecast of Consolidated Results for Fiscal Year ending March 31, 2013
 October 31, 2012 Financial Highlights: The Second Quarter Ended September 30, 2012 1. Consolidated Financial Highlights ( from April 1, 2012 to September 30, 2012 ) (All financial information has been
FORACO INTERNATIONAL REPORTS Q3 2014
 NEWS RELEASE FORACO INTERNATIONAL REPORTS Q3 2014 Toronto, Ontario / Marseille, France Tuesday, November 4, 2014 Foraco International SA (TSX:FAR) (the Company or Foraco ), a leading global provider of
Tipco Asphalt Public Company Limited (TASCO)
") (TASCO) Q1/2015 Opportunity Day 4 th June 2015 1 Disclaimer This presentation material has been prepared solely for informational purposes only. TASCO is furnishing it solely for use by prospective investors
(TASCO) Q1/2015 Opportunity Day 4 th June 2015 1 Disclaimer This presentation material has been prepared solely for informational purposes only. TASCO is furnishing it solely for use by prospective investors
STAR BULK CARRIERS CORP. REPORTS PROFITS FOR THE SECOND QUARTER AND FIRST HALF OF 2013
 STAR BULK CARRIERS CORP. REPORTS PROFITS FOR THE SECOND QUARTER AND FIRST HALF OF 2013 ATHENS, GREECE, August 27, 2013 Star Bulk Carriers Corp. (the "Company" or "Star Bulk") (Nasdaq: SBLK), a global shipping
Shipping Companies Financial Performance Measurement using Industry Key Performance Indicators Case Study: The highly volatile period 2007-2010
 Shipping Companies Financial Performance Measurement using Industry Key Performance Indicators Case Study: The highly volatile period 2007-2010 Maro Varvate Managing Director, OceanFinance Ltd Scope of
Summary of Consolidated Financial Statements for the First Quarter of Fiscal Year Ending December 31, 2016 (Japanese GAAP)
") This document is a translation of the Japanese financial statements and is not in conformity with accounting principles of the United States. Summary of Consolidated Financial Statements for the First
This document is a translation of the Japanese financial statements and is not in conformity with accounting principles of the United States. Summary of Consolidated Financial Statements for the First
FOR IMMEDIATE RELEASE
 By: EARNINGS RELEASE Expeditors International of Washington, Inc. 1015 Third Avenue, Suite 1200 Seattle, Washington 98104 CONTACTS: R. Jordan Gates Bradley S. Powell President and Chief Operating Officer
Year-end Report January-December 2015
 Year-end Report January-December 20 Johan Dennelind, President & CEO Q4 20 high pace towards the new TeliaSonera Started to reduce presence in region Eurasia Continued business transformation Solid development
EARNINGS RELEASE FOR IMMEDIATE RELEASE EXPEDITORS REPORTS FOURTH QUARTER 2014 EPS OF $0.51 PER SHARE 1
 By: Expeditors International of Washington, Inc. 1015 Third Avenue, Suite 1200 Seattle, Washington 98104 EARNINGS RELEASE CONTACTS: R. Jordan Gates Bradley S. Powell President and Chief Operating Officer
EURONAV NV ANNOUNCES FINAL RESULTS 2014 AND NEW DIVIDEND POLICY
 EURONAV NV ANNOUNCES FINAL RESULTS AND NEW DIVIDEND POLICY USD 0.25 per share gross dividend proposed for annual shareholders meeting on 13 May 2015 Dividend policy going forward to distribute at least
Nippon Yusen Kabushiki Kaisha (NYK Line)
") Third Quarter Financial Results For the Nine Months Ended January 29, 2010 Nippon Yusen Kabushiki Kaisha (NYK Line) Security Code: 9101 Listings: The First Section of Tokyo, Osaka and Nagoya Stock Exchanges
Third Quarter Financial Results For the Nine Months Ended January 29, 2010 Nippon Yusen Kabushiki Kaisha (NYK Line) Security Code: 9101 Listings: The First Section of Tokyo, Osaka and Nagoya Stock Exchanges
February 2, 2016 Consolidated Financial Results for the Third Quarter of Fiscal Year 2015 (From April 1, 2015 to December 31, 2015) [Japan GAAP]
![February 2, 2016 Consolidated Financial Results for the Third Quarter of Fiscal Year 2015 (From April 1, 2015 to December 31, 2015) [Japan GAAP]](/thumbs/34/17006729.jpg "February 2, 2016 Consolidated Financial Results for the Third Quarter of Fiscal Year 2015 (From April 1, 2015 to December 31, 2015) [Japan GAAP]") February 2, 2016 Consolidated Financial Results for the Third Quarter of Fiscal Year 2015 (From April 1, 2015 to December 31, 2015) [Japan GAAP] Company Name: Idemitsu Kosan Co.,Ltd. (URL http://www.idemitsu.com)
February 2, 2016 Consolidated Financial Results for the Third Quarter of Fiscal Year 2015 (From April 1, 2015 to December 31, 2015) [Japan GAAP] Company Name: Idemitsu Kosan Co.,Ltd. (URL http://www.idemitsu.com)
FOR IMMEDIATE RELEASE
 FOR IMMEDIATE RELEASE O-I REPORTS FULL YEAR AND FOURTH QUARTER 2014 RESULTS O-I generates second highest free cash flow in the Company s history PERRYSBURG, Ohio (February 2, 2015) Owens-Illinois, Inc.
Conference call 9.30 am CET. Webcast available at www.maersk.com. A.P. Møller - Mærsk A/S. Annual Report 2010. 23 February 2011
 Conference call 9.30 am CET Webcast available at www.maersk.com A.P. Møller - Mærsk A/S Annual Report 2010 23 February 2011 Forward-looking Statements This presentation contains forward-looking statements.
Altus Group Reports First Quarter Financial Results for 2015
 Street Smart. World Wise. Altus Group Reports First Quarter Financial Results for 2015 Altus Group Delivers 14% Revenue Growth, Including 43% Increase in Recurring Revenues from GAIM Businesses TORONTO,
SUB: STANDARD CHARTERED PLC (THE "COMPANY") STOCK EXCHANGE ANNOUNCEMENT
 STOCK EXCHANGE ANNOUNCEMENT") April 26, 2016 To, Ms. D'souza AVP, Listing Department National Stock Exchange of India Exchange Plaza Bandra Complex Bandra (East) 400 001 Limited SUB: STANDARD CHARTERED PLC (THE "COMPANY") STOCK EXCHANGE
April 26, 2016 To, Ms. D'souza AVP, Listing Department National Stock Exchange of India Exchange Plaza Bandra Complex Bandra (East) 400 001 Limited SUB: STANDARD CHARTERED PLC (THE "COMPANY") STOCK EXCHANGE
2015 OUTLOOK RAISED AGAIN
 1 2015 OUTLOOK RAISED AGAIN Q2 2015 20 August 2015 Copenhagen CONTENTS Overview Q2 2015 Outlook 2015 MGO transition Channel Semi-annual dividends and stock split Strategy, goals and priorities Appendix:
Impact of low crude prices on refining. February 2015. Tim Fitzgibbon Agnieszka Kloskowska Alan Martin
 Impact of low crude prices on refining February 2015 Tim Fitzgibbon Agnieszka Kloskowska Alan Martin The recent fall in crude oil prices has coincided with both higher and lower profitability in the downstream
Spectra Energy Reports First Quarter 2012 Results
 Media: Analysts: Wendy Olson (713) 627-4072 (713) 627-4747 (24-hour media line) John Arensdorf (713) 627-4600 Date: May 4, 2012 Spectra Energy Reports First Quarter 2012 Results Reported net income from
Standard Chartered today releases its Interim Management Statement for the third quarter of 2015.
 Standard Chartered PLC Interim Management Statement 3 November 2015 Standard Chartered today releases its Interim Management Statement for the third quarter of 2015. Bill Winters, Group Chief Executive,
Financial Information
 Financial Information Solid results with in all key financial metrics of 23.6 bn, up 0.4% like-for like Adjusted EBITA margin up 0.3 pt on organic basis Net profit up +4% to 1.9 bn Record Free Cash Flow
Brookfield financial Review q2 2010
 Brookfield financial Review q2 2010 Overview Operating cash flow and gains totalled $327 million in the second quarter or $0.53 per share compared to $294 million in the prior year. This brings operating
ADP Reports Third Quarter Fiscal 2014 Results
 April 30, 2014 ADP Reports Third Quarter Fiscal 2014 Results Revenues Rise 7%, Nearly all Organic, to $3.3 Billion for the Quarter; EPS Rises 7% ROSELAND, N.J., April 30, 2014 (GLOBE NEWSWIRE) -- ADP (Nasdaq:ADP),
(713) 627-5353 (713) 627-4747 (24-hour media line) (713) 627-4600. Date: May 3, 2013
 627-5353 (713) 627-4747 (24-hour media line) (713) 627-4600. Date: May 3, 2013") Media: Analysts: Caitlin Currie (713) 627-5353 (713) 627-4747 (24-hour media line) John Arensdorf (713) 627-4600 Date: May 3, 2013 Spectra Energy Reports First Quarter 2013 Results Reported net income
Media: Analysts: Caitlin Currie (713) 627-5353 (713) 627-4747 (24-hour media line) John Arensdorf (713) 627-4600 Date: May 3, 2013 Spectra Energy Reports First Quarter 2013 Results Reported net income
Midyear Presentation 2013. market strategy
 Midyear Higher order Results intake, Presentation lower profitability 2013 focused market strategy THE SAFE HARBOR STATEMENT UNDER THE US PRIVATE SECURITIES LITIGATION REFORM ACT 1995 This presentation
Order bookings 48,719 55,565-12 12,835 14,845 Sales 48,331 56,492-14 13,166 17,076
 28 January, 2002 SCANIA YEAR-END REPORT JANUARY - DECEMBER 2001 After the unsatisfactory 2001, our measures to adjust production to lower global demand, structural changes related to cab production and
Diluted net income per share. Six months ended Sep. 30, 2012 0.40 0.39 Six months ended Sep. 30, 2011 (1.09) -
 -") November 9, 2012 Summary of Consolidated Financial Results for the Second Quarter of Fiscal Year Ending March 31, 2013 (Six Months Ended September 30, 2012) [Japanese GAAP] Company name: Japan System Techniques
November 9, 2012 Summary of Consolidated Financial Results for the Second Quarter of Fiscal Year Ending March 31, 2013 (Six Months Ended September 30, 2012) [Japanese GAAP] Company name: Japan System Techniques
1. Supplemental explanation of FY2014 Q3 financial results
 February 2015 1. Supplemental explanation of FY2014 Q3 financial results Overall view Despite the favorable winds of a depreciating yen and lower bunker prices, we could not fully leverage these benefits,
Presentation on Results for the 1st Quarter FY 2014. Idemitsu Kosan Co.,Ltd. August 5, 2014
 Presentation on Results for the 1st Quarter FY 2014 Idemitsu Kosan Co.,Ltd. August 5, 2014 Table of Contents 1. FY 2014 1 st Quarter Financials (1) Overview (2) Segment Information (3) Streamlining (4)
Investor conferences Asia, United Kingdom and United States September and October 2015
 MARKET ANNOUNCEMENT Computershare Limited ABN 71 005 485 825 Yarra Falls, 452 Johnston Street Abbotsford Victoria 3067 Australia PO Box 103 Abbotsford Victoria 3067 Australia Telephone 61 3 9415 5000 Facsimile
Still battling the storm
 www.pwc.com Still battling the storm Global Shipping Benchmarking Analysis 2013 Table of contents Foreword 5 1. Market developments 6 1.1 General outlook 7 1.2 Characteristics of the market 9 1.3 Year
China Cord Blood Corporation Reports Financial Results for the Fourth Quarter and Full Year Fiscal 2010
 China Cord Blood Corporation Reports Financial Results for the Fourth Quarter and Full Year Fiscal 2010 Annual Revenue up 34.4% to RMB 261.5 Million Fiscal 2010 New Subscribers grew 30.5% Conference Call
Significant reduction in net loss
 press release 12 May 2015 Royal Imtech publishes first quarter 2015 results Significant reduction in net loss Order intake in Q1 at a satisfactorily level of 912 million Revenue 3% down excluding Germany
Verifone Reports Results for the Second Quarter of Fiscal 2016
 Verifone Reports Results for the Second Quarter of Fiscal 2016 SAN JOSE, Calif. (BUSINESS WIRE) Verifone (NYSE: PAY), a world leader in payments and commerce solutions, today announced financial results
FURTHER PROFIT GROWTH IN FIRST-HALF 2015
 FURTHER PROFIT GROWTH IN FIRST-HALF 2015 Net sales of 37.7bn, up +5.2% (+2.9% on an organic basis) Growth in Recurring Operating Income: 726m, +2.6% at constant rates Strong growth in adjusted net income,
Ludwigshafen, February 25, 2014
 Ludwigshafen, February 25, 2014 Analyst Conference FY2013 Cautionary note regarding forward-looking statements This presentation may contain forward-looking statements that are subject to risks and uncertainties,
Staples, Inc. Announces First Quarter 2016 Performance
 Media Contact: Mark Cautela 508-253-3832 Investor Contact: Chris Powers/Scott Tilghman 508-253-4632/1487 Staples, Inc. Announces First Quarter 2016 Performance FRAMINGHAM, Mass., May 18, 2016 Staples,
An income statement and statement of comprehensive income (continued)
") FIRST RESOURCES LIMITED Unaudited Financial Statements for the Third Quarter ( 3Q ) and Nine Months ( 9M ) Ended 30 September 2015 1(a) An income statement and statement of comprehensive income or a statement
FIRST RESOURCES LIMITED Unaudited Financial Statements for the Third Quarter ( 3Q ) and Nine Months ( 9M ) Ended 30 September 2015 1(a) An income statement and statement of comprehensive income or a statement
Analysts and press conference for the financial year 2010. March 16, 2011
 Analysts and press conference for the financial year 2010 March 16, 2011 Welcome Walter Gränicher Jost Sigrist Werner Schmidli Chairman of the Board of Directors Chief Executive Officer Chief Financial
Mitsubishi Electric Announces Consolidated and Non-consolidated Financial Results for Fiscal 2016
 MITSUBISHI ELECTRIC CORPORATION PUBLIC RELATIONS DIVISION 7-3, Marunouchi 2-chome, Chiyoda-ku, Tokyo, 100-8310 Japan FOR IMMEDIATE RELEASE No. 3023 Investor Relations Inquiries Investor Relations Group,
Management s Discussion and Analysis
 Management s Discussion and Analysis 6 Financial Policy Sysmex regards increasing its market capitalization to maximize corporate value an important management objective and pays careful attention to stable
Net interest-bearing debt at 30 June 2015 was DKK 560 million (30 June 2014: DKK 595 million).
.") H+H International A/S Interim financial report Company Announcement No. 327, 2015 H+H International A/S Dampfærgevej 3, 3rd Floor 2100 Copenhagen Ø Denmark Tel. +45 35 27 02 00 info@hplush.com www.hplush.com
H+H International A/S Interim financial report Company Announcement No. 327, 2015 H+H International A/S Dampfærgevej 3, 3rd Floor 2100 Copenhagen Ø Denmark Tel. +45 35 27 02 00 info@hplush.com www.hplush.com
FOSSIL GROUP, INC. REPORTS FOURTH QUARTER AND FISCAL YEAR 2014 RESULTS; Fourth Quarter Net Sales of $1.065 Billion; Diluted EPS Increases 12% to $3.
 FOSSIL GROUP, INC. REPORTS FOURTH QUARTER AND FISCAL YEAR 2014 RESULTS; Fourth Quarter Net Sales of $1.065 Billion; Diluted EPS Increases 12% to $3.00 Fiscal Year 2014 Net Sales Increase 8% to $3.510 Billion;
ADP REPORTS FOURTH QUARTER AND FISCAL 2011 RESULTS; PROVIDES FISCAL 2012 GUIDANCE
 FOR IMMEDIATE RELEASE ADP REPORTS FOURTH QUARTER AND FISCAL 2011 RESULTS; PROVIDES FISCAL 2012 GUIDANCE For the Year, Revenues Rise 11%, 6% Organic; EPS from Continuing Operations up 6% (excluding certain
Third-Quarter 2012 Earnings
 Third-Quarter 212 Earnings Jim Gallogly, Chief Executive Officer Karyn Ovelmen, Chief Financial Officer Sergey Vasnetsov, SVP - Strategic Planning and Transactions Doug Pike, VP - Investor Relations October
Company announcement from Vestas Wind Systems A/S
 Company announcement from Aarhus, 9 February 2016 Company announcement No. 3/2016 Page 1 of 9 Annual report 2015 - Yet another year with strong financial and operational results Summary: For full-year
Q2-14 Financial Results. July 30, 2014
 Q2-14 Financial Results July 30, 2014 Forward-looking Statements & Non-GAAP Measures Information contained in these materials or presented orally on the earnings conference call, either in prepared remarks
Restructuring of Sistema s Portfolio in the Current Market Conditions
 Restructuring of Sistema s Portfolio in the Current Market Conditions Leonid Melamed President, Chief Executive Officer Alexey Buyanov Senior Vice President, Head of Finance and Investment Anton Abugov
*See note 4 to our Summary Financial Information table below concerning our current operational and reporting structure
 INTERIM REPORT 1(39) Nokia Corporation Interim Report for Q1 2014 FINANCIAL AND OPERATING HIGHLIGHTS First quarter 2014 highlights for continuing operations*: Nokia s non-ifrs diluted EPS in Q1 2014 of
OW BUNKER ANNOUNCES INTENTION TO LAUNCH AN IPO AND TO SEEK A LISTING ON NASDAQ OMX COPENHAGEN
 PRESS RELEASE 5 March 2014 NOT FOR PUBLICATION, DISTRIBUTION OR RELEASE, DIRECTLY OR INDIRECTLY, IN OR INTO THE UNITED STATES OF AMERICA, AUSTRALIA, CANADA OR JAPAN This announcement is not a prospectus
A.P. Møller - Mærsk A/S. Annual Report 2007. Teleconference - 13 March 2008. Group CEO Nils Smedegaard Andersen Group CFO Soren Thorup Sorensen
 A.P. Møller - Mærsk A/S Teleconference - Annual Report Speakers: Group CEO Nils Smedegaard Andersen Group CFO Soren Thorup Sorensen Forward-looking statements The presentation contains forward-looking
Oceaneering Announces Record Quarterly Earnings
 PRESS RELEASE Oceaneering International, Inc. 11911 FM 529 Houston, Texas 77041 Telephone: (713) 329-4500 Fax: (713) 329-4951 www.oceaneering.com Oceaneering Announces Record Quarterly Earnings October
Interim Financial Report 9M/2015
 Interim Financial Report 9M/2015 Investor & Analyst Conference Call 5 November 2015 Investor Relations Agenda. 1. Financials 9M/2015 2. Outlook Page 2 SGL Group Investor Relations 05 November 2015 Performance
last page of this release. 3 Operating margin is calculated as operating income divided by net revenues.
 By: EARNINGS RELEASE Expeditors International of Washington, Inc. 1015 Third Avenue, Suite 1200 Seattle, Washington 98104 CONTACTS: R. Jordan Gates Bradley S. Powell President and Chief Operating Officer