Improving the health of Londoners
|
|
|
- Roxanne Ferguson
- 9 years ago
- Views:
Transcription

1 Improving the health of Londoners Transport action plan

2

3 Improving the health of Londoners Transport action plan. Contents Commissioner s foreword... 4 Overview: Transport has a central role in the health of Londoners... 7 Improving the health of Londoners: transport action plan The important role of transport in health The policy context Increasing physical activity Reducing noise Improving access and reducing severance Delivering healthy streets the whole-street approach Our action plan, new ways of working and partnerships Tools and decision making References Improving air quality Reducing the impacts of road traffic collisions Improving the health of Londoners: transport action plan 3


4 Commissioner s foreword Our purpose as the Capital s integrated transport authority is to keep London working and growing and to make life here better. The quality of our health is inextricably linked to this purpose in the form of the transport services we provide and the incentives and choices we offer for how we travel around London. Improving air quality, reducing death and injury on our roads and making sure that there is adequate transport provision to serve hospitals, clinics and GP surgeries are just some examples of our work in this area. Sir Peter Hendy CBE, Commissioner, Transport for London But our interest goes beyond even these vital issues, extending to the choices we all make about how we get around. For example, more than two-thirds of all public transport trips also involve walking for five minutes or more. 4 Foreword


5 London s transport system has a highly significant role to play in helping tackle the major public health challenges our city faces This is highly significant because, in many cases, this will be the main way Londoners are physically active. If we can improve the attractiveness of our environment then we will probably also provide even greater incentives for people to be more physically active. The potential benefits of this are huge. Promoting greater physical activity is a public health priority in London because it helps to prevent diseases such as type 2 diabetes, obesity, heart disease and some cancers. There are other health benefits that go beyond these obvious direct impacts, although they can be harder to measure. For example, enabling people to have easy access to services and jobs helps reduce the stress of frenetic modern life. There is no doubt that London s transport system has a highly significant role to play in helping tackle the major public health challenges our city faces. I am confident that this action plan will enable us to deliver. To enable us to deliver these benefits, we are investing 4bn over 10 years to make our streets greener, safer and more inviting to pedestrians, cyclists and public transport users. This investment creates streets that are inviting to walk and cycle in, improves air quality, reduces noise, and makes our roads even safer. Sir Peter Hendy CBE, Commissioner, Transport for London Improving the health of Londoners: transport action plan 5


6 6 Overview Transport has a central role in the health of Londoners

7 Overview Transport has a central role in the health of Londoners The Capital s transport system plays a very important part in people s health. It enables Londoners to access jobs, education, shops, recreation, health and social services as well as travel to see friends and family. All of these are essential for a healthy, fulfilling life. It is important that people can conveniently access healthcare, so transport needs to be considered at the earliest stages of any proposal to change healthcare provision. The biggest role of transport in health in London is a positive one; it is the main way that people stay active. This is vital as everyone needs to be physically active every day to prevent a wide range of illnesses including heart disease, stroke, depression, type 2 diabetes and some cancers. These are some of the biggest health challenges in London so transport is central to health in this city. Reduced risk from being physically Health condition active 1 Coronary heart disease and stroke 20 35% Type 2 diabetes 35 50% Colon cancer 30 50% Breast cancer 20% Hip fracture 36 68% Depression 20 30% Death 20 35% Alzheimer s disease 40 45% Local government has a new role in improving health The important role of transport in improving health has been recognised and reflected in changes to local government responsibilities and resources that came into place in March Local authorities are now responsible for demonstrating improvements in 68 indicators of the health of their residents. Many of these indicators relate to streets and transport including road traffic injuries, air quality, noise, physical activity and social connectedness. Transport for London s (TfL) role in improving health We have recognised the role of transport in improving health and this is reflected in our strategic goals and business plans. The recent changes in local government have brought this role to the fore. In particular, the importance of the walking and cycling people do as part of their everyday routine, as they will deliver huge economic and social benefits by keeping people active and healthy. The expected growth of cycling up to 2026 is estimated to deliver 250m in health economic benefits annually. The health benefits delivered by London s streets go far beyond the physical activity that people get from walking and cycling in the city, although this is the biggest benefit and has great potential for health improvements in the future. Increased walking and cycling offers many other advantages including cleaner air, less noise, more connected neighbourhoods, less stress and fear, and fewer road traffic injuries. These issues are all connected, and to deliver the biggest benefits from more walking and cycling we need to ensure our streets invite people to walk and cycle whenever possible. Improving the health of Londoners: transport action plan 7

8 Source Physical activity Air quality Road traffic collisions Noise Access and severance Main health impacts that can be improved Obesity Heart disease Stroke Depression Type 2 diabetes Cardiovascular disease Respiratory diseases Physical injuries Psychological trauma Mental health Blood pressure Child development Mental wellbeing Personal resilience Stress Social isolation Taking a whole-street approach to improving health in London A whole-street approach is needed to make streets more inviting for walking and cycling and better for health. Many streets in London have one or more characteristics which make them good for health and attractive places to spend time, but it often takes multiple positive characteristics to encourage people out on to the street. There is much we can do to improve our streets which will benefit the health of Londoners. Indicators of a healthy street environmentall walks of life Pedestrians from Clean air Easy to cross People feel relaxed Shade and shelter and do Thngs to see Places to stop People feel safe Not too noisy People choose to walk and cycle Source: Lucy Saunders 8 Overview Transport has a central role in the health of Londoners

9 TfL s current approach to improving health We are committed to delivering better streets, not only for the health reasons but because better streets will also deliver a wide range of economic, social and environmental benefits. We recognise that improving health is a core part of what we do and our major work programmes reflect this. Some of the key positive health impacts of TfL s current work are highlighted below: TfL strategy Opportunity Area Increasing physical activity Improving air quality Reducing the impact of road traffic collisions Reducing noise Improving access and reducing severance Planning Frameworks A wholestreet approach Sub-regional Transport Plans Delivering the vision for London s streets and roads Safe Streets for London: The Road Safety Action Plan London 2020 Your accessible transport network The Mayor s Air Quality Strategy The Mayor s Vision for Cycling Improving the health of Londoners: transport action plan 9

10 TfL s new and strengthened ways of working: Actions We commit to taking the following actions to ensure that by 2017 we more explicitly recognise and demonstrate our role in improving the health of Londoners: New ways of working with our internal stakeholders New ways of working with our external stakeholders Action 1 Action 2 Action 3 Action 4 Action 5 Action 6 Action 7 Action 8 Action 9 Action 10 We will quantify and where possible monetise the health impacts of our projects and policies. We will explicitly build health into the development and assessment of policies and projects. We will evaluate the health impacts of our programmes. We will assess what we are doing against the public health evidence base. We will strengthen our Health Impact Assessment processes. We will support staff to be more physically active as part of their daily travel. We will support boroughs to improve the health of their populations through their transport plans and investment. We will work with public health intelligence specialists and academics. We will work with the National Health Service to encourage travel analysis in the earliest stages of planning for changes to healthcare provision. We will urge central government to support our role in increasing the physical activity levels of Londoners. How we will measure progress We will assess the progress in making London s streets better for health with the following indicators: Impact Physical activity Air quality Road traffic collisions Noise Access and severance Healthy streets Measure Percentage of trip stages walked or cycled Nitrogen dioxide (NO2) and particulate matter (PM) on-street monitoring Reduction in killed or seriously injured (KSI) casualties from the average baseline Average rating of transport related noise Access to opportunities and services (ATOS) score Average rating of perception of the urban realm 10 Overview Transport has a central role in the health of Londoners


11 Improving the health of Londoners: transport action plan 11


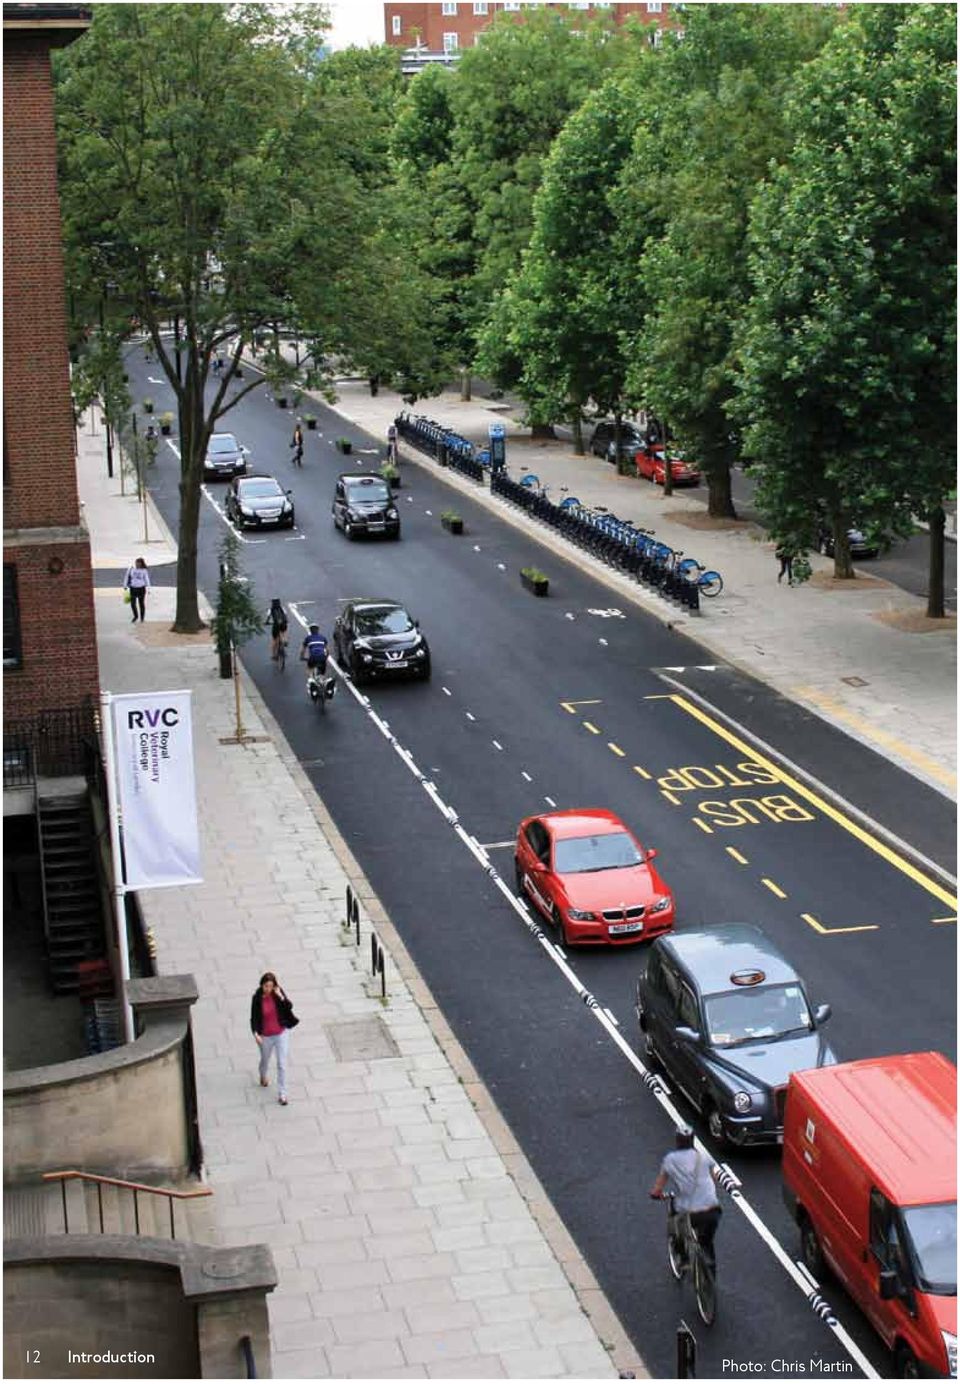
12 12 Introduction Photo: Chris Martin
13 Introduction Improving the health of Londoners: transport action plan This is our first health improvement action plan. There is growing recognition of the importance of transport and street environments in improving people s health. Health is woven into our work to achieve the Mayor s Transport Strategy goals, and significant health benefits are being delivered through our programmes. The Mayor s Transport Strategy sets our goals to 2031, our Business Plan presents our objectives to We have identified in this document our immediate actions over the next three years to ensure that we deliver the health commitments of the Mayor s Transport Strategy. Local authorities have taken on new public health responsibilities this year and we, along with other agencies, have a role in supporting them to deliver improvements in the health of Londoners. These ations explicitly recognise and demonstrate our part in this work. Structure and content The first two chapters introduce how transport impacts on health in London and the policy context for improving health through the transport system. Chapters three to seven describe the main impacts of transport on health in London starting with physical activity, which has the biggest impact, then air quality, road traffic collisions, noise, access and severance. In each of these chapters we identify the key groups of people and the key health impacts affected. We signpost the main actions that we are taking, including examples of improvements being delivered. All of these health impacts are brought together in chapter eight, which demonstrates how creating healthy streets enables us to reduce potential harms to health while improving the positive impacts of travel on health. The recent work of the Roads Task Force (RTF) highlighted the importance of creating great streets to benefit the economy, the environment and society. Our response to the RTF sets out our plans and ambitions to deliver better streets in London. It shows that we are heading in the right direction to improve the health of Londoners and reduce inequalities, but we want to do more. Chapter nine sets out the 10 actions we will take to ensure that by 2017 we more explicitly recognise and demonstrate our role in improving the health of Londoners. We are committed to building on our role in improving health by including it more clearly in our policies, practices and decision making. We will need to work closely with our partners and stakeholders in order to include them in our work and be most effective. Chapter 10 sets out a wide range of resources and tools to equip us and our partners in our work ahead. Improving the health of Londoners: transport action plan 13

14 1. The important role of transport in health London s transport network plays an integral role in the life and health of every person in the Capital. The city s high-quality public transport network and public realm are used by almost all Londoners and many visitors to access jobs, education, services and healthcare, to connect with other people and to remain physically active. How people spend their travelling time impacts on their own health and the health of others. How people spend their travel time in London Our usual way of understanding how people use transport in the Capital is survey a sample of Londoners about their trips. We then break this data about the journeys down into stages by different modes. So, for example, taking the bus to work might involve three stages a walk from home to the bus stop, a bus to near work and then another walk from the bus stop to the workplace. This analysis tells us that currently 44 per cent of journey stages are by public transport, 33 per cent are by private vehicle, 21 per cent are walked and two per cent are cycled 2. From a health perspective it can be more useful to look at the amount of time people spend on different modes. Modelled data that looks at the time spent travelling by Londoners shows that people spend most time in cars including taxis (38 per cent), and walking including walking stages, of public transport trips (27 per cent) (figure 1). Altogether 80 per cent of travel by people in the Capital takes place on London s streets 3. Streets are therefore central to the way transport impacts on health as they are the places where the health benefits (from physical activity, social connections, access) and harms (from road traffic collisions, poor air quality, noise, severance etc) are greatest. Transport use in London current trends The Capital s population grew by 13 per cent between 2000 and 2011, to reach its highest level since the 1930s. Correspondingly, there were 13 per cent more trips made in London on an average day compared to Car use in London has declined since 1999 so the additional travel is being made by other types of transport (figure 2). This provides opportunities for improving the health of Londoners through increasing physical activity, improving air quality, reducing road traffic collisions and noise, improving access to services and reducing community severance. The following chapters of this report will consider these opportunities in more detail. Transport projections planning for the future The Mayor s Transport Strategy sets out the expected changes in transport use over the coming years. Using the modelled data which translates into time spent travelling by Londoners, it is expected that by 2031 there will have been a six per cent reduction in time spent in cars (continuing the trend of the last decade). This journey time is expected to transfer to cycling (three per cent), train/tube (two per cent) and bus (one per cent) (figure 3) 5. This change in travel modes, while relatively modest, will have a positive impact on the health of Londoners. The additional cycling is expected to give between 4,000 and 6,000 extra years of healthy life for Londoners each year, which translates into nearly 250m of health economic benefits annually. The majority of this benefit will be achieved through increased physical activity for those people who cycle. The biggest impact of the transport system in 14 Chapter 1 The important role of transport in health

15 Figure 1: Percentage of time spent on each type of transport Percentage of time spent by each transport mode Bike Bus Train/Tube Walk Car/taxi Source: The main impacts of London road transport on health (2013) Figure 120 2: Population and traffic growth, index: 2000= Population Vehicle kilometres Car vehicle kilometres Improving the health of Londoners: transport action plan 15


16 London on health is enabling people to be physically active through everyday walking and cycling 6. Figure 4 shows the estimated gain in years of healthy life by London s population each year as a result of delivering the Mayor s Transport Strategy. The biggest health gain will be for those people who benefit from increased physical activity through more active travel. However there will also be wider benefits for society as the shift from motorised transport to cycling will deliver improved air quality and could also result in a net reduction in injuries 7. London s population is expected to grow from 8.3 million in 2013 to 9.84 million in 2031 and million in This means it will increase by a quarter over 30 years from This growth will be challenging in terms of meeting people s travel needs as well as enabling them to stay healthy. Current trends show there are increasing numbers of people living with chronic conditions such as type 2 diabetes, obesity and heart disease, and if these continue we can expect the challenge to be even greater 9. The whole-street approach to delivering healthy streets The health impacts of transport cannot easily be separated in reality. Increasing physical activity through more walking and cycling both depends on, and helps to deliver, environments with cleaner air, less noise, more connected neighbourhoods, less stress and fear and fewer road traffic injuries. These issues are all connected so street environments and how we travel in them should be seen as a whole system, what we term a whole-street approach to delivering healthy streets. Access to healthcare Healthcare is provided in a range of settings in London, from community pharmacies to health centres to specialist treatment units. The majority of healthcare is provided in community settings. Some healthcare that was traditionally given in hospitals is increasingly being provided in the community and this trend is expected to continue. This means that National Health Service (NHS) organisations in the Capital are planning how and where they will provide healthcare services in the future. It is important that people can conveniently access healthcare so transport implications need to be considered at the earliest stages of proposals to change healthcare provision. 16 Chapter 1 The important role of transport in health

17 Figure 3: Percentage of time spent by each type of transport 2031 Percentage of time spent by each transport mode 2031 Bike Bus Train/Tube Walk Car/taxi Figure 4: Years of healthy life gained each year by Londoners following implementation of the Mayor s Transport Strategy Disability Adjusted Life Years Physical Activity Air pollution Injuries Improving the health of Londoners: transport action plan 17

18 2. The policy context The London Plan The London Plan is the overall strategic spatial plan for London. It is the parent strategy to the Mayor s Transport Strategy and has a significant bearing on how transport can improve health. It sets out the economic, environmental, transport and social framework for the development of the Capital to London boroughs local plans need to be in general conformity with the London Plan, and its policies guide decisions on planning applications by councils and the Mayor. Chapter three of the London Plan focuses on the importance of improving health and reducing health inequalities. In particular, through policies for providing sustainable communities and ensuring locational decisions and transport are integrated to promote the health and wellbeing of communities 10. The Mayor s Transport Strategy The Mayor of London has a statutory responsibility to consider health and health inequalities in his work, this includes our work 11. This is reflected in the Mayor s Transport Strategy commitments which relate to health in many ways, as set out below: Mayor s Transport Strategy goal Support economic development and population growth Enhance the quality of life for all Londoners Improve the safety and security of all Londoners Improve transport opportunities for all Londoners Reduce transport s contribution to climate change and improving its resilience Support delivery of the London 2012 Olympic and Paralympic Games and its legacy Main impact on health Being able to access good quality education, training and employment, shops, healthcare and services is extremely important for both mental and physical health. Health is an essential component of good quality of life. The main way that transport can improve the health of Londoners is in enabling people to keep physically active by walking and cycling as part of their everyday journeys. Feeling safe in terms of crime, road danger and social inclusion is vital for people to use streets and transport to engage with others, access services and remain physically active. Everyone in London needs to be able to engage fully in London life and that means making sure that the transport system is inviting to people of all ages, backgrounds and abilities. Climate change is considered the biggest long-term threat to public health. Reducing carbon emissions and building resilience in the transport system for climate change will help to protect public health. The Olympic and Paralympic Games provided an opportunity to trial new ideas and support people travelling differently. This included more people walking, cycling and using public transport which benefit physical and mental health. The legacy includes new walking, cycling and public transport infrastructure and programmes. 18 Chapter 2 The policy context

19 New local government responsibilities for public health The Health and Social Care Act 2012 transferred responsibility for public health from the National Health Service to local government. Local authorities now have a statutory responsibility to use their powers and resources across all sectors to improve the health of their population 12. Every London borough is responsible for delivering a Local Implementation Plan for transport and a Health and Wellbeing Strategy that will improve the health of its population. As transport and street environments have a significant influence on health in London there is a clear opportunity for taking a joint approach. Local authorities are measured against 68 Public Health Outcome Measures to assess how they are improving the health of their population. Many of these health impacts can be directly and indirectly delivered through improving street environments and public transport. Some examples include obesity, physical activity, air quality, noise, deaths and serious injuries on the road, and social connectedness (figure 5). Figure 5: Public Health Outcome Measures which relate to transport and street environments High level outcomes Wider determinants Health improvements Healthcare improvements Healthy life expectancy Health inequalities Health protection Air pollution Sustainable development plans for public sector organisations Children in poverty Pupil absence year old NEET Employment for people with a LTC Sickness absence rate Killed and seriously injured on the road Violent crime Population affected by noise Use of green space for exercise Social connectedness Older people s perception of safety Low birth rate Breastfeeding Early childhood development Childhood obesity Wellbeing of looked after children Diet Adult obesity Physical inactivity Diabetes Self-reported wellbeing Falls and fall injuries in the over-65s Preventable deaths Premature deaths from cardiovascular disease Premature deaths from all cancers Early death from respiratory disease Suicide Quality of life for older people Hip fractures in the over-65s Dementia Improving the health of Londoners: transport action plan 19


20 Enabling boroughs to discharge their public health duties through their Local Implementation Plans has implications for TfL. We recognise that we have a role in improving health and have already started to incorporate this into our work. For example we included health benefits in the business case for delivering the Mayor s Cycling Vision. TfL s Business Plan In December 2013 we published our Business Plan. This document sets out what will be delivered for Londoners over the coming decade, many of the projects will directly contribute to improving the health of residents, including: Increasing cycling Extensive network of cycle routes and better junctions Cycle parking and cycle rail superhubs Expanding Barclays Cycle Hire Education and enforcement to increase cycling and make it safer Increasing walking Expanding the Legible London wayfinding system Improving air quality Transforming our bus fleet Exploring new and developing technologies for cleaner vehicles Mayor s Air Quality Fund for targeted action in boroughs 20 Chapter 2 The policy context

21 Improving the safety of the transport network Reworking 33 priority junctions to make them safer for vulnerable road users Working with commercial vehicle operators to raise awareness and adapt vehicles Improving accessibility of the transport network Expanding step-free access at bus stops, underground and overground train stations Improving streets and public spaces Investing 4bn over 10 years in London s roads to make them greener, safer and more user-friendly, particularly for the increasing walking, cycling and public transport users forecast Planting more street trees However in the context of London s growing population, expected increases in older and younger people and more people living with obesity and long-term conditions, such as type 2 diabetes, dementia and cardiovascular disease, there is no space for complacency. We therefore commit to going further and more explicitly demonstrating how we are improving the health of Londoners. Our action plan for delivering this is set out in chapter nine of this report. Improving public transport provision in underserved areas Expanding capacity of London Overground, London Tramlink, at train and Tube stations and interchanges Supporting growth in London s 33 Opportunity Areas and 10 Intensification Areas Improving the health of Londoners: transport action plan 21
22 3. Increasing physical activity The most significant role transport plays in the health of Londoners is enabling physical activity from walking, cycling and using public transport 13. Lack of physical activity is currently one of the biggest threats to the health of Londoners (figure 6) 14. It is needed for the healthy functioning of every part of the human body and reduces the risk of dying prematurely and developing a range of chronic diseases including diabetes, dementia, depression and the two biggest killers in London, heart disease and cancer (figure 7) 15. Active travel is likely to be the main way many people in London meet their physical activity needs because it is easily incorporated into their daily routine. How much physical activity do we need? Adults are recommended to achieve a minimum of 150 minutes of physical activity per week to keep healthy. Over 300 minutes may be needed to prevent weight gain 16. It is estimated that in the UK, 44 per cent of adults are not achieving minimum levels of physical activity 17. This is despite the fact that the minimum requirement is equivalent to just a ten-minute walk to and from the bus stop and a ten-minute round trip to buy a sandwich at lunchtime on weekdays. Figure 6: Chronic disease risk increased by physical inactivity % 15 16% 15% 10 12% 11% 5 0 Coronary heart disease Colon cancer Diabetes Stroke Breast cancer Source: World Health Organisation (2002) 22 Chapter 3 Increasing physical activity Increasing physical activity
23 Key health impacts Obesity Heart disease Stroke Depression Type 2 diabetes Key groups affected Everybody How much physical activity do Londoners get? In London, 43 per cent of adults do not achieve the recommended minimum level of 150 minutes of physical activity each week according to national statistics 18. A significant proportion of the population (27 per cent) are categorised as inactive achieving less than 30 minutes of physical activity a week. This is the case for up to 40 per cent of the population in some London boroughs 19. But these official statistics do not tell the full story for Capital. Londoners get most of their regular physical activity from transport The official statistics do not usually include short trips by active travel walking or cycling for utility purposes. In London this is part of the daily routine for many people using public transport, as well as those who walk or use a bike for shorter trips. As a result Londoners do more active travel than the England average 20. Nearly a third of 15 to 29-year-olds in London achieve their recommended physical activity levels through active travel alone (figure 8) 21. Even among the oldest people in London, those aged over 80, it is estimated that 16 per cent meet their physical activity needs through walking and cycling alone 22. This is significant as surveys of other forms of exercise such as sport and recreational activities show much lower levels of people meeting their physical Figure 7: Physical activity reduces risks from the biggest health threats Health condition Reduced risk from being physically active Death 20 35% Coronary heart disease and strokes 20 35% Type 2 diabetes 35 50% Colon cancer 30 50% Breast cancer 20% Hip fracture 36 68% Depression 20 30% Alzheimer s disease 40 45% Improving the health of Londoners: transport action plan 23
24 Figure 8: Proportion of adults in London currently meeting their physical activity needs through walking and cycling, activity needs, particularly among older age groups 23. Walking is a particularly important activity as it is the one that people are most likely to do consistently through their life 24. Remaining active into older age is vital for health because it protects against a range of health risks including dementia, depression, stroke and social isolation 25. There is potential for more cycling and walking in London Although it is impressive that Londoners achieve a significant amount of physical activity by walking and cycling for travel, they need to be doing a lot more to reach even the minimum recommended levels of physical activity. This is possible as a significant proportion of journeys currently made by motorised modes could be made instead by physically active modes (walking and cycling) 26. It is also important to remember the valuable role of public transport in keeping people active. In London over two-thirds of all public transport trips involve walking for five minutes or more and half of all walking is done as part of public transport trips 27. More walking and cycling would result in significant health benefits to Londoners and cost savings to London s economy. One estimate is that 60,000 years of perfect health* could be gained each year across London s population if people swapped motorised modes for those short * A year of perfect health is a common measure of health known as Disability Adjusted Life Year (DALY). DALYs are used to measure population health benefits by combining years of healthy life gained by living longer and living in good health (by avoiding disability). DALYs allow us to combine different health impacts in a single measure, eg deaths due to road traffic collisions and disability due to poor air quality. One DALY is equivalent to gaining one year of life in perfect health. 24 Chapter 3 Increasing physical activity Increasing physical activity
25 Figure 80 9: Proportion of adults in London who could meet their physical activity needs through walking and cycling journeys that could realistically be walked or cycled instead. This can be monetised as over 2bn each year in health economic benefits 28. If this high level of walking and cycling were achieved we could expect that the proportion of Londoners achieving their physical activity needs through travel alone would increase to 60 per cent from 25 per cent (figure 9). If more Londoners walk and cycle more there will be big health benefits If all Londoners met the minimum standard of 150 minutes of physical activity per week then Improving the health of Londoners: transport action plan 25
 in people diagnosed with coronary heart disease, a 23 per cent reduction in people diagnosed with breast cancer (over 800")
26 every year over 8,200 fewer people would die a 20 per cent reduction in all deaths. We could also expect to see a 12 per cent reduction (over 1,700 people) in people diagnosed with coronary heart disease, a 23 per cent reduction in people diagnosed with breast cancer (over 800 people) and a 22 per cent reduction in people diagnosed with colorectal cancer (nearly 600 people) 29. Active travel is the only viable option for significantly increasing physical activity levels across London s whole population 30. The health benefits of active travel far outweigh the risks from hazards such as poor air quality and road traffic collisions 31. For example the increase in walking and cycling suggested above would deliver an estimated 60,000 years of health benefits from physical activity, 2,000 years of health benefit from reduced exposure to poor air quality and less than 1,000 years of health harms from road traffic collisions. The benefits outweigh the harms by 62:1 32. SPOTLIGHT Barclays Cycle Hire The Barclays Cycle Hire scheme was introduced in central London in 2010 with 6,000 bikes and then extended in March 2012 to provide 8,000 bikes. The scheme boasts many benefits to health including a really valuable role in allowing people who are thinking about taking up cycling to give it a go before investing in a bicycle of their own. The design of the bikes encourages a relaxed and leisurely cycling style which can have a positive effect on other road users and changes the feel of the whole street environment. The scheme is now being extended for a second time to include Hammersmith & Fulham, Wandsworth and Lambeth, bringing the number of bicycles up to 11, Chapter 3 Increasing physical activity Increasing physical activity
27 The health benefits of taking up cycling are similar to those of giving up smoking 34 Benefits versus risks of cycling Do the health benefits of cycling outweigh the risks? It is estimated that the average life expectancy of people who swap from using a car to riding a bicycle on a regular basis will increase by 3 14 months because of the physical activity benefits. This far outweighs any reductions to their life expectancy from inhaling air pollution (0.8 4 days lost) or road traffic injuries (5 9 days lost) 33. The health benefits of an adult switching to cycling for regular commuting have been monetised based on a valuation of a year of human life (figure 10). This is common practice for comparing medical treatments. It shows 1,300 per year of health benefits from physical activity compared with a 20 loss from the additional exposure to air pollution. It is also estimated that there would be a 30 gain for the general public from reduced pollution. Figure 10: Typical changes in mortality cost per person who switches from driving to cycling, /yr Health gain from cycling Public gain from reduced pollution Pollution exposure of individual Accidental risk of individual Source: Rabl, R and de Nazelle, A (2012) Improving the health of Londoners: transport action plan 27

28 In older people long-term physical activity is associated with reduced memory loss, reduced risk of osteoporosis and reduced deterioration of physical ability 35 SPOTLIGHT Royal College Street, Camden Royal College Street is a popular north/south route for cyclists in Camden. It has recently been upgraded with wide cycle paths on both sides of the road which are lightly segregated from the motor traffic with planters. This approach to cycle infrastructure is relatively cheap and flexible in accommodating increasing demand for space for cyclists in the future. The road was resurfaced and trees were planted along the pavements so that the experience of being on the street was improved for all road users. 28 Chapter 3 Increasing physical activity Increasing physical activity

29 Tackling obesity London has the highest rate of childhood obesity in the country. Only six out of 10 London children are a healthy weight when they start secondary school 41. For adults, the situation is even more serious 58 per cent of men and 51 per cent of women in London are either overweight or obese 42. This compares to 45 per cent of adults in Italy and the Netherlands, 44 per cent in Sweden and 37 per cent in Switzerland. By 2050, 90 per cent of adults in London are expected to be overweight or obese if no action is taken 43. This means that children in the Capital are growing up in a city where it is normal to be overweight. An obese Londoner can expect to die eight to 10 years earlier than their non-obese neighbour. Obesity causes cancer and heart disease, it limits life choices and increases early disability and costs London more than 4bn a year 44. There is a close relationship between how we travel every day and the risk of obesity. Adults may need to take a minimum of 300 minutes per week of physical activity to prevent weight gain. Travelling on foot or by bicycle is associated with not being overweight or obese. Each additional kilometre walked per day is associated with a 4.8 per cent reduction in obesity risk; conversely each additional hour spent in a car is associated with a six per cent increased likelihood of obesity 45. Use of public transport has also been associated with maintaining a healthy weight and with weight loss because of the walking involved in using public transport 46, while car use is associated with being obese 47. Improving the health of Londoners: transport action plan 29
30 What action is TfL taking? People walk and cycle more if their experience is pleasant, relaxed, convenient and time efficient. Levels of walking and cycling are directly related to the speeds and volume of motor traffic 36. Provision of public transport also contributes significantly to levels of walking in London 37. Walking is more common in neighbourhoods geared towards public transport use rather than private car use 38, and people can achieve recommended physical activity levels from walking as part of public transport trips 39. Conversely, car ownership and use are associated with lower levels of walking and cycling 40. The Mayor s Vision for Cycling sets out plans for creating streets fit for cycling with a significant investment of 913m over 10 years. TfL s Business Plan sets out our plans for investment in public transport and London s streets. Sub-regional Transport Plans set out the detailed strategies for investment in public transport in each of London s sub-regions. Delivering the vision for London s streets and roads sets out how we will address the priorities identified by the RTF, including our immediate plans to put RTF recommendations into action and our longer-term commitments to investment in roads and public spaces. The Mayor s Better Streets and London s Great Outdoors programmes have helped transform the Capital s public spaces and street network s since A range of interventions are making streets work and feel better for all, while increasing the vitality and sense of place in communities across the city. 30 Chapter 3 Increasing physical activity Increasing physical activity

31 Improving the health of Londoners: transport action plan 31

32 4. Improving air quality Poor air quality affects the health of every person in London. The impact of poor air quality varies depending on each person s exposure and what other diseases each person is suffering from or vulnerable to 48. We are still learning from emerging research about the impacts of air quality on health and it can be difficult to show a clear link between an individual s health and air quality. However, at a population level it is easier to measure the impacts. In Greater London it is estimated that in 2008 there were over 4,000 deaths brought forward attributable to long-term exposure to small particles (defined below). This amounts to between six and nine per cent of all deaths, varying by borough. This figure is calculated by adding together the life lost by those affected, which averages 11.5 years 49. The pollutants The main air pollutants of interest in London are small particles (PM10 and PM2.5) and nitrogen oxides (NOx). Small particles Small particles are defined by their diameter and often grouped as being below 10 micrometres in diameter or below 2.5 micrometres in diameter 50. Sixty per cent of Figure 11: Concentrations of particulate matter (PM10) in London, Chapter 4 Improving air quality
33 Key health impacts Cardiovascular disease Respiratory diseases including chronic obstructive pulmonary disease and asthma Some cancers Key groups affected Children Older people People living with a chronic condition such as diabetes, asthma, chronic obstructive pulmonary disease and heart disease small particles come from road transport, 45 per cent come from tyre and brake wear and 15 per cent from exhaust emissions 51. The EU sets standards for small particles (PM10) emissions. These are called limit values. There has been significant progress to date and these standards are now widely met in London (figure 11). But PM2.5 in London is still associated with around 4,000 deaths brought forward and there is no safe level for this pollutant, so further reductions are needed. NOx Sixty-three per cent of NOx are believed to come from ground-based transport which is mostly road transport (figure 12) 52. Nitrogen dioxide concentrations (arising from NOx emissions) still widely exceed EU limit values on roads in inner and central London. This is similar to other large, densely-built conurbations in Europe (figure 13). 3% Other 3% Part A 12% Rail <1% Motorcycles Cars 28% Taxis 3% 12% NRMM Construction LGV 9% 9% Nondomestic gas HGV 18% 7% Domestic gas Bus and coach 16% 63% Ground based transport 12% Ground-based aviation Shipping 1% Figure 12: Basic source apportionment for NOx emissions in London Improving the health of Londoners: transport action plan 33
34 Car occupants are typically exposed to higher levels of air pollution than cyclists or pedestrians 75 Ozone Ground level ozone is another pollutant for which concentrations are at times high enough to impact upon human health and which causes summer smogs during hot, sunny periods. However, formation of ozone can take place over several hours or days and may arise from emissions many hundreds, or even thousands of kilometres away. For this reason ozone is not considered to be a local pollutant 53. The long-term objective for ozone is 100 micrograms per metre cubed (μg/m 3 ) over an eight hour mean 54. Health impacts of air quality Exposure to particles in the short term (days to months) causes: Increases in hospital admissions and premature deaths Worsening of symptoms in those with respiratory diseases Increases in the number of GP visits 55 Exposure to particles in the long term (years) causes deaths from cardiovascular and respiratory diseases 56. Figure 13: Concentrations of nitrogen dioxide (NO2) in London, Chapter 4 Improving air quality

35 Air pollution exacerbates asthma in people who already suffer from it. Also, some new cases of asthma in susceptible individuals might be caused by exposure to traffic pollution from busy roads, particularly roads carrying high numbers of heavy good vehicles 57. There is some evidence of pre-natal exposure to air pollution being associated with adverse outcomes of pregnancy including low birth weight and an increased risk of chronic diseases in later life 58. Fumes from diesel engines can cause lung cancer and possibly tumours of the bladder 59. The negative impacts of nitrogen dioxide (NO2) are difficult to separate from the effects of particulates and research is ongoing to understand the specific health impacts of NO2 60. Very high concentrations of NO2 can cause constriction of the bronchioles, increased sensitivity to allergens and an increase in deaths rates but these occur at much higher concentrations than those found in outdoor air 61. Short-term exposure to ozone irritates the airways and reduces lung function. The effects from long-term exposure are less well known 62. Figure 14: Illustration of local-scale variability in air quality NO2 concentrations around Aldwych gyratory, central London Improving the health of Londoners: transport action plan 35
36 In the UK 5.4 million people are currently being treated for asthma, costing the NHS around 1bn a year 76 Air quality a London issue People in the Capital are disproportionately affected by poor air quality compared with other parts of England 63. Poor air quality is an issue in large, densely concentrated cities across the world. London has a particularly acute problem within the UK because of its size and density. Within the Capital, inner London has greater concentrations of NO2 than outer London reflecting its relative density 64. Air quality a transport issue Air quality is not just a road transport issue. Industry and domestic boilers are also significant sources, and vehicles that are not on roads such as those on building sites are increasingly recognised as being an important source of pollutants. However motorised road traffic remains a key source, contributing 60 per cent of PM10 and 47 per cent of NOx emissions in London 65. The increase in diesel vehicles on London s roads has been a significant contributor to air quality issues. On average a diesel vehicle will emit 22 times as much particulate matter and at least four times as much NOx as a petrol equivalent 66. Patterns of air quality Spatial The highest background concentrations of air pollutants are in central and inner London where the density of roads and other activity is greatest. Concentrations are highest in the carriageway and decrease rapidly with distance from it (figure 14). High densities of slowmoving motor traffic such as at junctions are particularly associated with poor air quality 67. Temporal Pollution concentrations reflect motor traffic volumes with a delay of a few hours as it takes time for pollutants to disperse, so peaks occur around the middle of the day and evening. Air quality is also seasonal reflecting changes in the prevailing weather. When there is a high pollution episode in London it is usually as a result of changes in the weather that affect generally consistent levels of local emissions. However, transboundary pollution (emitted elsewhere and transported in the atmosphere) is also an important contributor to poor air quality. Reducing emissions will result in fewer days when pollution exceeds EU limits Chapter 4 Improving air quality

37 Exposure Individuals who live or work near busy roads are at a particularly high risk of exposure to the health harms of air pollution 69. The same is true of those who spend longer in motor traffic. Car occupants are typically exposed to higher levels of air pollution than cyclists or pedestrians. This is partly because cyclists and pedestrians can use quieter streets with less traffic, which are not so heavily polluted 70. A 2011 study conducted by Sustrans found that the air quality on London greenways (safe, quiet routes through parks, green spaces and streets with less traffic) was significantly better than on adjacent busy roads 71. Congestion is also strongly associated with air pollution, with pollutant levels generally higher inside vehicles than in ambient air 72. People living in more deprived areas are exposed to higher levels of air pollution, often because their homes are situated close to roads with higher concentrations of emissions, such as inner city areas 73. Deprived communities also suffer greater problems with air pollution-related death and sickness. Individuals in deprived areas experience more adverse health effects at the same level of exposure compared to those from less deprived areas. This is partly because they are more likely to have underlying cardiorespiratory and other diseases 74. Improving the health of Londoners: transport action plan 37

38 SPOTLIGHT Bus engine cleaning programme TfL is reducing emissions from London s bus fleet. This will improve air quality and benefit health. Buses used to be known for their high levels of exhaust emissions. However a programme of fitting filters to our buses means their total emissions have dropped from over 200 tonnes in 1997 to 17 tonnes in 2013 as the filters remove up to 90 per cent of particulate matter. Since 2008 more than 500 hybrid buses have been rolled out across the London bus fleet, making it the largest hybrid bus fleet in Europe. Despite these advances buses still account for around 4,500 tonnes of NOx each year that s 25 per cent of all NOx emitted by road transport in London, even though they account for only 0.2 per cent of all vehicles. To tackle this further the Mayor wants to increase the number of hybrid buses to 1,700 by 2016 (including 600 New Routemaster buses), retrofit a further 900 older buses to reduce their NOx emissions by up to 90 per cent, retire a similar number of the oldest buses and replace them with the latest ultra-low emission buses, and focus the cleanest buses on routes through London s air pollution hotspots. 38 Chapter 4 Improving air quality

39 SPOTLIGHT Zero Emissions Network, Hackney Hackney has introduced a Zero Emissions Network in Shoreditch (ZEN-S). This initiative offers local businesses support to reduce their emissions and as a result contribute to improving air quality. The support includes: Free trials of electric cars and cargo bikes for deliveries Discounts on car club membership and low-emission taxi use for business travel Travel planning advice to help staff to travel by bicycle, on foot or by public transport Photo: Gary Manhine A strength of this initiative is the way the network enables businesses to learn from each other and work together to improve their local area. The initiative is now expanding to include parts of Tower Hamlets and Islington. Improving the health of Londoners: transport action plan 39
40 What action is TfL taking? The measures we are taking to improve air quality include: Tightening the Low Emission Zone standards for HGVs, buses and coaches and introducing new standards for large vans and minibuses. Around 150,000 vehicles needed to take action to meet these standards when they came into effect in January 2012 Creating Europe s largest fleet of hybrid buses, with 330 already on the road Retiring over 2,600 of the oldest, most polluting taxis by introducing London s first taxi age limits Record investment in cycling to encourage less polluting forms of travel Using the planning system to require all new development to be air quality neutral Retrofitting over 60,000 homes and public buildings with energy efficiency measures which reduce their emissions Further measures to be implemented up to 2020 include: A new Ultra Low Emission Zone for central London, subject to a feasibility study Retiring the remaining 900 oldest Euro III buses in TfL s fleet and replacing them with super-clean Euro VI buses at a cost of 18m Accelerating the roll-out of hybrid buses, with 1,700 to be on the road by 2016, including 600 of the iconic New Routemasters which are the cleanest and greenest bus of their type. This will be equivalent to around 20 per cent of TfL s bus fleet New measures to reduce emissions and clean up construction sites Retrofitting a further 24,000 homes, public buildings and schools with energy efficiency measures Introducing a new 20m Mayor s Air Quality Fund to support the boroughs in tackling local air quality hotspots 40 Chapter 4 Improving air quality

41 Improving the health of Londoners: transport action plan 41
42 5. Reducing the impacts of road traffic collisions Road traffic injuries in London are at their lowest levels in 30 years 77. The majority of injuries from road traffic collisions are minor 90 per cent of all injuries (26,452 in 2011). Less than one per cent of all collisions result in someone being killed (159 in 2011). However this still means that in 2011, there were 2,805 people killed or seriously injured (KSI) from road traffic collisions in London 78. The vast majority of these are avoidable and the health impacts of road traffic collisions go beyond the direct injuries and deaths. They also affect the families and friends who are bereaved or supporting victims with long-term injuries. Victims are also at risk of post-traumatic stress disorder. The overall decline in serious injuries and deaths reflects improved outcomes for car occupants, but vulnerable road users such as pedestrians and cyclists make up an increasing proportion of those injured (80 per cent) 79. Walking accounts for 21 per cent of daily journeys but 35 per cent of KSIs, motorcyclists for one per cent of daily journeys but 21 per cent of KSIs, and cyclists for two per cent of daily journeys but 20 per cent of KSIs 80. The group with the largest number of KSIs are adult pedestrians aged This reflects that walking is the most common of the vulnerable modes of travel and that working age adults make up a large proportion of the pedestrian population. Road traffic injuries account for a very small proportion of all poor health and deaths in London and the risk of being involved in a collision is extremely small and much smaller than generally perceived to be (figure 15) 82. However fear of road traffic injury is the leading reason people give for not walking or cycling and one that parents give for restricting the independent mobility of their children 83. Although it is less obvious, many people suffer avoidable ill health and death because they do not keep physically active 84. Road traffic collisions and fear of road danger among pedestrians and cyclists are therefore important Cause of death Years of life lost under 75 years of age Percentage of all years of life lost under 75 years of age All causes 6,896, % Cancers 2,363, % Circulatory diseases 1,504, % Land transport injuries 290, % Figure 15: Years of life lost from road traffic injuries compared with other major causes in the UK 42 Chapter 5 Reducing the impacts of road traffic collisions
43 Key health impacts Physical injuries Psychological distress Key groups affected Pedestrians Cyclists Motorcyclists health issues in London because they prevent people from keeping active and healthy. Where do collisions happen? More serious road traffic collisions tend to occur on streets with faster moving traffic and larger vehicles 85. The 580km of London s strategic road network that are managed by TfL (the TLRN) constitute only five per cent of London s road length but carry 30 per cent of all traffic 86. Thirty per cent of all road collisions in London occurred on the TLRN in Over 75 per cent of all collisions involve a car and 74 per cent occur at or within 20 metres of a junction 87. The role of speed Speed is the single most important factor in determining the outcome of a collision 88. It affects the risk of a crash occurring: the greater the speed, the less time there is to prevent a collision. In addition, the greater the speed, the more severe the consequences once a crash has occurred. The speed that a collision occurs Fatality risk% Collision speed km/h Pedestrial or cyclist Side collision Frontal or hard object collision Source: Wramborg, P (2005) Figure 16: Risk of death at different collision speeds for pedestrians, cyclists and vehicle occupants. Improving the health of Londoners: transport action plan 43
44 Ninety-two per cent of Londoners feel cyclists are vulnerable to other road users and 90 per cent believe the volume of motor traffic makes people afraid to cycle 95 at will have different consequences depending on whether it involves a vulnerable road user or motor vehicles (figure 16). Pedestrian safety at all ages is inversely associated with traffic speeds and the number of miles of main roads 89. The average speed of motor traffic in London is below 20mph (figure 17) 90. This might suggest that speed is not an important factor to consider in improving road safety. However average speed data masks the speeds that vehicles travel at between junctions so can be misleading. Even when travelling at very low speeds vehicles can seriously injure vulnerable road users. Wider impacts of road danger on vulnerable groups Road traffic injury is the leading cause of death among children aged five to 14 years 91. Children s brains are not sufficiently developed to be able to assess traffic situations. In Speed mph Central Inner Outer Figure 17: Motorised traffic speeds in London 44 Chapter 5 Reducing the impacts of road traffic collisions

45 particular, children cannot assess and respond appropriately to high volumes of motor traffic, high speeds and limited visibility until they are in their teens 92. Older people are also more vulnerable to injury and death as their bodies are more fragile. They are more likely to have sensory impairments and can be less able to cope with complex traffic situations due to their greater physical frailty. This can result in them reducing their mobility and becoming socially isolated 93. Forty-five per cent of adults aged over 70 have mobility difficulties compared with five per cent of year olds 94. This impacts on their physical and mental health and can result in a greater burden for health and social care services. SPOTLIGHT Fleet Operators Recognition Scheme (FORS) TfL runs FORS to encourage good practice among lorry and van operators in London. It provides comprehensive training to drivers and transport managers in changing management practices and driver behaviour to increase awareness of road safety issues, particularly in relation to pedestrians and cyclists, pictured. We expect all fleet and contracted fleet operators to be accredited to FORS bronze. Additional health benefits arise from the driving habits instilled by this scheme which help to reduce noise and air pollution from braking and exhaust emissions. Improving the health of Londoners: transport action plan 45

46 Safety cameras on London s roads help prevent around 500 deaths and serious injuries each year 96 Fear of injury Fear of being injured contributes to stress and can cause people to restrict their travel 97. This can result in people losing the benefits of social interaction, not accessing services, and children not playing outdoors 98. The benefits of being physically active as part of the daily routine by walking and cycling shorter journeys and stages of journeys (eg walking to the bus stop) far outweigh the risks of road traffic injury. For example over 50,000 people die in the UK each year from coronary heart disease related to insufficient physical activity compared to around 100 who are killed on the road when cycling 99. However the perception of many people in London is that the risks of road danger are much higher than they actually are Chapter 5 Reducing the impacts of road traffic collisions
 on Islington s roads. In 2012 there were 122 KSIs.")
47 SPOTLIGHT Borough-wide 20mph scheme, Islington Photo: Lucy Saunders Islington is the first borough in London to introduce 20mph on all of its roads. A leading reason for this is that every year around 100 people are either killed or seriously injured (KSI) on Islington s roads. In 2012 there were 122 KSIs. As speed is a primary cause in road traffic collisions, the reduction in vehicle speeds is expected to result in reduced casualties. In addition to signage on streets, the borough has also been introducing physical measures to improve the safety and attractiveness of the pedestrian environment. This policy is also likely to reduce health inequalities and increase levels of walking and cycling in the borough so it can be seen as a holistic approach to improving the health of residents and visitors to the borough. Improving the health of Londoners: transport action plan 47
48 What action is TfL taking? Safe Streets for London: The Road Safety Action Plan for London 2020 sets out our actions for implementing the internationally recommended Safer System approach to reducing injuries and deaths on London s roads. These include: Developing action plans to protect London s most vulnerable road users: pedestrians, cyclists and motorcyclists Identifying and improving high-risk locations on the TfL road network with effective engineering solutions that focus on protecting pedestrians, cyclists and motorcyclists Providing London boroughs with the funding, knowledge and information to reduce casualties Applying engineering and technology to maximise speed limit compliance and reduce speedrelated casualties Working with boroughs to support the introduction of 20mph zones and limits where appropriate Improving construction and logistics safety using procurement and planning processes and trialling work-related road safety Managing roadworks to minimise the risks to pedestrians and cyclists 48 Chapter 5 Reducing the impacts of road traffic collisions
49 6. Reducing noise Road traffic noise is a major cause of noise pollution in London 101. Noise is created by vehicles tyres interacting with the road, engines, exhaust systems, transmission and brakes. In vehicles travelling at higher speeds the main source of noise is tyres, at lower speeds it is engine noise. Engine noise has reduced over the past two decades but tyre noise has not reduced to the same extent 102. The direct health impacts of noise pollution include sleep disturbance, stress, anxiety, high blood pressure, poor mental health and school performance, and cognitive impairment in children 103. Risk of cardiovascular disease increases significantly when noise levels exceed 60 decibels 104. Noise levels tend to exceed 60 decibels on urban streets and near transport interchanges on many roads in London. Socially disadvantaged people are more likely to live near busier roads so are at greater risk of the negative effects of noise pollution 105. Road traffic noise also has an indirect impact on health. It can discourage people from walking, cycling and other activities such as shopping and socialising. This impacts on their health by reducing physical activity and social interaction as well as affecting local shops, businesses and other services. Noise can even result in people not using the rooms in their houses that face onto the streets. The Department for Environment, Food and Rural Affairs (Defra) has estimated that the social cost of road traffic noise is 7bn 10bn per year 106. SPOTLIGHT Green barrier on West Cromwell Road, Kensington & Chelsea Green infrastructure comes in many forms and, as well as having a modest impact on reducing noise, can serve multiple other health-enhancing roles including improving air quality, providing shade and shelter, reducing localised flooding, urban cooling and boosting mental wellbeing. West Cromwell Road is a busy stretch of the A4 which suffers from poor air quality and high levels of road traffic noise. To ameliorate these issues, a new planting scheme will be installed to serve as a dense, green, noise-reducing and air particulate-trapping barrier. The streetscape will also be improved to enhance the pedestrian and cyclist experience so that, as well as reducing noise, this scheme is expected to increase walking and cycling and improve air quality. Improving the health of Londoners: transport action plan 49
50 Key health impacts Mental health Blood pressure Child development Key groups affected People with existing mental or physical health problems are the most likely to be sensitive to traffic noise 109. Figure 18: Map of Important Areas (lilac) and First Priority locations (purple) in London Managing road transport noise Defra has produced noise maps covering London under the European Noise Directive. This requires member states to produce action plans for addressing noise in the context of sustainable development. Noise maps are produced for rail and roads, but the larger impact in London is from roads due to their number and the amount of time people spend on them. Defra has identified the areas on London s main roads where the highest numbers of people are exposed to the highest levels of road traffic noise. These are known as Important Areas. From these, First Priority locations have been identified. There are 128 First Priority locations on the Transport for London Road Network (TLRN) (figure 18). For each of these, we (as highway authority) have recorded the measures undertaken that help reduce road traffic noise and the proposed measures that might be taken if funding were made available. 50 Chapter 6 Reducing noise

51 Twenty per cent of people in London are estimated to be exposed to noise levels that exceed 60 decibels outside their home 107 SPOTLIGHT TfL low noise road surfaces We use low noise surface materials, called Thin Surface Course Systems, on the TLRN. These give a reduction in noise that traditional asphalt mixes do not. Over 80 per cent of the TLRN is surfaced with these negative-textured materials which absorb noise and are able to withstand heavy traffic flow. We maintain links with worldwide highway industry innovations and trial new materials to assess their suitability for the TLRN. What action is TfL taking? Mayor s Transport Strategy This sets out our overarching strategy which includes reducing the share of private motorised journeys on London s roads from 43 per cent of all journeys to 37 per cent by It also covers plans for reducing noise such as introducing quieter buses and using lower-noise road surface materials wherever viable. Fleet Operator Recognition Scheme (FORS) This TfL scheme provides comprehensive training to drivers and transport managers to help improve driving styles. This can reduce noise as well as excessive fuel consumption, braking, exhaust emissions and road danger. Delivering a Road Freight Legacy This TfL programme is exploring the possibilities of re-timing collections and deliveries to reduce noise, and improve safety and air quality. By late 2014 we aim to be undertaking a number of long-term trials and to have produced driver training and other guidance materials to help boroughs and others best enforce against noise disturbance. Additional trials will take place to test new vehicle technology and vehicle modifications to see if they achieve the intended results. Health, Safety and Environment report This sets out our work in a number of areas relevant to the health of Londoners including noise, air quality and carbon reduction. Improving the health of Londoners: transport action plan 51

52 52 Chapter 7 Improving access and reducing severance

53 7. Improving access and reducing severance Travel enables people to access employment, education, shops, recreation, friends and family, and health and social services. This can be beneficial for health and having a strong social network enables people to remain resilient in the face of life s challenges 110. Access describes the ease of reaching key services, which is different from mobility a measure of movement and distance travelled. Access depends on affordability, ease of use and perceptions of the acceptability of different types of transport 111. Access is also different from disabled accessibility, a term used to describe the ability of a disabled person to use transport and its infrastructure. It is important to ensure that the transport network is accessible to all so as not to exclude people from any of the protected characteristics as referred to in the Equality Act (2010). This way everyone has the same access to services and the ability to complete the journeys they wish to. An individual s perception of their own access will depend on the trips they would like to or have to take, the type of transport they would like to use and its affordability, acceptability, convenience and swiftness. Fear of injury (covered in chapter four) and crime can also be factors in access, and these vary by travel type, location and time of day, time of year and weather. Fear of crime can inhibit walking and cycling along certain routes and to certain locations and is an important factor to consider Cycling Public transport Figure 19: Fastest mode of transport in London, Bromley Improving the health of Londoners: transport action plan 53
54 Key health impacts Mental wellbeing and personal resilience Stress and social isolation Key groups affected People on low incomes Disabled people and carers Children and young people People more dependent on walking and using public transport for travel 128 in promoting active travel 112. Perceived and actual safety on streets can relate to whether there are other people using the environment, lighting, how well maintained the area is, openness of the space and potential hiding places for assailants 113. What is access like in London? Access to roads in the Capital is almost universal. The vast majority of London s roads have pavements with drop kerbs at almost all junctions which means they are also accessible to pedestrians. Although acceptability of walking these routes will vary and they may not all be suited to disabled people, longer journeys, and people with heavy loads etc. Pedestrians are very sensitive to even very small diversions in their journeys, and weather conditions, noise, aesthetics, perceived safety, wayfinding and many other factors will influence a pedestrian s perception of their access 114. People can cycle on the vast majority of roads in London and cycling can be the Hillingdon Bexley Hounslow Havering Sutton Harrow Croydon Enfield Redbridge Greenwich Commuting car mode share Barking& Dagenham Ealing Barnet Bromley Kingston-upon-Thames Waltham Forest Merton Richmond-upon-Thames Newham Portion of households with poor PTAL rating Brent Lewisham Haringey Lambeth Tower Hamlets Southwark Wandsworth Hammersmith & Fulham Camden Hackney Kensington & Chelsea Islington Westminster Figure 20: Relationship of car mode share for commuting trips to percentage of locations within borough having a poor or very poor PTAL rating 54 Chapter 7 Improving access and reducing severance

55 fastest and most reliable form of transport for shorter journeys. For example, figure 19 shows the large area of southeast London in which it is quicker to travel by bicycle than public transport to reach Bromley. However an individuals perception of their access by bicycle will depend on how they view the acceptability and safety of the route, availability of secure bicycle parking, and the physical fitness and skills required among other factors 115. Access to public transport can be measured using Public Transport Accessibility Levels (PTALs) scores. There is a strong relationship between good PTAL scores and low levels of car use for commuting to work 116. The poorest PTAL ratings tend to be in outer London (figure 20). Public transport tends to provide faster journeys for longer radial journeys to and from the centre of London. It can be quicker to use a car for more local journeys, between pairs of locations which are not directly served by public transport and for journeys east-west across London 117. Comparing public transport with car use for access to the City, for example (figure 21) shows that across London there are variations in whether it is quicker to access locations by car, public transport or whether there is no difference. Figure 21: Comparison of travel times to City of London, highway vs public transport Improving the health of Londoners: transport action plan 55
56 People with strong social networks have a four times lower risk of death from any cause than those with a weak social network 126 These issues can mean that people use cars instead of active modes of transport (walking, cycling and public transport) which would be better for their health. Individuals perceptions of their access by car will depend on affordability, ability to park, journey time and other factors. Access to healthcare It is estimated that around five per cent of trips (one million per day) in London are related to the healthcare sector. Travel and accessibility are of great importance to the public, patients and staff, particularly when changes to healthcare provision are being discussed. The way that healthcare is delivered changes over time, and this means that National Health Service (NHS) organisations in London develop plans for how and where they provide healthcare services. These can attract scrutiny from the media, politicians, patient advocacy and other groups. Transport and journey times are often a key focus for patients and service users. It is important that vulnerable groups in particular can access healthcare services easily. Wherever possible, transport should be taken into account as early as possible when considering changes to healthcare provision. We work with the NHS to support this and share best practice and ensure that transport and health strategies are mutually supportive. 56 Chapter 7 Improving access and reducing severance Our work includes: Providing advice to NHS colleagues on how to analyse changes in journey time and trip rates and how to most appropriately display relevant information as part of a consultation or public examination Providing data from our Health Service Travel Analysis Toolkit (HSTAT) to enable the NHS to produce travel time analyses. Alongside analysis of travel volumes this will help inform and shape any changes to the delivery of healthcare Sharing best practice on the presentation of data, methodology, and checking the way travel data is presented Providing relevant expertise that may be needed during the reconfiguration, for example data modelling, bus planning, stakeholder engagement, and travel planning information and guidance We published Transport Planning for Healthier Lifestyles to explain the tools in more detail and give examples of NHS organisations that have used them and the results that they delivered. We also produced Transport Planning for Health working with the NHS on health service reconfigurations, a set of guidance notes which are available on our website. Once the transport analysis has been completed, access implications may need to be discussed with us and it may be necessary to consider changes to existing service provision, such as extending or changing bus routes.
57 SPOTLIGHT Health for North East London bus planning Between October 2010 and March 2011, the Health for North East London acute services reconfiguration programme set up a travel advisory group (TAG). It comprised local authorities, TfL, NHS services, plus public and patient representatives from local involvement networks and the People s Platform. One of the travel issues was bus routes, and the TAG s objective was to gather evidence to inform and support the review and the extension of bus routes into Queen s Hospital in Romford. We explained our route review and consultation processes, and the TAG helped collate the views of stakeholders and the public for future development. Stakeholders expressed a keen interest in improving access to Queen s Hospital. Following our consultation on local bus routes, the 128 service was rerouted in June 2012 to improve links and access to Queen s Hospital. Severance Severance describes situations where destinations which are geographically close cannot be reached easily due to busy wide roads, railway lines or rivers 121. High volume traffic or even light traffic with large goods vehicles or construction vehicles can act as a barrier with health consequences. Severance has implications for access but it also has health repercussions in terms of the psychological impact of traffic on quality of life and social cohesion 122. Social support is needed to promote health and protect people from causes of stress in their lives; this is known as resilience. Low levels of social support are linked to increased death rates 123. Severance is difficult to measure. Sometimes the time it takes to cross a road is used as a proxy. The effects of severance are often measured in terms of reduced social networks and hence reduced personal resilience, or stress caused by the severance. No single measure can encapsulate these varied effects which include restrictions on independence of children and young people, reduced likelihood of active travel, reduced incidental interaction in the street that contributes to social networks and personal resilience, and stress from perceived severance. Improving the health of Londoners: transport action plan 57

58 Reduced social contact is associated with a higher risk of illness and death among older people, more unhealthy behaviours and poorer mental health 127 Children s independent travel Nationally children s independent travel has declined over recent decades. This is partly due to legitimate parental concerns over road danger as motor traffic is a primary cause of serious injuries and deaths among children 118. However, limiting children s independent travel impacts on their development and their mental and physical health, including their ability to maintain a healthy weight 119. In London, free bus travel for children and young people in education or training was introduced in 2005 and extended in A detailed study of the impact on the health of the whole community arising from this policy was conducted. It found that free bus travel offered many health and social benefits for young people and, contrary to the expectations of some, resulted in children walking the same amount as they had done before Chapter 7 Improving access and reducing severance


59 SPOTLIGHT Policing reducing crime on London s public transport SPOTLIGHT Railway arches, Southwark London s transport system is a safe, low-crime environment. This year saw the lowest rates of crime on our public transport network since records began in 2004/05. On the buses, in particular, there were just 8.6 crimes per million journeys in 2012/13, less than half of what it was in 2005/06 when levels peaked and the rate was This success has been driven by a range of initiatives introduced with our police partners. Examples include visible policing with more than 2,500 transport police and community support officers, an extensive CCTV network across the transport system, a problem-solving focus on local crime and disorder issues, targeted police operations, crime prevention and behaviour change campaigns, plus community engagement. Local policing teams focus on problem solving and high-visibility policing, particularly at transport hubs and other busy locations, determining priorities through engagement with staff and passengers. Providing a safe public transport system improves access and reduces severance by enabling people to travel when and where they need to. Streets beneath structures can create severance for pedestrians and cyclists who can feel vulnerable to crime and road danger. In Southwark, innovative and appealing lighting was installed in four street locations beneath railways to make them more welcoming to pedestrians, increase the sense of place and reduce the severing effect of the railway line. Following the improvements pedestrians reported feeling safer and more women were observed to be using the tunnels than before. Improving the health of Londoners: transport action plan 59
60 People living on roads with less traffic have three times more friends and twice as many acquaintances on their street compared with those living on similar streets with heavy traffic 125 What action is TfL taking? Your accessible transport network This sets out our plans for making travel more accessible for disabled people. Single Equality Scheme This sets out our plans to continue improving travel choices, promote equality and enhance access to transport services and employment for all groups who live and work in London. The Right Direction: The Mayor s strategy to improve transport safety and security in London, This strategy includes our actions to reduce antisocial behaviour and crime in the transport system and increase confidence in the safety and security of travelling in London. Transport and healthcare This TfL webpage provides healthcare organisations with a range of tools to support them in planning access to their services, go to tfl.gov.uk. London Plan Supplementary Planning Guidance Shaping Neighbourhoods: Play and informal recreation Page 20 of this document presents the expectation that children will be able to travel actively (and independently where appropriate) as part of their daily routine. Delivering the vision for London s streets and roads Our response to the Roads Task Force sets out specific actions to tackle severance including supporting the roll-out of 20mph on boroughs roads and trialling 20mph on some parts of the TLRN, upgrading street lighting and improving the public realm. Walking route improvements This sets out our programme of key walking route improvements. 60 Chapter 7 Improving access and reducing severance

61 Improving the health of Londoners: transport action plan 61
62 8. Delivering healthy streets the whole-street approach London s streets are a great asset for improving the health of Londoners. The Capital s streets provide the opportunity for millions of people to stay active, to interact with others and to access employment, education, leisure and green spaces. The health benefits delivered by London s streets go far beyond the physical activity that people get walking and cycling in the city, although this is the biggest health benefit and the one with the greatest potential for health improvements in the future. There are many other benefits including cleaner air, less noise, more connected neighbourhoods, less stress and fear and reduced road traffic injuries. These issues are all connected, and to deliver the biggest benefits which come from more walking and cycling we need to ensure our streets are inviting. This means tackling some of the barriers of poor air quality, noise, stress, fear and danger. Indicator Pedestrians from all walks of life People choose to walk and cycle Clean air People feel safe Not too noisy Easy to cross Shade and shelter Places to stop Things to see and do People feel relaxed How it relates to health Everybody needs to be active every day. If the mix of people walking in the street does not include certain groups such as children, older people or those with disabilities then the street environment is excluding some people from staying active. Some people walk or cycle not out of choice but due to poor access by other modes of transport. This can have negative impacts on their health and wellbeing. Success should be measured by people choosing to walk and cycle, rather than levels of walking and cycling. The health impacts of air quality include cardiovascular disease and respiratory disease. People need to feel that they will be safe from injury and crime when they are on the street. Noise has a range of health impacts including stress and high blood pressure. It also discourages people from walking and cycling. If streets are difficult to cross because of physical barriers or traffic, people will be discouraged from using the street, particularly on foot. This can be socially as well as physically restricting. Some people have difficulty moderating their body temperature, and this can put their health at risk in hot weather. Shade is needed on streets to enable people to keep cool. Many people can only walk short distances without taking a rest, particularly those who are older, young, pregnant, injured or who have a disability or health condition such as chronic obstructive pulmonary disease. Providing seating at regular intervals is necessary to enable these people to incorporate much needed physical activity into their daily routine. Street environments need to be stimulating and engaging to invite people to walk and cycle more. This highlights the importance of good urban design and maintenance of public spaces in delivering health benefits. Walking or cycling in the street should not be a stressful experience. If people are not relaxed it indicates that issues such as noise, insufficient space or fear of danger have not been addressed. Figure 22: Ten indicators of a healthy street Source: Lucy Saunders 62 Chapter 8 Delivering healthy streets the whole street approach
63 A whole-street approach is needed to make streets better for health. Many streets in London have one or more characteristics which make them good for health and attractive places to walk and cycle. However it often takes multiple positive characteristics to encourage people out on to the street and to choose to walk and cycle. There is much we can do to positively enhance our streets which will benefit the health of Londoners. How do we know what the key characteristics of a healthy street are? We can assess how healthy each street is by going out and spending time on that street and observing how it looks and feels and is being used by people. There are 10 characteristics of a healthy street which help us to understand what the positive aspects are on each street and which aspects we could do more to improve (figure 22). and do People feel relaxed Thngs to see Clean air People feel safe Source: Lucy Saunders Pedestrians from all walks of life Not too noisy Easy to cross People choose to walk and cycle The elements that make a street good for health are generally the same as those needed to make a street good for the local economy, community and environment. So working towards delivering healthier streets reinforces our work towards a range of other goals. Shade and shelter Healthy streets and the Roads Task Force (RTF) We know that we can do more to improve the experience of being on London s roads. When we asked Londoners how satisfied they are with the quality of streets, pavements and public spaces the mean score they gave was 65 out of We also know that there is more we can do to improve the walking and cycling experience. Walkers and cyclists rate their journey experiences less positively than bus, Tube Places to stop Figure 23: Indicators of a healthy street environment Improving the health of Londoners: transport action plan 63
64 and rail users, of whom over 80 per cent are satisfied or very satisfied 130. We are working with boroughs to deliver street improvements through programmes such as Better Streets and London s Great Outdoors. The RTF, established by the Mayor in July 2012, took a strategic overview of the road network and recommended major investment in London s roads over the coming years 131. In July 2013 we published Delivering the vision for London s streets and roads which sets out how we will begin to deliver the recommendations of the RTF. All these initiatives provide great opportunities to improve the health of Londoners. Every street is different and has different functions A key tool for understanding the diversity of streets in London is the Street Family matrix (figure 24) which categorises streets by their place and movement functions. This needs to be considered when assessing how to make our streets healthier. Different types of streets will be suited to different types of measures. As a result there is no definitive list of specific features needed on every street. For example a quiet residential street is unlikely to need traffic light controlled pedestrian crossings to make them easy to cross but a very busy arterial road may well need this type of feature (figure 24). Health inequalities Health inequalities are unfair differences in health between people. Not only are they unfair on those groups who are disproportionately negatively affected, but also the greater the inequalities between people, the worse everyone in society fares 132. So it is in everyone s interests to reduce inequalities, but often our efforts to improve health can inadvertently increase inequalities as the most healthy and able groups are most likely to take up opportunities to be healthier 133. This can be seen in the patterns of groups taking up cycling in London. Young, fit and healthy men are disproportionately over-represented among cyclists while women, children and older people and those from disadvantaged backgrounds are less likely to cycle 134. We can reduce inequalities while improving the health and wellbeing of all by making positive changes to our street environments and by prioritising those streets which currently pose the greatest health threats in terms of noise, air pollution and road danger 135. Each of the previous chapters in this report identified key groups affected. People who are already disadvantaged by physical infirmity, low income, low levels of resilience and lower levels of control over their lives tend to spend most time on the more hazardous streets as vulnerable road users. Meanwhile the people who are in good health with greater financial security, resilience and control over their lives spend less time as vulnerable road users on the more hazardous streets 136. This can result in widening the inequalities still further. However, although improving street environments benefits everyone, it has the greatest impact on the most disadvantaged people, and therefore helps to reduce inequalities. 64 Chapter 8 Delivering healthy streets the whole street approach

65 Figure 24: The RTF s Street Family Improving the health of Londoners: transport action plan 65


66 SPOTLIGHT Venn Street, Lambeth Before After Venn Street in Lambeth was upgraded in 2011 with decluttering, new paving and repositioning the on-street parking. The space is now used flexibly so that at weekends vehicle access is restricted to enable a lively street market to take place. 66 Chapter 8 Delivering healthy streets the whole street approach
67 What action is TfL taking? Delivering the vision for London s streets and roads Our response to the RTF sets out how we will begin to address the priorities identified by it. London Cycling Design Standards This is a manual of procedures and techniques for designing better infrastructure for cycling, a compendium of best practice, and a guidance document to inform the development of programmes and projects that promote an integrated approach to cycling as part of sustainable transport policies. Better Streets Delivered This showcases completed schemes across London which demonstrate a healthy street approach. Improving the health of Londoners: transport action plan 67


68 SPOTLIGHT Station Road, Harrow Climate change Climate change has been identified as the biggest global threat to public health. Transport has an important role in mitigating and adapting to climate change. Creating streets that are good for health can also deliver benefits for the environment and ways of tackling climate change, such as: Green infrastructure (urban greening) improves mental wellbeing and reduces stress 137 Station Road in Harrow used to be part of a confusing one-way bus system with heavy traffic. An upgrading programme has returned one-way streets to two ways for buses, renewed the paving, removed clutter and put in new lighting, bins, benches and trees. It is now a much more accessible space for pedestrians, particularly those who are older, young or disabled people. Sustainable urban Drainage Systems (SuDS) introduces green infrastructure and helps to reduce run-off Introducing electric and other low-carbon vehicles reduces CO2 emissions, air pollution and noise pollution, although not physical inactivity or road danger Reducing car travel and increasing walking and cycling reduces CO2 emissions and also delivers the physical activity benefits and can reduce road danger 68 Chapter 8 Delivering healthy streets the whole street approach

69 Improving the health of Londoners: transport action plan 69

70 9. Our action plan, new ways of working and partnerships We are adopting new ways of working. We recognise that improving health is a core part of what we do and we need to think about the potential to improve health through all our work. We commit to taking action so that by 2017 we more explicitly recognise and demonstrate our role in improving the health of Londoners. To deliver these actions we will need to work differently with our stakeholders. For example, we will work more closely with the public health community and support joint working between public health and transport professionals. However in the context of a changing population, we cannot tackle the huge health challenges faced by London alone. A wide range of stakeholders need to align and work together. 70 Chapter 9 Our action plan, new ways of working and partnerships
71 TfL actions: Ten steps to new ways of working New ways of working with our internal stakeholders Action 1 Expected outcome Action 2 Expected outcome Action 3 Expected outcome Action 4 Expected outcome Action 5 Expected outcome Action 6 Expected outcome We will quantify and where possible monetise the health impacts of our projects and policies. We will use the World Health Organization Health Economic Assessment Tool (WHO HEAT) in our business case development processes We will support our partner agencies in using WHO HEAT to assess proposals and evaluate activities Our business cases will more accurately reflect the monetary benefits of measures which increase physical activity levels. We will explicitly build health into the development and assessment of policies and projects. We will ensure that health impacts are a central part of our Strategic Assessment Framework Our policies and projects will have a more positive impact on health. We will evaluate the health impacts of our programmes. We will start by evaluating the delivery of the Mayor s Vision for Cycling We will share our evaluation methodology and results with other stakeholders We will develop an understanding of how we can maximise the health benefits of our policies and programmes and apply this to our future work. We will assess what we are doing against the public health evidence base. We will use this to ensure our actions are evidence based wherever possible Where evidence is lacking we will contribute by publishing our evaluations Our policies and practices will be effective in improving health. We will strengthen our Health Impact Assessment processes to ensure that we are identifying opportunities to improve health as well as mitigate potential harms. We will encourage our partner agencies to work with us to realise the improvements that can be made when new schemes are delivered The Health Impact Assessment process will deliver tangible improvements to health and will serve as a catalyst to other transport plans delivering health improvements. We will support staff to be more physically active as part of their daily lives and daily travel through walking and cycling and using public transport. We will promote active travel amongst our staff through our Health Improvement Plan lead by our occupational health service We will encourage other organisations public, private and third sector to do the same through our business engagement programme The health of TfL s staff and other workers in London will improve from being more physically active. Improving the health of Londoners: transport action plan 71
72 TfL actions: Ten steps to new ways of working cont. New ways of working with our external stakeholders Action 7 Expected outcome Action 8 Expected outcome Action 9 Expected outcome Action 10 Expected outcome We will support boroughs to improve the health of their populations through their transport plans and investment. We will ask boroughs what support they would like from us to enable them to build relationships between transport and public health We will encourage boroughs to align their health and transport plans, indicators and investment through our reporting and bidding mechanisms We will ensure that our policies and investment have positive health impacts and thereby help boroughs to ensure that theirs also do We will disseminate to boroughs our analytical work which supports the alignment of transport and health improvement The important role of transport and public realm in improving the health of Londoners will be explicitly recognised. We will work with public health intelligence specialists and academics. We will use analysis to better understand our role in reducing health inequalities We will use demographic and health projections data to help us plan for meeting the future health needs of Londoners We will translate research findings into our policy and practice Our policies and plans will reflect the transport and health research findings and help to ensure London s transport system supports our changing population and reduces inequalities. We will work with the NHS to encourage travel analysis in the earliest stages of planning for changes to healthcare provision. We will continue to provide advice and data from TfL s Health Service Travel Analysis Toolkit (HSTAT) to NHS colleagues, in how to analyse changes in journey time and trip rates and how to most appropriately display relevant information as part of any consultation or public examination We will continue to provide expertise during healthcare reconfiguration planning such as data modelling, bus planning, stakeholder engagement, and travel planning information and guidance The planning process for making changes to healthcare provision will include travel considerations at the earliest stages to ensure decision making is based on accurate travel data analysis and dialogue with TfL. With the Greater London Authority (GLA) we will urge central government to support our role in increasing the physical activity levels of Londoners. In particular we will engage with the Department for Transport, the Department for Communities and Local Government, the Department of Health and Public Health England The national government departments will recognise the importance of active travel as a shared agenda and will support London in delivering our ambitious targets for increasing active travel. 72 Chapter 9 Our action plan, new ways of working and partnerships
73 How we will measure progress We will assess the progress in making London s streets better for health with the following indicators: Impact Physical activity Air quality Road traffic collisions Noise Access and severance Healthy streets Measure Percentage of trip stages walked or cycled Nitrogen dioxide (NO2) and particulate matter (PM) on-street monitoring Reduction in killed or seriously injured (KSI) casualties from the average baseline Average rating of transport related noise Access to opportunities and services (ATOS) score Average rating of perception of the urban realm Improving the health of Londoners: transport action plan 73
74 10. Tools and decision making There are a number of tools and resources available for understanding and demonstrating the role of transport in health. Tools for understanding the health impacts of transport in London Owner Resource What it is for World Health Organization London Health Observatory Public Health England Healthy Urban Development Unit (HUDU) Health Economic Assessment Tool (HEAT) for walking and cycling Public Health Outcomes Framework Data Tool Standard Evaluation Framework for physical activity interventions Health Impact Assessment Toolkits An online tool to estimate the economic savings from increasing walking and/or cycling. Example: We used the HEAT tool to monetise the economic savings from increasing cycling by delivering the Mayor s Vision for cycling. This estimated economic health benefits for each year from 2026 (when the vision has been delivered) of 183.5m. A tool for comparing local authorities by their performance against each of the Public Health Outcome Framework Measures. Example: This tool publishes comparable data for every unitary authority in the country on their performance against 68 indicators of the health of their population. Many of these indicators relate to street environments in London including: Percentage of physically active adults Excess weight KSI casualties Percentage of the population affected by noise Self-reported wellbeing Social isolation Fraction of mortality attributable to particulate air pollution A tool for evaluating the effectiveness of walking and cycling projects. Tools for assessing the health impacts of planning including a Healthy Impact Assessment checklist. Example: We used the HUDU checklist for our Health Impact Assessment for the Garden Bridge. We identified the biggest potential health benefit of the bridge is likely to be encouraging people to walk. 74 Chapter 10 Tools and decision making
75 Tools for understanding the health impacts of transport in London Owner Resource What it is for Public Health England Health Impact of Physical Inactivity tool A tool for estimating the number of cases of different diseases which could be prevented in each local area if more of the population were physically active. Example: We used this tool to calculate the health benefits that would be delivered if every adult in London achieved the minimum physical activity requirements of 150 minutes per week. It showed the benefits annually would be: 4,104 deaths avoided (18.2 per cent of all deaths in London avoided) 1,528 less cases of coronary heart disease (CHD) (11 per cent of all cases of CHD in London prevented) 778 less cases of breast cancer (21 per cent of all cases of breast cancer in London prevented) 474 less cases of colorectal cancer (20 per cent of all cases of colorectal cancer in London prevented) 44,620 less cases of type 2 diabetes (14 per cent of all cases of type 2 diabetes in London prevented) TfL Valuing Urban Realm Toolkit Provides monetary values for the benefits of proposed improvements to public space. TfL Health Service Travel Analysis Toolkit (HSTAT) A set of strategic analysis tools provided by us to support NHS organisations in assessing the transport implications of changes to healthcare provision. Example: Health for North East London used HSTAT to inform their plans for potentially consolidating some services to fewer sites to improve care quality. HSTAT provided travel time information for a range of scenarios at different stages in their decision-making process. Improving the health of Londoners: transport action plan 75
76 Evidence for effective measures to improve health through transport Owner Resource What it is for NICE Public Health Guidance 8 Physical activity and the environment (January 2008) NICE Public Health Guidance 13 Promoting physical activity in the workplace (May 2008) NICE Public Health Guidance 17 Promoting physical activity for children and young people (January 2009) NICE Public Health Guidance 25 Prevention of cardiovascular disease (June 2010) Gold standard evidence-based guidance from the National Institute for Health and Care Excellence (NICE) relating to active travel. These are summarised in NICE s pathway for local authorities. NICE Public Health Guidance 31 Preventing unintentional road injuries among under-15s: road design (November 2010) NICE Public Health Guidance 41 Walking and cycling: local measures to promote walking and cycling as forms of travel or recreation (November 2012) 76 Chapter 10 Tools and decision making
77 Policy guidance on transport and health Owner Resource What it is for UK Faculty of Public Health UK Faculty of Public Health Public Health England & Local Government Association Transport & health: Position statement and briefing statement (2013) Built environment & physical activity: Position statement and briefing Statement (2013) Obesity and the environment: Increasing physical activity and active travel (2013) These papers set out the position of the UK body of public health specialists part of the Royal College of Physicians, and their recommendations for action in addition to the policy background, evidence base and recommended resources. These papers set out the position of the UK body of public health specialists, part of the Royal College of Physicians, and their recommendations for action in addition to the policy background, evidence base and recommended resources. This document summarises the importance of active travel in tackling obesity and outlines the regulatory and policy approaches that can be taken. Improving the health of Londoners: transport action plan 77
78 Evidence of the health impacts of transport Owner Resource What it is for Mindell JS, Watkins SJ, Cohen JM (eds.), Stockport: Transport and Health Study Group Saunders et al, Plosone British Medical Association Mackett RL & Brown B, University College London Sustainable Development Commission Health on the Move 2. Policies for health promoting transport (2011) What Are the Health Benefits of Active Travel? A Systematic Review of Trials and Cohort Studies (2013) Healthy Transport = Healthy Lives (2012) Transport, Physical Activity and Health: Present knowledge and the way ahead (2011) Fairness in a Car Dependent Society (2011) This report provides a detailed compendium of evidence and expert opinion on the full range of health impacts of transport as well as policy recommendations. This paper brings together for the first time every published study that measured a health outcome of walking or cycling for transport in either a trial or a cohort study (empirical studies not cross-sectional ones). It shows the wide range of health benefits associated with active travel including diabetes, mental wellbeing, obesity, bone strength and breast cancer. This accessible report describes the main impacts of transport on health in the UK and includes clear graphs and illustrations. This report explores in detail the links between transport and its biggest health impact, physical activity. This report presents the range of health inequalities that arise from car-dependent societies. 78 Chapter 10 Tools and decision making
79 Understand travel patterns in London Owner Resource What it is for TfL Travel in London Report 6 (2013) We regularly publish Travel in London reports. These are rich with data and analysis of the travel behaviours of Londoners drawn from the London Travel Demand Survey. TfL TfL Analysis of Cycling Potential (2010) Roads Task Force Technical Notes (2013) This report analyses the potential for growth in cycling in London, identifying the trips, people and places that can most easily be transferred from other modes of travel to cycling. A suite of documents describing the current road transport landscape and challenges in London, including road traffic collisions, air pollution, health, accessibility and cycling. Health impacts of transport in London Owner Resource What it is for Greater London Authority Greater London Authority Greater London Authority TfL The main impacts of London road transport on health (2013) Air Quality Guides for Public Health Professionals (2013) Better Environment, Better Health (2013) Transport planning for healthier lifestyles (2013) Modelling of the main impacts of road transport on health in London. Commissioned by the GLA. Bespoke guides for each London borough on their local health impacts of air quality. Bespoke guides for each London borough describing the links between health and some of the key environmental determinants including active travel and transport, air quality and green spaces. This document provides guidance for healthcare organisations on the promotion of sustainable travel and transport planning for changes in healthcare. Improving the health of Londoners: transport action plan 79
80 References 1. Start active, stay active: a report on physical activity from the four home countries Chief Medical Officers (2011) Department of Health 2. Travel in London 6 (2013) TfL, p Transport and health in London: The main impacts of London road transport on health, (2014) Greater London Authority 4. Roads Task Force Technical Note 1(2013) TfL 5. Transport and health in London: The main impacts of London road transport on health, (2014) Greater London Authority 6. Transport and health in London: The main impacts of London road transport on health, (2014) Greater London Authority 7. Transport and health in London: The main impacts of London road transport on health, (2014) Greater London Authority 8. Travel in London 6 (2013) TfL, p Annual Report of the Chief Medical Officer 2011 (2013) Department of Health 10. London Plan Chapter 3, Policy 3.2 (2011) Greater London Authority 11. Greater London Authority Act 1999 (1999) The National Archives 12. The new public health role of local authorities (2012) Department of Health 13. Transport and health in London: The main impacts of London road transport on health, (2014) Greater London Authority 14. Public Health Outcomes Framework (2012) Department of Health 15. Start active, stay active: a report on physical activity from the four home countries Chief Medical Officers (2011) Department of Health 16. Start active, stay active: a report on physical activity from the four home countries Chief Medical Officers (2011) Department of Health 17. Active People Survey January 2012 January 2013, available at Active People Survey January 2012 January 2013, available at Active People Survey January 2012 January 2013, available at Active People Survey January 2012 January 2013, available at Transport and health in London: The main impacts of London road transport on health, (2014) Greater London Authority 22. Transport and health in London: The main impacts of London road transport on health, (2014) Greater London Authority 23. Active People Survey, Health Survey for England 24. Public Health Guidance 41(2012) National Institute for Health and Care Excellence 25. Start active, stay active: a report on physical activity from the four home countries Chief Medical Officers (2011) Department of Health 26. Transport and health in London: The main impacts of London road transport on health, (2014) Greater London Authority 27. Travel in London 6 (2013) TfL, p.51 and References
81 28. Transport and health in London: The main impacts of London road transport on health, (2014) Greater London Authority 29. Health Impacts of Physical Inactivity Model (2013) Public Health England 30. Built environment & physical activity position statement (2013) UK Faculty of Public Health 31. Rabl R and de Nazelle, A Benefits of shift from car to active transport Transport Policy 19 (2012) 32. Transport and health in London: The main impacts of London road transport on health, (2014) Greater London Authority 33. De Haartog et al, Do the health benefits of cycling outweigh the risks?, Environmental Health Perspectives 118 (2010) 34. Mindell JS, Watkins SJ and Cohen JM, Health on the Move 2 (2011) Transport and Health Study Group, section Health Update 5: Physical activity (1995) Health Education Authority; Wolman R, Osteoporosis and exercise, BMJ 309 (1994); Shephard RJ, Physical Activity, health, and wellbeing at different lifestages, Research Quarterly Exercise and Sport 66 (1995); in Mindell JS, Watkins SJ and Cohen JM, Health on the Move 2 (2011) Transport and Health Study Group section Jacobsen PL et al, Who owns the roads? How motorised traffic discourages walking and bicycling, Injury Prevention 15 (2009) 37. Travel in London 6 (2013) TfL 38. Frank LD et al, Many pathways from land use to health: Associations between neighbourhood walkability and active transportation, body mass index, and air quality, Journal of American Planning Association (2006) 39. Besser LM and Dannenberg AL, Walking to public transit: Steps to help meet physical activity recommendations, American Journal of Preventive Medicine (2005) 40. Wen et al, Driving to work and overweight and obesity: Findings from the 2003 New South Wales Health Survey, Australia, International Journal of Obesity (2006) 41. National Child Measurement Programme for England 2012/13 (2013) Health and Social Care Information Centre 42. Health and Social Care Information Centre (2013) Health Survey for England Tackling Obesity: Future Choices (2007) Foresight 44. Tackling Obesity: Future Choices (2007) Foresight 45. Frank L, Andresen M, Schmidt T, Obesity relationships with community design, physical activity and time spent in cars, American Journal of Preventive Medicine (2004) 46. Wen LM and Rissel C Inverse association between cycling to work, public transport and overweight and obesity: Findings from a population based study in Australia, Preventive Medicine 46 (2008) 47. Bell et al, The Road to obesity or the path to prevention: Motorised transportation and obesity in China, Obesity Research (2002) 48. Review of the evidence on health aspects of air pollution REVIHAAP project technical report (2013) World Health Organisation 49. Dr Brian G Miller, Institute of Occupational Medicine, Report on estimation of mortality impacts of particulate air pollution in London, (2010) Greater London Authority 50. Review of the evidence on health aspects of air pollution REVIHAAP project technical report (2013) World Health Organisation Improving the health of Londoners: transport action plan 81
82 51. Roads Task Force Technical Note 21 (2013) TfL, p Roads Task Force Technical Note 21 (2013) TfL 53. What is ozone? London Air 54. Air quality and health: factsheet number 313 (2011) World Health Organisation 55. Health effects of particles (2013) COMEAP Health effects of air pollution (2013) COMEAP Asthma and air pollution (2013) COMEAP Air pollution and childrens health/birth outcomes (2013) COMEAP IARC Diesel Engine Exhaust Carcinogenic: press release no. 213 (2012) World Health Organisation 60. Review of the evidence on health aspects of air pollution REVIHAAP project technical report (2013) World Health Organisation 61. Health effects of nitrogen dioxide (2013) COMEAP Health effects of ozone (2013) COMEAP Annual Report of the Chief Medical Officer 2011 (2013) Department of Health 64. London Atmospheric Emissions Inventory 2010, Greater London Authority 65. Roads Task Force Technical Note 21 (2013) TfL 66. Roads Task Force Technical Note 21 (2013) TfL 67. Roads Task Force Technical Note 21 (2013) TfL 68. Roads Task Force Technical Note 21 (2013) TfL 69. Health effects of transport related air pollution (2005) World Health Organization 70. Health effects of transport related air pollution (2005) World Health Organization 71. Greenways to cleaner air (2012) Sustrans 72. Health effects of transport related air pollution (2005) World Health Organization 73. Air quality and social deprivation in the UK: An environmental inequalities analysis (2006) Department for Environment, Food and Rural Affairs 74. Securing the future: Delivering UK sustainable development Strategy (2005) HM Government, The Stationery Office 75. Taylor D and Fergusson M, Road user exposure to air pollution a literature review by the Institute for European Environmental Policy (1997) Environmental Transport Association 76. Asthma and Air Pollution (2013) COMEAP 77. Roads Task Force Technical Note 19 (2013) TfL 78. Safe Streets for London: The Road Safety Action Plan for London 2020 (2013) TfL, p Collisions and casualties on London s roads: annual report 2012 (2013) TfL 80. Safe Streets for London: The Road Safety Action Plan for London 2020 (2013) TfL, p Safe Streets for London: The Road Safety Action Plan for London 2020 (2013) TfL, p Clinical and Health Outcomes Knowledge Base , NHS Information Centre 83. National Travel Survey (2008) Department for Transport 84. World Health Report Geneva (2002) World Health Organization, p References
83 85. Roads Task Force Technical Note 19 (2013) TfL 86. What we do: roads (2013) Transport for London 87. Roads Task Force Technical Note 19 (2013) TfL 88. Racioppi, F et al Preventing Road Traffic Injury: A Public Health Perspective for Europe (2004) World Health Organisation European Region, p Towards Zero: Ambitious Road Safety Targets and the Safe System Approach (2008) OECD 90. Roads Task Force Technical Note 1 (2013) TfL 91. Racioppi, F et al Preventing Road Traffic Injury: A Public Health Perspective for Europe (2004) World Health Organization European Region, p Racioppi, F et al Preventing Road Traffic Injury: A Public Health Perspective for Europe (2004) World Health Organization European Region, p Racioppi, F et al Preventing Road Traffic Injury: A Public Health Perspective for Europe (2004) World Health Organization European Region, p Health related travel difficulties: Personal travel factsheet (2007) Department for Transport 95. Attitudes to walking and cycling survey (2011) TfL p Safe Streets for London: The Road Safety Action Plan for London 2020 (2013) TfL, p Plowden S and Hillman M Danger on the road, the needless scourge: A study of obstacles to progress in road safety (1984) Policy Institute 98. Mindell JS, Watkins SJ and Cohen JM, Health on the Move 2 (2011) Transport and Health Study Group, section Active Travel Strategy (2010) Department for Transport/Department of Health, p Attitudes to walking and cycling survey (2011) TfL p.59, 101. Healthy transport = Healthy lives (2012) British Medical Association, p Mindell JS, Watkins SJ and Cohen JM, Health on the Move 2 (2011) Transport and Health Study Group, section Environmental Noise and Health in the UK A report by the Ad Hoc expert Group on Noise and Health (2010) Health Protection Agency p Babisch W, Road Traffic Noise and cardiovascular disease (2008) Noise Health 105. Environmental health inequalities in Europe assessment report (2012) World Health Organization 106. Protecting and enhancing our urban and natural environment to improve public health and wellbeing (2013) Defra 107. Environmental Noise and Health in the UK, A report by the Ad Hoc expert Group on Noise and Health (2010) Health Protection Agency p Burden of disease from environmental noise: Quantification of healthy life years lost in Europe (2011) World Health Organization 109. Stansfeld SA and Haines M, Environmental noise and health: A review of non-auditory effects, IEH report on the nonauditory effects of noise (1997), Institute for Environment and Health 110. Mindell JS, Watkins SJ and Cohen JM, Health on the Move 2 (2011) Transport and Health Study Group, section Mindell JS, Watkins SJ and Cohen JM, Health on the Move 2 (2011) Transport and Health Study Group, section Mindell JS, Watkins SJ and Cohen JM, Health on the Move 2 (2011) Transport and Health Study Group, section Mindell JS, Watkins SJ and Cohen JM, Health on the Move 2 (2011) Transport and Health Study Group, section Mindell JS, Watkins SJ and Cohen JM, Health on the Move 2 (2011) Transport and Health Study Group, section 14.3 Improving the health of Londoners: transport action plan 83
84 115. Mindell JS, Watkins SJ and Cohen JM, Health on the Move 2 (2011) Transport and Health Study Group, section Roads Task Force Technical Note 8 (2013) TfL 117. Roads Task Force Technical Note 8 (2013) TfL 118. Racioppi F et al, Preventing Road Traffic Injury: A Public Health Perspective for Europe (2004) World Health Organization European Region, p Huttenmoser M, Children and their living surroundings: Empirical investigations into the significance of living surroundings for the everyday life and development of children, Children s Environments 12 (1995) 120. On the buses study (2010) London School of Hygiene and Tropical Medicine 121. Understanding community severance: Views of practitioners and communities (2005) Department for Transport 122. Mindell JS, Karlsen J, Community severance and health: What do we actually know?, Journal of Urban Health 89 (2012) 123. Berkman L and Syme SL, Social Networks, host resistance, and mortality: A nine-year follow-up study of Alameda County residents, (1979) American Journal of Epidemiology Travel in London 5 (2012) TfL, p Appleyard D and Lintell M, The environmental quality of city streets: The residents point of view, American Institute of Planners Journal 38 (1972) 126. Berkman L and Syme SL, Social Networks, host resistance, and mortality: A nine-year follow-up study of Alameda County residents, American Journal of Epidemiology 109 (1979) 127. Mindell JS, Watkins SJ and Cohen, JM Health on the Move 2 (2011) Transport and Health Study Group, section Mindell JS, Watkins SJ and Cohen JM, Health on the Move 2 (2011) Transport and Health Study Group, section Travel in London 5 (2012) TfL, p Travel in London 5 (2012) TfL, p The vision and direction for London s streets and roads (2013) Roads Task Force 132. Wilkinson R and Pickett K, The Spirit Level: Why equality is better for everyone (2009) Allen Lane 133. Tudor-Hart J, The inverse care law, Lancet 1(1971) 134. Travel in London 4 (2011) TfL, p Mindell JS, Watkins SJ and Cohen JM Health on the Move 2 (2011) Transport and Health Study Group 136. Mindell JS, Watkins SJ and Cohen JM Health on the Move 2 (2011) Transport and Health Study Group, section White, MP. et al Would you be happier living in a greener urban area? Psychological Science 24 (6) (2013) 84 References

85 Improving the health of Londoners: transport action plan 85
Cycling & Health. What s the evidence? Nick Cavill & Dr Adrian Davis Public health advisors to Cycling England
 Cycling & Health What s the evidence? Nick Cavill & Dr Adrian Davis Public health advisors to Cycling England CONTENTS ForEwOrd 5 Executive Summary 7 Introduction 9 1. A Brief History 11-12 2. THE IMPORTANCE
Getting there on foot, by cycle. A strategy to advance walking and cycling in New Zealand transport. February 2005 ISBN: 0 478 10004 3
 Getting there on foot, by cycle A strategy to advance walking and cycling in New Zealand transport February 2005 ISBN: 0 478 10004 3 FOREWORD In 2002, the Government released the New Zealand Transport
let s make scotland more active A strategy for physical activity Physical Activity Task Force
 let s make scotland more active A strategy for physical activity Physical Activity Task Force let s make scotland more active A strategy for physical activity Physical Activity Task Force 7188 Contents
Choose how you move. Sustainable Transportation Strategy
 Choose how you move Sustainable Transportation Strategy Choose how you move Sustainable Transportation Strategy April 2013 Crown Copyright, Province of Nova Scotia, 2013 All photos in this document are
Caring for each other, Caring for ourselves
 HEALTH & SOCIAL SERVICES WHITE PAPER Caring for each other, Caring for ourselves Public consultation Welcome to the White Paper from Health and Social Services. We hope you enjoy reading it, and look forward
An Age Friendly City how far has London come? Anthea Tinker, and Jay Ginn, King s College London
 An Age Friendly City how far has London come? Anthea Tinker, and Jay Ginn, King s College London Published by King s College London, February 2015 Copyright Anthea Tinker and Jay Ginn ISBN 978-1-908951-13-7
What s important to me. A Review of Choice in End of Life Care
 What s important to me. A Review of Choice in End of Life Care Published by The Choice in End of Life Care Programme Board February 2015 1 Page About this review The Choice in End of Life Care Programme
We still need to talk. A report on access to talking therapies
 We still need to talk A report on access to talking therapies About the We need to talk coalition The We need to talk coalition is a group of mental health charities, professional organisations, Royal
One Leicester Shaping Britain s sustainable city. The journey to creating a city of confidence, prosperity and beauty
 Shaping Britain s sustainable city The journey to creating a city of confidence, prosperity and beauty About this document One Leicester is Leicester s sustainable community strategy and has been developed
Reaching Out: Think Family
 Social Exclusion Task Force Reaching Out: Think Family Analysis and themes from the Families At Risk Review Ministerial Foreword Ministerial Foreword Families are the bedrock of our society. They can provide
Exploring the Support at home Sarah Joy, Susana Corral and Femi Nzegwu
 Exploring the difference made by Support at home Sarah Joy, Susana Corral and Femi Nzegwu Exploring the difference made by Support at home 1 Exploring the difference made by Support at home Sarah Joy,
GAME OF LIFE HOW SPORT AND RECREATION CAN HELP MAKE US HEALTHIER, HAPPIER & RICHER
 GAME OF LIFE HOW SPORT AND RECREATION CAN HELP MAKE US HEALTHIER, HAPPIER & RICHER 2 The Sport and Recreation Alliance The Sport and Recreation Alliance is the independent umbrella body for the national
No health without. public mental health. the case for action
 No health without public mental health the case for action Royal College of Psychiatrists Position statement PS4/2010 No health without public mental health The case for action Position Statement PS4/2010
Later Life in the United Kingdom April 2015
 Later Life in the United Kingdom April 2015 This factsheet, which is updated on a monthly basis, is the most up-to-date source of publicly available, general information on people in later life in the
How To Improve Outcomes For Children And Young People In North Ireland
 Our Children and Young People Our Pledge A TEN YEAR STRATEGY FOR CHILDREN AND YOUNG PEOPLE IN NORTHERN IRELAND 2006-2016 Our Children and Young People Our Pledge A TEN YEAR STRATEGY FOR CHILDREN AND YOUNG
Special review. Supporting life after stroke. A review of services for people who have had a stroke and their carers
 Special review Supporting life after stroke A review of services for people who have had a stroke and their carers January 2011 About the Care Quality Commission The Care Quality Commission (CQC) is the
The Healthcare Quality Strategy for NHSScotland
 The Healthcare Quality Strategy for NHSScotland The Scottish Government, May 2010 The Healthcare Quality Strategy for NHSScotland The Scottish Government, May 2010 Crown copyright 2010 ISBN: 978-0-7559-9323-9
Community Health Needs Assessment
 Community Health Needs Assessment An introductory guide for the family health nurse in Europe Part 1: A pack for practitioners Part 2: A pack for trainers EUR/01/5019306 ABSTRACT Governments across the
Backing the Future: why investing in children is good for us all
 Backing the Future: why investing in children is good for us all nef is an independent think-and-do tank that inspires and demonstrates real economic well-being. We aim to improve quality of life by promoting
Getting there: How sustainable transport can support new development. www.bettertransport.org.uk
 Getting there: How sustainable transport can support new development www.bettertransport.org.uk Getting there: How sustainable transport can support new development 1 Introduction 03 2 Policy and tools
Understanding the Contribution Parks and Green Spaces can make to Improving People s Lives. Full Report
 Understanding the Contribution Parks and Green Spaces can make to Improving People s Lives. Full Report Page 1 Table of Contents Introduction... 4 1. Social Value... 6 Communities... 6 Volunteering and
The. New Zealand Health Strategy
 The New Zealand Health Strategy Hon Annette King, Minister of Health December 2000 Published in December 2000 by the Ministry of Health Manatū Hauora PO Box 5013, Wellington, New Zealand ISBN 0-478-23993-9
are housing associations ready for an ageing population? By Martin Wheatley
 are housing associations ready for an ageing population? By Martin Wheatley The Genesis Narrative Genesis combines its social purpose helping our customers build better futures with a commercial approach
Parity in progress? The All Party Parliamentary Group on Mental Health s inquiry into parity of esteem for mental health
 Parity in progress? The All Party Parliamentary Group on Mental Health s inquiry into parity of esteem for mental health March 2015 Contents Foreword 3 Executive summary 5 Recommendations 6 Introduction
SUPPORTING, DEVELOPING AND ASSURING THE COMMISSIONING SYSTEM PARTNERSHIP FOR QUALITY WORLD CLASS CUSTOMER SERVICE: INFORMATION, TRANSPARENCY
 Putting Patients First The NHS England business plan for 2013/14 2015/16 DIRECT COMMISSIONING EMERGENCY PREPAREDNESS CLINICAL AND PROFESSIONAL LEADERSHIP SUPPORTING, DEVELOPING AND ASSURING THE COMMISSIONING
FIVE YEAR FORWARD VIEW
 FIVE YEAR FORWARD VIEW October 2014 CONTENTS Foreword..page 2 Executive summary..page 3 Chapter One Why will the NHS need to change?...page 7 Chapter Two What will the future look like? A new relationship
Wellness we each have a role to play
 Final Report of the Select Committee on Wellness to the Second Session of the 56 th Legislative Assembly of New Brunswick Wellness we each have a role to play Individuals, Communities, Stakeholders and
ending child poverty: making it happen
 ending child poverty: making it happen Contents Ministerial foreword 3 1 Introduction and summary 5 2 The 2020 vision 11 3 Driving progress against the vision 18 4 Tackling child poverty in local communities