Maryland s Results for Child Well-Being
|
|
|
- Caren Lee
- 8 years ago
- Views:
Transcription
1 Maryland s Results for Child Well-Being Children s Cabinet and Governor s Office for Children 2012 Martin O Malley Governor Anthony G. Brown Lieutenant Governor Anne Sheridan Executive Director

2

3 - b G v O c 301 W. Preston Street, 15 th Floor Baltimore, Maryland D c mb 3 P b c S : Anne Sheridan, Executive Director Patricia E. Arriaza, Chief, Interagency Initiatives Brian Alexander, Policy & Program Specialist Steven Schreiber-Stahl, Policy & Program Specialist Mark Scott, Policy & Program Specialist i

4 G v O c b V Children s Cabinet: All Maryland s children will be successful in life. Governor s Office for Children: Maryland will achieve child wellbeing through interagency collaboration and state/local partnerships. The Children s Cabinet, led by the Executive Director of the Governor s Office for Children (GOC), will work collaboratively to create and promote an integrated, community-based service delivery system for Maryland s children, youth, and families. Our mission is to improve the well-being of Maryland s children. b Anne Sheridan, Executive Director (Chair) Governor s Office for Children Sam Abed, Secretary Department of Juvenile Services Theodore Dallas, Secretary Department of Human Resources T. Eloise Foster, Secretary Department of Budget and Management Lillian M. Lowery, State Superintendent of Schools Maryland State Department of Education Catherine A. Raggio, Secretary Department of Disabilities Joshua Sharfstein, Secretary Department of Health and Mental Hygiene ii

5 T b Governor s Office for Children and the Children s Cabinet Letter from the Governor 1 Letter from the Executive Director 2 Executive Summary 3 Introduction About the 13th Annual Report 5 Results Accountability 6 Using Maryland s Results and Indicators 7 Statewide Efforts to Improve Outcomes for Children and Youth 8 History of the Results and Indicators in Maryland 9 Health Result 1 - Babies Born Healthy 12 Infant Mortality 13 Low Birth Weight 14 Births to Adolescents 15 Result 2 - Healthy Children 16 Immunizations 17 Hospitalizations 18 Deaths 19 New Perspectives in Children s Health Health Insurance 20 Obesity 21 Substance Use 23 Education Result 3 - School Readiness 27 Kindergarten Assessment 28 Result 4 - School Success 31 Maryland School Assessment 32 High School Assessment 34 Truancy 35 Result 5 - School Completion 36 Dropout 37 High School Program Completion 39 Program Completion of Students with Disabilities 40 Result 6 - School Transition 42 Educational Attainment 43 Youth Employment 44 New Perspectives in Children s Education Alternative Maryland School Assessment 45 iii

6 Bullying and Harassment 46 Community Result 7 - Safety 49 Juvenile Felony Offenses 50 Recidivism 51 Child Maltreatment 52 Result 8 - Stability 54 Hunger 55 Out-of-Home Placement 58 Homelessness 60 New Perspectives in Children s Communities Crime 61 Child Poverty 62 Appendix Guide to Statistics A-2 Indicator Trends Summary A-3 Jurisdictional Data A-6 Note: Data used in this book are analyzed at the State and jurisdictional levels. More detailed jurisdictional data is available at iv

7 Dear Friends: I m pleased to introduce Maryland s Results for Child Well-Being presented by the Maryland Children s Cabinet and the Governor s Office for Children. For more than ten years, Maryland has tracked eight target areas and developed statewide indicators to measure and report on child well-being to inform decisions by State and local partners. This report is among the longest, continuously reported results and indicators for children and families in the nation and reflects our commitment to our State s long-term success. The Children s Cabinet is committed to prevention, early intervention, and communitybased services to ensure that the needs of Maryland s children and families are being met. To ensure that all children are healthy and have the opportunities to meet the challenges of a changing global economy, we continue to followthrough with ambitious plans to improve student achievement and school, college and career readiness by 25% by 2015, and to end childhood hunger by In 2012, we surpassed our goal of reducing infant mortality by more than 10%, and we are committed to reducing the rate another 10% by There is no such thing as a spare Marylander. We are dedicated to protecting and preparing all our children so that they can give back to their communities just as we have given to them. With the support of our government agencies, community partners, and engaged citizens, we are investing in our future by making Maryland a place where children can grow up healthy and make the most of every opportunity. Sincerely, Martin O Malley Governor State House 100 State Circle Annapolis, Maryland (410) (Toll Free)

8 Dear Citizens of Maryland: On behalf of the Governor s Office for Children (GOC) and the Children s Cabinet, I am pleased to present the 2012 Maryland Results for Child Well-Being report. These results and indicators have guided the Children s Cabinet s efforts since 2001, as we have set Statewide priorities and supported local evidence-based initiatives to meet the needs of Maryland s children, youth, and their families. We are proud that these results and indicators represent both national child wellbeing priorities as well as those of the O Malley-Brown Administration. GOC serves as the coordinating entity for the six child-serving agencies that constitute the Children s Cabinet, including the Secretaries of Budget and Management, Health and Mental Hygiene, Human Resources, Juvenile Services, and Disabilities, as well as the State Superintendent of the Department of Education. The Children s Cabinet agencies demonstrate exceptional collaboration through their focus on the outcomes outlined in the Results for Child Well-Being and The Maryland Child and Family Services Interagency Strategic Plan, which serves as the framework for interagency implementation of child and family services. This year s Results for Child Well-Being show encouraging progress in children s health, education, and communities. Maryland has demonstrated success in reducing infant mortality and has significantly reduced the rate of births to adolescents, remaining well below the national average. Thanks to the efforts of preschools and public elementary schools in Maryland, 82% of children enter Kindergarten equipped with the developmental skills they need to be fully engaged in the classroom. And our State has maintained stability through tough economic times by strengthening our safety nets for hungry families and children, increasing participation in the School Breakfast, At-Risk Afterschool Meals, and Food Supplement Programs. As we celebrate our successes, we also seek to leverage our strengths and face our challenges head-on. Having a clear understanding of what we are doing and how well we are doing it allows us to do both. The Children s Cabinet agencies, families, and stakeholders continue to collaborate to improve the lives of Maryland s children, youth and their families. Sincerely, Anne Sheridan, Executive Director Governor s Office for Children 2

9 Ex c v S mm The 2012 Results for Child Well-Being report marks the latest edition in one of the longest-running State child outcomes reports in the nation. A longstanding dedication to outcomes measurement is reflected in the comprehensiveness of this report. Over the years, the Results for Child Well-Being report has evolved to provide analysis on emerging trends in child well-being as well as the changing landscape of childhood in the state. Maryland continues its focus on evaluating children s outcomes and using that information to improve the efforts of child-serving agencies and local partners. The goal of children s services in Maryland is for all children to live fulfilled and successful lives. To ensure that this goal is being met, Maryland has chosen to focus on eight results which describe the general well-being of Maryland s children and families. The State s child-serving agencies use a Results Accountability framework to measure progress in realizing these results using measureable proxies for success called indicators (more about the framework in the Introduction). The Results for Child Well-Being report examines indicators which fall under three overarching themes: health, education, and family and community environments. Overall, Maryland saw promising trends from these indicators highlights from the 2012 Results for Child Well-Being report include: Health For the fourth consecutive year, Maryland saw a decrease in its infant mortality rate, reaching 6.3 per 1,000 live births. Governor Martin O Malley s original goal of a 10% reduction in the 2007 infant mortality rate was achieved in 2009, prompting the creation of a new goal. With the reduction seen in the infant mortality rates this year, Maryland is well on its way to achieving the new goal of an additional 10% reduction of overall infant mortality and Black infant mortality by The number of births to adolescents continued to decline, with a birth rate of 22.1 per 1,000 adolescents (ages 15-19). Maryland remains significantly below the national average in this metric, as jurisdictions have developed their own plans to reduce teen pregnancies in their communities. Education In academic year 2012, Maryland students achieved the highest passing rate on each of the three High School Assessments subject tests since High school students must pass the High School Assessments in order to graduate, and more than 80% of students who took each of the three subject-area tests received a passing grade. The number of students absent for more than 20 days of the school year declined in 2012, reversing the increase seen between the 2010 and 2011 academic years. By reducing the number of students missing more than 20 days each year, Maryland can ensure students receive every opportunity to learn and achieve in the classroom. 3

10 Community While the United States Department of Agriculture indicates that the rate of household food insecurity increased in 2012, Maryland has increased its efforts to connect low-income children to federal nutrition programs, led by the Governor s Partnership to End Childhood Hunger. More children than ever before received a free or reduced-price school breakfast in 2012, ensuring more students can start their day prepared to learn. The rate of referrals per 100,000 youth ages for felony offenses decreased for the fourth consecutive year and is now less than half of the 2008 rate. While there is undoubtedly a significant amount of good news contained in this report, there are also indicators that show an ongoing need for intervention and services. Overall, the recession continued to impact Maryland s children and families. Homelessness among public school children rose to 1.69% of enrollment, sustaining the trend in place since the school year. The percentage of young adults (ages 16-24) employed in 2012 again declined, and the child poverty rate reached its highest point in 15 years. Other indicators also showed some regression, for a variety of reasons. Vaccine coverage among children ages months saw a significant decline in Additionally, the number of bullying and harassment incidents reported increased by more than 11% over the previous year. This report, however, illustrates that Maryland s children were better off in 2012 in many ways, and those indicators trending in the wrong direction offer an opportunity for course correction and additional interventions. Maryland s children continue to have access to a high quality education through the State s public school system, live in communities where poverty rates and hunger are far below the national average, and enter the workforce at higher rates as young adults than the rest of the country. Each indicator in this report has an accompanying chart along with an explanation of the data and its implications. For a quick snapshot of all of the indicators and their trends, please refer to the Indicator Trend Summary Chart in the Appendix. 4

11 I c About the 13 th Annual Report The 2012 Results for Child Well-Being report marks the latest edition in one of the longest-running State child outcomes reports in the nation. A longstanding history of outcomes measurement is reflected in the comprehensiveness of this report but over the years, the Results for Child Well-Being has evolved to provide analysis on emerging trends in child well-being as well as the changing landscape of childhood. Maryland continues its focus on evaluating children s outcomes and using that information to improve the efforts of State agencies and local partners. The goal of children s services in Maryland is for all children to live fulfilled and successful lives. This overarching, holistic goal can be achieved by helping children and youth grow up healthy, well-educated, and in safe and stable family and community environments. Maryland agencies use a Results Accountability framework to measure the State s progress in realizing these results using measureable proxies for success called indicators (more about the framework below). In this report, you will find the results that Maryland hopes to achieve for every child and, in each result, the indicators that measure our progress. How to Read this Report Two critically important parts of the analysis are how each jurisdiction is doing to improve children s well-being and how much progress we have made as a State, even if we have not yet realized all of our goals. In the Appendix of this report, you will find jurisdictional data for each of the indicators for which jurisdictional data is available. Jurisdictional data highlights the dynamics of child well-being on a local level by illustrating the particular strengths and challenges encountered by each of Maryland s counties. In some exceptional cases, jurisdictional data is not available due to the low sampling size of indicators based on survey data. Other useful tools for understanding Maryland s progress are the summary charts at the beginning of each result section. These charts show the average change of each indicator based on the baseline and whether the trend is positive or negative. They are a good reference for readers who would like to get a quick overview of children s results. A Collaborative Process It would be impossible to reliably analyze children s progress across this broad array of results without the expertise of so many State and local partners. Accumulating data, and more importantly, making sense of trends, is a process that is truly built from the ground up: from the thousands of social services workers, surveyors, teachers, health workers, and physicians across the State to those who amass those millions of observations to understand the big picture. The Maryland Results for Child Well-Being report collects much of the best information we have about children and the efforts that are being made across the State. Thank you to each person who has contributed to the lessons we have learned through this process. 5

12 Results Accountability The work of the Governor s Office for Children and the Children s Cabinet is accomplished using the Results Accountability framework. This approach focuses planning, decision-making, and budgeting on desired results and outcomes. Results Accountability identifies a result to achieve, selects indicators that act as proxy measures for the result, tells the story behind the data, identifies necessary partners and effective strategies, and develops an action plan and budget. In evaluating programs, this approach is used to evaluate data through three main questions: How much did we do? How well did we do it? And, is anyone better off? Results and Indicators What is a Result? Maryland s Children s Cabinet focuses on eight results for child well-being. A result is a goal that Maryland has established for its children, families, and/or communities. Each result describes the general well-being of Maryland s children and families in an area known to affect a child s ability to grow up healthy and secure. What is an Indicator? Indicators are information and data that demonstrate progress toward meeting a result. Maryland has selected 21 indicators for the eight results. Performance Measures: Gauge how well a program, agency, or service is working. Indicators: Help to quantify progress toward achieving a result. Results: The goal or outcome; the condition of wellbeing for children, families, or communities. 6

13 Choosing Strong Indicators To provide indicators that are reliable, important, and will ultimately inform the work of various stakeholders across Maryland s communities, we asked these questions: Communication Power Does the indicator communicate to a broad range of audiences? Proxy Power Does the indicator say something of central importance about the result? Is it correlated to the result? Data Power Is the data reliable? Is it available on a timely basis? Indicators are most useful in helping stakeholders identify children s needs and evaluate trends when: The data comes from automated systems like health or social services records which are recorded consistently and updated constantly; The indicator is measured nationally, so that Maryland s trends can be compared to other States; and The indicators have been measured for many years, which yields an analysis of trends over time that is less susceptible to outliers and fluctuations. Using Maryland s Results and Indicators The Children s Cabinet, in collaboration with the local jurisdictions, strives to meet the needs of Maryland s children, families, and communities. Through this collaborative approach, each jurisdiction s Local Management Board (LMB) identifies and focuses on results and indicators that are priorities in its community. The information in this publication assists in tracking and evaluating the well-being of children across the State and in each local jurisdiction. The figure below illustrates the selected indicators for the result of Babies Born Healthy and how those indicators inform our mission of improving the well-being of Maryland s children. Reduce the rate of Low Birth Weight Babies Born Healthy Healthy Children Reduce the rate of Infant Mortality Reduce the rate of Births to Adolescents School Readiness School Success School Completion School Transition Safety All Maryland Children Are Successful in Life Stability 7

14 Indicators are used to: Assess and understand the current status of children and families and track emerging trends over time: Examine data for population subgroups, including race, sex, and age, to identify major differences across the groups and ensure that all children and families do well; Analyze trends to identify where results have changed on a local level in ways that are inconsistent with statewide trends. This assists local jurisdictions with focusing resources on potential priority areas; Provide stakeholders and communities with the information and resources they need to understand the data and trends related to children in their communities. Select priority areas and set goals for the improvement of child and family well-being: Use the indicators to identify troubling trends, choose strategies to address the problem area, and measure progress toward set goals. Compare and collaborate with other jurisdictions to identify shared strategies; Choose intervention strategies that are reasonably calculated to achieve progress toward the goals; Use indicators as part of strategic planning; Help stakeholders and communities to be informed and involved in setting goals for improvement in their communities; and Monitor progress toward goals in comparison with resources invested in selected programs, services, and initiatives. Indicator data will support the assessment of intervention strategies. Statewide Efforts to Improve Outcomes for Children and Youth Maryland s eight results for child well-being reflect the priorities of the Children s Cabinet and the Governor s administrative priorities, and provide a structure for the work of Maryland s 24 Local Management Boards (LMBs). The LMB in each jurisdiction is composed of representatives from the Children s Cabinet s local agencies, as well as other stakeholders, including local business and community members. Each LMB conducts a comprehensive needs assessment and prioritization of results and indicators based on the jurisdiction s needs. Funding from the Children s Cabinet Interagency Fund (the Interagency Fund) is used by the LMBs to develop and deliver services which address the results and indicators that have been prioritized for the jurisdiction. The Children s Cabinet and the Governor s Office for Children are committed to improving outcomes for children and youth in Maryland. In addition to fulfilling Agency-specific mandates, Maryland s child-serving Agencies also work together through the Children s Cabinet to coordinate policies, evaluate Statewide needs, track progress on outcomes, and oversee funding to LMBs that provides services directly impacting children s well-being. The Children s Cabinet includes the Secretaries of the Department of Budget and Management (DBM), the Department of Disabilities (DoD), the Department of Health and Mental Hygiene (DHMH), the Department of Human Resources (DHR), the Department of Juvenile Services (DJS), and the State Superintendent of Schools, and is chaired by the Executive Director of GOC. The Interagency Fund is administered by GOC on behalf of the Children s Cabinet. 8

15 The key goals of GOC are to: Work with LMBs and other State and local stakeholders to increase the capacity of communities to meet the specific needs of their jurisdictions children and families; Use data and technology to continuously monitor and evaluate outcomes; Improve fiscal efficiency and accountability of programs that serve children and families, particularly those funded through the Interagency Fund; Provide support and assistance to the Children s Cabinet, the Children s Cabinet Results Team, the Interagency Licensing Committee, the State Coordinating Council, and other interagency committees; and Develop statewide prevention plans and policies for transition age youth, youth at risk of out-of-home placement, and other high-need populations. The key goals of the Interagency Fund are to: Use a collaborative, results-oriented accountability framework to track and evaluate the well-being of children across the State and in each jurisdiction through eight identified results for child well-being; and Work collaboratively to ensure a safe, stable, and healthy environment for children and families through coordinated policy recommendations to the Governor. History of the Results and Indicators in Maryland In 1996, the Governor s Task Force on Children, Youth, and Families Systems Reform (the Task Force) was created in response to a growing desire by local jurisdictions to ensure a strong local role in setting policy that affects children and families. Additionally, the Task Force considered the differing and individual needs of Maryland s jurisdictions as they recommended policies and procedures for the systems reform initiative. The need for a results-based system was a strong theme throughout the work of the Task Force and also reflected in the public hearings held by the Task Force throughout the State. The Task Force s Program Subcommittee originally proposed nine results. Each result area and its proposed indicators underwent intensive review and discussion by the Subcommittee and, in 1997, by the Program Subcommittee s successor, the Results Workgroup. Both groups had representation from the State and local levels, public and private members, and included county public health officials, county social service employees, local school system staff, local management board members, advocates, and State agency staff. In January 1999, eight results were adopted, forming the basis of Maryland s Results for Child Well-Being report. The chosen results capture the quality of life for children and families in Maryland. Progress toward each result is determined through selected indicators which specifically measure segments of each result area. By monitoring the indicators, the State and local jurisdictions are able to evaluate the effectiveness of service delivery to children and families. 9

16 In order to uniformly assess the usefulness of suggested indicators, the Task Force developed the following criteria to select indicators: The indicator is directly related to the well-being of children, families or communities in each specific result; The indicator is well-measured, in that it applies to all or most of the relevant population and is collected in ways that support data reliability and validity; Data on the indicator are readily available from public sources; and Data on the indicator are available at the State and local levels. Across the nation, three to five indicators are usually accepted as a manageable number of measures per result area. The number of indicators is crucial. Other states have shown unsuccessful shifts to results-based accountability, in part, by selecting too many indicators. As other indicators are considered in the future, the task of monitoring and analyzing them will continue with public input. It is the intent of the Children s Cabinet that the core set of indicators will be modified as necessary. By adopting the results and indicators featured in this book, Maryland is in alignment with the national trend of utilizing results-based accountability for programs and services. In November 2011, GOC held the Results for Child Well-Being Forum to assess the progress of Maryland s child outcomes for the previous year, determine what needs to be done to improve those outcomes in coming years, and assess how future reports can best support the work of state and local partners who serve Maryland s children. Beginning in mid-december of 2011, GOC convened workgroups that included a variety of State, local, and non-profit stakeholders. The priority of the workgroups was to agree on indicators to serve as a standard for the well-being of all Maryland children by improving the measurement of existing indicators and suggesting additional indicators. In keeping with the publication s history of featuring time-tested trends as well as new perspectives, the workgroups recommendations emphasize the consistency of the widely-accepted/traditional indicators while providing an opportunity to include indicators that are creative and lend a fresh viewpoint. Maryland s results and indicators provide a framework for accurately measuring the well-being of children in Maryland over time. Without clear and quantifiable indicators, there would be no evidence that Maryland is meeting its goals for children. Without the participation of all Marylanders who care about children, our understanding of how Maryland is doing would be incomplete. For this reason, state and national stakeholders including child and family-serving agencies, non-profit organizations, community-development partnerships, educators, faith communities, and parents and children are integral to shaping a vision for the well-being of Maryland s children. 10

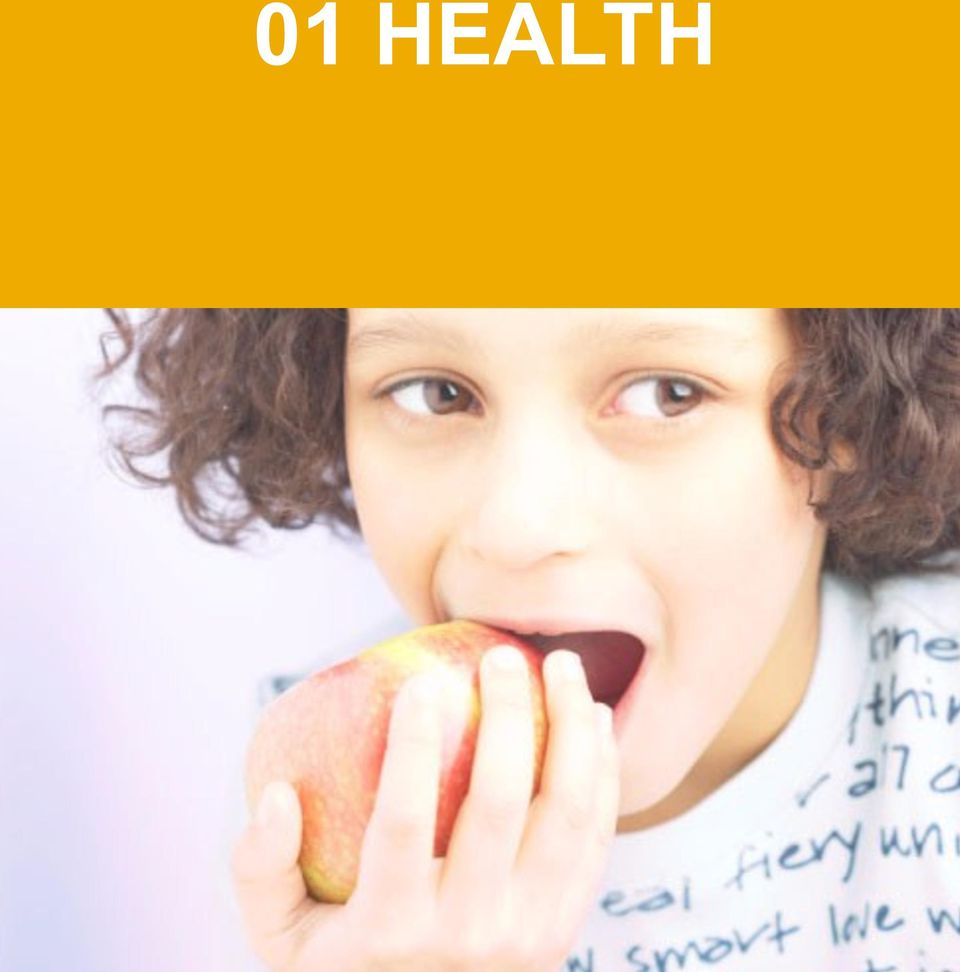
17 01 HEALTH
18 01 HEALTH BABIES BORN HEALTHY Indicators: Five Year Trend Average Yearly Percent Change* Recent Year Percent Change Recent Year Measurement Infant Mortality Low Birth Weight Births to Adolescents The number of deaths occurring to infants under one year of age per 1,000 live births. -5.7% -6.0% 6.3 per 1,000 The percent of all births with birth weight less than 2,500 grams (approximately 5.5 pounds). -1.4% -1.1% 8.8% The rate of births to adolescent females ages 15 through 19 years, per 1,000 of the population per -9.3% -10.5% 1,000 Indicates an area of positive growth. Indicates an area of negative growth. *Indicates average yearly percent change over five year period unless otherwise noted. 12

 Mortality Occurring per 1,000 Live Births 2003 2004 2005 2006 2007 2008 2009 2010 2011 2012* MD 8.1 8.5 7.3 7.9 8.0 8.0 7.2 6.7 6.7 6.3 US 6.9 6.8 6.9 6.7 6.8 6.6 6.4 6.2 6.1 * Maryland data for 2012 are preliminary and U.")
19 01 HEALTH BABIES BORN HEALTHY Infant mortality: The number of deaths occurring to infants under one year of age per 1,000 live births, for all infants, and for infants in selected racial groups. Infant (<1 year) Mortality Occurring per 1,000 Live Births * MD US * Maryland data for 2012 are preliminary and U.S. data for 2012 are not yet available Data Source: MD DHMH, Vital Statistics Administration Annual Reports Story Behind the Data: In 2012, Maryland s infant mortality (IMR) rate fell to 6.3 per 1,000 live births, the lowest rate ever recorded in Maryland. It represents a decline of 6% from 2011 and a 21% decline since Although infant mortality remains highest among Black infants, the Black infant mortality rate has fallen substantially in recent years, reaching an all-time low of 10.3 per 1,000 live births in This represents a 14% decline from the 2011 rate of The leading causes of infant death in 2012, as in recent years, were: Disorders relating to short gestation and low birth weight; Congenital abnormalities; and Sudden Infant Death Syndrome (SIDS). Racial disparities exist in the leading causes of infant death. In Maryland, Black infants are 2 times more likely to die of SIDS than White infants. They are also over three times more likely to die of preterm and low birth weight. In order to address the overall infant mortality rates, and the racial disparities in these rates, the Babies Born Healthy (BBH) Program was launched in BBH allocates additional resources to the eight Maryland jurisdictions with the highest rates of infant mortality and the highest racial disparities in infant mortality, implementing interventions in the time periods before pregnancy, during pregnancy, and after delivery. This has included the expansion of eligibility for Medicaid family planning services to include women at or below 200% of the federal poverty level and the implementation of Quick Start Prenatal Programs at Local Health Departments, among other initiatives. Since 2008, the overall infant mortality rate has fallen by 21%, with the Black infant mortality rate decreasing by 26% in the same window of time. After achieving the original goal of decreasing the 2007 infant mortality rate by 10%, Governor O Malley reset the goal in 2011 to reducing the overall and Black infant mortality rates by an additional 10% by Nationally, one of the Healthy People 2020 objectives is to reduce infant mortality to 6.0 per 1,000 live births. 2 13

20 01 HEALTH BABIES BORN HEALTHY Low Birth Weight: The percent of all births and births in selected racial groups with birth weight less than 2,500 grams (approximately 5.5 pounds). Percentage of Low Birth Weight (<2500g) Infants * MD 9.1% 9.4% 9.2% 9.4% 9.1% 9.3% 9.2% 8.8% 8.9% 8.8% US 7.9% 8.1% 8.2% 8.3% 8.2% 8.2% 8.2% 8.2% 8.1% 8.0% * MD and US data for 2012 are preliminary Data Source: MD DHMH, Vital Statistics Administration Annual Reports US Data: USCDC, National Vital Statistics Reports, "Births: Preliminary Data for 2012." Story Behind the Data: Low birth weight (LBW) is a significant contributor to infant mortality, and infants with LBW are also at increased risk of developmental delays. Babies may be born either prematurely (before 37 weeks gestation) or full-term (37 to 41 weeks gestation) but small for gestational age. The percent of infants with LBW born in Maryland, at 8.8% in 2012, continues to be higher than the national average, at 8.0%. While the percent of infants with LBW increased in Maryland and nationally between 2001 and 2006, the rate declined in Maryland and nationally since that time. Some of the same racial disparities occur in LBW as in infant mortality, with Black infants nearly twice as likely to be born at LBW as compared to White infants. 3 Key maternal risk factors for LBW include chronic disease, smoking, obesity, unintended pregnancy, late or no prenatal care, and maternal age. As LBW is one of the leading causes of infant mortality in Maryland, many of the interventions established by the Babies Born Healthy Program mentioned in the Infant Mortality section also serve to reduce the percentage of LBW infants. LBW remains a key indicator both in Maryland and nationally, where one of the Healthy People 2020 goals is to reduce low birth weight births to 7.8% of all live births. (HealthyPeople.gov). 14

21 01 HEALTH BABIES BORN HEALTHY Births to Adolescents: The rate of births to adolescent females ages 15 through 19 years, per 1,000 age specific population. 4 Adolescent Birth Rate per 1,000 women (ages yrs), Maryland, U.S., MD US * US data for 2012 are preliminary Data Source: MD DHMH, Vital Statistics Administration Annual Report 2012 Story Behind the Data: Maryland s teen birth rate has declined by 42% since In 2012, the birth rate to adolescents ages 15 through 19 reached 22.1 per 1,000 population. The rates among White non-hispanic, Black non-hispanic, and Hispanic teens all declined in comparison with 2011 rates, at 12.3, 33.0, and 44.6, respectively. Maryland s adolescent teen birth rate has been substantially lower than the national rate over the last ten years, while tracking the national decline in teen births over this period. Maryland's teen pregnancy prevention efforts focus on clinical and educational programming. Adolescents are served in family planning clinics and school-based health centers Statewide. Services include family planning and reproductive health services and counseling. The State Personal Responsibility Education Program (PREP) and Abstinence education programs provide curriculum-based programs in school, after school and community settings for adolescents and their parents/caregivers. The target population for educational programs range from age 10 through the early 20s. 15
22 01 HEALTH HEALTHY CHILDREN Indicators: Five Year Trend Average Yearly Percent Change* Recent Year Percent Change Recent Year Measurement Immunizations The percent of children aged months who have received the full schedule of recommended immunizations. -1.8% -10.0% 73.0% Hospitalizations The rate of nonfatal injury hospitalizations to children ages 0-21 years per 100,000 of the population. Deaths Unintentional Injuries -7.1% -5.2% Assault Injuries -10.1% -15.7% Self-Inflicted Injuries 2.8% -2.5% per 100, per 100, per 100,000 The rate of deaths to children ages 0-21 years per 100,000 of the population. -5.5% -3.1% 57.2 per 100,000 Indicates an area of positive growth. Indicates an area of negative growth. *Indicates average yearly percent change over five year period unless otherwise noted. 16
23 01 HEALTH HEALTHY CHILDREN Immunizations: The percent of children aged 19 through 35 months who have received the full schedule of recommended immunizations. 5 Estimated Vaccine Coverage of Children Ages 19 through 35 Months Survey Year MD 77.4% 76.0% 78.6% 78.1% 91.3% 80.2% 84.0% 73.3% 81.1% 73.0% US 72.5% 76.0% 76.1% 76.9% 77.4% 76.1% 76.0% 74.9% 77.0% 71.9% Data Source: National Immunization Survey (NIS) of children aged months using random digit dialing methods. Story Behind the Data: The immunization status of young children is a positive predictor of avoidance of illness, death, disability, or developmental delays associated with immunization-preventable diseases. Maryland s 2012 immunization rates were above the national average for children aged 19 through 35 months, at 73.0% versus the national average of 71.9% rates represent a decline in comparison with the last few years; however, this year, the CDC survey results of children 19 through 35 months included Haemophilus influenzae B vaccine data as a part of the overall coverage rate for Maryland and the US, which had previously been excluded due to a three year nationwide shortage of the vaccine. This likely accounts for at least a portion of the decline. Maryland continues to exhibit strong immunization rates amongst enrolled kindergarteners. To comply with the Code of Maryland Regulations, schools report the number of fully-vaccinated students enrolled in kindergarten. From 2003 to 2013, 98% or more of Kindergarten students have been fully vaccinated. More than 99% of the kindergarteners surveyed had immunization records. The rates of DTaP, Polio, and Varicella vaccinations were over 99%. Some counties reported close to 100% vaccination rates. In addition, the Department of Health and Mental Hygiene s ongoing work with private vaccine providers through an initiative known as VFC/AFIX (Assessment, Feedback, Incentive, Exchange), an analytical and quality control tool, has shown positive results. VFC/AFIX involves annual visits to physicians offices, where patient charts are reviewed to ensure immunization records are up-to-date. In those instances where they are incomplete, the physician is urged to correct the missed opportunity. 17
24 01 HEALTH HEALTHY CHILDREN Hospitalizations: The rate of nonfatal injury hospitalizations to children ages 0-18 years, years, and 0-21 years per 100,000 age specific population for selected categories of injury (unintentional, assault, self-inflicted). 8 Nonfatal Injury* Hospitalization Rate among Children (0-21 yrs) per 100,000, by Calendar Year Unintentional Injuries Assault Injuries Self-Inflicted Injuries Story Behind the Data: Childhood injuries requiring inpatient hospitalization present risks of long-term illness and disability. Not only are the injuries themselves traumatizing for the child and family, but also the cost to public and private medical insurance for care is high. Injuries may be the result of unintentional or intentional events. Most unintentional injuries are related to motor vehicles, falls, fires and burns, poisonings, choking and suffocation, and drowning. 9 Intentional injuries include assaults and self-inflicted injuries. In 2011, there were 3,578 total inpatient hospital discharges for unintentional injury; 602 discharges for injuries due to assault; and 791 discharges for self-inflicted injuries among Maryland children ages Non-Hispanic Black children had the highest rate of assault injury hospitalizations at 80.8 per 100,000, which was over five times higher than the rate among non-hispanic Whites and nearly nine times higher than among Hispanic children. Non-Hispanic White children had the highest rate of self-inflicted injury hospitalizations at 61.1 per 100,000. From 2006 through 2011, the rate of hospitalizations due to unintentional injuries among children ages 0 to 21 has declined by 26%. The rate of hospitalizations due to assault decreased by 39% over this period. The rate of self-inflicted injury hospitalizations increased 16% over this period. In 2010, motor vehicle accidents were the third-leading cause of injury-related emergency room visits for children ages In order to reduce this rate, 10 the statewide program, Kids in Safe Seats, provides free inspection of car seat installations and free car seats to those in need. This program, along with other injury prevention programs, is administered by the Environmental Health Bureau at DHMH. 11 Additionally, with funding from Maryland s Rape and Sexual Assault Prevention Program (RSAPP), some of the State s local rape crisis centers have been conducting educational sessions with youth covering topics such as healthy relationships, and have started implementing child abuse prevention programming. This funding has also supported participating local school systems in purchasing curricula and providing prevention-based education to students on topics such as bullying, teen dating violence, and healthy relationships. 18
25 01 HEALTH HEALTHY CHILDREN Child Deaths: The rate of deaths to children ages 0-21 per 100,000 in the age specific population. 12 Child (0-21 yrs) Death Rate per 100, * 2012* MD US * U.S. data for 2011 and 2012 not yet available Data Sources: MD DHMH, Vital Statistics Administration, Population: MDP Population Estimates U.S.: Centers for Disease Control and Prevention, National Center for Health Statistics, CDC Wonder Online Database Story Behind the Data: This indicator measures the worst health outcome for children. Child deaths due to homicide, suicide, and unintentional injury are all deemed potentially preventable, and responsive to interventions designed to reduce these deaths. Maryland s child (0-21 years) death rate decreased by 22% between 2006 and 2012 to 57.2 per 100,000 population. In 2012, 953 children between the ages of 0 and 21 years died. Death rates were higher among children years old, 84.4 per 100,000, compared to children 0-18 years, 52.6 per 100,000. Mortality was highest among non-hispanic Black children, 83.4 per 100,000, and substantially lower among non-hispanic White children, 44.1 per 100,000, and Hispanic children, 46.2 per 100,000. Since 2006, deaths among non-hispanic Black children decreased by 25%, deaths among non-hispanic White children by 27%, and deaths among Hispanic children by 6%. Maryland s child (0 to 21 years) death rates have consistently been higher than national death rates for the last 7 years; however, the gap has narrowed. In 2010, the last year for which U.S. data are available, the Maryland child death rate per 100,000 was 57.9 compared to the national rate of In order to address this issue, Maryland s jurisdictions each have a Child Fatality Review Team which meets regularly to review unexpected deaths to children living in each area. The purpose of these reviews is to identify changes in systems, policies, or practices at the local level which might reduce child deaths in the future. Examples of local Child Fatality Review Team activities include training and community outreach efforts addressing issues such as safe infant sleep practices, pool safety, CPR education, identification of child abuse, and gun safety. 19

26 01 HEALTH NEW PERSPECTIVES IN CHILDREN S HEALTH Health Insurance Coverage: The percent of children who have health insurance coverage. Percent of Children, Ages 0 to 19, with Health Insurance Coverage MD 89.5% 90.5% 94.5% 94.7% 94.6% 95.0% US 88.0% 88.8% 90.3% 90.9% 91.5% 92.1% Data Source: United States Census Bureau, Small Area Health Insurance Estimates: Why is Insurance Coverage important to children s health? While children s health coverage does not affect a child s ability to get treatment if he or she is sick or injured, children without health insurance often do not get routine and preventive care, which can result in health risks going undetected until issues become more serious and treatment ultimately more expensive. Maryland has made great strides in improving health insurance coverage among children since 2006, when 10.5% of children were uninsured. As of 2011, the most recent data from the Small Area Health Insurance Estimate (SAHIE) of the United States Census Bureau shows that 95% of Maryland s children have health insurance. The greatest gains in insurance coverage occurred between 2007 and 2008, likely attributable to Medicaid expansion in Maryland for families below 100% of the Federal Poverty Level. 13 Several other factors have also contributed to the increase in health care coverage for children, including nonprofits like HealthCare Access Maryland, an organization that assists Maryland residents with enrolling in public healthcare coverage and navigating the complex healthcare system. 14 Additionally, the Department of Health and Mental Hygiene works with families to enroll children in the Maryland Children s Health Program (MCHP) and MCHP Premium for families below 300% of the Federal Poverty Level. 15 Ensuring that children have access to health insurance is a vital component of the larger efforts to improve children s health outcomes. Another important part is improving access to needed community-based services. Many families experience difficulty identifying health services for their children, and gaining access to services can be nearly insurmountable in rural areas. With this problem in mind, Maryland s Office for Genetics and People with Special Health Care Needs created the Maryland Children and Youth with Special Health Care Needs Resource Locator, 16 which contains information on more than eight hundred resources that are searchable by a family s location
27 01 HEALTH NEW PERSPECTIVES IN CHILDREN S HEALTH Obesity: The percent of Maryland youth who are obese, describe themselves as overweight, or are trying to lose weight for students in high school grades 9-12: Percentage of Maryland public school students in grades 9-12 who: Are overweight or obese (measured by the BMI) 28.7% 28.3% 27.9% 27.4% Describe themselves as overweight 27.4% 27.5% 27.5% 26.3% Are trying to lose weight 42.5% 42.6% 43.7% 44.2% Weight Loss Methods Used: Exercise 58.4% 57.1% 60.1% 59.1% Dieting 38.6% 38.8% 36.4% 44.2% Fasting 10.3% 11.5% 10.7% 15.2% Diet Pills 5.5% 5.7% 5.4% 6.3% Vomiting/Taking Laxatives 3.2% 6.5% 5.9% 5.8% Data Source: The Maryland Youth Risk Behavior Survey (YRBS) How does Obesity impact children s health? Obese youth are at risk for factors associated with cardiovascular disease (e.g., cholesterol or high blood pressure), bone and joint problems, sleep apnea, and poor self-esteem. Obese youth are also more likely to become obese adults, and therefore, are at risk for the associated adult health problems, such as heart disease, type 2 diabetes, stroke, cancer, and osteoarthritis. The percentage of Maryland youth who are overweight or obese, or who describe themselves as overweight remained relatively unchanged between 2005 and Approximately one in four Maryland youth is overweight or obese (27.4% in 2011). Nearly half (44.2%) of Maryland youth are trying to lose weight, more so among females than males (58.0% vs. 31.0%), although there is no statistically significant difference between males and females who are overweight or obese or describe themselves as such. Between 2005 and 2011, there was a significant increase in the percentage of Maryland youth who reported not eating for 24 hours or more to lose weight or to prevent weight gain (10.3% in 2005 vs. 15.2% in 2011), but there was no change between 2009 and The percentage of females who reported not eating for 24 hours or more to lose weight or to prevent weight gain increased from 14.3% in 2009 to 20.9% in One in five (20.9%) females reported not eating for 24 hours or more to lose weight or to prevent weight gain while only 9.4% of males reported doing so. 21
28 01 HEALTH NEW PERSPECTIVES IN CHILDREN S HEALTH The percentage of Maryland youth who vomited or took laxatives to lose weight or to prevent weight gain increased from 3.2% in 2005 to 5.8% in 2011, but remained stable between 2009 and The Maryland State Department of Education (MSDE) supports programs in comprehensive health and physical education, as both content areas address the health and wellness of Maryland s students. MSDE also works closely with the Maryland Association for Health, Physical Education, Recreation, and Dance, an organization that supports teachers across the State, to help promote best practices in physical education. MSDE also supports local wellness policy initiatives, creating a number of resources and holding annual meetings to assist local implementation of wellness policies. Moreover, the increasing rates of hunger in Maryland due to the economic recession have likely caused a similar increase in obesity rates. While it may seem counterintuitive, obesity and hunger can coexist in the same individual due to additional risk factors associated with poverty. These factors include: Limited access to full-service grocery stores and farmer s markets; The expense of healthy food options; Greater availability of cheap, processed food; and A propensity to skip meals to stretch food budgets yet overeat when food is available. For these reasons, and many others, there is an increased focus on providing individuals and families receiving food benefits with nutrition education. By addressing hunger and access to healthy foods, Maryland will be able to limit both the rates of food insecurity and obesity. 22
29 01 HEALTH NEW PERSPECTIVES IN CHILDREN S HEALTH Substance Use: The illegal use of alcohol, tobacco, and other drugs (ATOD) by Maryland youth. Use of ATOD poses many health risks for youth. Early use of some substances (e.g., alcohol, tobacco, and marijuana) is associated with later drug use and the prevalence of high-risk behaviors. Alcohol Use - Percentage of Maryland public school students in grades 9-12 who: Have ever had a drink of alcohol 73.1% 72.9% 67.2% 63.5% Had a drink of alcohol before age % 23.5% 24.5% 23.2% Are current drinkers (at least one drink of alcohol on at least 1 day during the 30 days before the survey) 39.8% 42.9% 37.0% 34.8% Are binge drinkers (five or more drinks of alcohol, within a couple of hours, on at least 1 day during the 30 days before the survey) 20.8% 23.9% 19.4% 18.4% Tobacco Use - Percentage of Maryland public school students in grades 9-12 who: Ever tried cigarette smoking 48.5% 50.3% 43.5% 41.2% Smoked a whole cigarette before age % 13.4% 10.8% 10.9% Are current cigarette smokers (smoked cigarettes on at least 1 day during the 30 days before the survey) 16.5% 16.8% 11.9% 12.5% Are heavy cigarette smokers (smoked more than 10 cigarettes per day on the days they smoked during the 30 days before the survey) 7.4% 7.4% 4.4% 4.4% Are current smokeless tobacco users (used chewing tobacco, snuff, or dip on at least 1 day during the 30 days before the survey) 2.9% 4.2% 5.4% 7.2% Are current cigar smokers (smoked cigars on at least 1 day during the 30 days before the survey) 11.6% 11.0% 12.7% 12.9% Marijuana Use - Percentage of Maryland public school students in grades 9-12 who: Have ever tried marijuana 38.2% 36.5% 35.9% 37.0% Tried marijuana for the first time before age % 8.6% 8.1% 8.5% Are current marijuana users (used marijuana one or more times during the 30 days before the survey) 18.5% 19.4% 21.9% 23.2% Other Drug Use - Percentage of Maryland public school students in grades 9-12 who ever used the following drugs one or more times Cocaine (including powder, crack, or freebase) 6.9% 5.5% 6.3% 5.9% Methamphetamines 4.0% 3.0% 4.3% 4.5% Heroin 2.6% 2.4% 4.1% 4.2% Ecstasy 5.0% 6.3% 6.4% 6.9% Steroids (pills or shots without prescription) 3.6% 2.5% 3.9% 5.0% Inhalants (glue, aerosol cans, paint) 12.5% 12.9% 11.0% 9.4%
30 01 HEALTH NEW PERSPECTIVES IN CHILDREN S HEALTH Why is Substance Use an important indicator for children s health? Youth who begin drinking in early adolescence are four times more likely to develop alcohol dependence than those who abstain until adulthood. Alcohol use among youth is associated with a variety of health and social problems, including injuries, accidental deaths, suicide, antisocial behavior, and violence. Between 2005 and 2011, there was a significant decrease in the percentage of Maryland youth who had ever had a drink of alcohol, both overall and among males. While not significant, a greater percentage of females (66.8%) than males (59.8%) reported ever having had a drink of alcohol. There was no significant change in other alcohol use behaviors; however, just over one-third (34.8%) of Maryland youth are current alcohol drinkers and nearly one-fifth (18.4%) of youth engage in binge drinking. The overwhelming majority of adult cigarette smokers initiated and established the habit during adolescence. Although youth may not recognize the short-term impact of cigarette use, damage to the respiratory and cardiovascular systems is almost immediate, and many of the long-term diseases such as lung cancer are more prevalent among adults who began smoking in their adolescence. The majority of tobacco use behaviors remained unchanged between 2005 and 2011, but there was a significant increase in the use of smokeless tobacco, overall and among males. The use of illegal drugs among youth has been associated with antisocial behavior, academic problems, violence, and unintentional injuries. Nationwide, 18% of drivers killed in motor vehicle accidents tested positive for illegal drugs. Additionally, illegal drug use contributes directly and indirectly to HIV/AIDS rates. Overall, the percentages of youth who have ever tried marijuana, tried marijuana for the first time before age 13, and are current marijuana users has not changed significantly between 2005 and Current marijuana use among males, however, has increased significantly. Between 2005 and 2011, there was a significant increase in the percentage of youth who had ever used a needle to inject an illegal drug into their body. There was no significant change, however, in inhalant, ecstasy, cocaine, and steroid use among youth overall. There was a significant decrease in inhalant use among females from 13.6% to 8.2% (data not shown). Significantly more males than females have ever used heroin or steroids. While substance abuse prevention must be addressed by all stakeholders, MSDE continues to assist local school systems in developing, implementing, and sustaining scientifically-based research programs to prevent and reduce ATOD use in and around schools. Substance abuse prevention education is also taught as part of comprehensive health education in Kindergarten through 12th grade in all Maryland public schools. 24
31 01 HEALTH ENDNOTES 1 For Maryland data, racial groupings were determined by the race of the mother. 2 Maryland maps with birth and infant mortality data by jurisdiction are available at: infantmortality/index.html and information on Maryland s Plan for Reducing Infant Mortality can be found at: dhmh.maryland.gov/babiesbornhealthy/pdf/plan_reducing_infant_mortality_md_dec2011.pdf 3 For Maryland data, racial groupings were determined by the race of the mother. 4 Jurisdictional data is presented in age groups: 10-14, 15-17, and As pregnancies between ages 10 and 14 occur at a much lower rate than in age groups 15-19, there is greater variability between reporting years in the year age group. 5 The recommended full schedule is 4 doses of diphtheria vaccine, 3 doses of polio vaccine, 1 dose of measlescontaining vaccine, 3 doses of Hib vaccine, 3 doses of hepatitis B vaccine, and 1 dose of varicella vaccine (4:3:1:3:3:1 series). 6 For 2012 data, the 95% confidence interval was ±6.8% for Maryland, compared with ±1.4% for the national data. Therefore, Maryland data may not reflect immunization coverage as accurately as the national data. 7 For more information on the work of Maryland s Center for Immunization, visit ideha.dhmh.maryland.gov/ OIDEOR/IMMUN 8 These data refer to encounters with the healthcare system, not to individuals or to incidents. Recurring visits, either for the same injury or for subsequent injuries, were counted separately. Out-of-state hospitalizations for Maryland residents are not included in these data. 9 The unintentional injury category excludes those injuries due to medical procedure and therapeutic drug adverse events. 10 Injuries in Maryland: 2010 Statistics on Injury-related Emergency Department Visits, Hospitalizations and Deaths. MD DHMH Jurisdictional data is grouped by ages: 0-18 and Caution should be used when interpreting small numbers. 13 House approves Medicaid expansion, Laura Smitherman. Baltimore Sun, November 19, articles.baltimoresun.com/ /news/ _1_health-care-health-insurance-omalley Locator is available online at: 17 State Launches Online Resource Database for Children and Youth. DHMH Press Release, February 14, The Maryland Youth Risk Behavior Survey (YRBS) is part of the Youth Risk Behavior Surveillance System (YRBSS) developed in 1990 by the U.S. Centers for Disease Control and Prevention (CDC) to monitor behaviors that affect morbidity (disease) and mortality (death) among high-school-age youth. The YRBS monitors several categories of health-risk behaviors among youth. The 2011 Maryland YRBS was administered in the spring of 2011 to students in a representative sample of Maryland public high school classrooms. A total of 2,920 students in 30 Maryland public high schools completed the survey. The school response rate was 100%, and the overall student response rate was 72%. The 2011 Maryland YRBS results are representative of all Maryland s public school students in grades
32 02 EDUCATION 26
33 02 EDUCATION SCHOOL READINESS Indicators: Five Year Trend Average Yearly Percent Change* Recent Year Percent Change Recent Year Measurement Kindergarten Assessment The percent of students enrolled in public school Kindergarten in Maryland that score Full Readiness on the Kindergarten Assessment. Composite 4.9% -1.3% 82% Social & Personal 4.1% -0.5% 80% Language & Literacy 5.9% -0.8% 72% Mathematical Thinking 4.6% -2.7% 75% Scientific Thinking 11.1% -0.8% 70% Social Studies 3.4% -0.5% 76% The Arts 4.4% -1.1% 84% Physical Development 3.2% 0.6% 90% Indicates an area of positive growth. Indicates an area of negative growth. *Indicates average yearly percent change over five year period unless otherwise noted. 27
34 02 EDUCATION SCHOOL READINESS Kindergarten Assessment: The percentage of composite scores for students based on their readiness in the domains of the Maryland Kindergarten Assessment. Percentage of Composite Scores for Maryland Kindergarten Students Based on Their Readiness in the Domains of the Maryland Kindergarten Assessment, by Fiscal Year Full Readiness 52% 55% 58% 60% 67% 68% 73% 81% 83% 82% Approaching Readiness 41% 38% 35% 34% 28% 28% 24% 16% 15% 15% Developing Readiness 7% 6% 6% 6% 5% 4% 3% 3% 3% 3% Story Behind the Data: Research shows that children who have access to high-quality early-learning experiences are more likely to complete high school, graduate college, and become productive citizens. Additionally, a Maryland study conducted by the Regional Economics Studies Institute (RESI) at Towson University shows that for every $1 spent on high quality early childhood education, society saves as much as $4 in remedial and corrective services. The annual MSDE Kindergarten Assessment known as the assessment component of the Maryland Model for School Readiness (MMSR) - helps Kindergarten teachers document and evaluate children s skills, knowledge, behavior, and academic accomplishments across a variety of curricular areas. These areas are represented by the following domains: social and personal development, language and literacy, mathematical thinking, scientific thinking, social studies, the arts, and physical development. Each student is scored on his or her performance in each of these domains, and then a composite score (overall readiness level) is computed from the student s assessment scores across all seven domains. Student readiness assessment information reflects scores for each of the seven domains and the composite score of all domains. Assessment information is also analyzed for each of the seven domains and the composite score by the following demographic information: Race/ethnicity; Gender; Prior early care; Special education; English Language Learners (ELL); and Enrollment in free and reduced priced meals program (FARMs) 28
35 02 EDUCATION SCHOOL READINESS Kindergarten teachers use the Work Sampling System (WSS) with all children throughout the school year. For the annual MSDE report, Children Entering School Ready to Learn, Kindergarten teachers provide information on students skills for the first (fall) grading period. To do so, teachers use portfolio-based assessments to document their students classroom performance during the first eight weeks of school. The fall assessment ratings are done on 30 WSS performance indicators that reflect the skills and abilities that can reasonably be expected from children upon entering Kindergarten. Reporting of the scores reflects the percentage of students who have reached one of the following levels of readiness: Full Readiness: Students consistently demonstrate skills, behaviors, and abilities, which are needed to meet Kindergarten expectations successfully. Approaching Readiness: Students inconsistently demonstrate skills, behaviors, and abilities which are needed to meet Kindergarten expectations successfully and require targeted instructional support in specific domains or specific performance indicators. Developing Readiness: Students do not demonstrate skills, behaviors, and abilities, which are needed to meet Kindergarten expectations successfully and require considerable instructional support in several domains or many performance indicators. In , the percentage of children rated as fully ready for school by the MMSR Kindergarten Assessment was 49%, with 44% percent of children rated as approaching readiness. By , the fully ready percentage had risen to 82%, with only 15% rated as approaching readiness. While many factors may have contributed to this dramatic improvement, there is a clear correlation between a child s performance on the MMSR Assessment and the child s predominant prior care experience during the year preceding entry into kindergarten. Specifically, exposure to an early care and education environment that supports the development of learningrelated skills and behaviors during the year prior to kindergarten appears to influence greatly a pre-school child s chances for success in kindergarten and later grades. In , 25.0% of kindergarteners had been enrolled in public pre-k programs; in , that figure climbed to 43.1%. In addition, during that 11-year period, child care licensing regulations were changed to require child care staff and providers to meet stricter professional qualification and training standards, and various initiatives to promote professional growth and development and to improve the overall quality of licensed child care throughout Maryland were launched. As a result, many more kindergarteners in than in were able to benefit from a more enriched, professional, and supportive prior care experience. The evidence of the MMSR Assessment outcomes versus those from therefore strongly suggests the importance of the prior care experience and its relevance to school success. 29
36 02 EDUCATION SCHOOL READINESS The Maryland School Readiness Report provides the school readiness results of Maryland s children Statewide, by subgroups, and for each of Maryland s 24 local jurisdictions. Encouraging results for are: Eighty-two percent of entering kindergarteners in school year are fully school-ready, up from 49% in Although there was a slight (1 point) decline from last year in full readiness, the State exhibits an overall upward trend in the percent of kindergarteners fully ready. Maryland retains high readiness levels in all Domains of Learning, including: Language & Literacy (72% fully ready for ), Mathematical Thinking (75% fully ready) and Scientific Thinking (70% fully ready). African-American kindergarteners made big strides: 79% of African-American children are fully school-ready in , up from 37% in and on par with last year. The 42-point jump is substantially higher than the State s overall readiness gain and reduces the school-readiness gap between African-American and White children from 19 points to 9 points. Children also made progress in the face of economic obstacles. The percentage of kindergarteners from lowincome households (as indicated by Free and Reduced Price Meal status) who are fully school-ready rose from 34% in to 76% in and The 42-point increase from reduced the school-readiness gap between children from low-income households and their peers from 18 points to 11 points in Children attending public pre-kindergarten (PreK) the year prior to entering Kindergarten continue to be wellprepared: 83% of these children are fully school-ready in , up from 47% in and on par with These children exceed the Statewide readiness average and show greater long-term improvements. 30
37 02 EDUCATION SCHOOL SUCCESS Indicators: Five Year Trend Average Yearly Percent Change* Recent Year Percent Change Recent Year Measurement Academic Performance Maryland School Assessment The average percent of public school students in grades 3 through 8 performing at or above proficient levels in reading and mathematics on the MSA. 1.4% 0.8% 83.6% High School Assessment The average percent of public school students in grades 9 through 12 performing at the passing level in four core subjects of the Maryland HSA: Algebra, Biology, English 2, and Government % 0.9% 82.9% Truancy Percent of public school students in all grades absent more than 20 days of the school year (excluding summer school). -2.6% -4.4% 10.8% Indicates an area of positive growth. Indicates an area of negative growth. *Indicates average yearly percent change over five year period unless otherwise noted. 31
38 02 EDUCATION SCHOOL SUCCESS Maryland School Assessment: The average percent of public school students in grades 3 through 8 performing at or above proficient levels in reading and mathematics on the Maryland School Assessment (MSA). Percentage of Students, Grades 3-8, Scoring At or Above Proficient on the Maryland School Assessment, by Academic Year Reading 68.4% 72.2% 74.2% 76.2% 82.2% 84.4% 84.8% 85.8% 85.2% Math 58.1% 64.6% 68.9% 71.8% 76.0% 77.9% 79.5% 80.0% 82.0% Story Behind the Data: The MSA requires students from grades 3 through 8 to demonstrate their knowledge of reading and math and produces a score that describes how well a student mastered the reading and math content specified in the Maryland Content Standards. Students with severe cognitive disabilities who are pursuing an alternate course of study based on their Individualized Education Program (IEP) take the Alt-MSA, Maryland s alternate assessment. Each child receives a score in each content area that categorizes his/her performance as basic, proficient, or advanced. This data provides parents, caregivers, teachers, and school administrators with objective information on how each student is progressing academically. In 2012, MSDE received approval for Elementary and Secondary Education Act (ESEA) Flexibility by adhering to certain federal requirements for our public education system. The ESEA, commonly referred to as "No Child Left Behind" (NCLB), was created a decade ago to establish a system that focused on accountability, improving standards, and eliminating achievement gaps. The consequences of NCLB, however, are prohibiting some states from developing new and innovative reforms. As a result, the U.S. Department of Education (USDE) has offered states flexibility around 12 of the provisions of NCLB. Maryland is one of 34 states and the District of Columbia to receive approval on its Flexibility Request. As a result of ESEA Flexibility, schools will now be measured using the new Maryland School Progress Index (SPI). SPI is based on high expectations and multiple measures that include student achievement data in English/Language Arts, Mathematics, and Science; growth data in English/Language Arts and Mathematics; and, gaps, based on the gap score between highest-achieving and lowest-achieving subgroup in English/Language Arts, Mathematics, Science, Cohort Graduation and Cohort Dropout rates. Maryland s Progress Index will differentiate schools into one of five strands which determine the district and State support schools receive. The State affords top-performing schools greater flexibility while lower-performing schools receive progressively more prescriptive technical assistance, expectations, and monitoring. 32
39 02 EDUCATION SCHOOL SUCCESS ESEA Flexibility does not retreat from Maryland s long-standing work to improve schools through accountability. It does, however, make some fundamental changes to the way the State implements accountability measures going forward. The NCLB continuum of sanctions known as the School Improvement Process and its measuring system, known as Adequate Yearly Progress (AYP), are no longer part of Maryland s accountability system. As part of the new accountability system, Maryland has identified three groups of Title I schools (Reward, Priority, and Focus) to allow for the most specialized attention and support for each specific school and to focus on closing the achievement gaps within all schools. Achievement information for schools, school systems, and the State is published in the annual Maryland Report Card. This report provides SPI charts for each public school and local school system, showing the school/ system s progress on each ESEA Flexibility performance goals. Comparing the percentage of children scoring in the Proficient level from across each grade level, there was an increase in 3rd grade (1.6%) and 8th grade (1.1%) in Reading, and there was an increase in 7th grade (0.3%) and 8th grade (0.3%) in Mathematics. Similarly, comparing the percentage of children scoring in the Advanced level from across each grade level, there were increases in 4th grade (4.7%), 5th grade (1.8%), and 7th grade (0.6%) in Reading, and increases in 3rd grade (4.6%), 4th grade (4.6%), 5th grade (5.2%), 6th grade (5.8%), 7th grade (3.5%), and 8th grade (3.6%) in Mathematics. Overall, the data shows significant improvement in both reading and math over the last several years, as teachers used information from formative assessments, benchmarks, and the summative assessments (MSA) to identify areas of need. The result was a series of interventions and supports aimed at assisting students who struggled with identified standards, allowing for improved scores overall. 33
40 02 EDUCATION SCHOOL SUCCESS High School Assessment: The percentage of public school students in grades 9 through 12 performing at the passing level in three or four core subjects of the Maryland High School Assessment (HSA): Algebra, Biology, English 2, and Government. Percentage of Maryland High School Students Receiving a Passing Score in the Maryland High School Assessment, by Academic Year Algebra 84.4% 85.1% 83.6% 83.6% 83.9% Biology 82.0% 82.5% 81.0% 81.3% 81.7% English 82.0% 83.5% 80.1% 81.7% 83.1% Story Behind the Data: The achievement of minimum academic standards affects graduation, adult achievement, and future academic pursuits, and ultimately contributes to the competitiveness of Maryland s workforce. Students take each High School Assessment (HSA) at the completion of the corresponding course. Accordingly, students may take these exams during any high school grade. In 2004, the State Board of Education ruled that, beginning with the class of 2009, public school students must pass the High School Assessments (HSA) to graduate. On April 24, 2012, the State Board of Education approved the reinstatement of the Government HSA as a graduation requirement. As a result, entering 9 th graders in the school year will be required to pass or obtain a combined score of 1602 on the four high school assessments, algebra/data analysis, English, biology, and government to meet the graduation requirement. The first administration of the Government HSA in the school year will be the January 2014 administration. Each assessment test covers about 60% of a course s content, and takes approximately two and one-half to three hours to complete. In 2012, the percentage of students passing in each subject area increased slightly from the 2011 percentage of students passing the HSAs. For students who do not pass the HSA, additional instruction is available through the local school systems and students may retake the assessment multiple times. For students unable to pass the HSA after two attempts, the Bridge Plan for Academic Validation offers alternatives to the assessment. 1 34

41 02 EDUCATION SCHOOL SUCCESS Truancy: Percentage of students in all grades (public schools) absent more than 20 days of the school year (excluding summer school). 2 Percent of Maryland Public School Students Absent More than 20 Days by Academic Year MD 13.1% 13.2% 13.5% 13% 12.4% 12% 11.3% 11.2% 11.3% 10.8% Story Behind the Data: Absenteeism and truancy contribute to lost learning opportunities and have negative long-term consequences for students and communities. High levels of school absence are associated with a higher risk of school failure, high school dropout, delinquent behavior, substance abuse, and other high-risk behaviors. The current data reporting system is structured to collect statistics for absences of more than 20 days, although it is important to note that these data do not differentiate between students with excused versus unexcused absences. Additionally, this measure does not include students enrolled for fewer than 91 days during the school year. Maryland educators appreciate the significant role parents play in their children s education, and absentee rates from school are one measure of parent-school collaboration. Between 1999 and 2012, the percentage of students absent 20 or more days decreased from 13.7% to 10.8%. The Maryland State Board of Education s family involvement policy, adopted in October 2001, is supportive of the fact that when schools, families, and community organizations work together to support learning, children tend to do better in school, stay in school longer, and like school more. Through this policy, MSDE is able to create professional development programs on family, school, and community involvement for school staff and families. Additionally, through programs like Positive Behavioral Interventions and Supports (PBIS), Truancy Courts in four school systems, and a regional consortium on the Eastern Shore, as well as the strong involvement of Pupil Personnel Programs addressing individual involvement with local departments of social services, juvenile services, and the Attorney General s Office, Local School Systems are continuing to place an emphasis on school attendance and achievement. 35
42 02 EDUCATION SCHOOL COMPLETION Indicators: Five Year Trend Average Yearly Percent Change* Recent Year Percent Change Recent Year Measurement Dropout Program Completion The percent of public school students, grades 9-12, who withdrew from school before graduation or before completing a Maryland approved educational program during the academic year and are not known to have enrolled in another high school program. 2.3% 9.4% 3.5% The percent of high school graduates who successfully completed the minimum course requirements needed to enter the University System of Maryland, to complete an approved Career and Technology Education program, or who completed requirements for both. University of Maryland % -0.9% 57.9% Career & Technology % 3.3% 9.4% Both - 2.4% 13.7% 11.6% Total -0.7% 1.5% 78.9% Program Completion of Students with Disabilities Percent of students with disabilities who exit special education by graduating or completing school. With Diploma 1.2% -5.8% 38.0% With Certificate 3.2% 5.4% 7.1% Indicates an area of positive growth. Indicates an area of negative growth. *Indicates average yearly percent change over five year period unless otherwise noted. 36
43 02 EDUCATION SCHOOL COMPLETION High School Dropout: The percentage of public school students, grades 9-12, who withdrew from school before graduation or before completing a Marylandapproved educational program during the July to June academic year and are not known to have enrolled in another high school program during the academic year. Percentage of Public High School Students, Grades 9-12, who Drop out of School - by Academic Year MD 3.4% 3.8% 3.6% 3.6% 3.5% 3.4% 2.8% 2.5% 3.2% 3.5% Story Behind the Data: In Maryland, local school systems collect data on the reasons why students drop out of school. These often include student mobility, lack of interest, and disciplinary reasons. From 2011 to 2012, the percentage of public high school students who dropped out of high school increased from 3.2% to 3.5%. In 2011, Maryland was below the national average in the measurement of teens ages 16 to 19 not in school and not high school graduates. 3 In order to address this issue, MSDE has produced the Dropout Resource Guide. This guide, the first of its kind in the United States, highlights evidence-based programs and lists local school systems dropout prevention programs and initiatives. Many dropouts, before they leave school, have been suspended. As a result, MSDE is engaged in discipline reform through updating the Maryland Guidelines for a State Code of Discipline. Additionally, MSDE is working with local school systems to develop strategies and interventions to reduce disruptive student behavior. Systemically, school-based inventions begin with Student Support Teams. These school-based teams of educational professionals meet monthly to discuss students who are struggling maintaining academics, behavior, and attendance. Student Support teams identify school-based strategies to help students become successful. If students remain unsuccessful, they are referred to Pupil Personnel Workers (PPW). Local School Systems utilize their PPWs to support students at-risk for dropout. Pupil Personnel Workers provide supports to families and students through case management on student attendance, behavior, and performance. Moreover PPWs can identify and connect services for a student through state or local agencies. 37
44 02 EDUCATION SCHOOL COMPLETION Additionally, Maryland has kept its dropout rate lower than the national average through the implementation of evidence based practices such as Check and Connect, and Check-in/Check-out. Check and Connect- Student support program that assigns a mentor/case manager to students who are struggling to complete school. This case manager monitors his/her caseload s attendance, behavior, and academic performance. Check-in/Check-out- Student engagement practice that assigns a school staff member as a mentor to at-risk students. Before the student begins his/her school day, he/she checks in with an assigned mentor, and the student checks out with the mentor when he/she leaves. Annually, data about dropouts is analyzed and technical assistance is provided to local school systems that are near or above the state standard of three percent. Technical assistance includes professional development, tools to monitor dropout, materials, and programs to reduce dropout. Additionally, all Maryland Local School Systems have alternative programs or centers for students struggling to be successful in a traditional school setting. The alternative programs offer smaller class sizes and allow students to build relationships with staff, improving student connectedness, which increases student resiliency. 38
45 02 EDUCATION SCHOOL COMPLETION High School Completion: The percentage of high school graduates who successfully completed the minimum course requirements needed to enter the University System of Maryland, to complete an approved Career and Technology Education program, or who completed requirements for both. Percentage of High School Graduates who Meet the Requirements to Enter the University of MD System, Complete a Career and Technology Program, or Both, by Academic Year University of MD 53.2% 54.5% 57.0% 57.6% 55.7% 60.1% 55.3% 55.3% 58.4% 57.9% Career & Technology 15.1% 14.4% 13.4% 12.3% 12.7% 10.8% 10.3% 9.3% 9.1% 9.4% Both 10.6% 10.0% 12.1% 12.5% 13.2% 10.7% 9.6% 9.7% 10.2% 11.6% Total 78.9% 78.9% 82.5% 82.4% 81.6% 81.6% 75.2% 74.3% 77.7% 78.9% Story Behind the Data: Between 2003 and 2012, the percentage of graduates who completed the requirements for both the University System of Maryland and the Career and Technology Education program has increased slightly. In 2003, 10.6% of graduates completed both sets of requirements as compared to 11.6% in The percentage of students completing the University System of Maryland requirements increased to 57.9% but has remained relatively consistent since The Career and Technology Education program increased over its 2011 rate but remains significantly below its 2003 rate, at 9.4%. Since that year, Career and Technology Education programs have been updated to reflect the changing requirements for career entry and success. Working with business and industry partners, as well as with institutions of higher education, MSDE is developing and supporting 43 new State CTE Programs of Study. This will provide expanded opportunities for students to gain the academic and technical skills for entry into a career pathway. For a description of these CTE programs, please visit CTE programs prepare graduates for a broad range of career opportunities based on Maryland s economy. For example, the fastest growing CTE programs are in the areas of pre-engineering and biomedical sciences two key industry sectors with expanding opportunities in Middle-Skills jobs and advanced STEM careers. As Local School Systems adopt these programs, MSDE anticipates a significant growth in the overall percentage of students completing a CTE program and meeting University of Maryland requirements. MSDE encourages all students to complete both options so they are college and career ready. 39
46 02 EDUCATION SCHOOL COMPLETION Program Completion of Students With Disabilities: The percentage of students with disabilities, ages 14 through 21 who graduate or complete school. Graduated with Diploma Students with Disabilities who Graduate with Diploma or Certificate, by Academic Year % 35.00% 36.47% 36.68% 40.91% 40.30% 37.96% Graduated with Certificate 5.35% 5.35% 6.25% 6.48% 6.63% 6.71% 7.07% Data Sources: 2012 Maryland Data: Unpublished data provided by MSDE (State totals include students in non- jurisdictional agency placements) National Data: U.S. Department of Education, Office of Special Education Programs, Data Analysis System (DANS) Story Behind the Data: The percentage of students with disabilities in Maryland who graduated/completed high school saw a steady increase between 2006 and However, in 2012, the percentage of students with disabilities in Maryland who graduated with a diploma decreased by more than two percentage points, while the percent graduating with a certificate saw a modest gain of.36% Several factors have directly contributed to the recent decrease in the number of students with disabilities who received a high school diploma, including: more rigorous academic testing requirements for graduation and rapidly changing population demographics in both urban and rural school districts. MSDE is sensitive to the myriad of social, emotional and physical challenges often faced by students with disabilities, which if not addressed, can have an adverse impact on the dropout, truancy and suspension rates among this population. To address these concerns, Maryland is continuing to build, implement, and sustain special education programs and related services with evidence-based practices that will yield results in dropout prevention, re-entry, and school completion for these students. Maryland is one of 48 states that is currently engaged in a diverse number of targeted, evidence-based interventions to improve graduation/school completion rates for students with disabilities including: Positive Behavioral Interventions and Supports, Universal Design for Learning, Response to Intervention, literacy initiatives, mentoring programs, transition supports, and recovery and re-entry programs. In an effort to enhance the quality of life for students with disabilities and their families, MSDE, Division of Special Education and Early Intervention Services (DSE/EIS) launched a five-year strategic plan through January Focused on four strategic imperatives, the strategic plan is designed to advance the Division s overarching vision of narrowing the achievement gap for all children with disabilities from birth through age
47 Strategic imperatives: 02 EDUCATION SCHOOL COMPLETION Early Childhood: Early Childhood service delivery systems must be aligned and all providers must be highly effective and qualified. Training: Teacher/service provider training programs need to be designed to prepare all teachers/service providers to teach students with disabilities. Access: All students with disabilities must have access to rigorous universally designed instruction, targeted interventions, and appropriate assessments that move students towards college and career readiness. Transition: Providers of transition services need to be knowledgeable and equipped to support students with disabilities in post-secondary completion and employment. As the #1 school system in the nation for the past five years, Maryland s students have benefited greatly from three new federal grants that were awarded to MSDE by the U.S. Department of Education. The Race to the Top (RTT) grant (2011); the Race to the Top, Early Learning Challenge Grant (RTTEC) grant (2012); and the State Personnel Development grant (2013) awards have allowed MSDE to create a number of new and innovative initiatives to facilitate school improvement and reform efforts at the state and local school system level (LSS). Targeted activities include: Supporting LSSs and Public agencies (PAs) in obtaining state-of-the-art assistive technology devices and providing training in their efforts to enhance access to the general curriculum for students with disabilities; Providing intensive district-wide professional development for special education and regular education teachers that focuses on scaling-up, through replication, proven and innovative evidence-based strategies in reading, math and positive behavioral supports to improve outcomes for students with disabilities; Developing and expanding the capacity to collect and use data to improve teaching and learning; and Expanding the availability and array of inclusive placement options for preschool age students with disabilities by developing the capacity of public and private preschool programs to serve this population of children. The MSDE, Division of Special Education and Early Intervention Services will continue to monitor the number of children receiving special education and related services in Maryland who graduate with a high school diploma or certificate of completion. The DSE/EIS is committed to providing leadership, support, accountability for results, resource and fiscal management to our public and nonpublic schools, public/private agencies and key stakeholders in developing a seamless, comprehensive system of coordinated services to children and students with disabilities, birth through age 21 and their families. 4 41
48 02 EDUCATION SCHOOL TRANSITION Indicators: Educational Attainment Five Year Trend Average Yearly Percent Change* Recent Year Percent Change Recent Year Measurement The percent of young adults 18 to 24 years old who have attained a high school diploma, associate s degree, or higher degree. Less than high school -3.5% -5.4% 12.3% High school % -0.7% 29.0% Some college or Associate s 2.8% 1.5% 46.5% Bachelor s -2.0% 2.5% 12.3% Youth Employment Percentage of young adults ages 16 to 24 years old who are in the labor force. -1.7% -1.3% 59.2% Indicates an area of positive growth. Indicates an area of negative growth. *Indicates average yearly percent change over five year period unless otherwise noted. 42
49 02 EDUCATION SCHOOL TRANSITION Educational Attainment: The percent of young adults ages 18 through 24 who have not completed high school, completed high school, completed some college or an associate s degree, or attained a bachelor s degree or higher. Educational Attainment of Young Adults Ages in Maryland Less than high school graduate 17.1% 14.4% 14.2% 14.3% 13.3% 14.2% 13.0% 12.3% High school graduate (includes equivalency) 35.0% 36.4% 32.8% 30.7% 31.6% 29.3% 29.2% 29.0% Some college or associate's degree 35.2% 37.0% 40.6% 41.7% 41.6% 43.3% 45.8% 46.5% Bachelor's degree or higher 12.7% 11.8% 12.3% 13.4% 13.5% 13.2% 12.0% 12.3% Data Source: Maryland American Community Survey Total Estimate Story Behind the Data: Educational attainment, including the type of education one receives, has a direct effect on a person s well-being and economic security throughout life. At a time when colleges and universities are reevaluating the educational options offered to students to provide a high quality education for a lower cost, the benefits of higher education continue to outweigh entering the labor force prior to getting an associate s or bachelor s degree. The median salary for a college graduate is $56,853, nearly $25,000 more than the yearly salary of a high school graduate at $32,233. In Maryland, the majority of young adults have at least an associate s degree or some college credits. The percentage of young adults ages 18 to 24 in Maryland who have earned a bachelor s degree or higher is almost 3% more than the national percentage of the same group. Although the percent of young adults who have attained a bachelor s degree has slightly decreased, a higher percentage of young adults are completing high school (however, the slight difference between years is within the margin of error). While a lower percent of young adults ages 18 to 24 have a bachelor s degree or higher, a great number attain this level of education later on as shown by the 25 to 34 age bracket, 90.2% of whom are high school graduates or higher and 39.9% have a bachelor s degree or higher. 5 Governor O Malley has proposed a number of strategies to increase college and vocational readiness. For the seventh consecutive year, in 2012 Maryland had the highest percentage of high school seniors in the country who scored at least a 3 on Advanced Placement (AP) exams. 6 Maryland s goal is to continue this progress with 35% of students from Maryland public schools achieving an AP exam score of 3 and an AP exam passage rate of 67% by Maryland is currently implementing the Common Core Standards Initiative to align schools curriculums with national standards and expectations of post-secondary education institutions and employers. Internationally-recognized benchmark assessments will also be implemented to increase the competitiveness of Maryland s public education system. By 2015, Maryland plans to increase the number of high school graduates with Career and Technology Education industry certifications or licenses by 10%, in continuation of programs that emphasize the value of STEM education (Science, Technology, Engineering, Math). 43

50 02 EDUCATION SCHOOL TRANSITION Youth Employment: The percentage of young adults ages 16 through 24 who are in the labor force, employed, or unemployed Year Olds in Labor Force, by Calendar Year MD 67.2% 64.1% 61.5% 63.4% 61.1% 59.9% 60.0% 59.2% US 64.4% 61.9% 60.9% 61.5% 59.5% 57.3% 57.2% 57.8% Data Source: American Community Survey Story Behind the Data: Youth employment in Maryland is supported by two of Governor O Malley s strategic goals: cultivating an economic environment for job growth and sustainability, and improving the quality of and access to education. The statistics demonstrate that education is integral to job security 89.1% of those who had a bachelor s degree or higher in 2012 were in the labor force as opposed to 76.7% labor force participation of those who had only graduated from high school. 9 College graduates also had a 6% lower unemployment rate than high school graduates. For this reason, the University of Maryland System froze tuition rates for four straight years, even during the recession, as the State provided $16 million to avert what was estimated to be a 4% increase in rates. 10 Additionally, Maryland has continued to support STEM (science, technology, engineering and math) education, while also creating a venture capital fund through public-private partnerships to invest in bio tech, information technology, telecom, and cyber security in an initiative called InvestMaryland. 11 Unemployment among young adults ages 16 through 24 was, unsurprisingly, significantly affected by the recession, with the unemployment rate increasing from 14.9% in 2008 to 20.8% in The recession resulted in a lower percentage of young adults (especially ages 16 to 19) in the labor force, yet during the same time period, more young adults took college classes or completed associate s degree programs, indicating a corresponding increase in educational attainment (see Educational Attainment indicator). Although the unemployment rate among young adults in Maryland began to stabilize as of 2011, the unemployment rate for 20 to 24 year olds was nearly double the rate of the 25 to 44 age group at 16.5%. The unemployment rate for the 20 to 24 age group has typically been about twice the rate of the 25 to 44 age group, 12 likely because younger adults have less educational and professional experience, on average. Young adults entering the labor force during and after the recession may face greater challenges than their earlier counterparts, as more young adults have spent longer periods unemployed or underemployed and are less likely to be employed than when their job search began. 13 To curb this trend, a greater emphasis must be placed on helping young adults get the education necessary for employment, promoting policies that encourage economic growth, and fostering partnerships amongst universities, local governments, workforce boards, business associations and employers to fill the employment gap. 44
51 02 EDUCATION NEW PERSPECTIVES IN CHILDREN S EDUCATION Alternative Maryland School Assessment: The Alternate Maryland School Assessment (Alt-MSA) tests the areas of math, reading, and science and is administered to students with disabilities in grades 3 through 8 and grade 10 when a student s IEP (individualized education plan) team finds that the Alt-MSA is the most appropriate assessment for the students educational needs. Percentage of Students, Grades 3-8, Scoring At or Above Proficient on the Alternative Maryland School Assessment, by Academic Year Math 67.5% 67.7% 67.3% 81.4% 87.2% 76.9% 82.3% 88.7% 89.5% Reading 70.1% 69.6% 64.3% 81.4% 87.6% 83.7% 87.7% 92.2% 92.1% Science 69.3% 61.0% 69.6% 81.5% 81.8% Why is the Alt-MSA important to children s education? The Alt-MSA is the assessment used for students with the most significant cognitive disabilities when, through the IEP Team process, it has been determined that the student cannot participate in the Modified MSA (Mod-MSA), even with accommodations. The Alt-MSA assesses and reports student mastery of individually selected indicators and objectives from the reading and mathematics content standards or appropriate access skills for students in grades 3 through 8, grade 10, and in science content standards for students in grades 5, 8 and 10. During the 2012 academic year, 4,481 students participated in the Alt-MSA. The Alt-MSA is a portfolio assessment constructed of evidence that documents individual student mastery of the assessed reading, mathematics, and science objectives. The Statewide performance standards reflect three levels of achievement: Basic, Proficient, and Advanced. The Division of Special Education/Early Intervention Services has worked closely with the Division of Curriculum to provide support to educators who instruct students with significant cognitive disabilities to understand the content to be taught and assessed in all content areas. In collaboration with the testing vendor, the Maryland State Department of Education (MSDE) has developed resource content materials to support instructional planning, delivery and Alt-MSA implementation for the educator. Professional development and technical assistance were provided to local school systems in all content areas by MSDE content leads, including instructional strategies and resources to support student achievement. In collaboration with the testing vendor and educators from the field, MSDE created the Alt-MSA online Professional Development Modules. The priorities of this four module series include: maximizing efficiency in the classroom, accessing grade-level content, understanding content and standards, gaining science content knowledge, creating artifacts that align to Mastery Objectives, and providing links to websites and resources. These modules are updated yearly with the most current information and best practices. In addition, preapproved artifacts for various mastery objects that demonstrate direct alignment between the content and the assessment task item were developed by content experts at MSDE and the testing vendor. These artifacts are available for teachers to select and use as evidence to demonstrate mastery of a skill as selected by the Alt-MSA testing team for a student. The advantage of selecting the pre-approved artifacts is that the artifact is accurately aligned to the content being assessed. 45
52 02 EDUCATION NEW PERSPECTIVES IN CHILDREN S EDUCATION Bullying and Harassment: Bullying is a form of aggression between a more powerful antagonist and his/her victim. Bullying can be physical, verbal, and/or psychological, and can be direct or indirect. Chronic victims may experience mental health problems such as anxiety, academic difficulties, poor concentration, and withdrawal. Bullying occurs across all age groups and includes sexual harassment, dating violence, gang attacks, cyberbullying, domestic abuse, child abuse, and elder abuse. Total Number of Bullying or Harassment Incidents Reported, by Academic Year MD Why is the reporting of Bullying and Harassment important to children s education? The Safe Schools Reporting Act of 2005 became effective on July 1, The law (Education Article 7-424, Annotated Code of Maryland) mandates that MSDE require a county board of education and the Baltimore City Board of School Commissioners to report incidents of harassment or intimidation against students in public schools under the county board's and commission s jurisdiction. Additionally, MSDE was required to create and distribute a Standard Victim of Harassment or Intimidation Report Form, and to submit a report to the Maryland General Assembly consisting of a summary of the information included in the victim of harassment and intimidation forms filed with the county and Baltimore City boards the previous school year. The 24 Local School Systems (LSSs) and the SEED School of Maryland reported a total of 5,213 incidents for the school year. Several LSSs reported relatively significant increases in the number of incidents, most notably Baltimore City, Howard, and Montgomery Counties. Baltimore City reported the most incidents with a total of 629 and a rate of 7.5 incidents per 1,000 enrolled students. Kent and Talbot County reported the most incidents relative to enrollment based on the preceding data. Montgomery County, Baltimore County, and Howard County reported 516, 464 and 459 incidents, respectively, representing rates relative to enrollment of, 3.5, 4.4 and 8.9 incidents per 1,000 enrolled students. Based on the methods of reporting and the varied means of distributing the reporting form in LSSs, it is speculated that the increase in reported incidents may be attributed to an increase in awareness of bullying and harassment on the part of students, staff and parents. Since the change in the law in 2008, staff members have been able to use the same reporting form as students and parents, thereby providing additional information. The school year marks the third year during which bullying prevention programming was required to be presented by the LSSs to students, staff, and volunteers, and it is speculated that the programming further heightened awareness of the issue among the school communities. Bullying continues to be a significant concern, as a single student who bullies can have a wide-ranging impact on the students they bully, students who observe bullying, and the overall climate of the school and community. Bullying can lead to low self-esteem, depression, isolation, and alienation in both the bully and the victim long after the incidents have ended. In addition, many victims of bullying do not want to come to school, leading to disengagement from the classroom and all that is offered by public education. As a result, MSDE has continued to provide support and best practices to LSSs in order to ensure bullying and harassment can be prevented or dealt with appropriately. 46
53 02 EDUCATION ENDNOTES 1 Academic eligibility requirements must be met for this program. 2 School attendance data is calculated as the percentage of students present in school for at least half the average school day throughout the school year. This measure is consistent with the Maryland State Department of Education (MSDE) standard that students attend 94% of school days. 3 The Annie E. Casey Foundation, Kids Count Data Center, 4 Additional resource information may be accessed online using the following websites: Maryland, Educational Attainment, American Community Survey Fact Finder, United State Census Bureau: pid=acs_12_1yr_s1501&prodtype=table. 6 Governor O Malley s StateStat: 7 Plan for Improving Student Achievement, and School, College, and Career Readiness by 25% in Maryland by End Employment statistics encompass the population of young adults ages 16 to 24 who are considered employed, unemployed, or in the labor force. Labor force includes civilian workers and also active members of the U.S. Armed Forces. SubjectDefinitions/2011_ACSSubjectDefinitions.pdf. Data limitations on page 68. The percentage of unemployed workers only takes into account those workers who are looking for work, which is why the sum of labor force participants and unemployed does not equal 100%, because the remainder may not be seeking employment. 9 Maryland, labor Force Participation, American Community Survey Fact Finder, United States Census Bureau: pid=acs_12_1yr_s2301&prodtype=table. 10 State To Keep Tuition Freeze. Steven Kiehl. Baltimore Sun, April 24, articles.baltimoresun.com/ /news/ _1_tuition-freeze-undergraduates-omalley. 11 Governor Martin O'Malley Announces InvestMaryland Proposal to Spur Jobs, Investments in Maryland's "Innovation Economy". Press Release. June 1, pressreleases/ asp. 12 According to the year estimate of the American Community Survey. 13 The Only Age Group With Higher Unemployment Than a Year Ago Is 20somethings. Jordan Weissmann. The Atlantic, April 5,
54 03 COMMUNITY
55 03 COMMUNITY SAFETY Indicators: Five Year Trend Average Yearly Percent Change* Recent Year Percent Change Recent Year Measurement Juvenile Felony Offenses Recidivism The rate of intake referrals to the Maryland Department of Juvenile Services (DJS) for youth ages for felony offenses by Fiscal Year, per 100,000 of the population. 10 through % -3.1% 15 through % -11.0% 10 through % -9.1% 382 per 100, per 100, per 100,000 Juvenile and adult re-adjudicated/convicted recidivism rates for youths released from the DJS committed programs after 12, 24, and 36 months. 12 Months 0.3% -6.3% 19.3% Maltreatment Child Protective Service (CPS) investigations that are ruled indicated or unsubstantiated, per 1,000 of the child population. Indicated 6.6%** 0% 6.9 per 1,000 Unsubstantiated 4.2%** 1.6% 6.4 per 1,000 Indicates an area of positive growth. Indicates an area of negative growth. *Indicates average yearly percent change over five year period unless otherwise noted. **Indicates average yearly percent change over three year period. 49
56 03 COMMUNITY SAFETY Juvenile Felony Offenses: The rate of referrals, per 100,000 youth ages 10-17, for felony offenses including both violent and nonviolent charges. 1 Rate of Referrals to DJS Per 100,000 Youth Ages 10-17, for Felony Offenses (Violent and Non-violent) by Fiscal Year, Maryland Age Group to to to Note: Violent and non-violent Felony offenses are counted once under each group per referral Story Behind the Data: Involvement in violent offenses increases the risk of injury or death and continued criminal activity into adulthood. Involvement in non-violent felony offenses increases a youth s risk for further criminal activity and violence both during adolescence and as an adult. Risk factors for juvenile delinquency include a lack of educational and job training opportunities, poverty, family violence, and inadequate care and supervision by family. Poor school performance, including absence from school and falling behind in one or more grade levels, increases the likelihood of involvement in delinquent activity. Additionally, the number of youth adjudicated (found responsible for the alleged offense) is an important correlator to juvenile referral rates. For the purpose of differentiating violent offenses from non-violent ones, if a youth is referred for both within the same referral then it would be a count of two offenses for that referral. It is rare to have multiple violent and/or non -violent felony offenses within the same referral. Violent offenses are automatic referrals to the adult system if a youth is 14 or older for murder, rape and sex offense - first degree charges - and 16 or older for robbery and aggravated assault. The rates given above include any youth waived back from the adult court to the juvenile system, but do not include youth who were arrested and not sent back to the juvenile system. The juvenile referral rate for felony offenses fluctuated from FY2003 through FY2006 for youth ages 10 through It has been a declining trend from FY2007, with FY2012 showing the lowest rates of all fiscal years reported. Between 2003 and 2012, the referral rate for felonies dropped by 51% from 1,872 per 100,000 to 935 per 100,000 for ages 10 to 17. During this time, violent offense referrals dropped by 37% and non-violent felony referrals declined by more than 61%. Since 2009, overall referrals have been declining nationwide, which is the case in Maryland as well. Careful study of the juvenile referral rates, and related measures, over the next few years, will indicate if the recent decade s downward trend will continue, and is the beginning of a trend which would warrant further analysis of data and services. 50
57 03 COMMUNITY SAFETY Recidivism: Juvenile and Adult Re-Adjudicated/Convicted Recidivism rates for youth released from the Department of Juvenile Services (DJS) Committed Programs after 12, 24, and 36 months. Re-adjudication/Conviction Recidivism Rates for Committed Program Releases 12, 24, and 36-Month Juvenile and/or Criminal Justice Recidivism Rates Follow-up Period FY 2009 FY 2010 FY 2011 FY Months 19.2% 19.2% 20.6% 19.3% 24 Months 34.8% 35.3% 36.4% N/A 36 Months 45.5% 45.5% N/A N/A Data Source: MD DJS, Data Resource Guide: Fiscal Year 2012 Story Behind the Data: The juvenile justice community has not reached a consensus on how best to define recidivism with one measure. Therefore, consistent with other studies, DJS focuses on several measures, including subsequent juvenile and/or criminal involvement of youth. Many youth released from committed residential programs are 17 years old, and it is therefore important to include information from the adult criminal justice system and report both juvenile and adult recidivism rates. For purposes of recidivism studies, all new offenses are included, which encompasses new delinquent offenses, new criminal offenses, status and traffic offenses, and technical violations of probation not resulting from a new offense. It is important to note that only those new adjudications, convictions, commitments, and incarcerations that stem from a new offense are included. All recidivism rates are youth counts, taking into consideration the juvenile entry first and then the adult entry. If a youth is found to have recidivated in both the juvenile and adult systems, the recidivism event is counted once. DJS studies have been refined and expanded over the years to encompass all out-of-home committed programs (from foster placements to secure confinement), to include information on both juvenile and adult reoffending, and to show three levels of recidivating: a new alleged offense, whether that new offense resulted in conviction, and whether a new out-of-home placement resulted. Youth are followed for three years from release, and results are shown by year, level of recidivism, demographics, county, program type, and by individual program. In the chart above, the re-adjudication/conviction recidivism rates within 36 months are for FY2010 cohort releases, 24 months are for FY2011 cohort releases, and 12 months are for FY2012 cohort releases. When comparing FY2010 and 2011 at 12-months, the re-adjudication and conviction rates increased slightly by 1.4 percentage points between 2010 and 2011 and then returned to roughly FY2010 levels in FY2012. Similarly, the comparison of FY2009 and 2010 at 36 months revealed very little change. It is important to note that although rates are presented by committed program, recidivism is affected by more than just the quality of the program. The quality of aftercare supervision after a youth is released, the community and/or family to which youth return, local economic opportunities, and other factors beyond the Department s control can all affect outcomes. 51

58 03 COMMUNITY SAFETY Child Maltreatment: Child Protective Service (CPS) investigations are ruled indicated where credible evidence is not satisfactorily refuted, or unsubstantiated where insufficient evidence is found to support a finding as either indicated or ruled out. 3 Rate of Indicated and Unsubstantiated Findings, per 1,000 children, by State Fiscal Year Indicated Unsubstantiated FY2010* FY2011* FY2012 FY2010* FY2011* FY2012 Physical abuse Sexual abuse Neglect Total rate Story Behind the Data: This indicator measures the extent to which children experience abuse or neglect. Child abuse and neglect can result in mild to severe physical injuries, as well as death. Additional consequences to the child include possible attachment disorders, failure to thrive, mental health issues, developmental delays, educational challenges, and behavioral problems. Identifying families and children at risk for abuse or neglect, addressing these risk areas, and ensuring safety for children are essential in protecting children from harm. Rates of indicated physical and sexual abuse have both increased slightly in the past three fiscal years. Indicated neglect, however, increased substantially between FY2010 and FY2011, but then decreased in FY2012. The overall rate of indicated abuse and neglect increased from FY2010 to FY2011, and then remained constant in FY2012 at 6.9 per 1,000 children in Maryland. Child abuse and neglect is affected by many family factors, the most common being substance abuse, mental health issues, and poverty. In 2008, Maryland s monthly unemployment rates ranged between 3.3 and 5.6. In 2009 and 2010, however, those rates ranged between 6.8 and These significant increases in unemployment may be a factor in the increases seen, particularly for neglect. Poverty and unemployment can add significant stress on families, weakening parents abilities to cope with other stressors, and thereby lead to abuse or neglect. 52
59 03 COMMUNITY SAFETY In July 2007, the Department of Human Resources (DHR) implemented Place Matters, Maryland s child welfare initiative, focusing on reducing the number of children in out-of-home care while strengthening families. Maryland s Family-Centered Practice model is a central component of Place Matters and of the local Departments of Social Services (DSS) work with families. Workers develop individualized service plans based on comprehensive assessments of the families strengths and needs, with goals of increasing families capacities to protect their children. Family Involvement Meetings (FIMs) are also used to engage families in service plan development, especially when safety/risk issues are severe enough that a child may be removed from the home. These meetings, and other Family-Centered Practice approaches, strengthen families by bringing additional resources and helping children stay with their families of origin or relatives. These efforts are designed to reduce risk factors which lead to abuse and neglect, and increase safety for children.. 53
60 03 COMMUNITY STABILITY Indicators: Five Year Trend Average Yearly Percent Change* Recent Year Percent Change Recent Year Measurement Hunger Out-of-Home Placement Homelessness The percentage of families who are food-insecure because of the lack of access, at times, to enough food for an active, healthy life for all household members; limited or uncertain availability of nutritionally adequate foods. 8.1% 4.0% 13.0% The number of out-of-home placements that occur per 1,000 children in the population. 2.8% 11.8% 12.3 per 1,000 The percentage of children enrolled in the public school system that lack a fixed, regular, and adequate nighttime residence or who are awaiting foster-care placement. 13.3% 3.7% 1.7% Indicates an area of positive growth. Indicates an area of negative growth. *Indicates average yearly percent change over five year period unless otherwise noted. 54
61 03 COMMUNITY STABILITY Hunger: The percentage of families who are food insecure. The US Department of Agriculture (USDA) defines food insecurity as a measure of the lack of access, at times, to enough food for an active, healthy life for all household members; limited or uncertain availability of nutritionally adequate foods. 5 Prevalence of Household-level Food Insecurity (3-year Average) MD 9.4% 9.5% 8.6% 9.6% 11.1% 12.5% 12.5% 13.0% US 11.4% 11.3% 11.0% 12.2% 13.5% 14.6% 14.7% 14.7% Story Behind the Data: While hunger among children raises obvious physical and developmental health concerns, it also has ripple effects that appear in other areas of a child s life. In Maryland, the face of hunger is not starvation, but the lack of access to adequate nutrition. According to the United States Census Bureau s 2011 Small-Area Income and Poverty Estimate (SAIPE), six Maryland counties (Howard, Montgomery, Charles, Calvert, Anne Arundel, and Carroll Counties) are within the top twenty-five median incomes in the United States, making Maryland one of the wealthiest states in the country. There is no Maryland community, however, that is free from the effects of hunger; 13.0% of Maryland households, or more than one in eight, lack consistent access to the food and nutrition necessary to lead healthy, active lives. For some, the high costs of housing, transportation, health care, and other necessities combined with low incomes, limit the resources available to keep food on the table. In other cases, even when families have the resources, they are often unable to provide nutritious food for their children, due to a lack of access to fresh produce in many of the poorest neighborhoods. Additionally, while programs exist to offer help to families, many families are unaware of the programs or their eligibility. To address these concerns, in 2008, Governor O Malley convened the Partnership to End Childhood Hunger in Maryland. In collaboration with Share Our Strength, and with the support of Maryland Hunger Solutions, the Partnership has led Maryland s initiative to end childhood hunger. This public-private partnership includes nonprofit organizations, businesses and foundations, State and federal agencies, advocates, local leaders, and representatives from the faith community. The Partnership emphasizes the need to provide access to nutritious food where children and their families live, learn, and play. 55
62 03 COMMUNITY STABILITY The most effective way to reduce childhood hunger in Maryland is to connect eligible families to existing nutrition programs. These programs include: the School Breakfast Program, the National School Lunch Program, the At- Risk Afterschool Meals Program, the Summer Food Service Program, the Food Supplement Program (FSP, formerly Food Stamps), and the Special Supplemental Nutrition Program for Women, Infants and Children (WIC). Together, these programs form a safety net that helps to prevent children and families from falling into food insecurity. In 2012, significant gains were made in the School Breakfast Program and the At-Risk Afterschool Meals Program. School Breakfast Program From the to the school year, Maryland had the fourth largest increase in participation in the School Breakfast Program in the country. 6 This represented a 17.5% increase in participation, supporting academic achievement by connecting more than 22,000 additional low-income children to breakfast each day. The increased participation is a result of schools implementing alternative delivery models, such as breakfast in the classroom, Grab and Go breakfast, and Second Chance breakfast. These alternative models are addressing the many barriers preventing students from eating breakfast in school, including inconvenience, stigma, bell schedules, and transportation issues. Another promising program that will likely lead to continued growth in school breakfast participation is Maryland Meals for Achievement (MMFA), a State-funded in-classroom breakfast program that provides breakfast to every student at no cost at select low-income schools. 56

63 03 COMMUNITY STABILITY At-Risk Afterschool Meals Program In June 2009, Maryland, along with 13 states and the District of Columbia, piloted the At-Risk Afterschool Meals Program, which became available to all states in This program allows afterschool programs in low-income areas to offer reimbursable meals to participants. For out-of-school time programs, the addition of a meal increases the enrollment and attendance of students while easing the programs budgetary burden through the federal reimbursement. From the to the school year, participation in the At-Risk Afterschool Meals Program increased 28%, representing an additional 2,512 children receiving an afterschool meal. The Partnership continues to experience progress in all nutrition programs through collaboration, targeted outreach, and piloting innovative practices. Through these efforts, and the successes of the School Breakfast and At-Risk Afterschool Meals Programs, Maryland is one step closer to eradicating childhood hunger. 57
Healthy People in Healthy Communities
 Healthy People 2020 Alaska Hawaii American Samoa U.S. Virgin Islands Federated States of Micronesia Republic of Marshall Islands Commonwealth of Northern Mariana Islands Puerto Rico Palau Guam www.healthypeople.gov
Healthy People in Healthy Communities
 Healthy People 2020 Alaska Hawaii American Samoa U.S. Virgin Islands Federated States of Micronesia Republic of Marshall Islands Commonwealth of Northern Mariana Islands Puerto Rico Palau Guam www.healthypeople.gov
On behalf of the Association of Maternal and Child Health Programs (AMCHP), I am
, I am") Christopher Kus, M.D., M.P.H. Association of Maternal and Child Health Programs, Public Witness Testimony House Labor, Health and Human Services and Education Appropriations Subcommittee March 13, 2013
Christopher Kus, M.D., M.P.H. Association of Maternal and Child Health Programs, Public Witness Testimony House Labor, Health and Human Services and Education Appropriations Subcommittee March 13, 2013
Successful Children and Youth
 Successful Children and Youth are cared for by nurturing adults who support their healthy growth and development; live in safe environments free from abuse, neglect, and trauma; have basic necessities;
Iowa s Maternal Health, Child Health and Family Planning Business Plan
 Iowa s Maternal Health, Child Health and Family Planning Business Plan CHILD HEALTH Who we are... A public-private partnership that... Promotes access to regular preventive health care services for children
Early Childhood Indicators Report
 2015 Early Childhood Indicators Report Carol Prentice, Prentice Consulting, 2012 Updated by Alaska Department of Health & Social Services, September 2013 Updated by Prentice Consulting, July 2015 Early
University Hospital Community Health Needs Assessment FY 2014
 FY 2014 Prepared by Kathy Opromollo Executive Director of Ambulatory Care Services Newark New Jersey is the State s largest city. In striving to identify and address Newark s most pressing health care
Selected Health Status Indicators DALLAS COUNTY. Jointly produced to assist those seeking to improve health care in rural Alabama
 Selected Health Status Indicators DALLAS COUNTY Jointly produced to assist those seeking to improve health care in rural Alabama By The Office of Primary Care and Rural Health, Alabama Department of Public
State Health Assessment Health Priority Status Report Update. June 29, 2015 Presented by UIC SPH and IDPH
 State Health Assessment Health Priority Status Report Update June 29, 2015 Presented by UIC SPH and IDPH 1 Health Priority Presentation Objectives 1. Explain context of how this discussion fits into our
Durham County Community Health. Assessment? What Is a Community Health
 Durham County Community Health Assessment This document presents key findings from the 2011 Durham County Community Health Assessment. The goal of the assessment was to provide a compilation of valid and
Adolescent Mortality. Alaska s adolescent mortality rate is 29% higher than the national rate and almost 1.6 times the Healthy People 2010 target.
 Alaska Maternal and Child Health Data Book 23 15 Adolescent Mortality Nationally, unintentional injury, assault and suicide account for 51% of deaths among adolescents ages 1-14 years in 2. Over the last
Community Health Needs Assessment Implementation Strategy Summary
 Community Health Needs Assessment Implementation Strategy Summary 160 (This page intentionally left blank) Community Health Needs Assessment (CHNA) Implementation Strategy Written Plan Template Westfield
Alabama s Rural and Urban Counties
 Selected Indicators of Health Status in Alabama Alabama s Rural and Urban Counties Jointly produced to assist those seeking to improve health care in rural Alabama by The Office of Primary Care and Rural
Take Care New York 2016: An Agenda for Healthier New York City
 Take Care New York 2016: An Agenda for Healthier New York City Presentation to the Health Committee of Community Board 6 Camellia Mortezazadeh, MPH, Executive Director, Take Care New York and Ewel Napier,
UF Health Jacksonville CHNA Implementation Strategy
 UF Health Jacksonville CHA Implementation Strategy Adopted by the UF Health Jacksonville Governing Board on: December 7, 2015 This document describes how UF Health Jacksonville (the hospital) plans to
9. Substance Abuse. pg 166-169: Self-reported alcohol consumption. pg 170-171: Childhood experience of living with someone who used drugs
 9. pg 166-169: Self-reported alcohol consumption pg 170-171: Childhood experience of living with someone who used drugs pg 172-173: Hospitalizations related to alcohol and substance abuse pg 174-179: Accidental
Logic Model for SECCS Grant Program: Florida Early Childhood Comprehensive Systems (ECCS) Statewide Plan INTERVENTION
 Statewide Plan INTERVENTION") TOTAL FUNDS REQUESTED (for GRANTEE/ PROJECT CHARACTERISTICS (i.e., the first year of the project): goals and description of the project, $155,496 Infant Mental Health Association Updated Florida's statewide
TOTAL FUNDS REQUESTED (for GRANTEE/ PROJECT CHARACTERISTICS (i.e., the first year of the project): goals and description of the project, $155,496 Infant Mental Health Association Updated Florida's statewide
The Health and Well-being of the Aboriginal Population in British Columbia
 The Health and Well-being of the Aboriginal Population in British Columbia Interim Update February 27 Table of Contents Terminology...1 Health Status of Aboriginal People in BC... 2 Challenges in Vital
The Status of Maryland s Children
 The Status of Maryland s Children Maryland has the highest median family income ($82,404) in the U.S. Families with children in Maryland have a median family income of $80,265. Yet, in 2007, over 10% of
NEBRASKA 2010 HEALTH GOALS AND OBJECTIVES. A MidCourse Review
 NEBRASKA 21 HEALTH GOALS AND OBJECTIVES A MidCourse Review NEBRASKA 21 HEALTH GOALS AND OBJECTIVES: A MidCourse Review Nebraska Department of Health and Human Services Division of Public Health Joann
Health Profile for St. Louis City
 Health Profile for St. Louis City The health indicators of St. Louis City show that the city has many health problems. To highlight a few, the city s rates of sexually transmitted diseases (i.e., HIV/AIDS,
The National Survey of Children s Health 2011-2012 The Child
 The National Survey of Children s 11-12 The Child The National Survey of Children s measures children s health status, their health care, and their activities in and outside of school. Taken together,
LOUISIANA DEPARTMENT OF HEALTH AND HOSPITALS MATERNAL AND CHILD HEALTH (MCH) BLOCK GRANT*
 BLOCK GRANT*") LOUISIANA DEPARTMENT OF HEALTH AND HOSPITALS MATERNAL AND CHILD HEALTH (MCH) BLOCK GRANT* What is the MCH Block Grant? It is a grant from the U.S. government to State governments. The state must supply
LOUISIANA DEPARTMENT OF HEALTH AND HOSPITALS MATERNAL AND CHILD HEALTH (MCH) BLOCK GRANT* What is the MCH Block Grant? It is a grant from the U.S. government to State governments. The state must supply
King County City Health Profile Vashon Island
 King County City Health Profile Vashon Island West Seattle North Highline Burien SeaTac/Tukwila Vashon Island Des Moines/Normandy Park Kent-West East Federal Way Fed Way-Dash Point/Woodmont December, 212
Archival Data Analysis for the Page County Public Schools Needs Assessment
 BARNES TECHNOLOGIES INTERNATIONAL, LLC Archival Data Analysis for the Page County Public Schools Needs Assessment 2008 Barnes Technologies International, LLC Contents 1 1991 B U T T O N W O O D C O U R
Meena Abraham, DrPH, MPH Director of Epidemiology Services Baltimore City Health Department
 Meena Abraham, DrPH, MPH Director of Epidemiology Services Baltimore City Health Department 271 Neighborhood Statistical Areas 55 Community Statistical Areas 26 Zip Codes Characteristic Baltimore City
Flagship Priority: Mental Health and Substance Abuse
 10 Colorado s winnable battles Flagship Priority: Mental Health and Substance Abuse ELEVATING HEALTH AND ENVIRONMENT Mental and emotional well-being is essential to shaping a state of health for Coloradans.
4.2 Low Birth Weight
 4.1 Births to Teenagers 4.1.1 Percentage of babies born to teenage mothers Measurement: The percentage of babies born to teenage mothers is (1) the number of births to teenagers ages 15-19, divided by
United Way of the Dutchess-Orange Region Health Strategy FY2015-2016 Request for Proposal
 United Way of the Dutchess-Orange Region Health Strategy FY2015-2016 Request for Proposal Through the enclosed Request for Proposal (RFP), United Way of the Dutchess-Orange Region (UWDOR) will provide
Maternal and Child Health Issue Brief
 Maternal and Child Health Issue Brief Substance Abuse among Women of Reproductive Age in Colorado September 14 9 Why is substance abuse an issue among women of reproductive age? Substance abuse poses significant
Maternal and Child Health Issue Brief
 Maternal and Child Health Issue Brief Why is substance abuse an issue among youth? December 14 8 Substance Abuse among Youth in Colorado Substance abuse among youth is defined as using alcohol, tobacco,
Testimony of. Daliah Heller, PhD, MPH Assistant Commissioner Bureau of Alcohol and Drug Use Prevention, Care and Treatment
 Testimony of Daliah Heller, PhD, MPH Assistant Commissioner Bureau of Alcohol and Drug Use Prevention, Care and Treatment New York City Department of Health and Mental Hygiene before the New York City
Health Disparities in H.R. 3590 (Merged Senate Bill)
") Health Disparities in H.R. 3590 (Merged Senate Bill) Definitions: Health disparity population is defined in the bill as defined in Section 485E (Sec. 931) Current Law: a population is a health disparity
Health Disparities in H.R. 3590 (Merged Senate Bill) Definitions: Health disparity population is defined in the bill as defined in Section 485E (Sec. 931) Current Law: a population is a health disparity
A Strategic Plan for Improving Preconception Health and Health Care: Recommendations from the CDC Select Panel on Preconception Care
 1 A Strategic Plan for Improving Preconception Health and Health Care: Recommendations from the CDC Select Panel on Preconception Care Presentation by Kay A. Johnson, MPH, EdM Research Assistant Professor,
Huron County Community Health Profile
 2014 Huron County Community Health Profile ` Prepared by: Eileen Unruh RN, MSN Samantha Fackler RN, MSN 11/1/2014 1 HURON COUNTY COMMUNITY HEALTH PROFILE TABLE OF CONTENTS INTRODUCTION.... 4 DEMOGRAPHICS...
Schools Uniting Neighborhoods: Community Schools Anchoring Local Change
 Schools Uniting Neighborhoods: Community Schools Anchoring Local Change By Diana Hall, Multnomah County Across the United States, communities are thinking differently about the challenges they face to
activity guidelines (59.3 versus 25.9 percent, respectively) and four times as likely to meet muscle-strengthening
 and four times as likely to meet muscle-strengthening") 18 HEALTH STATUS HEALTH BEHAVIORS WOMEN S HEALTH USA 13 Adequate Physical Activity* Among Women Aged 18 and Older, by Educational Attainment and Activity Type, 09 11 Source II.1: Centers for Disease Control
18 HEALTH STATUS HEALTH BEHAVIORS WOMEN S HEALTH USA 13 Adequate Physical Activity* Among Women Aged 18 and Older, by Educational Attainment and Activity Type, 09 11 Source II.1: Centers for Disease Control
SMOKING TOBACCO: SMOKING
 TOBACCO: SMOKING One in 4 adults in Guam is a smoker. Among youth, 1 in 5 smokes. Guam s smoking rate is higher than most US States and Territories; this has remained unchanged since 2001. T O B A C C
Georgia Quality Core Curriculum for Health Scope and Sequence for Grades K-5 DISEASE PREVENTION
 Scope and Sequence for Grades K-5 Page 1 of 6 ALCOHOL, TOBACCO AND OTHER DRUGS DISEASE PREVENTION FAMILY LIVING GROWTH AND DEVELOPMENT K 1. Medicine 2. Poison and unknown substances 3. Hand washing 4.
Last year, The Center for Health Affairs (CHA) asked
 asked") Planning & Action February 2008 9 By Mark Salling, Ph.D., and Michele Egan Health Needs Analysis, Assessment Looks at the Region Last year, The Center for Health Affairs (CHA) asked Community Solutions
Planning & Action February 2008 9 By Mark Salling, Ph.D., and Michele Egan Health Needs Analysis, Assessment Looks at the Region Last year, The Center for Health Affairs (CHA) asked Community Solutions
Public Health Services
 Public Health Services FUNCTION The functions of the Public Health Services programs are to protect and promote the health and safety of County residents. This is accomplished by monitoring health status
Report of Results and Analysis of Parent Survey Data Collected in Southern West Virginia
 Partners in Community Outreach Education Begins at Home Partners in Community Outreach In-Home Family Education Programs Report of Results and Analysis of Parent Survey Data Collected in Southern West
Definition of Foundational Public Health Services
 Definition of Foundational Public Health Services FOUNDATIONAL CAPABILITIES A. Assessment (Surveillance and Epidemiology). The foundational definition of this capability includes: 1. Ability to collect
OHIO COUNTY. Demographic Data. Adult Behavioral Health Risk Factors: 2007-2011
 Prepared by the Department of Health and Human Resources Bureau for Behavioral Health and Health Facilities OHIO COUNTY February 14 Behavioral Health Epidemiological County Profile Demographic Data Ohio
2013/2014 Implementation Strategy Progress Report: Response to Schedule H, Form 990. Medical Center of the Rockies Poudre Valley Hospital
 Implementation Strategy Progress Report: Response to Schedule H, Form 990 Medical Center of the Rockies Poudre Valley Hospital Executive Summary Community Health Needs Assessment/Development of Implementation
Evidence-Based Practice for Public Health Identified Knowledge Domains of Public Health
 1 Biostatistics Statistical Methods & Theory Evidence-Based Practice for Public Health Identified Knowledge Domains of Public Health General Public Health Epidemiology Risk Assessment Population-Based
POLICY ON COMPREHENSIVE SCHOOL HEALTH EDUCATION
 MICHIGAN STATE BOARD OF EDUCATION POLICY ON COMPREHENSIVE SCHOOL HEALTH EDUCATION The Michigan State Board of Education promotes school success through coordinated school health programs. 1 Schools cannot
Maryland Department of Health and Mental Hygiene 201 W. Preston Street Baltimore, Maryland 21201
 STATE OF MARYLAND DHMH Maryland Department of Health and Mental Hygiene 201 W. Preston Street Baltimore, Maryland 21201 Martin O Malley, Governor Anthony G. Brown, Lt. Governor Laura Herrera Scott, MD,
Morbidity and Mortality among Adolescents and Young Adults in the United States
 Morbidity and Mortality among Adolescents and Young Adults in the United States AstraZeneca Fact Sheet 2011 Authors Robert Wm. Blum MD, MPH, PhD William H. Gates, Sr. Professor and Chair Farah Qureshi,
INSTITUTE of PUBLIC POLICY. Harry S Truman School of Public Affairs
 Harry S Truman School of Public Affairs TABLE OF CONTENTS Table of Contents... 1 Executive Summary... 2 Regional Overview of Service Needs... 5 Scope of At-Risk Population... 6 Temporary Shelter, Transitional
Public Health - Seattle & King County
 - Seattle & King County Mission Statement Alonzo Plough, Director The mission of Public Health - Seattle & King County is to provide public health services that promote health and prevent disease among
New Jersey Kids Count 2014 The State of Our Children
 New Jersey Kids Count 2014 The State of Our Children April 24, 2014 Advocates for Children of New Jersey 35 Halsey Street Newark, NJ 07102 973.643.3876 Advocates for Children of New Jersey 2014 What is
Public Health Nurse Home Visiting Frequently Asked Questions When did nurse home visiting begin?
 Public Health Nurse Home Visiting Frequently Asked Questions When did nurse home visiting begin? Home visiting became a national public health strategy to improve the health status of women and children
Overview of Vital Records and Public Health Informatics in CDPH
 Overview of Vital Records and Public Health Informatics in CDPH Este Geraghty, MD, MS, MPH/CPH, FACP, GISP Deputy Director, Center for Health Statistics and Informatics California Department of Public
Logic Model for ECCS Program: The Oklahoma Early Childhood Comprehensive Systems (ECCS) Statewide Plan/Smart Start Oklahoma INTERVENTION
 Statewide Plan/Smart Start Oklahoma INTERVENTION") GRANTEE/ PROJECT CHARACTERISTICS (i.e., goals and description of the project, environment, description of population/case load and partner organizations): TOTAL FUNDS REQUESTED: (for the first year of
GRANTEE/ PROJECT CHARACTERISTICS (i.e., goals and description of the project, environment, description of population/case load and partner organizations): TOTAL FUNDS REQUESTED: (for the first year of
http://www.cdc.gov/nchs.
 As the Nation s principal health statistics agency, the National Center for Health Statistics (NCHS) compiles statistical information to guide actions and policies to improve the health of the population.
Injuries and Violence
 Injuries and Violence Introduction Injuries, both intentional and unintentional, are a significant health problem in children. Intentional or violent injuries refer to injuries that are self-inflicted,
Friends of School Health
 Friends of School Health Testimony Expanding Funding for CDC School Health Programs Statement of Sharon Murray, MHSE, CHES Executive Director, Society of State Directors of Health, Physical Education and
Maternal and Child Health
 Chapter 3: Maternal and Child Health Children are natural mimics who act like their parents despite every effort to teach them good manners. Anonymous Familiarity breeds contempt--and children. Mark Twain
Behavioral Health Barometer. United States, 2014
 Behavioral Health Barometer United States, 2014 Acknowledgments This report was prepared for the Substance Abuse and Mental Health Services Administration (SAMHSA) by RTI International under contract No.
HEALTHY CPS. Rahm Emanuel Mayor. Bechara Choucair, M.D. Commissioner. Barbara Byrd-Bennett Chief Executive Officer
 HEALTHY CPS An Agenda for student Wellness Rahm Emanuel Mayor Barbara Byrd-Bennett Chief Executive Officer Bechara Choucair, M.D. Commissioner A Message from the CEO of Chicago Public Schools and the Commissioner
Dismantle the Cradle to Prison Pipeline
 A Message to the 81 st Texas Legislature Dismantle the Cradle to Prison Pipeline There is a growing epidemic that threatens the health and prosperity of all Texans. Because of the Cradle to Prison Pipeline
ARE FLORIDA'S CHILDREN BORN HEALTHY AND DO THEY HAVE HEALTH INSURANCE?
 infant mortality rate per 1,000 live births ARE FLORIDA'S CHILDREN BORN HEALTHY AND DO THEY HAVE HEALTH INSURANCE? Too Many of Florida's Babies Die at Birth, Particularly African American Infants In the
BIRTH THROUGH AGE EIGHT STATE POLICY FRAMEWORK
 BIRTH THROUGH AGE EIGHT STATE POLICY FRAMEWORK The Birth Through Eight State Policy Framework is a tool, or roadmap, that anyone can use to guide policy in ways that will improve the health, learning,
REVISED SUBSTANCE ABUSE GRANTMAKING STRATEGY. The New York Community Trust April 2003
 REVISED SUBSTANCE ABUSE GRANTMAKING STRATEGY The New York Community Trust April 2003 1 I. INTRODUCTION Substance Abuse is defined as the excessive use of addictive substances, especially narcotic drugs,
Alcoholism and Substance Abuse
 State of Illinois Department of Human Services Division of Alcoholism and Substance Abuse OVERVIEW The Illinois Department of Human Services, Division of Alcoholism and Substance Abuse (IDHS/DASA) is the
The Friends of HRSA is a non-partisan coalition of more than 170 national organizations
 Friends of the Health Resources and Services Administration c/o American Public Health Association 800 I Street NW Washington DC, 20001 202-777-2513 Nicole Burda, Government Relations Deputy Director Testimony
New Jersey Kids Count 2015 Bergen County Profile
 New Jersey Kids Count 2015 Bergen County Profile The county profiles present the most recent data for each indicator. For historical data, please see the New Jersey Kids Count County Pocket Guides, which
Colorado Substance Use and Recommendations Regarding Marijuana Tax Revenue
 Colorado Substance Use and Recommendations Regarding Marijuana Tax Revenue Substance addiction and abuse is Colorado s most prevalent, complex, costly and untreated public health challenge. It is an issue
Principles on Health Care Reform
 American Heart Association Principles on Health Care Reform The American Heart Association has a longstanding commitment to approaching health care reform from the patient s perspective. This focus including
Children s Health and Nursing:
 Children s Health and Nursing: A Summary of the Issues What s the issue? The foundation for healthy growth and development in later years is established to a large degree in the first six years of life.
Southern Grampians & Glenelg Shires COMMUNITY PROFILE
 Southern Grampians & Glenelg Shires COMMUNITY PROFILE Contents: 1. Health Status 2. Health Behaviours 3. Public Health Issues 4. References This information was last updated on 14 February 2007 1. Health
2015 HonorHealth Rehabilitation Hospital Community Health Needs Assessment. Approved by the Board Strategic Planning Committee October 2015
 2015 Community Health Needs Assessment Approved by the Board Strategic Planning Committee October 2015 Table of Contents Table of Contents... i Table of Figures... iv Table of Tables... v I. Executive
Income is the most common measure
 Income Goal A healthy standard of living for all Income is the most common measure of socioeconomic status, and a strong predictor of the health of an individual or community. When assessing the health
Ladies by Design Junior Debutante Course COORDINATOR CERTIFICATION Touching Tomorrow s Women Today
 Ladies by Design Junior Debutante Course COORDINATOR CERTIFICATION Touching Tomorrow s Women Today Module 2: All About Girls: Statistics and Facts African American girls and teens statistics National Girls
Colorado s 10 Winnable Battles
 Colorado s 10 Winnable Battles Christopher E. Urbina, MD, MPH, Executive Director and Chief Medical Officer Colorado Department of Public Health and Environment June 7, 2012 Comparing CDC and Colorado
Seattle. Health Services
 Health Services Has a district health services (HSV) coordinator Requires each school to have an HSV coordinator Requires schools to provide the following health services when needed: Administration of
Public Health - Seattle & King County
 - Seattle & King County Mission Statement Alonzo Plough, Director The mission of Public Health - Seattle & King County (Public Health) is to provide public health services that promote health and prevent
Community Health Needs Assessment
 Community Health Needs Assessment CHNA IMPLEMENTATION STRATEGY COMMUNITY HEALTH NEEDS ASSESSMENT OVERVIEW Hospital Overview Greater Baltimore Medical Center (GBMC) is a not-for-profit health care facility
Prevention Agenda 2013 2017 is the state health improvement plan for the next five years.
 Prevention Agenda 2013 2017 is the state health improvement plan for the next five years. It builds on the current plan, the Prevention Agenda toward the Healthiest State. The Prevention Agenda (launched
Measuring Childhood Obesity: Public Health Surveillance OR School-based Screening and Parent Notification?
 Measuring Childhood Obesity: Public Health Surveillance OR School-based Screening and Parent Notification? Minnesota Department of Health Martha Roberts, MPH March 24, 2008, 10:00-11:30 AM University of
Pregnant and Parenting Youth in Foster Care in Washington State: Comparison to Other Teens and Young Women who Gave Birth
 January 2014 RDA Report 11.202 Olympia, Washington Pregnant and Parenting in Care in Washington State: Comparison to Other and Women who Gave Birth Laurie Cawthon, MD, MPH Barbara Lucenko, PhD Peter Woodcox,
Five-Year Prevention Statewide Strategic Plan
 Five-Year Prevention Statewide Strategic Plan State of Nebraska Department of Health and Human Services Division of Behavioral Health FY13-FY17 Five-Year Substance Abuse Prevention Statewide Strategic
Health Care Access to Vulnerable Populations
 Health Care Access to Vulnerable Populations Closing the Gap: Reducing Racial and Ethnic Disparities in Florida Rosebud L. Foster, ED.D. Access to Health Care The timely use of personal health services
Assessing NE Ohio Community Health Needs Assessments: Standards, Best Practice, and Limitations
 Assessing NE Ohio Community Health Needs Assessments: Standards, Best Practice, and Limitations Tegan Beechey, MPA, Doctoral Candidate, Kent State University College of Public Health John Corlett, President
FAMILY HEALTH SERVICES DIVISION Profiles 2014 OVERVIEW
 FAMILY HEALTH SERVICES DIVISION Profiles 2014 OVERVIEW Family Health Services Division Overview Data Sources Life Course Perspective and Title V Priorities Population Overview Births Infant Mortality Chapter
1. Youth Drug Use More than 40% of Maryland high school seniors used an illicit drug in the past year.
 1. Youth Drug Use More than 4% of Maryland high school seniors used an illicit drug in the past year. Any Illicit Drug Alcohol Marijuana Ecstasy Cocaine Percentage of Maryland and U.S. high school seniors
Focus Area 6: Mental Health, Alcohol, and Substance Abuse
 Focus Area : Mental Health and Mental Disorders Alcohol Abuse Substance Abuse Autism Spectrum Disorders Exposure to Trauma 119 WORK GROUP ON MENTAL HEALTH, ALCOHOL, AND SUBSTANCE ABUSE Co-Chairs Barbara
PROGRAM FOR LICENSING ASSESSMENTS FOR COLORADO EDUCATORS (PLACE ) OBJECTIVES FIELD 031: HEALTH
 OBJECTIVES FIELD 031: HEALTH") PROGRAM FOR LICENSING ASSESSMENTS FOR COLORADO EDUCATORS (PLACE ) OBJECTIVES Subareas Physical Health Mental Health Social Health Community Health PHYSICAL HEALTH Understand the stages of physical growth
PROGRAM FOR LICENSING ASSESSMENTS FOR COLORADO EDUCATORS (PLACE ) OBJECTIVES Subareas Physical Health Mental Health Social Health Community Health PHYSICAL HEALTH Understand the stages of physical growth
Oklahoma county. Community Health Status Assessment
 Oklahoma county Wellness Score 2014 Community Health Status Assessment Mental and Social Health Overall Mental Health score The World Health Organization defines mental health as a state of well-being
September 17, 2010. Dear Secretary Sebelius:
 September 17, 2010 Secretary Kathleen Sebelius Department of Health and Human Services Hubert H. Humphrey Building 200 Independence Avenue, SW Washington, DC 20201 RE: Comments on OCIIO- 9992- IFC, Interim
The Top 10 Issues in Pediatrics. Janice Selekman DNSc, RN, NCSN Professor University of Delaware
 The Top 10 Issues in Pediatrics Janice Selekman DNSc, RN, NCSN Professor University of Delaware Selekman s top 10 health issues impacting today s children #10. Pediatric Nursing (the Specialty and the
R00A99. Early Childhood Development. Maryland State Department of Education. Response to the Analyst s Review and Recommendations
 R00A99 Early Childhood Development Maryland State Department of Education Response to the Analyst s Review and Recommendations House Education and Economic Development Subcommittee February 26, 2015 Senate
TOBACCO CESSATION PILOT PROGRAM. Report to the Texas Legislature
 TOBACCO CESSATION PILOT PROGRAM Report to the Texas Legislature As Required by S.B. 10, 80 th Legislature, Regular Session, 2007 Texas Health and Human Services Commission September 2010 Table of Contents
ALCOHOL, TOBACCO, & OTHER DRUGS. Standards & Benchmarks: 1:ALL; 2:1,2,3,4,6; 3:ALL; 6:1,3
 HEALTH MIDDLE SCHOOL ALCOHOL, TOBACCO, & OTHER DRUGS Standards & Benchmarks: 1:ALL; 2:1,2,3,4,6; 3:ALL; 6:1,3 Objective: = The students will explain the difference between responsible drug use and wrong
Underage Drinking. Underage Drinking Statistics
 Underage Drinking Underage drinking is a serious public health problem in the United States. Alcohol is the most widely used substance of abuse among America s youth, and drinking by young people poses
1. Your grade level Response Percent
 1. Your grade level 9 29% 74 10 23.9% 61 11 28.2% 72 12 18.8% 48 Respondents 255 (filtered out) 213 (skipped this question) 0 2. Your Gender Female 100% 255 Male 0% 0 Respondents 255 (filtered out) 213
Early Childhood Education Draft Board Resolution
 SAMPLE RESOLUTION Early Childhood Education Draft Board Resolution How To Use This Resolution California s new school funding law, (the Local Control Funding Formula or LCFF) provides an opportunity for
HowHow to Identify the Best Stock Broker For You
 Indicators of Alcohol and Other Drug Risk and Consequences for California Counties County 2010 Indicators of Alcohol and Other Drug Risk and Consequences for California Counties County 2010 TABLE OF CONTENTS
How Health Reform Will Help Children with Mental Health Needs
 How Health Reform Will Help Children with Mental Health Needs The new health care reform law, called the Affordable Care Act (or ACA), will give children who have mental health needs better access to the