ER DIAGRAM ER) diagram, a graphical representation of entities and their relationships to each other, typically used in computing in regard to the
|
|
|
- Nickolas Owen
- 7 years ago
- Views:
Transcription
1 ER DIAGRAM ER) diagram, a graphical representation of entities and their relationships to each other, typically used in computing in regard to the organization of data within databases or information systems. An Entity Relationship Diagram (ERD) is a visual representation of different data using conventions that describe how these data are related to each other
2 ER Diagram An entity is a piece of data-an object or concept about which data is stored. A relationship is how the data is shared between entities 1976 proposed by Peter Chen ER diagram is widely used in database design Represent conceptual level of a database system Describe things and their relationships in high level
3 ER diagram Symbols
4
5 What is An Entity(e.g. car, student) An entity can be a person, place, event, or object that is relevant to a given system. For example, a school system may include students, teachers, major courses, subjects, fees, and other items. Entities are represented in ER diagrams by a rectangle and named using singular nouns.
6 Types of Entity Strong entities exist independently from other entity types. They always possess one or more attributes that uniquely distinguish each occurrence of the entity. Weak entities depend on some other entity type. They don't possess unique attributes (also known as a primary key) and have no meaning in the diagram without depending on another entity.
7 Weak Entity The entity set which does not have sufficient attributes to form a primary key is called as Weak entity set.. Consider an entity set Payment which has three attributes: payment_number, payment_date and payment_amount. Although each payment entity is distinct but payment for different loans may share the same payment number. Thus, this entity set does not have a primary key.
8 Weak Entity A weak entity is an entity that depends on the existence of another entity. In more technical terms it can defined as an entity that cannot be identified by its own attributes. It uses a foreign key combined with its attributed to form the primary key. An entity like order item is a good example for this. The order item will be meaningless without an order so it depends on the existence of order.
9
10
11 Strong Entity An entity set that has a primary key is called as Strong entity set.
12 Difference between strong and weak entity
13 Attribute (Properties of entity) An attribute is a property, trait, or characteristic of an entity, relationship, or another attribute. For example, the attribute Inventory Item Name is an attribute of the entity Inventory Item.
14 Types of Attributes Multivalued attributes are those that are capable of taking on more than one value. Derived attributes are attributes whose value can be calculated from related attribute values.
15
16 Multivalued Attributes If an attribute can have more than one value it is called an multivalued attribute. It is important to note that this is different to an attribute having its own attributes. For example a teacher entity can have multiple subject values.
17
18 Derived Attribute An attribute based on another attribute. This is found rarely in ER diagrams. For example for a circle the area can be derived from the radius.
19 Derived attribute
20 Relationship A relationship describes how entities interact. For example, the entity carpenter may be related to the entity table by the relationship builds or makes. Relationships are represented by diamond shapes and are labeled using verbs.
21
22 Relationship The degree of a relationship = the number of entity sets that participate in the relationship Mostly binary relationships Sometimes more Mapping cardinality of a relationship many many 1 Many-many 5/11/ Yan Huang - ER

23 One-One and One-Many 5/11/ Yan Huang - ER

24 Many-one and many-many 5/11/ Yan Huang - ER
25
26 Cardinality In the relational model, tables can be related as any of "one-to-many" or "many-to-many." This is said to be the cardinality of a given table in relation to another. For example, consider a database designed to keep track of hospital records. Such a database could have many tables like: a doctor table with information about physicians; a patient table for medical subjects undergoing treatment; and a department table with an entry for each division of a hospital. In that model: There is a many-to-many relationship between the records in the doctor table and records in the patient table because doctors have many patients, and a patient could have several doctors; A one-to-many relation between the department table and the doctor table because each doctor may work for only one department, but one department could have many doctors.
27 Cardinality These two further defines relationships between entities by placing the relationship in the context of numbers. In an system, for example, one account can have multiple contacts. Cardinalities are used when you are creating an E/R diagram, and show the relationships between entities/ tables.
28
29 What is the use of ER Diagram ER diagrams are most often associated with complex databases that are used in software engineering and IT networks. In particular, ER diagrams are frequently used during the design stage of a development process in order to identify different system elements and their relationships with each other. For example, an inventory software used in a retail shop will have a database that monitors elements such as purchases, item, item type, item source and item price. Rendering this information through an ER diagram would be something like this:
30
31 Why ER diagram ER diagrams constitute a very useful framework for creating and manipulating databases. First, ER diagrams are easy to understand and do not require a person to undergo extensive training to be able to work with it efficiently and accurately. This means that designers can use ER diagrams to easily communicate with developers, customers, and end users, regardless of their IT proficiency. Second, ER diagrams are readily translatable into relational tables which can be used to quickly build databases. In addition, ER diagrams can directly be used by database developers as the blueprint for implementing data in specific software applications. Lastly, ER diagrams may be applied in other contexts such as describing the different relationships and operations within an organization.
32 Tips on How to Draw ER Diagrams Identify all the relevant entities in a given system and determine the relationships among these entities. An entity should appear only once in a particular diagram. Provide a precise and appropriate name for each entity, attribute, and relationship in the diagram. Terms that are simple and familiar always beats vague, technical-sounding words. In naming entities, remember to use singular nouns. However, adjectives may be used to distinguish entities belonging to the same class (part-time employee and full time employee, for example). Meanwhile attribute names must be meaningful, unique, system-independent, and easily understandable. Remove vague, redundant or unnecessary relationships between entities. Never connect a relationship to another relationship. Make effective use of colors. You can use colors to classify similar entities or to highlight key areas in your diagrams.
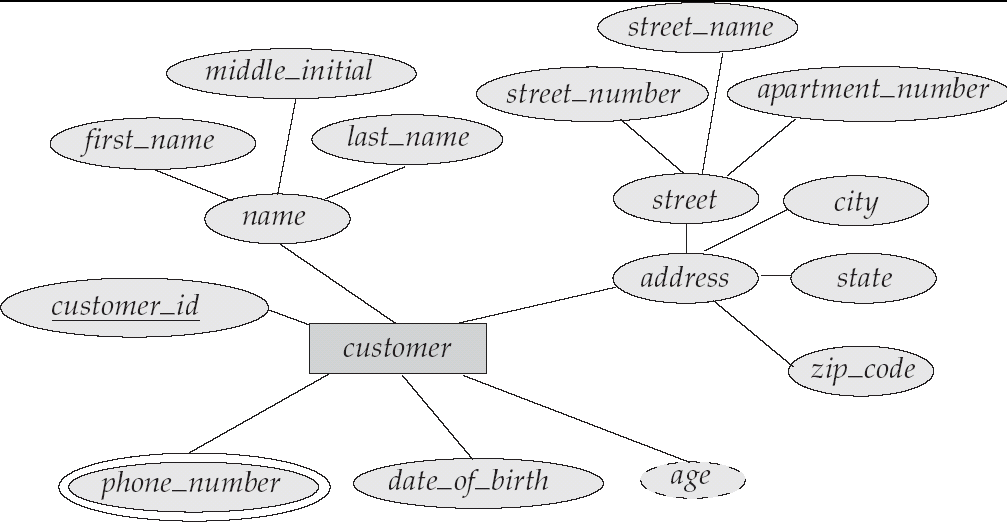
33 Example of Customer ER diagram with primary key
34 ER

35 Another Example with multivalued and Derived Attribute 5/11/ Yan Huang - ER
36 Simple ER diagram for student
37 Library Management System
38 Library management system
39 Railway reservation system

40 College Management System
41 Generalization Bottom up approach in which two low level entities are combined together to form high level entities
42
43 Specialization Opposite to specialization. It is a top down approach in which high level entities can be broken down into lower level entities.
44
Data Analysis 1. SET08104 Database Systems. Copyright @ Napier University
 Data Analysis 1 SET08104 Database Systems Copyright @ Napier University Entity Relationship Modelling Overview Database Analysis Life Cycle Components of an Entity Relationship Diagram What is a relationship?
Unit 2.1. Data Analysis 1 - V2.0 1. Data Analysis 1. Dr Gordon Russell, Copyright @ Napier University
 Data Analysis 1 Unit 2.1 Data Analysis 1 - V2.0 1 Entity Relationship Modelling Overview Database Analysis Life Cycle Components of an Entity Relationship Diagram What is a relationship? Entities, attributes,
Modern Systems Analysis and Design
 Modern Systems Analysis and Design Prof. David Gadish Structuring System Data Requirements Learning Objectives Concisely define each of the following key data modeling terms: entity type, attribute, multivalued
THE ENTITY- RELATIONSHIP (ER) MODEL CHAPTER 7 (6/E) CHAPTER 3 (5/E)
 MODEL CHAPTER 7 (6/E) CHAPTER 3 (5/E)") THE ENTITY- RELATIONSHIP (ER) MODEL CHAPTER 7 (6/E) CHAPTER 3 (5/E) 2 LECTURE OUTLINE Using High-Level, Conceptual Data Models for Database Design Entity-Relationship (ER) model Popular high-level conceptual
THE ENTITY- RELATIONSHIP (ER) MODEL CHAPTER 7 (6/E) CHAPTER 3 (5/E) 2 LECTURE OUTLINE Using High-Level, Conceptual Data Models for Database Design Entity-Relationship (ER) model Popular high-level conceptual
Lesson 8: Introduction to Databases E-R Data Modeling
 Lesson 8: Introduction to Databases E-R Data Modeling Contents Introduction to Databases Abstraction, Schemas, and Views Data Models Database Management System (DBMS) Components Entity Relationship Data
Foundations of Information Management
 Foundations of Information Management - WS 2012/13 - Juniorprofessor Alexander Markowetz Bonn Aachen International Center for Information Technology (B-IT) Data & Databases Data: Simple information Database:
Why & How: Business Data Modelling. It should be a requirement of the job that business analysts document process AND data requirements
 Introduction It should be a requirement of the job that business analysts document process AND data requirements Process create, read, update and delete data they manipulate data. Process that aren t manipulating
COMP 378 Database Systems Notes for Chapter 7 of Database System Concepts Database Design and the Entity-Relationship Model
 COMP 378 Database Systems Notes for Chapter 7 of Database System Concepts Database Design and the Entity-Relationship Model The entity-relationship (E-R) model is a a data model in which information stored
ER modelling, Weak Entities, Class Hierarchies, Aggregation
 CS344 Database Management Systems ER modelling, Weak Entities, Class Hierarchies, Aggregation Aug 2 nd - Lecture Notes (Summary) Submitted by - N. Vishnu Teja Saurabh Saxena 09010125 09010145 (Most the
Designing Databases. Introduction
 Designing Databases C Introduction Businesses rely on databases for accurate, up-to-date information. Without access to mission critical data, most businesses are unable to perform their normal daily functions,
Chapter 2: Entity-Relationship Model
 Chapter 2: Entity-Relationship Model Entity Sets Relationship Sets Design Issues Mapping Constraints Keys E R Diagram Extended E-R Features Design of an E-R Database Schema Reduction of an E-R Schema to
Entity-Relationship Model
 UNIT -2 Entity-Relationship Model Introduction to ER Model ER model is represents real world situations using concepts, which are commonly used by people. It allows defining a representation of the real
DATABASE DESIGN. - Developing database and information systems is performed using a development lifecycle, which consists of a series of steps.
 DATABASE DESIGN - The ability to design databases and associated applications is critical to the success of the modern enterprise. - Database design requires understanding both the operational and business
6-1. Process Modeling
 6-1 Process Modeling Key Definitions Process model A formal way of representing how a business system operates Illustrates the activities that are performed and how data moves among them Data flow diagramming
Database Design Process. Databases - Entity-Relationship Modelling. Requirements Analysis. Database Design
 Process Databases - Entity-Relationship Modelling Ramakrishnan & Gehrke identify six main steps in designing a database Requirements Analysis Conceptual Design Logical Design Schema Refinement Physical
Chapter 2: Entity-Relationship Model. Entity Sets. " Example: specific person, company, event, plant
 Chapter 2: Entity-Relationship Model! Entity Sets! Relationship Sets! Design Issues! Mapping Constraints! Keys! E-R Diagram! Extended E-R Features! Design of an E-R Database Schema! Reduction of an E-R
1 Class Diagrams and Entity Relationship Diagrams (ERD)
") 1 Class Diagrams and Entity Relationship Diagrams (ERD) Class diagrams and ERDs both model the structure of a system. Class diagrams represent the dynamic aspects of a system: both the structural and behavioural
1 Class Diagrams and Entity Relationship Diagrams (ERD) Class diagrams and ERDs both model the structure of a system. Class diagrams represent the dynamic aspects of a system: both the structural and behavioural
not necessarily strictly sequential feedback loops exist, i.e. may need to revisit earlier stages during a later stage
 Database Design Process there are six stages in the design of a database: 1. requirement analysis 2. conceptual database design 3. choice of the DBMS 4. data model mapping 5. physical design 6. implementation
Why Data Flow Diagrams?
 Flow Diagrams A structured analysis technique that employs a set of visual representations of the data that moves through the organization, the paths through which the data moves, and the processes that
LOGICAL DATABASE DESIGN
 MODULE 8 LOGICAL DATABASE DESIGN OBJECTIVE QUESTIONS There are 4 alternative answers to each question. One of them is correct. Pick the correct answer. Do not guess. A key is given at the end of the module
Lecture 12: Entity Relationship Modelling
 Lecture 12: Entity Relationship Modelling The Entity-Relationship Model Entities Relationships Attributes Constraining the instances Cardinalities Identifiers Generalization 2004-5 Steve Easterbrook. This
Problem of the Month: Cutting a Cube
 Problem of the Month: The Problems of the Month (POM) are used in a variety of ways to promote problem solving and to foster the first standard of mathematical practice from the Common Core State Standards:
Chapter 7 Data Modeling Using the Entity- Relationship (ER) Model
 Model") Chapter 7 Data Modeling Using the Entity- Relationship (ER) Model Copyright 2011 Pearson Education, Inc. Publishing as Pearson Addison-Wesley Chapter 7 Outline Using High-Level Conceptual Data Models for
Chapter 7 Data Modeling Using the Entity- Relationship (ER) Model Copyright 2011 Pearson Education, Inc. Publishing as Pearson Addison-Wesley Chapter 7 Outline Using High-Level Conceptual Data Models for
A brief overview of developing a conceptual data model as the first step in creating a relational database.
 Data Modeling Windows Enterprise Support Database Services provides the following documentation about relational database design, the relational database model, and relational database software. Introduction
The Entity-Relationship Model
 The Entity-Relationship Model 221 After completing this chapter, you should be able to explain the three phases of database design, Why are multiple phases useful? evaluate the significance of the Entity-Relationship
EXTENDED LEARNING MODULE A
 EXTENDED LEARNING MODULE A DESIGNING DATABASES AND ENTITY- RELATIONSHIP DIAGRAMMING Student Learning Outcomes 1. Identify how databases and spreadsheets are both similar and different. 2. List and describe
Using UML Part One Structural Modeling Diagrams
 UML Tutorials Using UML Part One Structural Modeling Diagrams by Sparx Systems All material Sparx Systems 2007 Sparx Systems 2007 Page 1 Trademarks Object Management Group, OMG, Unified Modeling Language,
Select the Crow s Foot entity relationship diagram (ERD) option. Create the entities and define their components.
 option. Create the entities and define their components.") Α DESIGNING DATABASES WITH VISIO PROFESSIONAL: A TUTORIAL Microsoft Visio Professional is a powerful database design and modeling tool. The Visio software has so many features that we can t possibly demonstrate
Α DESIGNING DATABASES WITH VISIO PROFESSIONAL: A TUTORIAL Microsoft Visio Professional is a powerful database design and modeling tool. The Visio software has so many features that we can t possibly demonstrate
Knowledge and Skills: How to Unpack a Standard
 Overview Why unpack a standard into knowledge and skills? The first step in translating CTE course standards into relevant, engaging and student outcome-focused lessons involves a careful reading of the
LECTURE 11: PROCESS MODELING
 LECTURE 11: PROCESS MODELING Outline Logical modeling of processes Data Flow Diagram Elements Functional decomposition Data Flows Rules and Guidelines Structured Analysis with Use Cases Learning Objectives
Collated Food Requirements. Received orders. Resolved orders. 4 Check for discrepancies * Unmatched orders
 Introduction to Data Flow Diagrams What are Data Flow Diagrams? Data Flow Diagrams (DFDs) model that perspective of the system that is most readily understood by users the flow of information around the
Quantitative vs. Categorical Data: A Difference Worth Knowing Stephen Few April 2005
 Quantitative vs. Categorical Data: A Difference Worth Knowing Stephen Few April 2005 When you create a graph, you step through a series of choices, including which type of graph you should use and several
Chapter 2: Entity-Relationship Model. E-R R Diagrams
 Chapter 2: Entity-Relationship Model What s the use of the E-R model? Entity Sets Relationship Sets Design Issues Mapping Constraints Keys E-R Diagram Extended E-R Features Design of an E-R Database Schema
Performance Assessment Task Which Shape? Grade 3. Common Core State Standards Math - Content Standards
 Performance Assessment Task Which Shape? Grade 3 This task challenges a student to use knowledge of geometrical attributes (such as angle size, number of angles, number of sides, and parallel sides) to
Entity/Relationship Modelling. Database Systems Lecture 4 Natasha Alechina
 Entity/Relationship Modelling Database Systems Lecture 4 Natasha Alechina In This Lecture Entity/Relationship models Entities and Attributes Relationships Attributes E/R Diagrams For more information Connolly
Instructional Systems Design
 Analysis and Design of Distance Learning Systems: Instructional Systems Design Contents The Purpose of Design Audience of Design documents Phases of Instructional Design Development of initial Content
Numeracy and mathematics Experiences and outcomes
 Numeracy and mathematics Experiences and outcomes My learning in mathematics enables me to: develop a secure understanding of the concepts, principles and processes of mathematics and apply these in different
7.1 The Information system
 Chapter 7. Database Planning, Design and Administration Last few decades have seen proliferation of software applications, many requiring constant maintenance involving: correcting faults, implementing
DATABASE INTRODUCTION
 Introduction The history of database system research is one of exceptional productivity and startling economic impact. We have learnt that from the days of file-based systems there are better ways to handle
Database Design. Marta Jakubowska-Sobczak IT/ADC based on slides prepared by Paula Figueiredo, IT/DB
 Marta Jakubowska-Sobczak IT/ADC based on slides prepared by Paula Figueiredo, IT/DB Outline Database concepts Conceptual Design Logical Design Communicating with the RDBMS 2 Some concepts Database: an
Demonstrating Understanding Rubrics and Scoring Guides
 Demonstrating Understanding Rubrics and Scoring Guides Project-based learning demands a more progressive means of assessment where students can view learning as a process and use problem-solving strategies
Conceptual Design: Entity Relationship Models. Objectives. Overview
 Conceptual Design: Entity Relationship Models Craig Van Slyke, University of Central Florida cvanslyke@bus.ucf.edu John Day, Ohio University Objectives Define terms related to entity relationship modeling,
Numerator Denominator
 Fractions A fraction is any part of a group, number or whole. Fractions are always written as Numerator Denominator A unitary fraction is one where the numerator is always 1 e.g 1 1 1 1 1...etc... 2 3
A technical discussion on modeling with UML 06/11/03 Entity Relationship Modeling with UML
 A technical discussion on modeling with UML 06/11/03 Entity Relationship Modeling with UML Davor Gornik Improving software development capability 2 Table of Contents Entity Relationship Modeling... 1 Core
Database Design Overview. Conceptual Design ER Model. Entities and Entity Sets. Entity Set Representation. Keys
 Database Design Overview Conceptual Design. The Entity-Relationship (ER) Model CS430/630 Lecture 12 Conceptual design The Entity-Relationship (ER) Model, UML High-level, close to human thinking Semantic
We know how to query a database using SQL. A set of tables and their schemas are given Data are properly loaded
 E-R Diagram Database Development We know how to query a database using SQL A set of tables and their schemas are given Data are properly loaded But, how can we develop appropriate tables and their schema
The E-R èentity-relationshipè data model views the real world as a set of basic objects èentitiesè and
 CMPT-354-Han-95.3 Lecture Notes September 20, 1995 Chapter 2 The Entity-Relationship Model The E-R èentity-relationshipè data model views the real world as a set of basic objects èentitiesè and relationships
Introduction to BPMN
 Stephen A. White, IBM Corporation Abstract This paper is intended to provide a high-level overview and introduction to the Business Process Modeling Notation (BPMN). The context and general uses for BPMN
Database IST400/600. Jian Qin. A collection of data? A computer system? Everything you collected for your group project?
 Relational Databases IST400/600 Jian Qin Database A collection of data? Everything you collected for your group project? A computer system? File? Spreadsheet? Information system? Date s criteria: Integration
CA IDMS. Database Design Guide. Release 18.5.00, 2nd Edition
 CA IDMS Database Design Guide Release 18.5.00, 2nd Edition This Documentation, which includes embedded help systems and electronically distributed materials, (hereinafter referred to as the Documentation
Chapter 3. Data Analysis and Diagramming
 Chapter 3 Data Analysis and Diagramming Introduction This chapter introduces data analysis and data diagramming. These make one of core skills taught in this course. A big part of any skill is practical
A Technique for Teaching Difficult Concepts in an Undergraduate Business Database Management Systems Course
 Twelfth LACCEI Latin American and Caribbean Conference for Engineering and Technology (LACCEI 2014) Excellence in Engineering To Enhance a Country s Productivity July 22-24, 2014 Guayaquil, Ecuador. A
Common Mistakes in Data Presentation Stephen Few September 4, 2004
 Common Mistakes in Data Presentation Stephen Few September 4, 2004 I'm going to take you on a short stream-of-consciousness tour through a few of the most common and sometimes downright amusing problems
CREATING LEARNING OUTCOMES
 CREATING LEARNING OUTCOMES What Are Student Learning Outcomes? Learning outcomes are statements of the knowledge, skills and abilities individual students should possess and can demonstrate upon completion
Database Management Systems
 Database Management Systems Database Design (1) 1 Topics Information Systems Life Cycle Data Base Design Logical Design Physical Design Entity Relationship (ER) Model Entity Relationship Attributes Cardinality
Check, Revise, and Edit Chart
 Check Revise & Edit PBP-15-C 2002 Nancy Fetzer Purpose: Revising and editing is a difficult part of the writing process. Student editing is a valuable technique, but only if students understand how to
Data Modeling: Part 1. Entity Relationship (ER) Model
 Model") Data Modeling: Part 1 Entity Relationship (ER) Model MBA 8473 1 Cognitive Objectives (Module 2) 32. Explain the three-step process of data-driven information system (IS) development 33. Examine the purpose
Data Modeling: Part 1 Entity Relationship (ER) Model MBA 8473 1 Cognitive Objectives (Module 2) 32. Explain the three-step process of data-driven information system (IS) development 33. Examine the purpose
Data Modeling for Healthcare Systems Integration: Use of the MetaModel
 Data Modeling for Healthcare Systems Integration: Use of the MetaModel Jack E. Myers, BSME, MS, MBA President, The Metadata Company "Problems can not be solved with the same knowledge with which they were
Communication Process
 Welcome and Introductions Lesson 7 Communication Process Overview: This lesson teaches learners to define the elements of effective communication and its process. It will focus on communication as the
Geometry Solve real life and mathematical problems involving angle measure, area, surface area and volume.
 Performance Assessment Task Pizza Crusts Grade 7 This task challenges a student to calculate area and perimeters of squares and rectangles and find circumference and area of a circle. Students must find
Mathematics Instructional Cycle Guide
 Mathematics Instructional Cycle Guide Fractions on the number line 3NF2a Created by Kelly Palaia, 2014 Connecticut Dream Team teacher 1 CT CORE STANDARDS This Instructional Cycle Guide relates to the following
GMAT.cz www.gmat.cz info@gmat.cz. GMAT.cz KET (Key English Test) Preparating Course Syllabus
 Preparating Course Syllabus") Lesson Overview of Lesson Plan Numbers 1&2 Introduction to Cambridge KET Handing Over of GMAT.cz KET General Preparation Package Introduce Methodology for Vocabulary Log Introduce Methodology for Grammar
Lesson Overview of Lesson Plan Numbers 1&2 Introduction to Cambridge KET Handing Over of GMAT.cz KET General Preparation Package Introduce Methodology for Vocabulary Log Introduce Methodology for Grammar
INTRODUCTION TO CONCEPT MAPPING. Joseph D. Novak Professor of Education and Professor of Biological Sciences Cornell University
 INTRODUCTION TO CONCEPT MAPPING Joseph D. Novak Professor of Education and Professor of Biological Sciences Cornell University Visiting Professor The University of West Florida ERDC/Building 78 11000 University
Fractions as Numbers INTENSIVE INTERVENTION. National Center on. at American Institutes for Research
 National Center on INTENSIVE INTERVENTION at American Institutes for Research Fractions as Numbers 000 Thomas Jefferson Street, NW Washington, DC 0007 E-mail: NCII@air.org While permission to reprint this
Welcome to the Data Analytics Toolkit PowerPoint presentation on EHR architecture and meaningful use.
 Welcome to the Data Analytics Toolkit PowerPoint presentation on EHR architecture and meaningful use. When data is collected and entered into the electronic health record, the data is ultimately stored
three Entity-Relationship Modeling chapter OVERVIEW CHAPTER
 three Entity-Relationship Modeling CHAPTER chapter OVERVIEW 3.1 Introduction 3.2 The Entity-Relationship Model 3.3 Entity 3.4 Attributes 3.5 Relationships 3.6 Degree of a Relationship 3.7 Cardinality of
A GUIDE TO LABORATORY REPORT WRITING ILLINOIS INSTITUTE OF TECHNOLOGY THE COLLEGE WRITING PROGRAM
 AT THE ILLINOIS INSTITUTE OF TECHNOLOGY THE COLLEGE WRITING PROGRAM www.iit.edu/~writer writer@charlie.cns.iit.edu FALL 1999 Table of Contents Table of Contents... 2 Introduction... 3 Need for Report Writing...
Overview. Essential Questions. Precalculus, Quarter 4, Unit 4.5 Build Arithmetic and Geometric Sequences and Series
 Sequences and Series Overview Number of instruction days: 4 6 (1 day = 53 minutes) Content to Be Learned Write arithmetic and geometric sequences both recursively and with an explicit formula, use them
N Q.3 Choose a level of accuracy appropriate to limitations on measurement when reporting quantities.
 Performance Assessment Task Swimming Pool Grade 9 The task challenges a student to demonstrate understanding of the concept of quantities. A student must understand the attributes of trapezoids, how to
Lecture Notes INFORMATION RESOURCES
 Vilnius Gediminas Technical University Jelena Mamčenko Lecture Notes on INFORMATION RESOURCES Part I Introduction to Dta Modeling and MSAccess Code FMITB02004 Course title Information Resourses Course
Materials: Children s literature written in Spanish, videos, games, and pictures comprise the list of materials.
 Pre-Kindergarten The primary focus of the Spanish program in Pre-Kindergarten is the exposure to a foreign language. Since students are introduced to a language and culture that may not be familiar, an
How to Make a Domain Model. Tutorial
 How to Make a Domain Model Tutorial What is a Domain Model? Illustrates meaningful conceptual classes in problem domain Represents real-world concepts, not software components Software-oriented class diagrams
Metacognition. Complete the Metacognitive Awareness Inventory for a quick assessment to:
 Metacognition Metacognition is essential to successful learning because it enables individuals to better manage their cognitive skills and to determine weaknesses that can be corrected by constructing
PEMBINA TRAILS SCHOOL DIVISION. Information Technology Department. Inspiration 7.0
 PEMBINA TRAILS SCHOOL DIVISION Information Technology Department Inspiration 7.0 PEMBINA TRAILS SCHOOL DIVISION INFROMATION TECHNOLOGY DEPARTMENT Inspiration 7.0 Ivone Batista (ITA) Information Technology
The Stacks Approach. Why It s Time to Start Thinking About Enterprise Technology in Stacks
 The Stacks Approach Why It s Time to Start Thinking About Enterprise Technology in Stacks CONTENTS Executive Summary Layer 1: Enterprise Competency Domains Layer 2: Platforms Layer 3: Enterprise Technology
Charting Your Course: Charts and Graphs for IT Projects
 Charting Your Course: Charts and Graphs for IT Projects Dawn Li, Ph.D. and Gary McQuown Data and Analytic Solutions, Inc. Fairfax, VA ABSTRACT This paper describes the most common types of charts and graphs
ACSG 552 Assignment #1 Spring 2009 Diana Oboikovitz. Due in class on Thursday, Jan. 22:
 ACSG 552 Assignment #1 Spring 2009 Diana Oboikovitz Due in class on Thursday, Jan. 22: Read course syllabus Read Chapters 1, 2, 3 Read lecture notes Submit answers to the following review questions & problems
Extend Table Lens for High-Dimensional Data Visualization and Classification Mining
 Extend Table Lens for High-Dimensional Data Visualization and Classification Mining CPSC 533c, Information Visualization Course Project, Term 2 2003 Fengdong Du fdu@cs.ubc.ca University of British Columbia
Fundamentals of Database System
 Fundamentals of Database System Chapter 4 Normalization Fundamentals of Database Systems (Chapter 4) Page 1 Introduction To Normalization In general, the goal of a relational database design is to generate
Kindergarten Math Curriculum Course Description and Philosophy Text Reference:
 Kindergarten Math Curriculum Course Description and Philosophy How do numbers and math affect our daily lives? What types of problems can be solved by understanding numbers and math concepts? Through inquiry,
Workflow and Process Analysis for CCC
 Section 3.6 Design Workflow and Process Analysis for CCC This tool introduces the importance of workflow and process improvement in a community-based care coordination (CCC) program, describes the value
(Refer Slide Time 00:56)
") Software Engineering Prof.N. L. Sarda Computer Science & Engineering Indian Institute of Technology, Bombay Lecture-12 Data Modelling- ER diagrams, Mapping to relational model (Part -II) We will continue
Software Engineering Prof.N. L. Sarda Computer Science & Engineering Indian Institute of Technology, Bombay Lecture-12 Data Modelling- ER diagrams, Mapping to relational model (Part -II) We will continue
Accessibility Strategies for Mathematics
 Accessibility Strategies for Mathematics "Equity does not mean that every student should receive identical instruction; instead, it demands that reasonable and appropriate accommodations be made as needed
Entity - Relationship Modelling
 Topic 5 Entity - Relationship Modelling LEARNING OUTCOMES When you have completed this Topic you should be able to: 1. Acquire the basic concepts of the Entity-Relationship (ER) model. 2. Discuss how to
2. Conceptual Modeling using the Entity-Relationship Model
 ECS-165A WQ 11 15 Contents 2. Conceptual Modeling using the Entity-Relationship Model Basic concepts: entities and entity types, attributes and keys, relationships and relationship types Entity-Relationship
1. Human beings have a natural perception and appreciation for symmetry.
 I. SYMMETRY ELEMENTS AND OPERATIONS A. Introduction 1. Human beings have a natural perception and appreciation for symmetry. a. Most people tend to value symmetry in their visual perception of the world.
Curriculum Alignment Project
 Curriculum Alignment Project Math Unit Date: Unit Details Title: Solving Linear Equations Level: Developmental Algebra Team Members: Michael Guy Mathematics, Queensborough Community College, CUNY Jonathan
Announcements. SE 1: Software Requirements Specification and Analysis. Review: Use Case Descriptions
 Announcements SE 1: Software Requirements Specification and Analysis Lecture 4: Basic Notations Nancy Day, Davor Svetinović http://www.student.cs.uwaterloo.ca/ cs445/winter2006 uw.cs.cs445 Send your group
Section Five Learning Module D:
 Section Five Learning Module D: the Project 5.1 Module D: Objectives At the conclusion of this module you will be able to: implement a project plan; keep control of a project plan; effectively review a
Databases and BigData
 Eduardo Cunha de Almeida eduardo.almeida@uni.lu Outline of the course Introduction Database Systems (E. Almeida) Distributed Hash Tables and P2P (C. Cassagnes) NewSQL (D. Kim and J. Meira) NoSQL (D. Kim)
Answers to Review Questions
 Tutorial 2 The Database Design Life Cycle Reference: MONASH UNIVERSITY AUSTRALIA Faculty of Information Technology FIT1004 Database Rob, P. & Coronel, C. Database Systems: Design, Implementation & Management,
A Short Tutorial on Using Visio 2010 for Entity-Relationship Diagrams
 A Short Tutorial on Using Visio 2010 for Entity-Relationship Diagrams by Nezar Hussain Microsoft Visio 2010 is a flexible software tool that allows users to create some diagrams and charts, providing an
Introduction to Visio 2003 By Kristin Davis Information Technology Lab School of Information The University of Texas at Austin Summer 2005
 Introduction to Visio 2003 By Kristin Davis Information Technology Lab School of Information The University of Texas at Austin Summer 2005 Introduction This tutorial is designed for people who are new
Score: /20. Answer Sheet. Today s Date: Your Name ( ): Your Student Number: Your English Teacher s Name( ): 19. (A) (B) (C) (D) 18.
: Your Student Number: Your English Teacher s Name( ): 19. (A) (B) (C) (D) 18.") Josai International University Center for Language Education Set B TOEIC LAB Assignment #6 Answer Sheet Score: /20 Today s Date: Your Name ( ): Your Student Number: Your English Teacher s Name( ): Check
Josai International University Center for Language Education Set B TOEIC LAB Assignment #6 Answer Sheet Score: /20 Today s Date: Your Name ( ): Your Student Number: Your English Teacher s Name( ): Check
Developing Entity Relationship Diagrams (ERDs)
") Developing Entity Relationship Diagrams (ERDs) Introduction This document seeks to give expanded explanation and examples of how to produce entity relationship diagrams. It is based on material adapted
Developing Entity Relationship Diagrams (ERDs) Introduction This document seeks to give expanded explanation and examples of how to produce entity relationship diagrams. It is based on material adapted
Tips and Ideas for Making Visuals to Support Young Children with Challenging Behavior
 Tips and Ideas for Making Visuals to Support Young Children with Challenging Behavior Why Use Visual Strategies 1. Visual strategies can be used to prevent challenging behavior. 2. Visual strategies are
PRINCIPLES OF EFFECTIVE DATABASE DESIGN
 PRINCIPLES OF EFFECTIVE DATABASE DESIGN Table of Contents Page LESSON 1: WHAT IS A DATABASE?...1 LESSON 2: IDENTIFYING REQUIREMENTS...3 LESSON 3: CONCEPTUAL DESIGN - THE STORYBOARD...5 LESSON 4: CONCEPTUAL
Preview DESIGNING DATABASES WITH VISIO PROFESSIONAL: A TUTORIAL
 DESIGNING DATABASES WITH VISIO PROFESSIONAL: A TUTORIAL A Microsoft Visio Professional is a powerful database design and modeling tool. The Visio software has so many features that it is impossible to
This Performance Standards include four major components. They are
 Eighth Grade Science Curriculum Approved July 12, 2004 The Georgia Performance Standards are designed to provide students with the knowledge and skills for proficiency in science at the eighth grade level.