Discrete Probability Distributions. Chapter 6
|
|
|
- Jason Jackson
- 7 years ago
- Views:
Transcription
1 Discrete Probability Distributions Chapter 6
2 Learning Objectives Define terms random variable and probability distribution. Distinguish between discrete and continuous probability distributions. Calculate the mean, variance, and standard deviation of a discrete probability distribution. Describe the characteristics of binomial distribution and compute probabilities using binomial distribution. Describe the characteristics of hypergeometric distribution and compute probabilities using hypergeometric distribution. Describe the characteristic of Poisson distribution and compute probability using Poisson distribution.
3 Random Variable Random variable is a quantity resulting from an experiment that, by chance, can assume different values. Experiment: Tossing a coin three times Random variable: the number of heads. Experiment: Rolling a dice. Random variable: the number appears face up.
4 Types of Random Variables Discrete Random Variable can assume only certain clearly separated values. It is usually the result of counting something Continuous Random Variable can assume infinite number of values within a given range. It is usually the result of some type of measurement
5 Discrete Random Variables - Examples The number of students in a class. The number of children in a family. The number of cars entering a carwash in an hour.
6 Continuous Random Variables - Examples The distance students travel to class. The time it takes an executive to drive to work. The length of an afternoon nap. The length of time of a particular phone call.
7 Probability Distribution Experiment: Toss a coin three times. Observe the number of heads. The possible results are: zero heads, one head, two heads, and three heads. What is the probability distribution for the number of heads?
8 Probability Distribution
9 Probability Distribution
10 Probability Distribution
11 Discrete Distribution The main features of a discrete probability distribution are: The sum of the probabilities of the various outcomes is The probability of a particular outcome is between 0 and The outcomes are mutually exclusive.
12 The Mean The mean is a typical value used to represent the central location of a probability distribution. The mean of a probability distribution is also referred to as its expected value.
13 The Variance and Standard Deviation Measures the amount of spread in a distribution The computational steps are: 1. Subtract the mean from each value, and square this difference. 2. Multiply each squared difference by its probability. 3. Sum the resulting products to arrive at the variance. The standard deviation is found by taking the positive square root of the variance.
14 Example John Ragsdale sells new cars for Pelican Ford. John usually sells the largest number of cars on Saturday. He has developed the following probability distribution for the number of cars he expects to sell on a particular Saturday. 1. What type of distribution is this? 2. On a typical Saturday, how many cars does John expect to sell? 3. What is the variance and the standard deviation of the distribution?
15 Example 1. This is a discrete probability distribution. 2. To get how many cars does John expect to sell on a typical Saturday? We need to calculate the mean (the expected value). μ = XP(X) μ = = 2.1 cars
16 Example To calculate the variance: σ 2 = X μ 2 P(X) σ 2 = σ 2 = 1.29 To calculate the standard deviation: σ = 1.29 = cars
17 Example 2 A quiz has 3 multiple choice questions. Each question has 5 choices, and only one of them is correct. What is the probability that a student will guess all the correct choices? For each question we have 0.2 chance of guessing the correct answer and 0.8 chance of guessing the wrong answer. Therefore, the probability that a student will guess all the correct choices is: = = 0.008
18 Example 2 Now, if we define a random variable X to be the number of guessing the correct answers. X can take values 0, 1, 2, and 3. We answered P(X = 3) or P(3) and it is What is P(0)? We can see that P 0 = = = 0.512
19 Example 2 What is P(1)? Recall the probability of guessing a correct answer is 0.2 and the probability of guessing a wrong answer is 0.8. So, the probability of guessing one correct answer is = = How many ways can we get one correct answer? There are the three possible ways of getting one correct answer. Therefore, P(1) = = 0.384
20 Example 2 What is P(2)? Recall the probability of guessing a correct answer is 0.2 and the probability of guessing a wrong answer is 0.8. So, the probability of guessing two correct answers is = = How many ways can we get two correct answers? There are the three possible ways of getting two correct answers. Therefore, P(2) = = 0.096
21 Example 2 Therefore, the probability distribution of X is X P(X) μ =?, σ 2 =?
22 Binomial Distribution Characteristics of a Binomial Probability Experiment 1. An outcome on each trial of an experiment is classified into one of two mutually exclusive categories- a success or a failure. 2. The random variable counts the number of successes in a fixed number of trials. 3. The probability of success and failure stay the same for each trial. 4. The trials are independent, meaning that the outcome of one trial does not affect the outcome of any other trial.
23 Binomial Distribution
24 Binomial Dist. Mean and Variance
25 Binomial Distribution Example: There are five flights daily from Pittsburgh via US Airways into the Bradford, Pennsylvania, Regional Airport. Suppose the probability that any flight arrives late is What is the probability that none of the flights are late today? 2. What is the average number of late flights? 3. What is the variance of the number of late flights?
26 Hypergeometric Distribution Characteristics of a Hypergeometric Probability Experiment: 1. An outcome on each trial of an experiment is classified into one of two mutually exclusive categories a success or a failure. 2. The random variable is the number of successes in a fixed number of trials. 3. The trials are not independent. 4. We assume that we sample from a finite population without replacement and n/n > So, the probability of a success changes for each trial.
27 Hypergeometric Distribution
28 Hypergeometric Distribution Example: Horwege Discount Brokers plans to hire 5 new financial analysts this year. There is a pool of 12 approved applicants, and George Horwege, the owner, decides to randomly select those who will be hired. There are 8 men and 4 women among the approved applicants. What is the probability that 3 of the 5 hired are men?
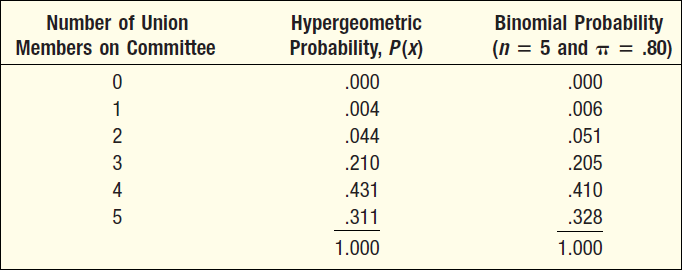
29 Hypergeometric Distribution Example: PlayTime Toys Inc. employs 50 people in the Assembly Department. Forty of the employees belong to a union and ten do not. Five employees are selected at random to form a committee to meet with management regarding shift starting times. What is the probability that four of the five selected for the committee belong to a union?
30 Binomial vs. Hypergeometric In order for you to compare the two probability distributions, Table 6 5 shows the hypergeometric and binomial probabilities for the PlayTime Toys Inc. example. Because 40 of the 50 Assembly Department employees belong to the union, we let π = 0.80 for the binomial distribution. The binomial probabilities for Table 6 5 come from the binomial distribution with n = 5 and π = 0.80.
31 Binomial vs. Hypergeometric
32 Binomial vs. Hypergeometric When the binomial requirement of a constant probability of success cannot be met, the hypergeometric distribution should be used. However, as Table 6 5 shows, under certain conditions the results of the binomial distribution can be used to approximate the hypergeometric. This leads to a rule of thumb: If selected items are not returned to the population, the binomial distribution can be used to closely approximate the hypergeometric distribution when n < 0.05N. In words, the binomial will suffice if the sample is less than 5 percent of the population.
33 Poisson Distribution The Poisson probability distribution describes the number of times some event occurs during a specified interval. The interval may be time, distance, area, or volume. Assumptions of the Poisson Distribution (1) The probability is proportional to the length of the interval. (2) The intervals are independent.
34 Poisson Distribution The characteristics of Poisson distribution: 1. The random variable is the number of times some event occurs during a define interval. 2. The probability of the event is proportional to the size of the interval. 3. The intervals do not overlap and are independent.
35 Poisson Distribution The Poisson distribution can be described mathematically using the formula:
36 Poisson Dist. Mean and Variance The Mean.( the expected value) of the Poisson Distribution is μ The variance is also μ.
37 Example 1 Assume baggage is rarely lost by Northwest Airlines. Suppose a random sample of 1,000 flights shows a total of 300 bags were lost. Thus, the arithmetic mean number of lost bags per flight is 0.3 (300/1,000). If the number of lost bags per flight follows a Poisson distribution with u = 0.3, find the probability of not losing any bags.
38 Example 2 In the past, schools in Los Angeles County have closed an average of three days each year for weather emergencies. What is the probability that schools in Los Angeles will close for four-days next year?
Section 6.1 Discrete Random variables Probability Distribution
 Section 6.1 Discrete Random variables Probability Distribution Definitions a) Random variable is a variable whose values are determined by chance. b) Discrete Probability distribution consists of the values
Random variables, probability distributions, binomial random variable
 Week 4 lecture notes. WEEK 4 page 1 Random variables, probability distributions, binomial random variable Eample 1 : Consider the eperiment of flipping a fair coin three times. The number of tails that
CHAPTER 7 SECTION 5: RANDOM VARIABLES AND DISCRETE PROBABILITY DISTRIBUTIONS
 CHAPTER 7 SECTION 5: RANDOM VARIABLES AND DISCRETE PROBABILITY DISTRIBUTIONS TRUE/FALSE 235. The Poisson probability distribution is a continuous probability distribution. F 236. In a Poisson distribution,
Chapter 4 Lecture Notes
 Chapter 4 Lecture Notes Random Variables October 27, 2015 1 Section 4.1 Random Variables A random variable is typically a real-valued function defined on the sample space of some experiment. For instance,
Distributions. GOALS When you have completed this chapter, you will be able to: 1 Define the terms probability distribution and random variable.
 6 Discrete GOALS When you have completed this chapter, you will be able to: Probability 1 Define the terms probability distribution and random variable. 2 Distinguish between discrete and continuous probability
Chapter 4. Probability Distributions
 Chapter 4 Probability Distributions Lesson 4-1/4-2 Random Variable Probability Distributions This chapter will deal the construction of probability distribution. By combining the methods of descriptive
4.1 4.2 Probability Distribution for Discrete Random Variables
 4.1 4.2 Probability Distribution for Discrete Random Variables Key concepts: discrete random variable, probability distribution, expected value, variance, and standard deviation of a discrete random variable.
Chapter 5. Discrete Probability Distributions
 Chapter 5. Discrete Probability Distributions Chapter Problem: Did Mendel s result from plant hybridization experiments contradicts his theory? 1. Mendel s theory says that when there are two inheritable
Chapter 5. Random variables
 Random variables random variable numerical variable whose value is the outcome of some probabilistic experiment; we use uppercase letters, like X, to denote such a variable and lowercase letters, like
ST 371 (IV): Discrete Random Variables
: Discrete Random Variables") ST 371 (IV): Discrete Random Variables 1 Random Variables A random variable (rv) is a function that is defined on the sample space of the experiment and that assigns a numerical variable to each possible
ST 371 (IV): Discrete Random Variables 1 Random Variables A random variable (rv) is a function that is defined on the sample space of the experiment and that assigns a numerical variable to each possible
WHERE DOES THE 10% CONDITION COME FROM?
 1 WHERE DOES THE 10% CONDITION COME FROM? The text has mentioned The 10% Condition (at least) twice so far: p. 407 Bernoulli trials must be independent. If that assumption is violated, it is still okay
ACMS 10140 Section 02 Elements of Statistics October 28, 2010. Midterm Examination II
 ACMS 10140 Section 02 Elements of Statistics October 28, 2010 Midterm Examination II Name DO NOT remove this answer page. DO turn in the entire exam. Make sure that you have all ten (10) pages of the examination
An Introduction to Basic Statistics and Probability
 An Introduction to Basic Statistics and Probability Shenek Heyward NCSU An Introduction to Basic Statistics and Probability p. 1/4 Outline Basic probability concepts Conditional probability Discrete Random
2. Discrete random variables
 2. Discrete random variables Statistics and probability: 2-1 If the chance outcome of the experiment is a number, it is called a random variable. Discrete random variable: the possible outcomes can be
Chapter 5 Discrete Probability Distribution. Learning objectives
 Chapter 5 Discrete Probability Distribution Slide 1 Learning objectives 1. Understand random variables and probability distributions. 1.1. Distinguish discrete and continuous random variables. 2. Able
Solutions for Review Problems for Exam 2 Math 1040 1 1. You roll two fair dice. (a) Draw a tree diagram for this experiment.
 Draw a tree diagram for this experiment.") Solutions for Review Problems for Exam 2 Math 1040 1 1. You roll two fair dice. (a) Draw a tree diagram for this experiment. 1 2 3 4 5 6 1 2 3 4 5 6 1 2 3 4 5 6 1 2 3 4 5 6 1 2 3 4 5 6 1 2 3 4 5 6 1 2
Solutions for Review Problems for Exam 2 Math 1040 1 1. You roll two fair dice. (a) Draw a tree diagram for this experiment. 1 2 3 4 5 6 1 2 3 4 5 6 1 2 3 4 5 6 1 2 3 4 5 6 1 2 3 4 5 6 1 2 3 4 5 6 1 2
Ch5: Discrete Probability Distributions Section 5-1: Probability Distribution
 Recall: Ch5: Discrete Probability Distributions Section 5-1: Probability Distribution A variable is a characteristic or attribute that can assume different values. o Various letters of the alphabet (e.g.
Lecture 5 : The Poisson Distribution
 Lecture 5 : The Poisson Distribution Jonathan Marchini November 10, 2008 1 Introduction Many experimental situations occur in which we observe the counts of events within a set unit of time, area, volume,
ACMS 10140 Section 02 Elements of Statistics October 28, 2010 Midterm Examination II Answers
 ACMS 10140 Section 02 Elements of Statistics October 28, 2010 Midterm Examination II Answers Name DO NOT remove this answer page. DO turn in the entire exam. Make sure that you have all ten (10) pages
The normal approximation to the binomial
 The normal approximation to the binomial The binomial probability function is not useful for calculating probabilities when the number of trials n is large, as it involves multiplying a potentially very
Business Statistics, 9e (Groebner/Shannon/Fry) Chapter 5 Discrete Probability Distributions
 Chapter 5 Discrete Probability Distributions") Business Statistics, 9e (Groebner/Shannon/Fry) Chapter 5 Discrete Probability Distributions 1) A random variable is generated when a variableʹs value is determined by using classical probability. Answer:
Business Statistics, 9e (Groebner/Shannon/Fry) Chapter 5 Discrete Probability Distributions 1) A random variable is generated when a variableʹs value is determined by using classical probability. Answer:
Question: What is the probability that a five-card poker hand contains a flush, that is, five cards of the same suit?
 ECS20 Discrete Mathematics Quarter: Spring 2007 Instructor: John Steinberger Assistant: Sophie Engle (prepared by Sophie Engle) Homework 8 Hints Due Wednesday June 6 th 2007 Section 6.1 #16 What is the
Normal distribution. ) 2 /2σ. 2π σ
 2 /2σ. 2π σ") Normal distribution The normal distribution is the most widely known and used of all distributions. Because the normal distribution approximates many natural phenomena so well, it has developed into a
Normal distribution The normal distribution is the most widely known and used of all distributions. Because the normal distribution approximates many natural phenomena so well, it has developed into a
The normal approximation to the binomial
 The normal approximation to the binomial In order for a continuous distribution (like the normal) to be used to approximate a discrete one (like the binomial), a continuity correction should be used. There
4. Continuous Random Variables, the Pareto and Normal Distributions
 4. Continuous Random Variables, the Pareto and Normal Distributions A continuous random variable X can take any value in a given range (e.g. height, weight, age). The distribution of a continuous random
The Binomial Probability Distribution
 The Binomial Probability Distribution MATH 130, Elements of Statistics I J. Robert Buchanan Department of Mathematics Fall 2015 Objectives After this lesson we will be able to: determine whether a probability
Mathematical goals. Starting points. Materials required. Time needed
 Level S2 of challenge: B/C S2 Mathematical goals Starting points Materials required Time needed Evaluating probability statements To help learners to: discuss and clarify some common misconceptions about
STAT 35A HW2 Solutions
 STAT 35A HW2 Solutions http://www.stat.ucla.edu/~dinov/courses_students.dir/09/spring/stat35.dir 1. A computer consulting firm presently has bids out on three projects. Let A i = { awarded project i },
ECON1003: Analysis of Economic Data Fall 2003 Answers to Quiz #2 11:40a.m. 12:25p.m. (45 minutes) Tuesday, October 28, 2003
 Tuesday, October 28, 2003") ECON1003: Analysis of Economic Data Fall 2003 Answers to Quiz #2 11:40a.m. 12:25p.m. (45 minutes) Tuesday, October 28, 2003 1. (4 points) The number of claims for missing baggage for a well-known airline
ECON1003: Analysis of Economic Data Fall 2003 Answers to Quiz #2 11:40a.m. 12:25p.m. (45 minutes) Tuesday, October 28, 2003 1. (4 points) The number of claims for missing baggage for a well-known airline
Notes on Continuous Random Variables
 Notes on Continuous Random Variables Continuous random variables are random quantities that are measured on a continuous scale. They can usually take on any value over some interval, which distinguishes
DETERMINE whether the conditions for a binomial setting are met. COMPUTE and INTERPRET probabilities involving binomial random variables
 1 Section 7.B Learning Objectives After this section, you should be able to DETERMINE whether the conditions for a binomial setting are met COMPUTE and INTERPRET probabilities involving binomial random
Section 5 Part 2. Probability Distributions for Discrete Random Variables
 Section 5 Part 2 Probability Distributions for Discrete Random Variables Review and Overview So far we ve covered the following probability and probability distribution topics Probability rules Probability
Stat 20: Intro to Probability and Statistics
 Stat 20: Intro to Probability and Statistics Lecture 16: More Box Models Tessa L. Childers-Day UC Berkeley 22 July 2014 By the end of this lecture... You will be able to: Determine what we expect the sum
Introduction to the Practice of Statistics Fifth Edition Moore, McCabe Section 4.4 Homework
 Introduction to the Practice of Statistics Fifth Edition Moore, McCabe Section 4.4 Homework 4.65 You buy a hot stock for $1000. The stock either gains 30% or loses 25% each day, each with probability.
Normal Distribution as an Approximation to the Binomial Distribution
 Chapter 1 Student Lecture Notes 1-1 Normal Distribution as an Approximation to the Binomial Distribution : Goals ONE TWO THREE 2 Review Binomial Probability Distribution applies to a discrete random variable
APPLICATIONS AND MODELING WITH QUADRATIC EQUATIONS
 APPLICATIONS AND MODELING WITH QUADRATIC EQUATIONS Now that we are starting to feel comfortable with the factoring process, the question becomes what do we use factoring to do? There are a variety of classic
MEASURES OF VARIATION
 NORMAL DISTRIBTIONS MEASURES OF VARIATION In statistics, it is important to measure the spread of data. A simple way to measure spread is to find the range. But statisticians want to know if the data are
MULTIPLE CHOICE. Choose the one alternative that best completes the statement or answers the question.
 Ch. 4 Discrete Probability Distributions 4.1 Probability Distributions 1 Decide if a Random Variable is Discrete or Continuous 1) State whether the variable is discrete or continuous. The number of cups
Binomial Random Variables
 Binomial Random Variables Dr Tom Ilvento Department of Food and Resource Economics Overview A special case of a Discrete Random Variable is the Binomial This happens when the result of the eperiment is
FEGYVERNEKI SÁNDOR, PROBABILITY THEORY AND MATHEmATICAL
 FEGYVERNEKI SÁNDOR, PROBABILITY THEORY AND MATHEmATICAL STATIsTICs 4 IV. RANDOm VECTORs 1. JOINTLY DIsTRIBUTED RANDOm VARIABLEs If are two rom variables defined on the same sample space we define the joint
Characteristics of Binomial Distributions
 Lesson2 Characteristics of Binomial Distributions In the last lesson, you constructed several binomial distributions, observed their shapes, and estimated their means and standard deviations. In Investigation
STATISTICS 8: CHAPTERS 7 TO 10, SAMPLE MULTIPLE CHOICE QUESTIONS
 STATISTICS 8: CHAPTERS 7 TO 10, SAMPLE MULTIPLE CHOICE QUESTIONS 1. If two events (both with probability greater than 0) are mutually exclusive, then: A. They also must be independent. B. They also could
Sample Questions for Mastery #5
 Name: Class: Date: Sample Questions for Mastery #5 Multiple Choice Identify the choice that best completes the statement or answers the question.. For which of the following binomial experiments could
2 Binomial, Poisson, Normal Distribution
 2 Binomial, Poisson, Normal Distribution Binomial Distribution ): We are interested in the number of times an event A occurs in n independent trials. In each trial the event A has the same probability
MAT 155. Key Concept. September 27, 2010. 155S5.5_3 Poisson Probability Distributions. Chapter 5 Probability Distributions
 MAT 155 Dr. Claude Moore Cape Fear Community College Chapter 5 Probability Distributions 5 1 Review and Preview 5 2 Random Variables 5 3 Binomial Probability Distributions 5 4 Mean, Variance and Standard
12.5: CHI-SQUARE GOODNESS OF FIT TESTS
 125: Chi-Square Goodness of Fit Tests CD12-1 125: CHI-SQUARE GOODNESS OF FIT TESTS In this section, the χ 2 distribution is used for testing the goodness of fit of a set of data to a specific probability
Probability Distributions
 CHAPTER 6 Probability Distributions Calculator Note 6A: Computing Expected Value, Variance, and Standard Deviation from a Probability Distribution Table Using Lists to Compute Expected Value, Variance,
Important Probability Distributions OPRE 6301
 Important Probability Distributions OPRE 6301 Important Distributions... Certain probability distributions occur with such regularity in real-life applications that they have been given their own names.
Lesson 1. Basics of Probability. Principles of Mathematics 12: Explained! www.math12.com 314
 Lesson 1 Basics of Probability www.math12.com 314 Sample Spaces: Probability Lesson 1 Part I: Basic Elements of Probability Consider the following situation: A six sided die is rolled The sample space
Elementary Statistics
 Elementary Statistics Chapter 1 Dr. Ghamsary Page 1 Elementary Statistics M. Ghamsary, Ph.D. Chap 01 1 Elementary Statistics Chapter 1 Dr. Ghamsary Page 2 Statistics: Statistics is the science of collecting,
MA 1125 Lecture 14 - Expected Values. Friday, February 28, 2014. Objectives: Introduce expected values.
 MA 5 Lecture 4 - Expected Values Friday, February 2, 24. Objectives: Introduce expected values.. Means, Variances, and Standard Deviations of Probability Distributions Two classes ago, we computed the
Probability Distributions
 Learning Objectives Probability Distributions Section 1: How Can We Summarize Possible Outcomes and Their Probabilities? 1. Random variable 2. Probability distributions for discrete random variables 3.
SOLUTIONS: 4.1 Probability Distributions and 4.2 Binomial Distributions
 SOLUTIONS: 4.1 Probability Distributions and 4.2 Binomial Distributions 1. The following table contains a probability distribution for a random variable X. a. Find the expected value (mean) of X. x 1 2
6.2. Discrete Probability Distributions
 6.2. Discrete Probability Distributions Discrete Uniform distribution (diskreetti tasajakauma) A random variable X follows the dicrete uniform distribution on the interval [a, a+1,..., b], if it may attain
Some special discrete probability distributions
 University of California, Los Angeles Department of Statistics Statistics 100A Instructor: Nicolas Christou Some special discrete probability distributions Bernoulli random variable: It is a variable that
STT315 Chapter 4 Random Variables & Probability Distributions KM. Chapter 4.5, 6, 8 Probability Distributions for Continuous Random Variables
 Chapter 4.5, 6, 8 Probability Distributions for Continuous Random Variables Discrete vs. continuous random variables Examples of continuous distributions o Uniform o Exponential o Normal Recall: A random
The mathematical branch of probability has its
 ACTIVITIES for students Matthew A. Carlton and Mary V. Mortlock Teaching Probability and Statistics through Game Shows The mathematical branch of probability has its origins in games and gambling. And
University of California, Los Angeles Department of Statistics. Random variables
 University of California, Los Angeles Department of Statistics Statistics Instructor: Nicolas Christou Random variables Discrete random variables. Continuous random variables. Discrete random variables.
Statistics I for QBIC. Contents and Objectives. Chapters 1 7. Revised: August 2013
 Statistics I for QBIC Text Book: Biostatistics, 10 th edition, by Daniel & Cross Contents and Objectives Chapters 1 7 Revised: August 2013 Chapter 1: Nature of Statistics (sections 1.1-1.6) Objectives
Statistics and Random Variables. Math 425 Introduction to Probability Lecture 14. Finite valued Random Variables. Expectation defined
 Expectation Statistics and Random Variables Math 425 Introduction to Probability Lecture 4 Kenneth Harris kaharri@umich.edu Department of Mathematics University of Michigan February 9, 2009 When a large
Descriptive Statistics. Purpose of descriptive statistics Frequency distributions Measures of central tendency Measures of dispersion
 Descriptive Statistics Purpose of descriptive statistics Frequency distributions Measures of central tendency Measures of dispersion Statistics as a Tool for LIS Research Importance of statistics in research
Probability Distributions
 CHAPTER 5 Probability Distributions CHAPTER OUTLINE 5.1 Probability Distribution of a Discrete Random Variable 5.2 Mean and Standard Deviation of a Probability Distribution 5.3 The Binomial Distribution
Chapter 3: DISCRETE RANDOM VARIABLES AND PROBABILITY DISTRIBUTIONS. Part 3: Discrete Uniform Distribution Binomial Distribution
 Chapter 3: DISCRETE RANDOM VARIABLES AND PROBABILITY DISTRIBUTIONS Part 3: Discrete Uniform Distribution Binomial Distribution Sections 3-5, 3-6 Special discrete random variable distributions we will cover
REPEATED TRIALS. The probability of winning those k chosen times and losing the other times is then p k q n k.
 REPEATED TRIALS Suppose you toss a fair coin one time. Let E be the event that the coin lands heads. We know from basic counting that p(e) = 1 since n(e) = 1 and 2 n(s) = 2. Now suppose we play a game
STAT 315: HOW TO CHOOSE A DISTRIBUTION FOR A RANDOM VARIABLE
 STAT 315: HOW TO CHOOSE A DISTRIBUTION FOR A RANDOM VARIABLE TROY BUTLER 1. Random variables and distributions We are often presented with descriptions of problems involving some level of uncertainty about
BINOMIAL DISTRIBUTION
 MODULE IV BINOMIAL DISTRIBUTION A random variable X is said to follow binomial distribution with parameters n & p if P ( X ) = nc x p x q n x where x = 0, 1,2,3..n, p is the probability of success & q
Math 461 Fall 2006 Test 2 Solutions
 Math 461 Fall 2006 Test 2 Solutions Total points: 100. Do all questions. Explain all answers. No notes, books, or electronic devices. 1. [105+5 points] Assume X Exponential(λ). Justify the following two
39.2. The Normal Approximation to the Binomial Distribution. Introduction. Prerequisites. Learning Outcomes
 The Normal Approximation to the Binomial Distribution 39.2 Introduction We have already seen that the Poisson distribution can be used to approximate the binomial distribution for large values of n and
6.3 Conditional Probability and Independence
 222 CHAPTER 6. PROBABILITY 6.3 Conditional Probability and Independence Conditional Probability Two cubical dice each have a triangle painted on one side, a circle painted on two sides and a square painted
Thursday, November 13: 6.1 Discrete Random Variables
 Thursday, November 13: 6.1 Discrete Random Variables Read 347 350 What is a random variable? Give some examples. What is a probability distribution? What is a discrete random variable? Give some examples.
Chapter 4. Probability and Probability Distributions
 Chapter 4. robability and robability Distributions Importance of Knowing robability To know whether a sample is not identical to the population from which it was selected, it is necessary to assess the
Math 202-0 Quizzes Winter 2009
 Quiz : Basic Probability Ten Scrabble tiles are placed in a bag Four of the tiles have the letter printed on them, and there are two tiles each with the letters B, C and D on them (a) Suppose one tile
Review for Test 2. Chapters 4, 5 and 6
 Review for Test 2 Chapters 4, 5 and 6 1. You roll a fair six-sided die. Find the probability of each event: a. Event A: rolling a 3 1/6 b. Event B: rolling a 7 0 c. Event C: rolling a number less than
Biostatistics: DESCRIPTIVE STATISTICS: 2, VARIABILITY
 Biostatistics: DESCRIPTIVE STATISTICS: 2, VARIABILITY 1. Introduction Besides arriving at an appropriate expression of an average or consensus value for observations of a population, it is important to
Section 5-3 Binomial Probability Distributions
 Section 5-3 Binomial Probability Distributions Key Concept This section presents a basic definition of a binomial distribution along with notation, and methods for finding probability values. Binomial
The Math. P (x) = 5! = 1 2 3 4 5 = 120.
 = 5! = 1 2 3 4 5 = 120.") The Math Suppose there are n experiments, and the probability that someone gets the right answer on any given experiment is p. So in the first example above, n = 5 and p = 0.2. Let X be the number of correct
The Math Suppose there are n experiments, and the probability that someone gets the right answer on any given experiment is p. So in the first example above, n = 5 and p = 0.2. Let X be the number of correct
6 PROBABILITY GENERATING FUNCTIONS
 6 PROBABILITY GENERATING FUNCTIONS Certain derivations presented in this course have been somewhat heavy on algebra. For example, determining the expectation of the Binomial distribution (page 5.1 turned
8. THE NORMAL DISTRIBUTION
 8. THE NORMAL DISTRIBUTION The normal distribution with mean μ and variance σ 2 has the following density function: The normal distribution is sometimes called a Gaussian Distribution, after its inventor,
Probability and Statistics Vocabulary List (Definitions for Middle School Teachers)
") Probability and Statistics Vocabulary List (Definitions for Middle School Teachers) B Bar graph a diagram representing the frequency distribution for nominal or discrete data. It consists of a sequence
Probability and Statistics Vocabulary List (Definitions for Middle School Teachers) B Bar graph a diagram representing the frequency distribution for nominal or discrete data. It consists of a sequence
Probability: Terminology and Examples Class 2, 18.05, Spring 2014 Jeremy Orloff and Jonathan Bloom
 Probability: Terminology and Examples Class 2, 18.05, Spring 2014 Jeremy Orloff and Jonathan Bloom 1 Learning Goals 1. Know the definitions of sample space, event and probability function. 2. Be able to
Chapter 5: Discrete Probability Distributions
 Chapter 5: Discrete Probability Distributions Section 5.1: Basics of Probability Distributions As a reminder, a variable or what will be called the random variable from now on, is represented by the letter
Joint Exam 1/P Sample Exam 1
 Joint Exam 1/P Sample Exam 1 Take this practice exam under strict exam conditions: Set a timer for 3 hours; Do not stop the timer for restroom breaks; Do not look at your notes. If you believe a question
CHAPTER 6: Continuous Uniform Distribution: 6.1. Definition: The density function of the continuous random variable X on the interval [A, B] is.
![CHAPTER 6: Continuous Uniform Distribution: 6.1. Definition: The density function of the continuous random variable X on the interval [A, B] is.](/thumbs/40/21160284.jpg "CHAPTER 6: Continuous Uniform Distribution: 6.1. Definition: The density function of the continuous random variable X on the interval [A, B] is.") Some Continuous Probability Distributions CHAPTER 6: Continuous Uniform Distribution: 6. Definition: The density function of the continuous random variable X on the interval [A, B] is B A A x B f(x; A,
Some Continuous Probability Distributions CHAPTER 6: Continuous Uniform Distribution: 6. Definition: The density function of the continuous random variable X on the interval [A, B] is B A A x B f(x; A,
X: 0 1 2 3 4 5 6 7 8 9 Probability: 0.061 0.154 0.228 0.229 0.173 0.094 0.041 0.015 0.004 0.001
 Tuesday, January 17: 6.1 Discrete Random Variables Read 341 344 What is a random variable? Give some examples. What is a probability distribution? What is a discrete random variable? Give some examples.
E3: PROBABILITY AND STATISTICS lecture notes
 E3: PROBABILITY AND STATISTICS lecture notes 2 Contents 1 PROBABILITY THEORY 7 1.1 Experiments and random events............................ 7 1.2 Certain event. Impossible event............................
IEOR 6711: Stochastic Models I Fall 2012, Professor Whitt, Tuesday, September 11 Normal Approximations and the Central Limit Theorem
 IEOR 6711: Stochastic Models I Fall 2012, Professor Whitt, Tuesday, September 11 Normal Approximations and the Central Limit Theorem Time on my hands: Coin tosses. Problem Formulation: Suppose that I have
Chapter 4 & 5 practice set. The actual exam is not multiple choice nor does it contain like questions.
 Chapter 4 & 5 practice set. The actual exam is not multiple choice nor does it contain like questions. MULTIPLE CHOICE. Choose the one alternative that best completes the statement or answers the question.
Lecture 2 Binomial and Poisson Probability Distributions
 Lecture 2 Binomial and Poisson Probability Distributions Binomial Probability Distribution l Consider a situation where there are only two possible outcomes (a Bernoulli trial) H Example: u flipping a
39.2. The Normal Approximation to the Binomial Distribution. Introduction. Prerequisites. Learning Outcomes
 The Normal Approximation to the Binomial Distribution 39.2 Introduction We have already seen that the Poisson distribution can be used to approximate the binomial distribution for large values of n and
AMS 5 CHANCE VARIABILITY
 AMS 5 CHANCE VARIABILITY The Law of Averages When tossing a fair coin the chances of tails and heads are the same: 50% and 50%. So if the coin is tossed a large number of times, the number of heads and
CA200 Quantitative Analysis for Business Decisions. File name: CA200_Section_04A_StatisticsIntroduction
 CA200 Quantitative Analysis for Business Decisions File name: CA200_Section_04A_StatisticsIntroduction Table of Contents 4. Introduction to Statistics... 1 4.1 Overview... 3 4.2 Discrete or continuous
99.37, 99.38, 99.38, 99.39, 99.39, 99.39, 99.39, 99.40, 99.41, 99.42 cm
 Error Analysis and the Gaussian Distribution In experimental science theory lives or dies based on the results of experimental evidence and thus the analysis of this evidence is a critical part of the
Lecture 7: Continuous Random Variables
 Lecture 7: Continuous Random Variables 21 September 2005 1 Our First Continuous Random Variable The back of the lecture hall is roughly 10 meters across. Suppose it were exactly 10 meters, and consider
Random variables P(X = 3) = P(X = 3) = 1 8, P(X = 1) = P(X = 1) = 3 8.
 = P(X = 3) = 1 8, P(X = 1) = P(X = 1) = 3 8.") Random variables Remark on Notations 1. When X is a number chosen uniformly from a data set, What I call P(X = k) is called Freq[k, X] in the courseware. 2. When X is a random variable, what I call F ()
Random variables Remark on Notations 1. When X is a number chosen uniformly from a data set, What I call P(X = k) is called Freq[k, X] in the courseware. 2. When X is a random variable, what I call F ()
Discrete Mathematics and Probability Theory Fall 2009 Satish Rao, David Tse Note 10
 CS 70 Discrete Mathematics and Probability Theory Fall 2009 Satish Rao, David Tse Note 10 Introduction to Discrete Probability Probability theory has its origins in gambling analyzing card games, dice,
Unit 4 The Bernoulli and Binomial Distributions
 PubHlth 540 4. Bernoulli and Binomial Page 1 of 19 Unit 4 The Bernoulli and Binomial Distributions Topic 1. Review What is a Discrete Probability Distribution... 2. Statistical Expectation.. 3. The Population
Means, standard deviations and. and standard errors
 CHAPTER 4 Means, standard deviations and standard errors 4.1 Introduction Change of units 4.2 Mean, median and mode Coefficient of variation 4.3 Measures of variation 4.4 Calculating the mean and standard
Basic Probability Concepts
 page 1 Chapter 1 Basic Probability Concepts 1.1 Sample and Event Spaces 1.1.1 Sample Space A probabilistic (or statistical) experiment has the following characteristics: (a) the set of all possible outcomes
Confidence Intervals for the Difference Between Two Means
 Chapter 47 Confidence Intervals for the Difference Between Two Means Introduction This procedure calculates the sample size necessary to achieve a specified distance from the difference in sample means
THE SELECTION OF RETURNS FOR AUDIT BY THE IRS. John P. Hiniker, Internal Revenue Service
 THE SELECTION OF RETURNS FOR AUDIT BY THE IRS John P. Hiniker, Internal Revenue Service BACKGROUND The Internal Revenue Service, hereafter referred to as the IRS, is responsible for administering the Internal