Lecture 3 The Future of Search and Discovery in Big Data Analytics: Ultrametric Information Spaces
|
|
|
- Annabel Small
- 8 years ago
- Views:
Transcription
1 Lecture 3 The Future of Search and Discovery in Big Data Analytics: Ultrametric Information Spaces Themes 1) Big Data and analytics: the potential for metric (geometric) and ultrametric (topological) analysis. 2) Baire distance, ultrametric and hierarchy, applied to astronomy data. 3) Chemoinformatics application: first, clustering and data analysis through modifying precision of the data; secondly, Baire distance, making use of random projections. 4) Finally, best match (nearest neighbour) searching using heuristics can be seen to be stretching the data in order to be ultrametric. Department of Computer Science Royal Holloway, University of London
 Finally, best match (nearest neighbour) searching using heuristics can be seen to be stretching the data in order to be ultrametric.")
2 - First, agglomerative hierarchical clustering; then: hierarchical encoding of data. - Ultrametric topology, Baire distance. - Clustering of large data sets. Overview - Hierarchical clustering via Baire distance using SDSS spectroscopic data. -Hierarchical clustering via Baire distance using chemical compounds. - Finally, understanding some other approaches to nearest neighbour or best match searching in terms of ultrametric stretching.

3 Comments follow on ultrametrics - distances on a hierarchical tree. Ultrametric topology captures well the idea of novelty, exception, new. We are often interested in hierarchical clustering not just for deriving a partition (of compact clusters) but rather for more general information encapsulated in the hierarchy. Correspondence Analysis is A Tale of Three Metrics - Chi squared metric - appropriate for profiles of frequencies of occurrence - Euclidean metric, for visualization, and for static context - Ultrametric, for hierarchic relations and for dynamic context

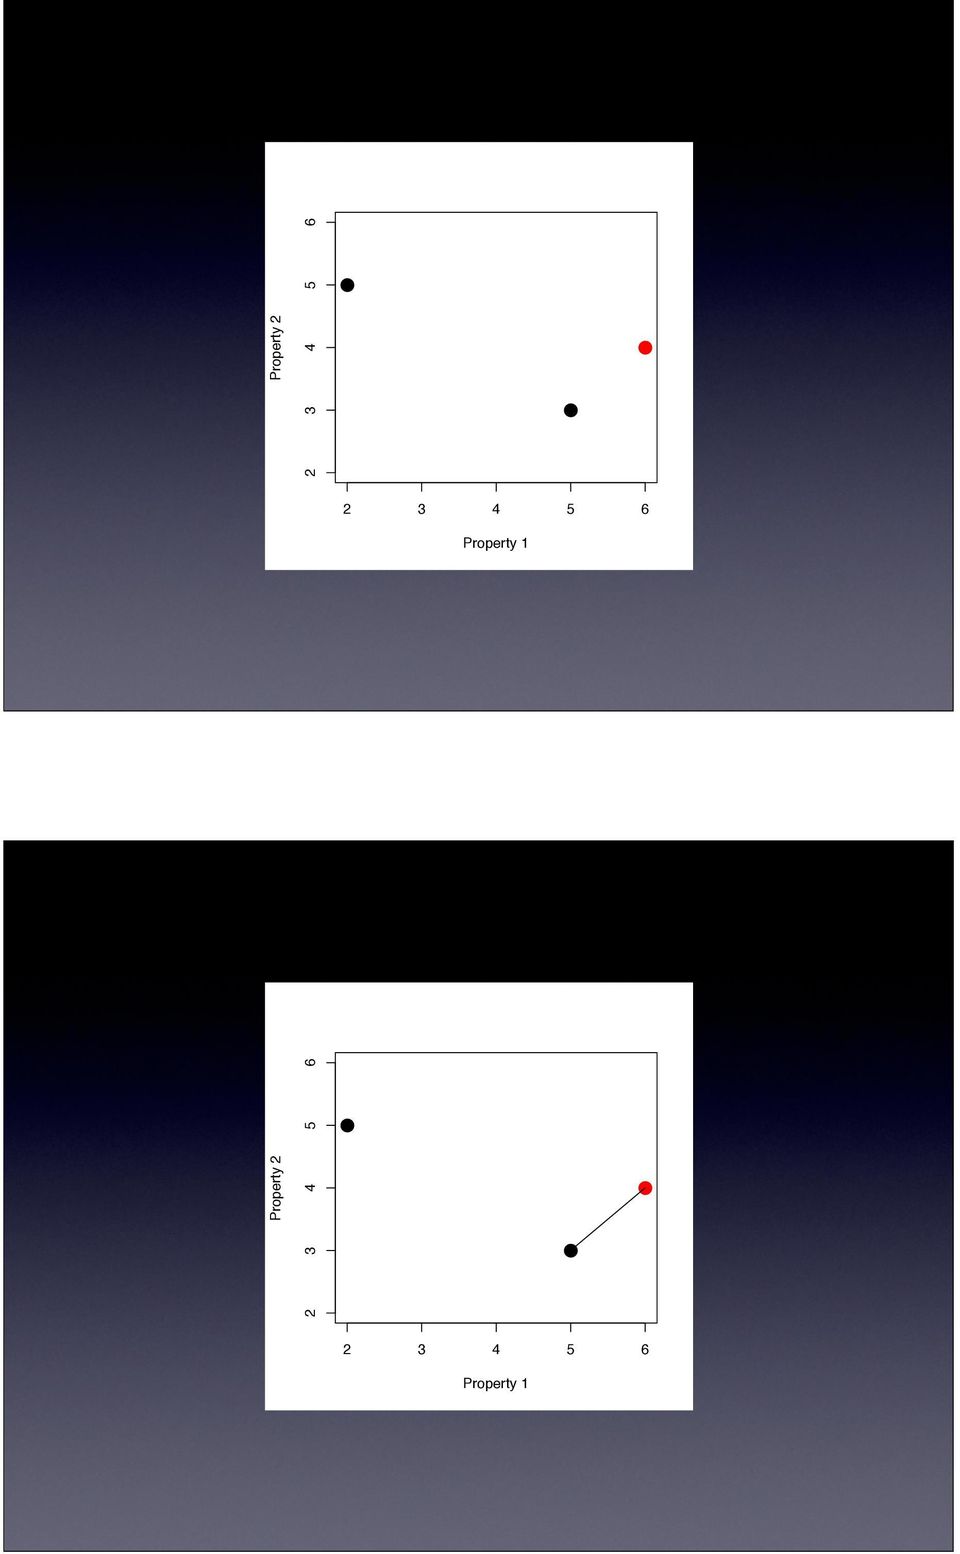
4 Triangular inequality holds for metrics Vertical x y z Example: Euclidean or as the crow flies distance d(x, z) d(x, y)+d(y, z) Horizontal Ultrametric Euclidean distances makes a lot of sense when the population is homogeneous Ultrametric distance makes a lot of sense when the observables are heterogeneous, discontinuous Latter is especially useful for determining: anomalous, atypical, innovative cases

5 Property Property 1 Property Property 1

6 Property Property 1 Property Property 1
7 Property Property 1 Property Property 1

8 Property Property 1 Property Property 1

9 Property Property 1 Property Isosceles triangle: approx equal long sides Property 1

10 Strong triangular inequality, or ultrametric inequality, holds for tree distances d(x, z) Height max{d(x, y),d(y, z)} d(x, z) =3.5 x y z d(x, y) =3.5 d(y, z) =1.0 Closest common ancestor distance is an ultrametric Some Properties of Ultrametrics The distance between two objects -- or two terminals in the tree -- is the lowest rank which dominates them. Lowest or closest common ancestor distance. The ultrametric inequality holds for any 3 points (or terminals): d(i, k) max {d(i,j), d(j,k)} Recall: the triangular inequality is: d(i,k) {d(i,j) + d(j,k)} An ultrametric space is quite special: (i) all triangles are isosceles with small base, or equilateral; (ii) every point in a ball is its center; (iii) the radius of a ball equals the diameter; (iv) a ball is clopen; (v) an ultrametric space is always topologically 0-dimensional. 20
: d(i, k) max {d(i,j), d(j,k)} Recall: the triangular inequality is: d(i,k) {d(i,j) + d(j,k)} An ultrametric space is quite special:")
11 Shown by our measuring of ultrametricity: Pervasive Ultrametricity As dimensionality increases, so does ultrametricity. In very high dimensional spaces, the ultrametricity approaches being 100%. Relative density is important: high dimensional and spatially sparse mean the same in this context. See: F Murtagh, On ultrametricity, data coding, and computation, Journal of Classification, 21, , 2004 Hall, P., Marron, J.S., and Neeman, A., Geometric representation of high dimension low sample size data, JRSS B, 67, , 2005 F. Delon, Espaces ultramétriques, J. Symbolic Logic, 49, , Computational Implications Consider a dendrogram: a rooted, labeled, ranked, binary tree. So: n terminals, n-1 levels. A dendrogram s root-to-terminal path length is log2n for a balanced tree, and n-1 for an imbalanced tree. Call the computational cost of such a traversal O(t) where t is this path length. It holds: 1 O(t) n-1. Adding a new terminal to a dendrogram is carried out in O(t) time. Cost of finding the ultrametric distance between two terminal nodes is twice the length of a traversal from root to terminals in the dendrogram. Therefore distance is computed in O(t) time. Nearest neighbor search in ultrametric space can be carried out in O(1) or constant time. 22

12 Next: the Baire (ultra)metric 23 Baire, or longest common prefix An example of Baire distance for two numbers (x and y) using a precision of 3: x = y = Baire distance between x and y: d B (x, y) = 10 2 Base ( B ) here is 10 (suitable for real values) Precision here = K = 3 That is: k=1 -> Xk = Yk -> 4 k=2 -> Xk = Yk -> 2 k=3 -> Xk Yk -> 5 7
 Precision here = K = 3 That is: k=1 -> Xk = Yk -> 4 k=2 -> Xk = Yk -> 2")
13 On the Baire (ultra)metric - Baire space consists of countable infinite sequences with a metric defined in terms of the longest common prefix [A. Levy. Basic Set Theory, Dover, 1979 (reprinted 2002)] - The longer the common prefix, the closer a pair of sequences. - The Baire distance is an ultrametric distance. It follows that a hierarchy can be used to represent the relationships associated with it. Furthermore the hierarchy can be directly read from a linear scan of the data. (Hence: hierarchical hashing scheme.) - We applied the Baire distance to: chemical compounds, spectrometric and photometric redshifts from the Sloan Digital Sky Survey (SDSS), and various other datasets. Sloan Digital Sky Survey: redshifts (photometric, some spectroscopic) of galaxies, quasars and stars SDSS DR5 Imaging Sky Coverage (Aitoff projection of Equatorial coordinates)

14 SDSS (Sloan Digital Sky Survey) Data - We took a subset of approx. 0.5 million data points from SDSS release 5. - declination (DEC) -right ascension (RA) -spectrometric redshift -photometric redshift -Dec vs RA are shown in the figure Data - example RA DEC spec. redshift phot. redshift

15 Motivation - regress z_spect on z_phot Furthermore: determine good quality mappings of z_spect onto z_phot, and less qood quality mappings I.e., cluster-wise nearest neighbour regression Note: cluster-wise not spatially (RA, Dec) but rather within the data itself Perspective Plots of Digit Distributions On the right we have z_spec where three data peaks can be observed. On the left we have z_phot where only one data peak can be seen.
 but rather within the")
16 Framework for Fast Clusterwise Regression 82.8% of z_spec and z_phot have at least 2 common prefix digits. I.e. numbers of observations sharing 6, 5, 4, 3, 2 decimal digits. We can find very efficiently where these 82.8% of the astronomical objects are. 21.7% of z_spec and z_phot have at least 3 common prefix digits. I.e. numbers of observations sharing 6, 5, 4, 3 decimal digits. We find good consistency vis-à-vis k-means (right panel)
")
17 Next - another case study, using chemoinformatics - which is high dimensional. Since we are using digits of precision in our data (re)coding, how do we handle high dimensions? Baire Distance Applied to Chemical Compounds
coding, how do we handle high dimensions?")
18 Matching of Chemical Structures - Clustering of compounds based on chemical descriptors or chemical representations, in the pharmaceutical industry. - Used for screening large corporate databases. - Chemical warehouses are expanding due to mergers, acquisitions, and the synthetic explosion brought about by combinatorial chemistry. 35 Binary Fingerprints Encode Fixed length bit strings such as Daylight MDL BCI etc. 36

19 Chemoinformatics clustering 1.2 million chemical compounds, each characterized by 1052 boolean presence/absence values. Firstly we show that precision of measurement leads to greater ultrametricity (i.e. the data are more hierarchical). From this we develop an algorithm for finding equivalence classes of specified precision chemicals. We call this: data condensation. Secondly, we use random projections of the dimensional space in order to find the Baire hierarchy. We find that clusters derived from this hierarchy are quite similar to k-means clustering outcomes. 37 Data characteristics: 1.2M chemicals crossed by 1052 presence/absence attributes. Chemicals follow power law with exponent approx Attributes approx. Gaussian. Log log plot: number of chemicals per attribute No. of chemicals (log) No. of attribute (log) Frequency Histogram of presence/absences samples each of 7500 chemicals

20 Dependence of ultrametricity on precision - II We have seen that significant numbers of chemicals are identical (0 distance) Normalize by dividing by column sums: x IJ x J IJ, where I,J are chemical, attribute sets, x J defines column or attribute masses, and we have: x J IJ x J = x IJ We limit the precision of all normalized values in a chemical s 1052-valued vector Then: with very limited precision, we get lots more identical (0 distance) chemicals And we find that local ultrametricity increases with limited precision 39 Dependence of ultrametricity, i.e. data inherently hierarchical, on precision - I 20,000 chemicals, normalized 2000 sampled triangles Ultrametricities for precisions 1,2,3,4,... in all values. Numbers of non-degenerate triangles (out of 2000): precision 1: 2 precision 2: 1062 precision 3: 1999 precision 4: 2000 Ultrametricity (1 = 100%) Digits of precision 40
: precision 1: 2 precision 2: 1062 precision 3: 1999 precision 4: 2000 Ultrametricity (1 = 100%) 0.2 0.4 0.6 0.8 1.")
21 We now exploit what we have just observed - potentially high ultrametricity or inherently hierarchical properties in the data, arrived at through reducing the precision of our data values. We are looking at different sets of digit precision. Implicit here is the Baire distance. 41 Data Condensation through Recoding - I We will look for identical chemicals (in the normalized 1052-valued attribute space). We will also take all attribute values to limited precision, thereby enabling many more chemicals to be identical. As a heuristic to find equivalence classes of identical chemicals, we use a spanning path. Path defined by row (chemical) marginal density. (Also looked at random projections, etc.) We find clusters of identical chemicals. But we may miss some; and we may have separate clusters that should be merged. For data condensation, unimportant. Dominant computational term: for n chemicals, O(n log n) 42 to sort spanning path.
22 Data Condensation through Recoding - II Data set 1: form spanning paths, agglomerate identical, adjacent chemicals; repeat. Numbers of chemicals retained on successive passes: 20000; 8487; 8393; 8372; 8364; Data set 2: 20000; 6969; 6825; 6776; 6757; Similar for further data sets. Processing chemicals (characterized by 1052 normalized attributes) is fast: few minutes in R. 43 Data Condensation through Recoding - III Then remaining 8000-odd chemicals, out of started with (all characterized by the normalized 1052 attributes), are hierarchically clustered using traditional means - using a commodity clustering algorithm. Ward minimum variance method used. 44
23 Data Condensation through Recoding - IV Some comparative results, with no speed-up processing, from Geoff Downs (Digital Chemistry Ltd.) for clustering 15,465 chemical structures x 1052-bit descriptions: Ward 42.5 mins k-means 19.5 mins Divisive k-means 8 mins (4 year old PC used, 2.4MHz, 1Gb RAM, Windows XP SP2) 152,450 chemical structures x 1052-bit descriptions: k-means 22 hrs Divisive k-means 4.5 hrs 45 Data condensation through recoding leads to a hybrid hierarchical clustering algorithm. It implicitly uses the Baire (ultra)metric in the first condensation phase. Now we will approach the same issue of finding clusters at increasing levels of refinement more explicitly, by using the Baire (ultra)metric. 46
24 To handle high dimensional data, like the chemoinformatics data, we will use random projections. 47 Random projection and hashing Random vector In fact random projection here works as a class of hashing function. Hashing is much faster than alternative methods because it avoids the pairwise comparisons required for partitioning and classification. If two points (p, q) are close, they will have a very small p-q (Euclidean metric) value; and they will hash to the same value with high probability; if they are distant, they should collide with small probability.
25 Random projection Is random projection a good method to reduce dimensionality? Here we use different random vector to project the original data matrix. It can be observed in that the shape is kept for the different projections. This implies that different random projections do not affect the resulting clusters. Simple Clustering Hierarchy Sig. dig. k No clusters Results for the three different data sets, each consisting of 7500 chemicals, are shown in immediate succession. The number of significant decimal digits is 4 (more precise, and hence more different clusters found), 3, 2, and 1 (lowest precision in terms of significant digits).
26 Simple Clustering Hierarchy Sig. Dig. No. Clusters No. discrep. No. discrep. cl Comparative evaluation: Results of k-means using as input the cluster centres provided by the 1 sig. dig. Baire approach relating to 7500 chemical structures, with 1052 descriptors. Sig. dig. : number of significant digits used. No. clusters: number of clusters in the data set of 7500 chemical structures, associated with the number of significant digits used in the Baire scheme. Largest cluster : cardinality. No. discrep. : number of discrepancies found in k-means clustering outcome. No. discrep. cl. : number of clusters containing these discrepant assignments. Next: Nearest neighbour or best match searching Using heuristic to make search in a coordinate space more efficient
27 Nearest neighbor finding through bounding: the unifying view of ultrametricity Feasibility bounds relating to nearest neighbors are an old idea (e.g. Fukunaga and Narendra, 1975) Chávez and Navarro (2000, 2003) show how bounds are used: they serve to "stretch the triangular inequality" What happens is: we look for a good approximation to a locally ultrametric configuration. From this we have a small and reliable candidate set of nearest neighbors. K Fukunaga and PM Narendra, A branch and bound algorithm for computing k-nearest neighbors, IEEE Trans. Computers, C-24, , 1975 E Chávez and G Navarro, Probabilistic proximity search: fighting the curse of dimensionality in metric spaces, Information Processing Letters, 85, 39-46, 2003 E Chávez, G Navarro, R Baeza-Yates and JL Marroquín, Proximity searching in metric spaces, ACM Computing Surveys, 33, , Consider points u which we seek to discard when searching for nearest neighbors of query q, and we use pivots, p. Consider the situation of: d(q, u) d(u, p i ) and d(q, u) d(q, p i ) as being of interest. By the triangular inequality: d(u, p i ) d(u, q)+d(q, p i ) and d(q, p i ) d(q, u)+d(u, p i ) This gives the rejection rule: discard all u such that d(u, p i ) d(q, p i ) >r for a threshold r, and for some pivot pi. This gives a bound for the radius around q which could be relevant. This bound is in terms of pre-calculated distances. d(u, p i )=d(q, p i ) If then clearly we have no rejection at all of points u. But if r is small, i.e. d(u, p i ) d(q, p i ) then we have a small and reliable search neighbourhood. The smaller r is, r > 0, so much the better. But we can t allow it to be too small. From the foregoing observations, the triangle formed by {q, u, pi} is approximately isosceles with small base, or equilateral. 54
28 Concluding Remarks - We have a new way of inducing a hierarchy on data - First viewpoint: encode the data hierarchically and essentially read off the clusters - Alternative viewpoint: we can cluster information based on the longest common prefix - We obtain a hierarchy that can be visualized as a tree - We are hashing, in a hierarchical or multiscale way, our data - We are targeting clustering in massive data sets - The Baire method - we find - offers a fast alternative to k-means and a fortiori to traditional agglomerative hierarchical clustering - At issue throughout this work: embedding of our data in an ultrametric topology
Fionn Murtagh, Pedro Contreras International Conference p-adic MATHEMATICAL PHYSICS AND ITS APPLICATIONS. p-adics.2015, September 2015
 Constant Time Search and Retrieval in Big Data, with Linear Time and Space Preprocessing, through Randomly Projected Piling and Sparse Ultrametric Coding Fionn Murtagh, Pedro Contreras International Conference
Towards a New Science of Big Data Analytics, based on the Geometry and Topology of Complex, Hierarchic Systems
 Towards a New Science of Big Data Analytics, based on the Geometry and Topology of Complex, Hierarchic Systems Fionn Murtagh University of Birmingham, 22 Feb 2013 Department of Computer Science Royal Holloway,
The Future of Search and Discovery in Big Data Analytics: Ultrametric Information Spaces
 The Future of Search and Discovery in Big Data Analytics: Ultrametric Information Spaces F. Murtagh (1, 2) and P. Contreras (2, 3) (1) Science Foundation Ireland (2) Thinking Safe Ltd. (3) Computer Learning
DATA MINING CLUSTER ANALYSIS: BASIC CONCEPTS
 DATA MINING CLUSTER ANALYSIS: BASIC CONCEPTS 1 AND ALGORITHMS Chiara Renso KDD-LAB ISTI- CNR, Pisa, Italy WHAT IS CLUSTER ANALYSIS? Finding groups of objects such that the objects in a group will be similar
Clustering. Data Mining. Abraham Otero. Data Mining. Agenda
 Clustering 1/46 Agenda Introduction Distance K-nearest neighbors Hierarchical clustering Quick reference 2/46 1 Introduction It seems logical that in a new situation we should act in a similar way as in
Cluster Analysis: Advanced Concepts
 Cluster Analysis: Advanced Concepts and dalgorithms Dr. Hui Xiong Rutgers University Introduction to Data Mining 08/06/2006 1 Introduction to Data Mining 08/06/2006 1 Outline Prototype-based Fuzzy c-means
Data Mining. Cluster Analysis: Advanced Concepts and Algorithms
 Data Mining Cluster Analysis: Advanced Concepts and Algorithms Tan,Steinbach, Kumar Introduction to Data Mining 4/18/2004 1 More Clustering Methods Prototype-based clustering Density-based clustering Graph-based
Cluster Analysis. Isabel M. Rodrigues. Lisboa, 2014. Instituto Superior Técnico
 Instituto Superior Técnico Lisboa, 2014 Introduction: Cluster analysis What is? Finding groups of objects such that the objects in a group will be similar (or related) to one another and different from
Data Mining Clustering (2) Sheets are based on the those provided by Tan, Steinbach, and Kumar. Introduction to Data Mining
 Sheets are based on the those provided by Tan, Steinbach, and Kumar. Introduction to Data Mining") Data Mining Clustering (2) Toon Calders Sheets are based on the those provided by Tan, Steinbach, and Kumar. Introduction to Data Mining Outline Partitional Clustering Distance-based K-means, K-medoids,
Data Mining Clustering (2) Toon Calders Sheets are based on the those provided by Tan, Steinbach, and Kumar. Introduction to Data Mining Outline Partitional Clustering Distance-based K-means, K-medoids,
Clustering. Adrian Groza. Department of Computer Science Technical University of Cluj-Napoca
 Clustering Adrian Groza Department of Computer Science Technical University of Cluj-Napoca Outline 1 Cluster Analysis What is Datamining? Cluster Analysis 2 K-means 3 Hierarchical Clustering What is Datamining?
Medical Information Management & Mining. You Chen Jan,15, 2013 You.chen@vanderbilt.edu
 Medical Information Management & Mining You Chen Jan,15, 2013 You.chen@vanderbilt.edu 1 Trees Building Materials Trees cannot be used to build a house directly. How can we transform trees to building materials?
Data Mining Cluster Analysis: Basic Concepts and Algorithms. Lecture Notes for Chapter 8. Introduction to Data Mining
 Data Mining Cluster Analysis: Basic Concepts and Algorithms Lecture Notes for Chapter 8 Introduction to Data Mining by Tan, Steinbach, Kumar Tan,Steinbach, Kumar Introduction to Data Mining 4/8/2004 Hierarchical
Neural Networks Lesson 5 - Cluster Analysis
 Neural Networks Lesson 5 - Cluster Analysis Prof. Michele Scarpiniti INFOCOM Dpt. - Sapienza University of Rome http://ispac.ing.uniroma1.it/scarpiniti/index.htm michele.scarpiniti@uniroma1.it Rome, 29
SPECIAL PERTURBATIONS UNCORRELATED TRACK PROCESSING
 AAS 07-228 SPECIAL PERTURBATIONS UNCORRELATED TRACK PROCESSING INTRODUCTION James G. Miller * Two historical uncorrelated track (UCT) processing approaches have been employed using general perturbations
Similarity Search in a Very Large Scale Using Hadoop and HBase
 Similarity Search in a Very Large Scale Using Hadoop and HBase Stanislav Barton, Vlastislav Dohnal, Philippe Rigaux LAMSADE - Universite Paris Dauphine, France Internet Memory Foundation, Paris, France
Data Mining Cluster Analysis: Basic Concepts and Algorithms. Clustering Algorithms. Lecture Notes for Chapter 8. Introduction to Data Mining
 Data Mining Cluster Analsis: Basic Concepts and Algorithms Lecture Notes for Chapter 8 Introduction to Data Mining b Tan, Steinbach, Kumar Clustering Algorithms K-means and its variants Hierarchical clustering
Unsupervised learning: Clustering
 Unsupervised learning: Clustering Salissou Moutari Centre for Statistical Science and Operational Research CenSSOR 17 th September 2013 Unsupervised learning: Clustering 1/52 Outline 1 Introduction What
Statistical Models in Data Mining
 Statistical Models in Data Mining Sargur N. Srihari University at Buffalo The State University of New York Department of Computer Science and Engineering Department of Biostatistics 1 Srihari Flood of
Virtual Landmarks for the Internet
 Virtual Landmarks for the Internet Liying Tang Mark Crovella Boston University Computer Science Internet Distance Matters! Useful for configuring Content delivery networks Peer to peer applications Multiuser
An Introduction to Data Mining. Big Data World. Related Fields and Disciplines. What is Data Mining? 2/12/2015
 An Introduction to Data Mining for Wind Power Management Spring 2015 Big Data World Every minute: Google receives over 4 million search queries Facebook users share almost 2.5 million pieces of content
CSC2420 Fall 2012: Algorithm Design, Analysis and Theory
 CSC2420 Fall 2012: Algorithm Design, Analysis and Theory Allan Borodin November 15, 2012; Lecture 10 1 / 27 Randomized online bipartite matching and the adwords problem. We briefly return to online algorithms
EM Clustering Approach for Multi-Dimensional Analysis of Big Data Set
 EM Clustering Approach for Multi-Dimensional Analysis of Big Data Set Amhmed A. Bhih School of Electrical and Electronic Engineering Princy Johnson School of Electrical and Electronic Engineering Martin
Clustering. Danilo Croce Web Mining & Retrieval a.a. 2015/201 16/03/2016
 Clustering Danilo Croce Web Mining & Retrieval a.a. 2015/201 16/03/2016 1 Supervised learning vs. unsupervised learning Supervised learning: discover patterns in the data that relate data attributes with
There are a number of different methods that can be used to carry out a cluster analysis; these methods can be classified as follows:
 Statistics: Rosie Cornish. 2007. 3.1 Cluster Analysis 1 Introduction This handout is designed to provide only a brief introduction to cluster analysis and how it is done. Books giving further details are
Social Media Mining. Data Mining Essentials
 Introduction Data production rate has been increased dramatically (Big Data) and we are able store much more data than before E.g., purchase data, social media data, mobile phone data Businesses and customers
Unsupervised Data Mining (Clustering)
") Unsupervised Data Mining (Clustering) Javier Béjar KEMLG December 01 Javier Béjar (KEMLG) Unsupervised Data Mining (Clustering) December 01 1 / 51 Introduction Clustering in KDD One of the main tasks in
Unsupervised Data Mining (Clustering) Javier Béjar KEMLG December 01 Javier Béjar (KEMLG) Unsupervised Data Mining (Clustering) December 01 1 / 51 Introduction Clustering in KDD One of the main tasks in
Methodology for Emulating Self Organizing Maps for Visualization of Large Datasets
 Methodology for Emulating Self Organizing Maps for Visualization of Large Datasets Macario O. Cordel II and Arnulfo P. Azcarraga College of Computer Studies *Corresponding Author: macario.cordel@dlsu.edu.ph
Data Mining Cluster Analysis: Basic Concepts and Algorithms. Lecture Notes for Chapter 8. Introduction to Data Mining
 Data Mining Cluster Analysis: Basic Concepts and Algorithms Lecture Notes for Chapter 8 by Tan, Steinbach, Kumar 1 What is Cluster Analysis? Finding groups of objects such that the objects in a group will
Hadoop SNS. renren.com. Saturday, December 3, 11
 Hadoop SNS renren.com Saturday, December 3, 11 2.2 190 40 Saturday, December 3, 11 Saturday, December 3, 11 Saturday, December 3, 11 Saturday, December 3, 11 Saturday, December 3, 11 Saturday, December
Data Mining Cluster Analysis: Advanced Concepts and Algorithms. Lecture Notes for Chapter 9. Introduction to Data Mining
 Data Mining Cluster Analysis: Advanced Concepts and Algorithms Lecture Notes for Chapter 9 Introduction to Data Mining by Tan, Steinbach, Kumar Tan,Steinbach, Kumar Introduction to Data Mining 4/18/2004
MACHINE LEARNING IN HIGH ENERGY PHYSICS
 MACHINE LEARNING IN HIGH ENERGY PHYSICS LECTURE #1 Alex Rogozhnikov, 2015 INTRO NOTES 4 days two lectures, two practice seminars every day this is introductory track to machine learning kaggle competition!
Improving the Performance of Data Mining Models with Data Preparation Using SAS Enterprise Miner Ricardo Galante, SAS Institute Brasil, São Paulo, SP
 Improving the Performance of Data Mining Models with Data Preparation Using SAS Enterprise Miner Ricardo Galante, SAS Institute Brasil, São Paulo, SP ABSTRACT In data mining modelling, data preparation
Echidna: Efficient Clustering of Hierarchical Data for Network Traffic Analysis
 Echidna: Efficient Clustering of Hierarchical Data for Network Traffic Analysis Abdun Mahmood, Christopher Leckie, Parampalli Udaya Department of Computer Science and Software Engineering University of
Visualization of Large Multi-Dimensional Datasets
 ***TITLE*** ASP Conference Series, Vol. ***VOLUME***, ***PUBLICATION YEAR*** ***EDITORS*** Visualization of Large Multi-Dimensional Datasets Joel Welling Department of Statistics, Carnegie Mellon University,
Clustering. 15-381 Artificial Intelligence Henry Lin. Organizing data into clusters such that there is
 Clustering 15-381 Artificial Intelligence Henry Lin Modified from excellent slides of Eamonn Keogh, Ziv Bar-Joseph, and Andrew Moore What is Clustering? Organizing data into clusters such that there is
Recognition. Sanja Fidler CSC420: Intro to Image Understanding 1 / 28
 Recognition Topics that we will try to cover: Indexing for fast retrieval (we still owe this one) History of recognition techniques Object classification Bag-of-words Spatial pyramids Neural Networks Object
. Learn the number of classes and the structure of each class using similarity between unlabeled training patterns
 Outline Part 1: of data clustering Non-Supervised Learning and Clustering : Problem formulation cluster analysis : Taxonomies of Clustering Techniques : Data types and Proximity Measures : Difficulties
15.062 Data Mining: Algorithms and Applications Matrix Math Review
 .6 Data Mining: Algorithms and Applications Matrix Math Review The purpose of this document is to give a brief review of selected linear algebra concepts that will be useful for the course and to develop
Data Preprocessing. Week 2
 Data Preprocessing Week 2 Topics Data Types Data Repositories Data Preprocessing Present homework assignment #1 Team Homework Assignment #2 Read pp. 227 240, pp. 250 250, and pp. 259 263 the text book.
Data Mining and Visualization
 Data Mining and Visualization Jeremy Walton NAG Ltd, Oxford Overview Data mining components Functionality Example application Quality control Visualization Use of 3D Example application Market research
Categorical Data Visualization and Clustering Using Subjective Factors
 Categorical Data Visualization and Clustering Using Subjective Factors Chia-Hui Chang and Zhi-Kai Ding Department of Computer Science and Information Engineering, National Central University, Chung-Li,
Asking Hard Graph Questions. Paul Burkhardt. February 3, 2014
 Beyond Watson: Predictive Analytics and Big Data U.S. National Security Agency Research Directorate - R6 Technical Report February 3, 2014 300 years before Watson there was Euler! The first (Jeopardy!)
The Scientific Data Mining Process
 Chapter 4 The Scientific Data Mining Process When I use a word, Humpty Dumpty said, in rather a scornful tone, it means just what I choose it to mean neither more nor less. Lewis Carroll [87, p. 214] In
Decision Support System Methodology Using a Visual Approach for Cluster Analysis Problems
 Decision Support System Methodology Using a Visual Approach for Cluster Analysis Problems Ran M. Bittmann School of Business Administration Ph.D. Thesis Submitted to the Senate of Bar-Ilan University Ramat-Gan,
FAST APPROXIMATE NEAREST NEIGHBORS WITH AUTOMATIC ALGORITHM CONFIGURATION
 FAST APPROXIMATE NEAREST NEIGHBORS WITH AUTOMATIC ALGORITHM CONFIGURATION Marius Muja, David G. Lowe Computer Science Department, University of British Columbia, Vancouver, B.C., Canada mariusm@cs.ubc.ca,
ARTIFICIAL INTELLIGENCE (CSCU9YE) LECTURE 6: MACHINE LEARNING 2: UNSUPERVISED LEARNING (CLUSTERING)
 LECTURE 6: MACHINE LEARNING 2: UNSUPERVISED LEARNING (CLUSTERING)") ARTIFICIAL INTELLIGENCE (CSCU9YE) LECTURE 6: MACHINE LEARNING 2: UNSUPERVISED LEARNING (CLUSTERING) Gabriela Ochoa http://www.cs.stir.ac.uk/~goc/ OUTLINE Preliminaries Classification and Clustering Applications
ARTIFICIAL INTELLIGENCE (CSCU9YE) LECTURE 6: MACHINE LEARNING 2: UNSUPERVISED LEARNING (CLUSTERING) Gabriela Ochoa http://www.cs.stir.ac.uk/~goc/ OUTLINE Preliminaries Classification and Clustering Applications
Nimble Algorithms for Cloud Computing. Ravi Kannan, Santosh Vempala and David Woodruff
 Nimble Algorithms for Cloud Computing Ravi Kannan, Santosh Vempala and David Woodruff Cloud computing Data is distributed arbitrarily on many servers Parallel algorithms: time Streaming algorithms: sublinear
Clustering. Chapter 7. 7.1 Introduction to Clustering Techniques. 7.1.1 Points, Spaces, and Distances
 240 Chapter 7 Clustering Clustering is the process of examining a collection of points, and grouping the points into clusters according to some distance measure. The goal is that points in the same cluster
Protein Protein Interaction Networks
 Functional Pattern Mining from Genome Scale Protein Protein Interaction Networks Young-Rae Cho, Ph.D. Assistant Professor Department of Computer Science Baylor University it My Definition of Bioinformatics
Fast Matching of Binary Features
 Fast Matching of Binary Features Marius Muja and David G. Lowe Laboratory for Computational Intelligence University of British Columbia, Vancouver, Canada {mariusm,lowe}@cs.ubc.ca Abstract There has been
Data Mining Cluster Analysis: Basic Concepts and Algorithms. Lecture Notes for Chapter 8. Introduction to Data Mining
 Data Mining Cluster Analsis: Basic Concepts and Algorithms Lecture Notes for Chapter 8 Introduction to Data Mining b Tan, Steinbach, Kumar Tan,Steinbach, Kumar Introduction to Data Mining /8/ What is Cluster
Chapter 7. Cluster Analysis
 Chapter 7. Cluster Analysis. What is Cluster Analysis?. A Categorization of Major Clustering Methods. Partitioning Methods. Hierarchical Methods 5. Density-Based Methods 6. Grid-Based Methods 7. Model-Based
Cluster Analysis using R
 Cluster analysis or clustering is the task of assigning a set of objects into groups (called clusters) so that the objects in the same cluster are more similar (in some sense or another) to each other
Well-Separated Pair Decomposition for the Unit-disk Graph Metric and its Applications
 Well-Separated Pair Decomposition for the Unit-disk Graph Metric and its Applications Jie Gao Department of Computer Science Stanford University Joint work with Li Zhang Systems Research Center Hewlett-Packard
Subgraph Patterns: Network Motifs and Graphlets. Pedro Ribeiro
 Subgraph Patterns: Network Motifs and Graphlets Pedro Ribeiro Analyzing Complex Networks We have been talking about extracting information from networks Some possible tasks: General Patterns Ex: scale-free,
Data Mining and Knowledge Discovery in Databases (KDD) State of the Art. Prof. Dr. T. Nouri Computer Science Department FHNW Switzerland
 State of the Art. Prof. Dr. T. Nouri Computer Science Department FHNW Switzerland") Data Mining and Knowledge Discovery in Databases (KDD) State of the Art Prof. Dr. T. Nouri Computer Science Department FHNW Switzerland 1 Conference overview 1. Overview of KDD and data mining 2. Data
Data Mining and Knowledge Discovery in Databases (KDD) State of the Art Prof. Dr. T. Nouri Computer Science Department FHNW Switzerland 1 Conference overview 1. Overview of KDD and data mining 2. Data
Fingerprint-Based Virtual Screening Using Multiple Bioactive Reference Structures
 Fingerprint-Based Virtual Screening Using Multiple Bioactive Reference Structures Jérôme Hert, Peter Willett and David J. Wilton (University of Sheffield, Sheffield, UK) Pierre Acklin, Kamal Azzaoui, Edgar
Voronoi Treemaps in D3
 Voronoi Treemaps in D3 Peter Henry University of Washington phenry@gmail.com Paul Vines University of Washington paul.l.vines@gmail.com ABSTRACT Voronoi treemaps are an alternative to traditional rectangular
Vector storage and access; algorithms in GIS. This is lecture 6
 Vector storage and access; algorithms in GIS This is lecture 6 Vector data storage and access Vectors are built from points, line and areas. (x,y) Surface: (x,y,z) Vector data access Access to vector
Chapter ML:XI (continued)
") Chapter ML:XI (continued) XI. Cluster Analysis Data Mining Overview Cluster Analysis Basics Hierarchical Cluster Analysis Iterative Cluster Analysis Density-Based Cluster Analysis Cluster Evaluation Constrained
Chapter ML:XI (continued) XI. Cluster Analysis Data Mining Overview Cluster Analysis Basics Hierarchical Cluster Analysis Iterative Cluster Analysis Density-Based Cluster Analysis Cluster Evaluation Constrained
Data Mining Cluster Analysis: Advanced Concepts and Algorithms. Lecture Notes for Chapter 9. Introduction to Data Mining
 Data Mining Cluster Analysis: Advanced Concepts and Algorithms Lecture Notes for Chapter 9 Introduction to Data Mining by Tan, Steinbach, Kumar Tan,Steinbach, Kumar Introduction to Data Mining 4/18/2004
Clustering Very Large Data Sets with Principal Direction Divisive Partitioning
 Clustering Very Large Data Sets with Principal Direction Divisive Partitioning David Littau 1 and Daniel Boley 2 1 University of Minnesota, Minneapolis MN 55455 littau@cs.umn.edu 2 University of Minnesota,
Big Data Analytics CSCI 4030
 High dim. data Graph data Infinite data Machine learning Apps Locality sensitive hashing PageRank, SimRank Filtering data streams SVM Recommen der systems Clustering Community Detection Web advertising
Approximation Algorithms
 Approximation Algorithms or: How I Learned to Stop Worrying and Deal with NP-Completeness Ong Jit Sheng, Jonathan (A0073924B) March, 2012 Overview Key Results (I) General techniques: Greedy algorithms
Hierarchical Data Visualization
 Hierarchical Data Visualization 1 Hierarchical Data Hierarchical data emphasize the subordinate or membership relations between data items. Organizational Chart Classifications / Taxonomies (Species and
Analysis of Algorithms I: Binary Search Trees
 Analysis of Algorithms I: Binary Search Trees Xi Chen Columbia University Hash table: A data structure that maintains a subset of keys from a universe set U = {0, 1,..., p 1} and supports all three dictionary
Data Warehousing und Data Mining
 Data Warehousing und Data Mining Multidimensionale Indexstrukturen Ulf Leser Wissensmanagement in der Bioinformatik Content of this Lecture Multidimensional Indexing Grid-Files Kd-trees Ulf Leser: Data
Steven M. Ho!and. Department of Geology, University of Georgia, Athens, GA 30602-2501
 CLUSTER ANALYSIS Steven M. Ho!and Department of Geology, University of Georgia, Athens, GA 30602-2501 January 2006 Introduction Cluster analysis includes a broad suite of techniques designed to find groups
How To Cluster
 Data Clustering Dec 2nd, 2013 Kyrylo Bessonov Talk outline Introduction to clustering Types of clustering Supervised Unsupervised Similarity measures Main clustering algorithms k-means Hierarchical Main
An Order-Invariant Time Series Distance Measure [Position on Recent Developments in Time Series Analysis]
![An Order-Invariant Time Series Distance Measure [Position on Recent Developments in Time Series Analysis]](/thumbs/28/12697960.jpg "An Order-Invariant Time Series Distance Measure [Position on Recent Developments in Time Series Analysis]") An Order-Invariant Time Series Distance Measure [Position on Recent Developments in Time Series Analysis] Stephan Spiegel and Sahin Albayrak DAI-Lab, Technische Universität Berlin, Ernst-Reuter-Platz 7,
An Order-Invariant Time Series Distance Measure [Position on Recent Developments in Time Series Analysis] Stephan Spiegel and Sahin Albayrak DAI-Lab, Technische Universität Berlin, Ernst-Reuter-Platz 7,
Topological Data Analysis Applications to Computer Vision
 Topological Data Analysis Applications to Computer Vision Vitaliy Kurlin, http://kurlin.org Microsoft Research Cambridge and Durham University, UK Topological Data Analysis quantifies topological structures
Classifying Large Data Sets Using SVMs with Hierarchical Clusters. Presented by :Limou Wang
 Classifying Large Data Sets Using SVMs with Hierarchical Clusters Presented by :Limou Wang Overview SVM Overview Motivation Hierarchical micro-clustering algorithm Clustering-Based SVM (CB-SVM) Experimental
Information Retrieval and Web Search Engines
 Information Retrieval and Web Search Engines Lecture 7: Document Clustering December 10 th, 2013 Wolf-Tilo Balke and Kinda El Maarry Institut für Informationssysteme Technische Universität Braunschweig
Support Vector Machines with Clustering for Training with Very Large Datasets
 Support Vector Machines with Clustering for Training with Very Large Datasets Theodoros Evgeniou Technology Management INSEAD Bd de Constance, Fontainebleau 77300, France theodoros.evgeniou@insead.fr Massimiliano
High-dimensional labeled data analysis with Gabriel graphs
 High-dimensional labeled data analysis with Gabriel graphs Michaël Aupetit CEA - DAM Département Analyse Surveillance Environnement BP 12-91680 - Bruyères-Le-Châtel, France Abstract. We propose the use
Character Image Patterns as Big Data
 22 International Conference on Frontiers in Handwriting Recognition Character Image Patterns as Big Data Seiichi Uchida, Ryosuke Ishida, Akira Yoshida, Wenjie Cai, Yaokai Feng Kyushu University, Fukuoka,
Modelling, Extraction and Description of Intrinsic Cues of High Resolution Satellite Images: Independent Component Analysis based approaches
 Modelling, Extraction and Description of Intrinsic Cues of High Resolution Satellite Images: Independent Component Analysis based approaches PhD Thesis by Payam Birjandi Director: Prof. Mihai Datcu Problematic
Network (Tree) Topology Inference Based on Prüfer Sequence
 Topology Inference Based on Prüfer Sequence") Network (Tree) Topology Inference Based on Prüfer Sequence C. Vanniarajan and Kamala Krithivasan Department of Computer Science and Engineering Indian Institute of Technology Madras Chennai 600036 vanniarajanc@hcl.in,
Network (Tree) Topology Inference Based on Prüfer Sequence C. Vanniarajan and Kamala Krithivasan Department of Computer Science and Engineering Indian Institute of Technology Madras Chennai 600036 vanniarajanc@hcl.in,
Distributed Dynamic Load Balancing for Iterative-Stencil Applications
 Distributed Dynamic Load Balancing for Iterative-Stencil Applications G. Dethier 1, P. Marchot 2 and P.A. de Marneffe 1 1 EECS Department, University of Liege, Belgium 2 Chemical Engineering Department,
Data Exploration Data Visualization
 Data Exploration Data Visualization What is data exploration? A preliminary exploration of the data to better understand its characteristics. Key motivations of data exploration include Helping to select
Galaxy Morphological Classification
 Galaxy Morphological Classification Jordan Duprey and James Kolano Abstract To solve the issue of galaxy morphological classification according to a classification scheme modelled off of the Hubble Sequence,
Social Media Mining. Graph Essentials
 Graph Essentials Graph Basics Measures Graph and Essentials Metrics 2 2 Nodes and Edges A network is a graph nodes, actors, or vertices (plural of vertex) Connections, edges or ties Edge Node Measures
BIRCH: An Efficient Data Clustering Method For Very Large Databases
 BIRCH: An Efficient Data Clustering Method For Very Large Databases Tian Zhang, Raghu Ramakrishnan, Miron Livny CPSC 504 Presenter: Discussion Leader: Sophia (Xueyao) Liang HelenJr, Birches. Online Image.
Data Mining Analytics for Business Intelligence and Decision Support
 Data Mining Analytics for Business Intelligence and Decision Support Chid Apte, T.J. Watson Research Center, IBM Research Division Knowledge Discovery and Data Mining (KDD) techniques are used for analyzing
9. Text & Documents. Visualizing and Searching Documents. Dr. Thorsten Büring, 20. Dezember 2007, Vorlesung Wintersemester 2007/08
 9. Text & Documents Visualizing and Searching Documents Dr. Thorsten Büring, 20. Dezember 2007, Vorlesung Wintersemester 2007/08 Slide 1 / 37 Outline Characteristics of text data Detecting patterns SeeSoft
Offline sorting buffers on Line
 Offline sorting buffers on Line Rohit Khandekar 1 and Vinayaka Pandit 2 1 University of Waterloo, ON, Canada. email: rkhandekar@gmail.com 2 IBM India Research Lab, New Delhi. email: pvinayak@in.ibm.com
Machine Learning using MapReduce
 Machine Learning using MapReduce What is Machine Learning Machine learning is a subfield of artificial intelligence concerned with techniques that allow computers to improve their outputs based on previous
Standardization and Its Effects on K-Means Clustering Algorithm
 Research Journal of Applied Sciences, Engineering and Technology 6(7): 399-3303, 03 ISSN: 040-7459; e-issn: 040-7467 Maxwell Scientific Organization, 03 Submitted: January 3, 03 Accepted: February 5, 03
Load balancing in a heterogeneous computer system by self-organizing Kohonen network
 Bull. Nov. Comp. Center, Comp. Science, 25 (2006), 69 74 c 2006 NCC Publisher Load balancing in a heterogeneous computer system by self-organizing Kohonen network Mikhail S. Tarkov, Yakov S. Bezrukov Abstract.
A comparison of various clustering methods and algorithms in data mining
 Volume :2, Issue :5, 32-36 May 2015 www.allsubjectjournal.com e-issn: 2349-4182 p-issn: 2349-5979 Impact Factor: 3.762 R.Tamilselvi B.Sivasakthi R.Kavitha Assistant Professor A comparison of various clustering
Lecture 4 Online and streaming algorithms for clustering
 CSE 291: Geometric algorithms Spring 2013 Lecture 4 Online and streaming algorithms for clustering 4.1 On-line k-clustering To the extent that clustering takes place in the brain, it happens in an on-line
Unsupervised Learning and Data Mining. Unsupervised Learning and Data Mining. Clustering. Supervised Learning. Supervised Learning
 Unsupervised Learning and Data Mining Unsupervised Learning and Data Mining Clustering Decision trees Artificial neural nets K-nearest neighbor Support vectors Linear regression Logistic regression...
0.1 What is Cluster Analysis?
 Cluster Analysis 1 2 0.1 What is Cluster Analysis? Cluster analysis is concerned with forming groups of similar objects based on several measurements of different kinds made on the objects. The key idea
Search Taxonomy. Web Search. Search Engine Optimization. Information Retrieval
 Information Retrieval INFO 4300 / CS 4300! Retrieval models Older models» Boolean retrieval» Vector Space model Probabilistic Models» BM25» Language models Web search» Learning to Rank Search Taxonomy!
SoSe 2014: M-TANI: Big Data Analytics
 SoSe 2014: M-TANI: Big Data Analytics Lecture 4 21/05/2014 Sead Izberovic Dr. Nikolaos Korfiatis Agenda Recap from the previous session Clustering Introduction Distance mesures Hierarchical Clustering
LABEL PROPAGATION ON GRAPHS. SEMI-SUPERVISED LEARNING. ----Changsheng Liu 10-30-2014
 LABEL PROPAGATION ON GRAPHS. SEMI-SUPERVISED LEARNING ----Changsheng Liu 10-30-2014 Agenda Semi Supervised Learning Topics in Semi Supervised Learning Label Propagation Local and global consistency Graph
Detecting Network Anomalies. Anant Shah
 Detecting Network Anomalies using Traffic Modeling Anant Shah Anomaly Detection Anomalies are deviations from established behavior In most cases anomalies are indications of problems The science of extracting
Classification - Examples
 Lecture 2 Scheduling 1 Classification - Examples 1 r j C max given: n jobs with processing times p 1,...,p n and release dates r 1,...,r n jobs have to be scheduled without preemption on one machine taking
Classification algorithm in Data mining: An Overview
 Classification algorithm in Data mining: An Overview S.Neelamegam #1, Dr.E.Ramaraj *2 #1 M.phil Scholar, Department of Computer Science and Engineering, Alagappa University, Karaikudi. *2 Professor, Department
Clustering UE 141 Spring 2013
 Clustering UE 141 Spring 013 Jing Gao SUNY Buffalo 1 Definition of Clustering Finding groups of obects such that the obects in a group will be similar (or related) to one another and different from (or