Special Eurobarometer 438. Summary. E-Communications and the Digital Single Market
|
|
|
- Ophelia Shelton
- 7 years ago
- Views:
Transcription
1 E-Communications and the Digital Single Market Survey requested by the European Commission, Directorate-General for Communications Networks, Content & Technology and co-ordinated by the Directorate-General for Communication This document does not represent the point of view of the European Commission. The interpretations and opinions contained in it are solely those of the authors. Fieldwork Publication May 2016 Wave EB84.2 TNS opinion & social
2 E-Communications and the Digital Single Market Survey conducted by TNS political & social at the request of the European Commission, Directorate General for Communications Networks, Content & Technology Survey co-ordinated by the European Commission, Directorate-General for Communication (DG COMM Strategy, Corporate Communication Actions and Eurobarometer Unit)
3 Project title - E-Communications and the Digital Single Market Linguistic version EN Catalogue number KK EN-N ISBN doi: / European Union,
4 TABLE OF CONTENTS INTRODUCTION 2 I. SNAPSHOTS AND MAIN FINDINGS 5 II. USE OF COMMUNICATION SERVICES 11 1 Experience of using different communication services 11 2 Most important communication services 15 3 Use of paid services over the Internet 16 III. TELEPHONE ACCESS 17 1 Overall telephone access 17 2 Fixed telephony 18 3 Mobile telephony 19 IV. INTERNET ACCESS 20 1 Internet access in households 20 2 Mobile Internet access in households 21 V. TELEVISION ACCESS 23 VI. SERVICE PACKAGES 24 VII. PURCHASING AND SWITCHING SERVICES 26 VIII. CONSUMER PROTECTION AND COMMUNICATION SERVICES 28 1 Consumer protection when using digital services 28 2 Keeping telephone numbers and addresses when switching provider 29 3 Ease of controlling and monitoring communication services 30 IX. COMMUNICATION SERVICE CONTRACTS 31 1 Experience of signing a contract in the last three years 31 2 Longer Internet contract in exchange for much higher speed and enhanced quality 32 X. KNOWLEDGE OF THE EUROPEAN EMERGENCY NUMBER Calling the emergency number in one s own country 33 2 Calling the emergency number anywhere in the EU 33 ANNEXES Technical specifications 1
5 INTRODUCTION The digital communications landscape in Europe continues to evolve at a rapid pace, driven by ongoing technological change and market developments. In order to monitor market trends and new usages, The European Commission's Directorate General for Communications Networks, Content & Technology regularly conducts opinion surveys on the topic of electronic communications. These surveys also provide an assessment of how EU citizens and households derive benefits from their competitive and innovative digital environment. The Commission recognises the opportunities offered by digital technologies, and particularly those in the communications sphere. A single connected digital market across Europe could deliver more than 415 billion per year to the EU economy, creating jobs and new sources of employment, as well as boosting growth, competition, investment and innovation. A single digital market could also create opportunities for innovative start-ups, and allow existing companies to grow and profit within a market of over 500 million people. Working to deliver a Digital Single Market (DSM) is a key objective for the Commission 1. In order for citizens, businesses and public administrations to take advantage of all the opportunities offered by a digital single market, Europe must have well-functioning markets that deliver access to secure and reliable high performance fixed and wireless broadband infrastructures. To facilitate this, in 2016 the Commission will adopt legislative proposals for the review of the regulatory framework for electronic communications, in order to ensure that EU rules are fit for purpose in a fast evolving technological and market environment. This Eurobarometer helps the Commission to better understand the attitude of EU citizens towards new Internet-based communications services, and to measure the related expectations and needs for consumer protection. This year s edition of the report focusses on citizen s use of new and innovative services, such as mobile Internet, instant messaging and social media, along with traditional communications services such as fixed telephony, and the more established mobile telephony and SMS. A second theme for the current edition is contracts and consumer protection. The proportion of consumers that read telecommunications contracts, as well as their satisfaction with the information they contain will be assessed in this report. Citizens opinions about the kinds of protections newer digital communication services should attract will also be explored. Other key areas investigated in the report include: Mobile and fixed telephone access Fixed and mobile Internet access Means of access to television Penetration of communications bundles Selection criteria when choosing an Internet provider Ease of comparing bundles and ease of switching providers Awareness of the single European emergency service number 112 This survey follows on from those carried out in January , February/March , December , February/March , November/December , November/December , November/December , and December 2005/January
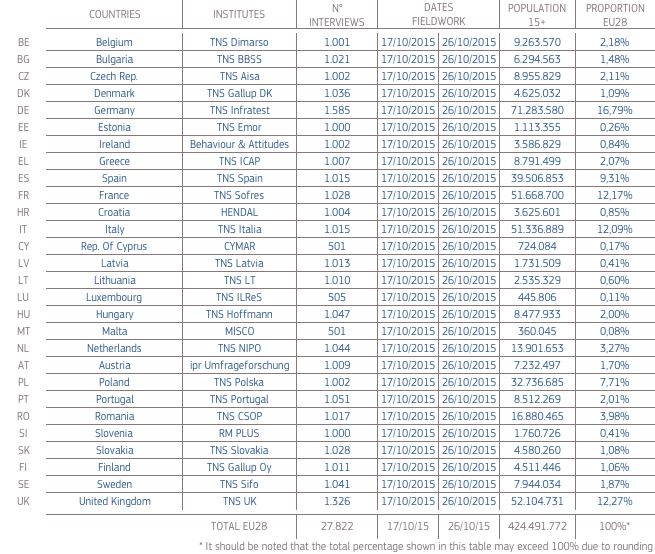
6 The results reported cover all 28 Member States, and where possible, comparisons are made with previous surveys. The data have been weighted on individuals over 15 years of age or EU households, depending on the nature of the question. Indicators, such as telephone and Internet access are presented at household level whereas opinion questions are based on individuals and have been made representative of the individuals over 15 years of age. This survey was carried out by the TNS Opinion & Social network in the 28 Member States of the European Union between 17 and ,822 EU citizens from different social and demographic categories were interviewed face-to-face at home in their native language on behalf of the Directorate-General for Communications Networks, Content & Technology. The methodology used is that of Eurobarometer surveys as carried out by the Directorate-General for Communication ( Strategy, Corporate Communication Actions and Eurobarometer Unit). A technical note on the manner in which the interviews were conducted by the institutes within the TNS Opinion & Social network is included in an appendix to this report. Also included are the interview methods and the confidence intervals
7 Note: In this report, countries are referred to by their official abbreviation. The abbreviations used in this report correspond to: Belgium BE Lithuania LT Bulgaria BG Luxembourg LU Czech Republic CZ Hungary HU Denmark DK Malta MT Germany DE The Netherlands NL Estonia EE Austria AT Ireland IE Poland PL Greece EL Portugal PT Spain ES Romania RO France FR Slovenia SI Croatia HR Slovakia SK Italy IT Finland FI Republic of Cyprus CY * Sweden SE Latvia LV United Kingdom UK European Union weighted average for the 28 Member States EU28 BE, IT, FR, DE, LU, NL, DK, UK, IE, PT, ES, EL, AT, SE, FI EU15 ** BG, CZ, EE, HR, CY, LT, LV, MT, HU, PL, RO, SI, SK NMS13 *** * Cyprus as a whole is one of the 28 European Union Member States. However, the acquis communautaire has been suspended in the part of the country which is not controlled by the government of the Republic of Cyprus. For practical reasons, only the interviews carried out in the part of the country controlled by the government of the Republic of Cyprus are included in the CY category and in the EU28 average. ** EU15 refers to the 15 countries forming the European Union before the enlargements of 2004 and *** The NMS13 are the 13 new Member States which joined the European Union during the 2004, 2007 and 2013 enlargements. We wish to thank the people throughout the European Union who have given their time to take part in this survey. Without their active participation, this study would not have been possible. 4
8 I. SNAPSHOTS AND MAIN FINDINGS *Question on mobile telephone access at household level (QA1.1) was not asked in survey EB79.1 ** Computing device includes desk computer, laptop, tablet, and smartphone in the current and previous survey. This item was described as "personal computer" in the previous surveys. 5
9 Mobile phone calls are the dominant communication service in Europe and mobiles are the most important service for the majority. More than nine out of ten respondents (93%) make or receive mobile phone calls, while 75% send or receive SMS. Almost seven out of ten (69%) send s, while 67% make or receive landline calls. Over half use an Internet messaging service (53%). Across the EU 62% make or receive mobile calls several times a day, and at least 60% in every Member State uses a mobile daily for calls. Making or receiving mobile phone calls, and sending and receiving SMS messages are in the top three communications activities for all age groups. There seems to be generational gap in the use of new and more established communications services. Older respondents, and in particular those aged 55+ are less likely to have embraced the use of new services such as Internet telephony and instant messaging. They are also less likely to use some of the more established services such as and even mobile telephony. This generational gap is also quite significant in the use of social networks, with an EU average of 44% for the year old respondents posting daily on social networks against 18% for year old and just 5% of those aged 55+. Even more striking is the fact that there is more difference between EU countries in the use of social networks for all ages groups than between EU countries for the group year old. This suggests that the digital single market is less fragmented among young people in the EU when it comes to the use of social networks. Mobile telephony is by far the most important communication service in respondent s daily life (74%), followed by mobile Internet (34%) and fixed telephony (32%). At least two thirds of respondents in every Member State say mobile telephony is the most important service. Moreover, Internet connections (52%) and online communication services (46%) are the most important services in the daily life of around half of Europeans. There is also a generational gap in perception of the most important services in respondents daily lives, with the youngest respondents (aged 15-24) far more likely to mention online communications services as the most important than those aged 55+ (66% vs. 26%). There is also a clear age divide on the importance given to mobile Internet: 62% of vs. only 12% of 55+. Almost one third (32%) of those with Internet access have used at least one paid service online, with music (14%) or movie and documentary services (12%) being the most common. There are significant country differences in the use of paid services, ranging from 69% of users in Sweden to 14% in Lithuania. There is a pronounced generational gap between the youngest and oldest respondents in the use of paid online music services (25% vs. 4%) and paid movie/documentary services (20% vs. 5%). 6
10 Mobile Internet access continues to increase significantly. Telephone access is almost universal (98%), with 59% living in households with fixed and mobile access and 33% living in mobile only households. The proportion of mobile only households continues to increase up 15 percentage points since December 2005/January 2006 (18%). Respondents aged 29 or younger living in single person households (58%) are more likely than those aged (42%) or 60+ (23%) to only have mobile phone access. Almost two thirds of households (65%) have fixed line telephone access. This figure masks a wide discrepancy across Member States: 93% of households in Malta have fixed line access, compared to 13% in Finland and 14% in the Czech Republic. However, no more than 10% in all Member States, except Greece (17%), only have fixed line telephone access. 93% of European households have mobile access via at least one mobile telephone, and at least 88% in every Member State has mobile access. Just over two thirds of households have internet access at home (67%), but penetration in individual Member States varies widely from 41% in Italy to 96% in the Netherlands. At the EU level, household Internet penetration has increased by 10 points since However, it is worth noting the decline of Internet access at home observed in ten Member States since This decrease relatively small in most countries can be explained partly by the overall rise of mobile Internet access. Mobile Internet access has increased significantly since the last survey up 23 points to 75% of households with mobile phone access. Overall, this means that in 69% of the EU households have at least one of its members with Internet access on their mobile. Mobile Internet access has also increased in every Member State, and the proportion of households with mobile Internet access now ranges from 91% in Denmark (up 16 points since 2014) to 64% in Greece (up 35 points). Almost all EU households have access to television (96%), with digital terrestrial television (38%), satellite (24%) and digital cable (20%) the most common means of reception - although TV access through the telephone network is growing (up 5 points since 2014 to 12%). At a country level access to digital terrestrial television ranges from 90% in Spain to 5% in Slovenia. It is important to note that in spite of the constant growth of Internet access, telephony services (fixed and mobile) remain the most important in respondents daily life: almost nine in ten Europeans (89%) consider fixed or mobile telephony the most important, in comparison with slightly over a half of Europeans (52%) who consider fixed or mobile Internet the most important. 7
11 Half of all households have bundled communications services The purchase of bundled communications services continues to increase up from 38% in 2009 to 50% in the current survey. Bundles that include Internet access are most common (80%, -11 points), followed by those with fixed telephony (65%, -15 points), television channels (53%, -1 point) and mobile telephony (45%, +16 points). This sharp increase of mobile uptake in bundles is a good indicator of the fixed-mobile convergence trend in the market place. Indeed, now 25% of EU households have a bundle including a mobile phone which represents an increase of 10 points since Bundles that include two services (double play) are more common than in 2014 (+6 points to 31%), while triple play bundles are less common (down three points to 13%). Just 5% have quadruple play bundles. It is worth noting that the majority of households with Internet access (60%) have included Internet access as part of a bundle. Price remains the main factor when subscribing to an Internet connection (69%), followed by the maximum download or upload speed (48%) and the maximum amount of data that can be downloaded or uploaded (32%). Overall, cost related criteria are the most important (79%), followed by quality related criteria (70%) and service related criteria (51%). Quality-related factors are becoming more important when subscribing to an Internet connection: the maximum download or upload speed (+7 points), and amount of data that can be downloaded or uploaded (+6 points) are now more mentioned than they were in January In 23 Member States, cost-related criteria are the most important factors when subscribing to an Internet service. In Austria, Germany, Estonia and Malta quality-related criteria are the most mentioned as the main factor. Portugal is the only country where service related criteria are the most mentioned. Almost seven out of ten (69%) agree it is easy to compare services and prices offered by their current bundle with other bundled offers. Furthermore, 57% live in households where someone has changed bundle provider at least once a 12 point increase since the previous survey in In 21 Member States, the majority have changed bundle provider at least once. Amongst those who have not changed bundle providers (41% of the household who have a bundle), 61% have never considered it, while 32% have. However, in all but one Member State the proportion that have not considered switching has declined from 2 percentage points in Germany to a decline of 35 points in Ireland. Sweden is the exception, where there has been a 17 point increase in the proportion who have not considered switching. Amongst those who have never changed bundle providers, consumers are much more likely to be inertial, than to be hindered by some external issue 10 (82% vs. 15%). However, it is worth noting that the proportion of hindered switchers has increased in a number of Member States, particularly in Cyprus (+22 percentage points) and Ireland (+18 pp). 10 Households with hindered switchers are those where respondents considered switching but there are no other bundle providers in the area where they live, there are no other bundle providers which would provide good value for money, they are currently bound by a contract with their current provider, they didn t want to take the risk of a temporary loss of service during the switching process, they didn t want to take the risk of having to pay two providers during the switching process, it was not clear what steps they would need to take to switch, they did not want to lose their current address(es) or webpage(s) hosted on the provider's server, or that some services of the bundle could not be cancelled at the same time. 8
12 Almost half have signed a communications contract in the last three years but only 22% of them have read the terms and conditions entirely. 86% agree the same level of consumer protection that applies for traditional communication services should also apply to online communication services, with 58% in total agreement. More than two thirds in every Member State agree. It is important for consumers to be able to keep phone numbers, s or online content when switching providers: 89% say it would be important to keep their mobile number, 82% say this about their fixed line number, and 78% about their s or other online content stored by their provider. The majority say it is easy to monitor and control their use of a range of communication services: mobile telephone services (78%), fixed telephone services (71%), mobile Internet (69%) and fixed Internet (67%). Almost half have signed a communications service contract in the past three years (49%), with mobile phone contracts the most common (29%). Amongst those who have signed a contract in the past three years, 22% read the terms of the contract about user rights entirely, while 40% read these partly. At least one third of respondents in Lithuania, Latvia (both 35%), the Czech Republic, and Cyprus (both 34%) say they read the user rights terms in the contract entirely, compared to 10% in Sweden and France. More than eight in ten agree the contract had sufficient and clear information about the duration and renewal or roll over conditions (84%), 83% agree there was sufficient and clear information about the quality of services subscribed to and 79% agree there was sufficient and clear information about the termination of the contract. Most of the respondents (68%) who had read their last communications contract had a high level of satisfaction with the information it contained regarding all three aspects analysed. However, this varies across Member States: from 82% in Slovakia to 49% in the Netherlands. The majority of respondents who have an Internet connection at home said they would be not be willing to sign a communications contract longer than two years in exchange for much higher speed and enhanced quality of service (55%). Nearly half of the youngest respondents who have Internet would be willing to sign a longer contract in exchange for much higher speed and enhance quality of service (46%). This compares to only 29% among those aged 55+. Awareness of the 112 emergency number continues to increase More than six in ten would call 112 in the event of an emergency in their country (61%) an increase of three points since Almost all respondents in Finland (99%), the Netherlands (98%), Portugal, and Sweden (both 97%) would call 112, compared to 6% of respondents in Greece, 9% in the UK and 19% in France. Since 2014, the proportion of respondents that would call 112 has mostly increased amongst respondents in Cyprus (+20 pp), Malta (+9 pp), Hungary and Poland (both +7 pp). On the other hand, the proportion that would call 112 in the Czech Republic and Croatia has decreased by six points. 9
13 Almost half 46% correctly identify 112 as the only number to call in the event of an emergency anywhere in the EU, an increase of six points since Respondents in Poland (82%), Luxembourg (78%) and Slovakia (70%) are the most likely to only identify 112, while those in Greece (13%) and the UK (22%) are the least likely to do so. Since 2014, the proportion of respondents in Cyprus that only give 112 as their answer has increased by 20 percentage points, followed by respondents in Germany (+18 pp), Hungary (+17 pp), Portugal (+17 pp), and Estonia (+17 pp). In contrast, the proportion of respondents in Romania (-9 pp) and Bulgaria (-9 pp) that only give 112 as their answer has decreased. 10
14 II. USE OF COMMUNICATION SERVICES 1 Experience of using different communication services Mobile calls are by far the most frequent communication activity 11. More than nine out of ten respondents (93%) make or receive mobile phone calls, while 75% send or receive SMS. Almost seven out of ten (69%) send s, while 67% make or receive landline calls. Just over half use an Internet messaging service (53%), while 46% post content on social media. Making phone or video calls via Internet applications is least common, at 37%. Also it is worth noting that a higher proportion of respondents use instant messaging service a relatively newer service several times per day rather than sending s or making phone calls over a landline phone (30% vs. 27%). Base: All respondents (n = 27822) 11 QA4 How often do you do any of the following? Make or receive phone calls over a landline phone; Make or receive phone calls over a mobile phone; Send or receive SMS; Use an instant messaging service on the Internet; Make phone calls via Internet applications, including video calls; Send s; Post content on online social media. 11
15 At least six out of ten respondents in every Member State make or receive mobile phone calls daily 12. Respondents in Latvia (91%) are the most likely to do this, followed by those in Cyprus (88%), Lithuania (86%), Estonia, Slovenia and the Czech Republic (all 85%). There is much wider variation across Member States in the proportion of respondents that send or receive SMS daily - although in 18 Member States at least half of all respondents do this daily. Three quarters of respondents in Ireland and Denmark send or receive SMS daily (both 75%), as do 68% in the UK and Sweden. In a stark contrast, just 6% of respondents in Spain send or receive SMS daily - in fact, 62% say they never do this. In four Member States at least half of all respondents send s daily: the Netherlands (66%), Sweden (54%), Denmark (52%), and Belgium (50%). Furthermore, the Netherlands, Sweden and Denmark are the only countries where fewer than one in ten never send s. In most Member States fewer than four in ten use their landline daily to make or receive calls. Respondents in Greece are the most likely to use their landline daily (69%), followed by 64% of those in Germany and 57% in Malta. It is worth noting that Germany is the only Member State where daily landline use is more common than daily mobile use (64% vs. 62%). Spain (57%), the Netherlands and Italy (both 50%) are the only countries where at least half use instant messaging services daily. This compares to 11% in the Czech Republic and 16% in Lithuania and Greece. It is interesting to note that Spain, with the highest level of daily Internet messaging use, has the lowest level of SMS use. Furthermore 33% of respondents in Spain never send an instant message, compared to 62% that never send or receive SMS. Base: All respondents (n = 27822) 12 Daily usage = Several times a day + Once a day Regular usage = Several times a week + Once a week Occasional usage = Once a month + Less than monthly 12
16 Daily posting on social media is generally less common in all Member States 13. Respondents in Denmark are the most likely to post daily (43%), followed by those in Ireland (31%) and the UK (30%). This compares to 9% in Germany and 11% in Latvia and Slovenia. Respondents in Cyprus (21%), Croatia and Ireland (both 20%) are the most likely to make daily calls using Internet applications, compared to 6% in Portugal. In fact, in most Member States the majority of respondents never do this. There are a range of interesting differences in the socio-demographic analysis, although relatively few are based on gender. There are a number of age-related differences in the use of services, although broadly speaking the younger the respondent, the more likely they are to do most of these activities daily: The older the respondent, the more likely they are to make or receive daily landline calls: 46% do this compared to 23% of those aged and 27% of those aged More than eight out of ten respondents younger than 55 make or receive daily mobile phone calls. Respondents aged are the most likely to do this (89%), followed by those aged (83%) and those aged (82%) significantly higher than those aged 55+ (53%). 71% of the youngest respondents send or receive SMS daily, compared to 63% of those aged 25-39, 53% of those aged 40-54, and 23% of those aged 55+. At least half of those aged 39 or younger use instant messaging daily, with 68% of the youngest respondents making daily use of these services. This compares to 39% of year olds, and just 12% of those aged 55+. Almost one quarter of the youngest respondents make daily phone calls using Internet applications (24%), compared to just 3% of those aged 55+. Daily use is most widespread amongst those aged (50%), followed by year olds (45%) and year olds (40%). Daily use is considerably lower amongst those aged 55+. The youngest respondents are by far the most active daily active users of social media (posting on social media): 44% post daily, compared to 29% of year olds, 18% of year olds, and just 5% of those aged 55+ In addition to being the least frequent daily users of most of these services and applications, the oldest respondents are also the most likely to say they never use each of these services with the exception of making or receiving landline calls. For example, 83% never post on social media, compared to 14% of those aged These age results highlight a generational gap in the use of new and more established communications services. 13 It is important to note that this question only measures the active usage of online social media, and does not cover passive user behaviour, such as checking messages received or posted by other users. 13
17 Base: All respondents (n = 27822) 14
18 2 Most important communication services Mobile phones are much more important to respondents than other communication services 14. Almost half of all respondents said this is the most important (46%). Fixed line telephony is the next most mentioned, but just 17% consider it the most important. One in ten (10%) say mobile Internet is the most important in their daily life. Base: All respondents (n = 27822) A socio-demographic analysis of the single service or application considered the most important in daily life provides a number of interesting variations. Young people are the most likely to say mobile Internet or SMS are the most important to their daily life, but they are less likely to mention mobile telephony than those aged (41% vs. 53%). Furthermore, the older the respondent, the less likely they are to say mobile Internet is the most important in their daily life: 20% of year olds say this, compared to 3% of those aged 55+. As well as being asked their most important service and application, respondents were able to nominate up to three more they considered important in their daily life. As it was the case in the previous analysis, mobile telephony is by far the most important communication service in respondents daily life (74%). Around one third say mobile Internet (34%) or fixed telephony (32%) are most important, while at least one quarter mention fixed line Internet (27%), SMS (26%), or (25%). Instant messaging (14%), online social media (11%), or free phone or video calls (9%) are least likely to be considered important. 14 QA5a Which of the following services and applications do you consider the most important in your daily life? Firstly? QA5b And then? Landline telephone; Mobile telephone; SMS; Instant messaging service on the Internet; Free phone or video call service; Fixed line Internet; Mobile Internet; service; Online social media service; Other (SP.); None (SP.); Don't know. 15
19 3 Use of paid services over the Internet Almost one third of the respondents (32%) have used a paid Internet services 15. Respondents are most likely to have used a paid service for music (14%), or one that gives them access to movies or documentaries (12%), but even in these cases only a little over one in ten have used these services. Even fewer have used a cloud service for storing content from their computer (8%), a paid service to access digital books or newspapers, or a paid service for watching sports events (both 7%). Just 6% have used a paid service for making phone calls over the Internet. Base: Respondents with Internet connection in the household (n = 23395) (MULTIPLE ANSWERS POSSIBLE) Overall, respondents in Sweden (69%), Denmark (60%), the UK (55%) and the Netherlands (50%) are the most likely to have used at least one of these paid online services. In 12 countries, respondents are most likely to say they have used a paid music service in fact in Sweden almost half say this (47%) 16. More than one quarter of respondents in the UK have also used a paid music service online (27%), as have 22% in the Netherlands. Respondents in Sweden are also the most likely to say they have used a paid service for online access to movies or documentaries (37%), followed by those in Denmark (36%), and Finland (30%). Once again it is respondents in Sweden that are the most likely to have used a cloud service for storing content from their computer (23%), although 19% of those in Denmark and 17% in the UK have also used this kind of service. Respondents in Sweden (20%), Denmark (16%), Malta (16%) and the UK (15%) are the most likely to have user a paid service for accessing digital books or newspapers. 15 QA6 Which of the following paid services that you can access via the Internet, have you used? A paid service for accessing music; A paid service for accessing movies or documentaries; A paid service for accessing digital books or newspapers; A paid service for watching sports events; A paid service for making phone calls over the Internet; A cloud service for storing content from your computer; Other (SPONTANEOUS); None (SPONTANEOUS); Don t know. 16 It is important to note that international access to a paid service for digital content online depends on the commercial conditions from the provider. 16
20 III. TELEPHONE ACCESS 1 Overall telephone access Almost all respondents (98%) live in households with telephone access via at least one device (mobile or fixed line). Access is also almost universal in each Member State: Ranging from 100% in Belgium, Cyprus, Denmark, Estonia, Finland, France, Ireland, Luxembourg, Malta, Sweden and the United Kingdom to 94% in Romania. Nearly six out of ten respondents in the EU have both fixed and mobile telephone access in the household (59%). One third (33%) only have mobile telephone access, while just 6% have fixed telephone access but no mobile access. Two percent have no telephone access at all. The proportion of households with combined fixed and mobile access has declined slightly since 2014 (-2 percentage point). The proportion of respondents living in mobile only households, on the other hand, has continued to increase. It has risen two points since 2014, and 15 points since the end of 2005/early Base: All respondents (n = 27822) 17
21 2 Fixed telephony The majority have access to a fixed line telephone in their household (65%), although the proportion continues to decline 17. However, underlying this figure is a large disparity in fixed line access across the EU. Malta is the only country where at least nine out of ten have fixed line access (93%), followed by 85% in Germany, Luxembourg and the Netherlands, 83% in Greece and 81% in France. In a stark contrast, just 13% of respondents in Finland and 14% in the Czech Republic have access to a fixed line telephone in their household. Base: All respondents (n = 27822) At the overall EU level, the proportion of respondents living in households with fixed line access has declined by three percentage points since 2014, but there have been much larger variations in individual Member States. For instance, there has been a large decrease in Cyprus (-9 pp) and Croatia (-8 pp). On the other hand, in six Member States the proportion of households with fixed telephone access has increased by at least three points, Portugal (+10 pp), Ireland (+8 pp), Belgium (+7 pp), Slovakia (+6 pp), Estonia and Latvia (both +3 pp). 17 D43a.1 Do you own a fixed telephone in your household? Yes; No. 18
22 3 Mobile telephony More than nine in ten households have mobile phone access. Mobile phone ownership is much higher than fixed line telephone access 93% of households have access to a mobile phone. Mobile access is almost universal in Finland and Sweden (both 99%), Denmark and the Netherlands (both 98%). In all but two Member States at least nine in ten respondents live in households with mobile phone access. The exceptions are Bulgaria and Greece (88% for both), but even there the proportions are high. Base: All respondents (n = 27822) At an overall EU level there has been relatively no change in mobile access in the household since the last survey in 2014 (+1 pp), and there are generally only small changes at a country level. One third of households only have mobile telephone access (33%). As is the case for landline access, the proportion of households with mobile only access varies widely between countries. At least eight out of ten households in Finland (87%) and the Czech Republic (84%) are mobile only, as are 71% in Lithuania and 70% in Slovakia. In contrast, 7% of households in Malta and 15% in Germany, Luxembourg, and the Netherlands only have mobile telephone access. Since 2014, the largest increase is observed amongst households in Cyprus (+9 pp), followed by a seven point increase for households in Germany, Croatia and Romania. 19
23 IV. INTERNET ACCESS 1 Internet access in households Just over two thirds of EU households have Internet access at home (67%) a slight increase since 2014 (+2 percentage points) 18,19. However, Internet access is not uniformly high across all Member States. It is almost universal amongst households in the Netherlands (96%) and Denmark (94%), and at least eight out of ten households in Sweden (89%), Finland (83%) and Luxembourg (82%) have Internet access. However, the proportion is much lower (41%) in Italy, the only European Member State where less than half of the households have Internet at home. Base: All respondents (n = 27822) Since 2014 the proportion of households with Internet access has grown the most in Portugal (+16 percentage points), Ireland and Poland (both +11pp). On the other hand, household access has declined notably in Cyprus (-10 pp), Croatia (-9 pp) and Germany (-5 pp). It is worth noting a decline of Internet access at home observed in ten Member States since 2014: Cyprus (53%, -10 points), Croatia (61%, -9 points), Germany (71%, -5 points), France (75%, -3 points), The Czech Republic (62%, -3 points), Lithuania (57%, -3 points), Bulgaria (50%, -3 points), Italy (41%, -3 points), Sweden (89%, -2 points) and Slovenia (71%, -2 points). This decrease, although relatively small in most countries, can be explained partly by the overall rise of mobile Internet access analysed later in the summary. 18 D46. Which of the following goods do you have? An Internet connection at home. 19 It is important to note that given the recent growth of mobile Internet access, an Internet connection at home may refer to either fixed or mobile Internet connections. 20
24 2 Mobile Internet access in households Mobile Internet access continues to grow strongly. Three quarters of respondents with mobile phone access say at least one person in their household has a mobile subscription or pre-paid arrangement that included Internet access (75%) 20. This is an increase of 23 percentage points since 2014, and 39 points since Overall, 69% of the EU households have at least one mobile Internet access. This is an increase of 21 percentage points since Mobile Internet access is present in at least nine out of ten households in Denmark (91%), the Netherlands and Sweden (both 90%). In fact, in all Member States at least six out of ten respondents live in this kind of household. Since 2014, the proportion of households with a mobile phone subscription or pre-paid service that includes Internet access has increased in every Member State sometimes dramatically. Base: Respondents who have at least a member in their household with mobile phone access (n = 25825) 20 QA1.2 Thinking about all household members, including yourself, please indicate for each of the following how many of them are available in your household: Mobile phone subscriptions or pre-paid arrangements giving access to the Internet, e.g. for playing or downloading audio or video content or sending and receiving s. 21
25 European households are considerably more likely than in 2011 to have access to mobile Internet. The proportion of households with a mobile Internet connection has more than doubled in the last four years (69%, +36 pp). This is more likely to be a consequence of increased access to mobile Internet in addition to fixed Internet, as households are less likely to have only fixed Internet (11%, - 24 pp). It is therefore less likely a result of increased overall Internet access (-12 pp in the proportion of households without any Internet access). Base: All respondents (n = 27822) 22
26 V. TELEVISION ACCESS Television access is almost universal. Almost all EU households have access to a television (96%) 21. This proportion is in line with that of 2014 (96%), 2013 (97%), 2011 (97%) and 2009 (98%). At a country level, television access ranges from 100% in Cyprus to 86% in Sweden. Sweden is the only country where fewer than nine out of ten have television access. Respondents with a television in the household are most likely to receive their television via a digital terrestrial television (DTT) (38%), while 7% receive television via an aerial. Almost one quarter of households have satellite TV (24%). One in five (20%) receive their TV via digital cable ( a cable TV network + decoder ), while a further 9% receive analogue cable ( a cable TV network (analogue = directly connected to the TV set) ). Relatively few receive their television via the telephone network (12%). Overall 43% of respondents live in households with aerial or DTT TV access 22, while 29% have cable. There have been few changes since The most notable is a five percentage point increase in the proportion of respondents that receive television via the telephone network. The longer term trends show that digital terrestrial television penetration has stabilised, after declining slightly between 2013 and Cable and satellite connections have remained stable. In fact, the only sector to show notable growth in the past two years is television access via the telephone network (+6 percentage points). Base: Respondents who have television in the household (n = 26680) 21 D46 Which of the following goods do you have? A television. 22 TV cable = A cable TV network (analogue = directly connected to the TV set) + A cable TV network + decoder (digital TV) Aerial or DTT = An aerial (e.g. on the roof or on the top of the TV set) + Digital Terrestrial Television (aerial + decoder). 23
27 VI. SERVICE PACKAGES The purchase of bundled communications services continues to increase. Half of all EU households purchase bundled communication services packages that combine two or more services for one overall price 23. This is an increase of four percentage points since the survey in 2014, and a 12 point increase since Base: All respondents (n = 27822) Households in the Netherlands (87%) and Malta (78%) are the most likely to have purchased bundled services, as have at least half of all households in 19 other Member States. At the other end of the scale, 31% of households in Italy, 32% in the Czech Republic and 34% in Lithuania have purchased bundled communications services. 23 QA7 By bundle, we mean a package offering a combination of electronic communication services (or a combination with other services such as TV channels) from the same provider at an overall price. Has your household subscribed to two or more of the following services as part of a bundle? No, we have not bought services as part of a bundle; Yes, fixed line telephone; Yes, mobile telephone; Yes, fixed or mobile Internet access; Yes, television channels; Other (SPONTANEOUS); Don t know. 24
28 For households with a bundle, their bundle is most likely to include Internet access (80%), followed by fixed telephony (65%) and television (53%). Mobile telephone is included in the bundle for 45% of the respondents households (+16 points). This dramatic uptake of mobile in bundles is a good indicator of the fixed-mobile convergence trend in the market place. Compared to 2014, households are much more likely to have a bundle that includes mobile telephony (+16 pp), but are less likely to have one that includes fixed telephony (-15 pp) or Internet access (-11 pp). This tends to show a certain substitution between fixed Internet subscription and mobile Internet. Base: Respondents who have a bundle (n = 14766) 25
29 VII. PURCHASING AND SWITCHING SERVICES Cost-related criteria are the most important when subscribing to an Internet connection 24. Overall, 69% say this is a main factor when subscribing to an Internet connection, while 48% mention the maximum download or upload speed, and 32% the maximum amount of data that can be downloaded or uploaded. As this question has been modified since January 2014, a direct comparison of all answers cannot be made. However, looking at comparable individual items it shows respondents are more likely to consider quality criteria, such as maximum download or upload speed (+7 points), or maximum amount of data downloaded or uploaded (+6 points) than they were in Base: Respondents with Internet connection in the household (n = 19642) 24 QA3a When subscribing to an Internet connection what are the main factors you consider? Firstly? QA3b And then? The maximum download or upload speed; The maximum amount of data (MB, GB) you can download or upload; The price of the Internet subscription; The notice period to terminate the contract with the provider; The fact that the Internet subscription is part of a bundle; The customer service; The cost of the equipment; The cost of installation; The ability to use multiple connected devices at the same time without loss of quality; Other (SPONTANEOUS); Don't know. 26
30 The majority in all but one Member State agree it is easy to compare bundle offers 25. More than two thirds (69%) agree that it is easy to make these comparisons in fact 29% totally agree. Almost one quarter disagree (24%), although they are more likely to tend to disagree (16%) than totally disagree (8%). There has been no notable change since the last survey in The majority of respondents live in households where someone has changed bundle provider. Amongst respondents living in households with bundled services, more than half live in households where someone has changed bundle providers at least once (57%) 26. In fact, 28% have done so in the last two years. This is a notable increase since 2014 when 45% (+12 pp) had changed bundle providers at least once. Base: Respondents who have a bundle (n = 14766) Amongst those with bundled services, households in Greece are the most likely to have changed bundle at least once (80%), followed by those in Finland (73%), Italy (70%), Spain (69%) and Austria (68%). In fact, in 21 Member States the majority has changed bundle provider at least once. Most respondents that live in households where no one has ever changed bundle providers say they have never considered doing so (61%) 27. Almost one third (32%) have considered changing bundle providers, although they have never actually done so. 25 QA8 Please tell me whether you agree or disagree with the following statement: You can easily compare the services and prices offered by your current bundle with other bundled offers. Totally agree; Tend to agree; Tend to disagree; Totally disagree; Don t know. 26 QA9 Have you or someone in your household changed bundle service provider? Yes, within the last year: Yes, between one and two years ago; Yes, between two and five years ago; Yes, more than five years ago; No, never; Don t know. 27 QA10. Have you or someone in your household ever considered changing your bundle provider? No, you never considered it; Yes, but you are satisfied with the service you currently get; Yes, but there are no other bundle providers in the area where you live; Yes, but there are no other bundle providers which would provide good value for money; Yes, but you are currently bound by your contract with your current provider; Yes, but eventually your provider offered you better conditions and you decided not to switch; Yes, but you don't want to take the risk of a temporary loss of service during the switching process; Yes, but you don't want to take the risk of having to pay two providers during the switching process; Yes, but it is not clear what steps you would need to take to switch; Yes, but you do not want to lose your current address(es) or web page(s) hosted on the provider's server; Yes, but it takes too much effort and time to do it; Yes, but some services of the bundle could not be cancelled at the same time; Other (SPONTANEOUS); Don't know. 27
31 VIII. CONSUMER PROTECTION AND COMMUNICATION SERVICES 1 Consumer protection when using digital services Almost nine in ten agree the same consumer protection should apply to both digital and traditional communication services 28 (86%). In fact, more than half (58%) totally agrees. Just 5% disagree. More than six out of ten respondents in each country agree the same level of consumer protection, including data protection and security, should be applied when using messaging services, services or phone service applications via the Internet as when using traditional communications services (such as phones or SMS). Base: All respondents (n = 27822) 28 QA11 Please tell me whether you agree or disagree with the following statement: The same level of consumer protection, including data protection and security, should be applied when using messaging services, services or phone service applications via the Internet as when using traditional communications services (such as phones or SMS). Totally agree; Tend to agree; Tend to disagree; Totally disagree; Don t know. 28
32 2 Keeping telephone numbers and addresses when switching provider At least three quarters say it would be important to keep phone numbers, and online content when switching providers 29. Almost nine out of ten respondents with a mobile phone (89%) say it would be important to keep their mobile phone number, with 68% saying this would be very important. More than eight out of ten with a fixed line say it would be important to keep their number (82%), with 61% saying this would be very important. More than three quarters of those with a home Internet connection say being able to keep their e- mails, contacts, photos and any other personal content stored online by their communications service provider when switching would be important (78%), with 55% saying this would be very important. Base: Respondents with access to the respective communications service 29 QA12 If you were to switch your communications service provider, how important would it be to keep each of the following? 12a.1 Your fixed telephone number; 12a.2 Your mobile telephone number; 12a.3 Your s, contacts, photos and any other personal content stored online by your communications service provider. 29
33 3 Ease of controlling and monitoring communication services At least two thirds think it is easy to monitor and control their use of communications services. The majority of respondents say it is easy to monitor and control their use of a range of communication services 30. More than three quarters of mobile users say it is easy to monitor and control their mobile phone consumption (78%), with 40% saying this is very easy. Just over seven in ten (71%) say it is easy to monitor and control their fixed line telephone usage, with 37% saying this is very easy. Almost as many say it is easy to monitor their mobile Internet (69%), while 67% say this about fixed line Internet. For both of these Internet services 34% say it is very easy to monitor and control their consumption. Base: Respondents with access to the respective communications service 30 QA16 For each of the following services, please tell me whether you consider it is easy or not to monitor and control your consumption: 16.1 Fixed telephone services; 16.2 mobile telephone services; 16.3 Fixed Internet access services; 16.4 Mobile Internet access services. 30
34 IX. COMMUNICATION SERVICE CONTRACTS 1 Experience of signing a contract in the last three years In the last three years, almost half of the respondents have signed communications service contract 31. Almost three in ten have signed a new, renewed or amended contract mobile phone in the last three years (29%), while 14% have done so for fixed Internet access and 12% for mobile Internet. Base: All respondents (n = 27822) Overall 62% say they read these, although just 22% had read them entirely, while 40% reading them in part 32. More than one third (37%) did not read these terms. Most have a high level of satisfaction with the information provided in telecommunications contracts 33. More than eight in ten agree the contract had sufficient and clear information about the duration and renewal or roll over conditions (84%), while almost as many (83%) agree there was sufficient and clear information about the quality of services subscribed to. More than three quarters (79%) agree there was sufficient and clear information about the termination of the contract. 31 QA13 In the last three years, have you personally signed a new, renewed, or amended contract for any of the following services? Yes, fixed Internet access; Yes, mobile Internet access; Yes, mobile phone; Yes, fixed phone; Yes, for the television; Yes, a bundle; No; Don t know. 32 QA14 The last time you signed a contract for a communications service, did you read the terms of the contract about user rights? Yes, entirely; Yes, partly; No; Don t know. 33 QA15 "Please tell me whether you agree or disagree with each of the following statements. The contract you signed provided sufficient and clear information on QA15.1 The quality of the services subscribed to (%); QA15.2The termination (including possible charges for early cancellation); QA15.3 Its duration and renewal or roll over conditions. 31
35 2 Longer Internet contract in exchange for much higher speed and enhanced quality Most would not sign a longer communications service contract in exchange for faster speeds or improved quality 34. Almost four in ten (38%) say they would, although just 11% would certainly do this. A slight majority (55%) would not sign a longer contract under these conditions in fact, 29% say they certainly would not. In three Member States, at least half of all respondents would sign a longer contract in return for faster speeds and enhanced service: Estonia (56%), Denmark (53%) and Latvia (51%). In contrast, 27% of respondents in Spain and 28% in the Netherlands say the same. Base: Respondents with Internet connection in the household (n = 19642) 34 QA17. The maximum duration of a communication services contract is currently two years. Would you be prepared to sign a contract with a provider for a longer period in exchange for a much higher speed and enhanced quality of service? Yes, certainly; Yes, probably; No, probably not; No, certainly not; Don't know. 32
36 X. KNOWLEDGE OF THE EUROPEAN EMERGENCY NUMBER Calling the emergency number in one s own country More than six in ten would call 112 in an emergency within their country 35. Most (61%) would call 112, while 26% would call the national emergency number. The proportion that would call 112 has increased slightly since 2014 (+3 percentage points), as has the proportion that would call the national number (+2 pp). The proportion mentioning other numbers has decreased by three points. The majority of respondents in 23 Member States would call 112 in the event of an emergency in their country. In fact, almost all respondents in Finland (99%), the Netherlands (98%), Portugal, and Sweden (both 97%) would do this. Base: All respondents (n = 27822) 2 Calling the emergency number anywhere in the EU Almost half correctly identify 112 as the single European emergency call number for anywhere in the Union 36. Awareness of 112 as the single number to call has increased by six percentage points since 2014, and mentions of 112 along with another number have increased by seven points. In 16 Member States at least half of all respondents identify 112 as the single number to call anywhere in the EU in the event of an emergency. Base: All respondents (n = 27822) 35 QA18 Can you tell me what telephone number you would call in the event of an emergency in (OUR COUNTRY); for example, if someone needs urgent medical assistance or if you need to contact the police or the fire brigade? 36 QA19 Can you tell me what telephone number enables you to call emergency services anywhere in the EU? 33
37

38
E-COMMUNICATIONS AND TELECOM SINGLE MARKET HOUSEHOLD SURVEY
 Special Eurobarometer 414 E-COMMUNICATIONS AND TELECOM SINGLE MARKET HOUSEHOLD SURVEY REPORT Fieldwork: January 2014 Publication: March 2014 This survey has been requested by the European Commission, Directorate-General
E-COMMUNICATIONS HOUSEHOLD SURVEY
 Special Eurobarometer 396 E-COMMUNICATIONS HOUSEHOLD SURVEY REPORT Fieldwork: February - March 2013 Publication: November 2013 This survey has been requested by the European Commission, Directorate-General
INNOBAROMETER 2015 - THE INNOVATION TRENDS AT EU ENTERPRISES
 Eurobarometer INNOBAROMETER 2015 - THE INNOVATION TRENDS AT EU ENTERPRISES REPORT Fieldwork: February 2015 Publication: September 2015 This survey has been requested by the European Commission, Directorate-General
THE ROLE OF PUBLIC SUPPORT IN THE COMMERCIALISATION OF INNOVATIONS
 Flash Eurobarometer THE ROLE OF PUBLIC SUPPORT IN THE COMMERCIALISATION OF INNOVATIONS REPORT Fieldwork: January February 2014 Publication: May 2014 This survey has been requested by the European Commission,
EUROPEAN CITIZENS DIGITAL HEALTH LITERACY
 Flash Eurobarometer EUROPEAN CITIZENS DIGITAL HEALTH LITERACY REPORT Fieldwork: September 2014 Publication: November 2014 This survey has been requested by the European Commission, Directorate-General
How To Understand The Differences Between The Different Types Of Phone Access In European Countries
 Special Eurobarometer 381 E-COMMUNICATIONS HOUSEHOLD SURVEY REPORT Fieldwork: December 2011 Publication: June 2012 This survey has been requested by the European Commission, Directorate-General for Information
EUROPEAN YOUTH: PARTICIPATION IN DEMOCRATIC LIFE
 Flash Eurobarometer EUROPEAN YOUTH: PARTICIPATION IN DEMOCRATIC LIFE REPORT Fieldwork: April 2013 Publication: May 2013 This survey has been requested by the European Commission, Directorate-General for
Special Eurobarometer 423 CYBER SECURITY REPORT
 Special Eurobarometer 423 CYBER SECURITY REPORT Fieldwork: October 2014 Publication: February 2015 This survey has been requested by the European Commission, Directorate-General for Home Affairs and co-ordinated
EUROPEAN AREA OF SKILLS AND QUALIFICATIONS
 EUROPEAN AREA OF SKILLS AND QUALIFICATIONS REPORT Fieldwork: April - May 2014 Publication: June 2014 This survey has been requested by the European Commission, Directorate-General for Education and Culture
YOUNG PEOPLE AND DRUGS
 Eurobarometer YOUNG PEOPLE AND DRUGS REPORT Fieldwork: June 2014 Publication: August 2014 This survey has been requested by the European Commission, Directorate-General for Justice and co-ordinated by
Special Eurobarometer 423 CYBER SECURITY SUMMARY
 Special Eurobarometer 423 CYBER SECURITY SUMMARY Fieldwork: October 2014 Publication: February 2015 This survey has been requested by the European Commission, Directorate-General for Home Affairs and co-ordinated
Special Eurobarometer 431 DATA PROTECTION REPORT
 Special Eurobarometer 431 DATA PROTECTION REPORT Fieldwork: March 2015 Publication: June 2015 This survey has been requested by the European Commission, Directorate-General for Justice and Consumers and
HOW COMPANIES INFLUENCE OUR SOCIETY: CITIZENS VIEW
 Flash Eurobarometer HOW COMPANIES INFLUENCE OUR SOCIETY: CITIZENS VIEW REPORT Fieldwork: October-November 2012 Publication: April 2013 This survey has been requested by the European Commission, Directorate-General
BUILDING THE DIGITAL SINGLE MARKET CROSS BORDER DEMAND FOR CONTENT SERVICES
 Special Eurobarometer 366 BUILDING THE DIGITAL SINGLE MARKET CROSS BORDER DEMAND FOR CONTENT SERVICES REPORT Fieldwork: April - May 2011 This survey has been requested by the European Commission, Directorate-General
INTRODUCTION... 2. I. Participation in the 2014 European elections... 3
 ?? Directorate-General for Communication PUBLIC OPINION MONITORING UNIT 2014 EUROPEAN ELECTIONS DESK RESEARCH Brussels, April 2015 Profile of voters and abstainees in the European elections 2014 INTRODUCTION...
Special Eurobarometer 390 CYBER SECURITY REPORT
 Special Eurobarometer 390 CYBER SECURITY REPORT Fieldwork: March 2012 Publication: July 2012 This survey has been requested by the European Commission, Directorate-General Home Affairs and co-ordinated
Special Eurobarometer 398 INTERNAL MARKET REPORT
 Special Eurobarometer 398 INTERNAL MARKET REPORT Fieldwork: April - May 2013 Publication: October 2013 This survey has been requested by the European Commission, Directorate-General Internal Market and
E-Communications Household Survey. Report. Fieldwork: November - December 2009 Publication: October 2010. Special Eurobarometer 335
 Special Eurobarometer 335 European Commission E-Communications Household Survey Report Fieldwork: November - December 2009 Publication: October 2010 Special Eurobarometer 335 / Wave TNS Opinion & Social
RETAIL FINANCIAL SERVICES
 Special Eurobarometer 373 RETAIL FINANCIAL SERVICES REPORT Fieldwork: September 211 Publication: April 212 This survey has been requested by the European Commission, Directorate-General Internal Market
RETAIL FINANCIAL SERVICES
 Special Eurobarometer 373 RETAIL FINANCIAL SERVICES REPORT Fieldwork: September 211 Publication: March 212 This survey has been requested by Directorate-General Internal Market and Services and co-ordinated
ATTITUDES OF EUROPEANS TOWARDS WASTE MANAGEMENT AND RESOURCE EFFICIENCY
 Flash Eurobarometer ATTITUDES OF EUROPEANS TOWARDS WASTE MANAGEMENT AND RESOURCE EFFICIENCY REPORT Fieldwork: December 0 Publication: June 0 This survey has been requested by the European Commission, Directorate-General
ATTITUDES OF EUROPEANS TOWARDS BUILDING THE SINGLE MARKET FOR GREEN PRODUCTS
 Eurobarometer ATTITUDES OF EUROPEANS TOWARDS BUILDING THE SINGLE MARKET FOR GREEN PRODUCTS REPORT Fieldwork: December 2012 Publication: July 2013 This survey has been requested by the European Commission,
User language preferences online. Analytical report
 Flash Eurobarometer 313 The Gallup Organization Flash Eurobarometer European Commission User language preferences online Analytical report Fieldwork: January 2011 Publication: May 2011 This survey was
Responsible Research and Innovation (RRI), Science and Technology
, Science and Technology") Special Eurobarometer 401 Responsible Research and Innovation (RRI), Science and Technology REPORT Fieldwork: April - May 2013 Publication: November 2013 This survey has been requested by the European
Special Eurobarometer 401 Responsible Research and Innovation (RRI), Science and Technology REPORT Fieldwork: April - May 2013 Publication: November 2013 This survey has been requested by the European
ATTITUDES OF EUROPEANS TOWARDS TOBACCO AND ELECTRONIC CIGARETTES
 Special Eurobarometer 429 ATTITUDES OF EUROPEANS TOWARDS TOBACCO AND ELECTRONIC CIGARETTES REPORT Fieldwork: November-December 2014 Publication: May 2015 This survey has been requested by the European
PREFERENCES OF EUROPEANS TOWARDS TOURISM
 Eurobarometer PREFERENCES OF EUROPEANS TOWARDS TOURISM REPORT Fieldwork: January 2014 Publication: February 2014 This survey has been requested by the European Commission, Directorate-General for Enterprise
E-Communications Household Survey. Summary. Fieldwork: November - December 2009 Publication: October 2010. Special Eurobarometer 335
 Special Eurobarometer 335 European Commission E-Communications Household Survey Summary Fieldwork: November - December 2009 Publication: October 2010 Special Eurobarometer 335 / Wave 72.5 TNS Opinion &
INNOVATION IN THE PUBLIC SECTOR: ITS PERCEPTION IN AND IMPACT ON BUSINESS
 Flash Eurobarometer INNOVATION IN THE PUBLIC SECTOR: ITS PERCEPTION IN AND IMPACT ON BUSINESS REPORT Fieldwork: February-March 22 Publication: June 22 This survey has been requested by the European Commission,
CROSS-BORDER ACCESS TO ONLINE CONTENT
 Flash Eurobarometer 411 CROSS-BORDER ACCESS TO ONLINE CONTENT SUMMARY Fieldwork: January 2015 Publication: August 2015 This survey has been requested by the European Commission, Directorate-General for
BUSINESS-TO-BUSINESS ALTERNATIVE DISPUTE RESOLUTION IN THE EU
 Flash Eurobarometer BUSINESS-TO-BUSINESS ALTERNATIVE DISPUTE RESOLUTION IN THE EU REPORT Fieldwork: March-April 22 Publication: November 22 This survey has been requested by Directorate-General for Justice
PUBLIC ATTITUDES TOWARDS ROBOTS
 Special Eurobarometer 382 PUBLIC ATTITUDES TOWARDS ROBOTS REPORT Fieldwork: February - March 2012 Publication: September 2012 This survey has been requested by Directorate-General for Information Society
RETAILERS ATTITUDES TOWARDS CROSS- BORDER TRADE AND CONSUMER PROTECTION
 Eurobarometer RETAILERS ATTITUDES TOWARDS CROSS- BORDER TRADE AND CONSUMER PROTECTION REPORT Fieldwork: September - October 2012 Publication: June 2013 This survey has been requested by the European Commission,
THE ELECTRONIC CUSTOMS IMPLEMENTATION IN THE EU
 Flash Eurobarometer THE ELECTRONIC CUSTOMS IMPLEMENTATION IN THE EU REPORT Fieldwork: April-May 214 Publication: October 214 This survey has been requested by the European Commission, Directorate-General
EUROPEANS SATISFACTION WITH RAIL SERVICES
 Flash Eurobarometer 382a EUROPEANS SATISFACTION WITH RAIL SERVICES SUMMARY Fieldwork: September 2013 Publication: December 2013 This survey has been requested by the European Commission, Directorate-General
INVESTING IN INTANGIBLES: ECONOMIC ASSETS AND INNOVATION DRIVERS FOR GROWTH
 Flash Eurobarometer INVESTING IN INTANGIBLES: ECONOMIC ASSETS AND INNOVATION DRIVERS FOR GROWTH REPORT Fieldwork: January February 213 Publication: May 213 This survey has been requested by the European
ATTITUDES OF EUROPEANS TOWARDS BUILDING THE SINGLE MARKET FOR GREEN PRODUCTS
 Flash Eurobarometer 367 ATTITUDES OF EUROPEANS TOWARDS BUILDING THE SINGLE MARKET FOR GREEN PRODUCTS SUMMARY Fieldwork: December 2012 Publication: July 2013 This survey has been requested by the European
THE EUROPEAN EMERGENCY NUMBER 112
 Flash Eurobarometer 368 THE EUROPEAN EMERGENCY NUMBER 112 SUMMARY Fieldwork: January 2013 Publication: February 2013 This survey has been requested by the European Commission, Directorate-General for Communications
Monitoring the social impact of the crisis: public perceptions in the European Union (wave 6) REPORT
 REPORT") Eurobarometer Monitoring the social impact of the crisis: public perceptions in the European Union (wave 6) REPORT Fieldwork: December 2011 Publication: April 2012 This survey has been requested by Directorate-General
Eurobarometer Monitoring the social impact of the crisis: public perceptions in the European Union (wave 6) REPORT Fieldwork: December 2011 Publication: April 2012 This survey has been requested by Directorate-General
Special Eurobarometer 397 CORRUPTION REPORT
 Special Eurobarometer 397 CORRUPTION REPORT Fieldwork: February - March 213 Publication: February 214 This survey has been requested by the European Commission, Directorate-General for Home Affairs and
Health and long-term care in the European Union
 Special Eurobarometer European Commission Health and long-term care in the European Union Fieldwork: May June 2007 Publication: December 2007 Report Special Eurobarometer 283/ Wave 67.3 TNS Opinion & Social
Attitudes towards vocational education and training
 Special Eurobarometer 369 European Commission Attitudes towards vocational education and training SUMMARY Special Eurobarometer 369 / Wave EB75.4 TNS opinion & social Fieldwork: June 2011 Publication:
COMPANIES ENGAGED IN ONLINE ACTIVITIES
 Flash Eurobarometer 413 COMPANIES ENGAGED IN ONLINE ACTIVITIES SUMMARY Fieldwork: January-February 2015 Publication: May 2015 This survey has been requested by the European Commission, Directorate-General
Special Eurobarometer 379 FUTURE OF EUROPE REPORT. This survey has been requested by the European Commission, Directorate-General for Communication.
 Special Eurobarometer 379 FUTURE OF EUROPE REPORT Fieldwork: December 2011 Publication: April 2012 This survey has been requested by the European Commission, Directorate-General for Communication. http://ec.europa.eu/public_opinion/index_en.htm
SURVEY ON THE TRAINING OF GENERAL CARE NURSES IN THE EUROPEAN UNION. The current minimum training requirements for general care nurses
 SURVEY ON THE TRAINING OF GENERAL CARE NURSES IN THE EUROPEAN UNION This survey serves as a background document for the discussion of the Commission's legislative proposal to modernize the minimum requirements
Family Law. Analytical Report
 Flash Eurobarometer European Commission Family Law Analytical Report Fieldwork: June 2006 Report: October 2006 Flash Eurobarometer 188 The Gallup Organization This survey was requested by Directorate-General
Family Law. Fieldwork: June 2006 Report: October 2006
 The Gallup Organization Flash EB N o 188 Consular Protection and Family Law Flash Eurobarometer European Commission Family Law Summary Fieldwork: June 06 Report: October 06 Flash Eurobarometer 188 The
EN 106 EN 4. THE MOBILE USE OF THE INTERNET BY INDIVIDUALS AND ENTERPRISES. 4.1. Introduction
 4. THE MOBILE USE OF THE INTERNET BY INDIVIDUALS AND ENTERPRISES 4.1. Introduction This chapter looks at mobile use of the internet by individuals and enterprises, benefiting from new data collected in
Flash Eurobarometer 355 SPACE ACTIVITIES REPORT
 Flash Eurobarometer SPACE ACTIVITIES REPORT Fieldwork: July 2012 Publication: September 2012 This survey has been requested by the European Commission, Directorate-General Enterprise and Industry and co-ordinated
The Future European Constitution
 Flash Eurobarometer European Commission The Future European Constitution Fieldwork : January 2004 Publication : February 2004 Flash Eurobarometer 159 - TNS Sofres / EOS Gallup Europe This survey was requested
EUROPE 2020 TARGET: EARLY LEAVERS FROM EDUCATION AND TRAINING
 EUROPE 2020 TARGET: EARLY LEAVERS FROM EDUCATION AND TRAINING By 2020, the share of early leavers from education and training (aged 18-24) should be less than 10% Early school leaving 1 is an obstacle
CONSUMERS ATTITUDES TOWARDS CROSS- BORDER TRADE AND CONSUMER PROTECTION
 Eurobarometer CONSUMERS ATTITUDES TOWARDS CROSS- BORDER TRADE AND CONSUMER PROTECTION REPORT Fieldwork: September 2011 Publication: May 2012 This survey has been requested by the European Commission, Directorate-General
PATIENTS RIGHTS IN CROSS-BORDER HEALTHCARE IN THE EUROPEAN UNION
 Special Eurobarometer 425 PATIENTS RIGHTS IN CROSS-BORDER HEALTHCARE IN THE EUROPEAN UNION REPORT Fieldwork: October 2014 Publication: May 2015 This survey has been requested by the European Commission,
WOMEN IN DECISION-MAKING POSITIONS
 Special Eurobarometer 376 WOMEN IN DECISION-MAKING POSITIONS REPORT Fieldwork: September 2011 Publication: March 2012 This survey has been requested by Directorate-General Justice and co-ordinated by Directorate-
Broadband markets Digital Agenda Scoreboard 1 2014
 Broadband markets Digital Agenda Scoreboard 2014 1 Broadband coverage: Basic broadband is available to everyone in the EU, while fixed technologies cover 97% leaving 6 million homes unconnected. Next Generation
SMES, RESOURCE EFFICIENCY AND GREEN MARKETS
 Eurobarometer SMES, RESOURCE EFFICIENCY AND GREEN MARKETS REPORT Fieldwork: September 2013 Publication: December 2013 This survey has been requested by the European Commission, Directorate-General for
Towards a safer use of the Internet for children in the EU a parents perspective. Analytical report
 Flash Eurobarometer 248 The Gallup Organisation Analytical Report Flash EB N o 251 Public attitudes and perceptions in the euro area Flash Eurobarometer European Commission Towards a safer use of the Internet
Attitudes towards vocational education and training
 Special Eurobarometer 369 European Commission Attitudes towards vocational education and training REPORT Special Eurobarometer 369 / Wave TNS opinion & social Fieldwork: June Publication: September This
PREFERENCES OF EUROPEANS TOWARDS TOURISM
 Flash Eurobarometer 414 PREFERENCES OF EUROPEANS TOWARDS TOURISM SUMMARY Fieldwork: January 2015 Publication: March 2015 This survey has been requested by the European Commission, Directorate-General for
How To Understand The Habits Of Smokers In The European Union
 Special Eurobarometer 385 ATTITUDES OF EUROPEANS TOWARDS TOBACCO REPORT Fieldwork: February - March 2012 Publication: May 2012 This survey has been requested by the European Commission, Directorate-General
European judicial training 2014. Justice
 European judicial training 2014 Justice Europe Direct is a service to help you find answers to your questions about the European Union. Freephone number (*): 00 800 6 7 8 9 10 11 (*) Certain mobile telephone
ERMInE Database. Presentation by Nils Flatabø SINTEF Energy Research. ERMInE Workshop 2 - Northern Europe Oslo, 1. November 2006
 ERMInE Database Presentation by Nils Flatabø SINTEF Energy Research ERMInE Workshop 2 - Northern Europe Oslo, 1. November 26 Overview Content of the Ermine Database Electronic Questionnaire RTD&D Data
Broadband Coverage in Europe Final Report 2009 Survey Data as of 31 December 2008. DG INFSO 80106 December 2009 IDATE 1
 Broadband Coverage in Europe Final Report 2009 Survey Data as of 31 December 2008 DG INFSO 80106 December 2009 IDATE 1 Table of contents 1. Methodological notes...5 2. Executive summary...7 3. European
ENTERING THE EU BORDERS & VISAS THE SCHENGEN AREA OF FREE MOVEMENT. EU Schengen States. Non-Schengen EU States. Non-EU Schengen States.
 ENTERING THE EU BORDERS & VISAS THE SCHENGEN AREA OF FREE MOVEMENT An area without internal borders where EU citizens and non-eu nationals may move freely EU Schengen States Non-Schengen EU States IS Azores
OVERVIEW OF PURCHASE AND TAX INCENTIVES FOR ELECTRIC VEHICLES IN THE EU
 01.04.2014 OVERVIEW OF PURCHASE AND TAX INCENTIVES FOR ELECTRIC VEHICLES IN THE EU This table provides an overview of the incentives that are granted in the Member States of the European Union for the
Digital Agenda Targets Progress report. Digital Agenda Scoreboard 2014
 Digital Agenda Targets Progress report Digital Agenda Scoreboard 2014 1 NGA coverage: Fast broadband technologies capable of providing at least 30 Mbps are available to 64%, up from 54% a year ago Among
Attitudes of Europeans towards Tobacco. Report. Special Eurobarometer. Fieldwork October - November 2006 Publication May 2007
 Special Eurobarometer European Commission Attitudes of Europeans towards Tobacco Fieldwork October - November 2006 Publication May 2007 Report Special Eurobarometer 272c / Wave 66.2 TNS Opinion & Social
Domestic Violence against Women. Report. Fieldwork: February March 2010 Publication: September 2010. Special Eurobarometer 344
 Special Eurobarometer 344 European Commission Domestic Violence against Women Report Fieldwork: February March 2010 Publication: September 2010 Special Eurobarometer 344 / Wave TNS Opinion & Social This
Dublin, March 2013. EPSO Network of Experts in the field of Personnel Selection 14th March 2013
 Dublin, March 2013 EPSO Network of Experts in the field of Personnel Selection 14th March 2013 On-going and upcoming competitions AD2012 by Citizenship AD2012 Citizenship %EU Population validated application
Internal Market: Awareness, Perceptions and Impacts
 Special Eurobarometer 363 European Commission Internal Market: Awareness, Perceptions and Impacts REPORT Special Eurobarometer 363 / Wave TNS opinion & social Fieldwork: February-March 2011 Publication:
SMES, RESOURCE EFFICIENCY AND GREEN MARKETS
 Flash Eurobarometer 381 SMES, RESOURCE EFFICIENCY AND GREEN MARKETS SUMMARY Fieldwork: September 2013 Publication: December 2013 This survey has been requested by the European Commission, Directorate-General
Fieldwork September October 2006 Publication March 2007
 Special Eurobarometer European Commission Roaming Fieldwork September October 2006 Publication March 2007 Special Eurobarometer 269 / Wave 66.1 TNS Opinion & Social This survey was requested by Directorate
CO2 BASED MOTOR VEHICLE TAXES IN THE EU IN 2015
 CO2 BASED MOTOR VEHICLE TAXES IN THE EU IN 2015 COUNTRY AT (AUSTRIA) BE (BELGIUM) BG (BULGARIA) CO2/FUEL CONSUMPTION TAXES A fuel consumption tax (Normverbrauchsabgabe or NoVA) is levied upon the first
Pan-European opinion poll on occupational safety and health
 PRESS KIT Pan-European opinion poll on occupational safety and health Results across 36 European countries Press kit Conducted by Ipsos MORI Social Research Institute at the request of the European Agency
European Research Council
 ERC Advanced Grants 2011 Outcome: Indicative Statistics Reproduction is authorised provided that the source ERC is acknowledged NB: In these graphs grantee refers to a candidate selected for ERC funding
Finnish foreign trade 2014 Figures and diagrams. 27.2.2015 FINNISH CUSTOMS Statistics 1
 Finnish foreign trade 214 Figures and diagrams 27.2.215 FINNISH CUSTOMS Statistics 1 IMPORTS, EXPORTS AND TRADE BALANCE 199-214 7 billion e 6 5 4 3 2 1-1 9 91 92 93 94 95 96 97 98 99 1 2 3 4 5 6 7 8 9
EUROPEAN SEMESTER THEMATIC FICHE ACCESS TO FINANCE
 EUROPEAN SEMESTER THEMATIC FICHE ACCESS TO FINANCE Access to finance is key to business development. Investment and innovation are not possible without adequate financing. A difficulty in getting finance
Study on comparison tools and third-party verification schemes
 Justice and Consumers Study on comparison tools and third-party verification schemes ECCG 25/03/2015 Julien Brugerolle JUST E6 Introduction Study objectives Explore consumer behavioural patterns in the
GDP per capita, consumption per capita and comparative price levels in Europe
 Economy and finance Author: Lars SVENNEBYE Statistics in focus 2008 GDP per capita, consumption per capita and comparative price levels in Europe Final results for 2005 and preliminary results for 2006
Our patent and trade mark attorneys are here to help you protect and profit from your ideas, making sure they re working every bit as hard as you do.
 Our patent and trade mark attorneys are here to help you protect and profit from your ideas, making sure they re working every bit as hard as you do. Our people work with everyone from multi-nationals
SMALL AND MEDIUM-SIZED ENTERPRISES' ACCESS TO FINANCE
 EUROPEAN SEMESTER THEMATIC FICHE SMALL AND MEDIUM-SIZED ENTERPRISES' ACCESS TO FINANCE Thematic fiches are supporting background documents prepared by the services of the Commission in the context of the
EN 43 EN 2. FAST AND ULTRA-FAST INTERNET ACCESS. 2.1. Introduction
 2. FAST AND ULTRA-FAST INTERNET ACCESS 2.1. Introduction Over 99.9% of European homes can have access to broadband of at least a basic quality, when considering all technologies (including fixed, fixed-wireless,
Comparison of annuity markets (OECD National Annuity Markets: Features and Implications, Rusconi 2008) Mercer
 Mercer") May 2009 Retirement Income/Annuities Around the World What US Policy Makers Might Learn Barbara Marder, Baltimore Global Defined Contribution Consulting Leader www.mercer.com 1 Comparison of annuity markets
May 2009 Retirement Income/Annuities Around the World What US Policy Makers Might Learn Barbara Marder, Baltimore Global Defined Contribution Consulting Leader www.mercer.com 1 Comparison of annuity markets
SURVEY OF SCHOOLS: ICT IN EDUCATION COUNTRY PROFILE: CZECH REPUBLIC
 SURVEY OF SCHOOLS: ICT IN EDUCATION COUNTRY PROFILE: CZECH REPUBLIC November 2012 This report was prepared by the Contractor: European Schoolnet and University of Liège under contract SMART 2010/0039.
Broadband Coverage in Europe Final Report 2011 Survey Data as of 31 December 2010. DG INFSO 80106 C December 2011 IDATE 1
 Broadband Coverage in Europe Final Report 2011 Survey Data as of 31 December 2010 DG INFSO 80106 C December 2011 IDATE 1 Table of contents 1. Methodological notes...6 2. Executive summary...8 3. European
I have asked for asylum in the EU which country will handle my claim?
 EN I have asked for asylum in the EU which country will handle my claim? A Information about the Dublin Regulation for applicants for international protection pursuant to article 4 of Regulation (EU) No
EU citizens attitudes towards alcohol
 Special Eurobarometer 331 European Commission EU citizens attitudes towards alcohol Fieldwork: October 2009 Publication: April 2010 Special Eurobarometer 331 / Wave TNS Opinion & Social This survey was
Public Debt and Contingent Liabilities: A Cross-Country Comparison
 Public Debt and Contingent Liabilities: A Cross-Country Comparison Melchior Vella and Gevit Duca * 1. Contingent Liabilities 1.1 What are contingent liabilities? Contingent liabilities are obligations
European Research Council
 ERC Starting Grant Outcome: Indicative statistics Reproduction is authorised provided the source ERC is acknowledged ERCEA/JH. ERC Starting Grant: call Submitted and selected proposals by domain Submitted
Cable Industry Facts: the story behind the numbers
 IHS TECHNOLOGY Presentation Cable Industry Facts: the story behind the numbers 12 th March 2015 technology.ihs.com Ben Keen, Chief Analyst, IHS Technology Ben.keen@ihs.com Cable faces challenges in an
Implementing the cooperation mechanisms of the RES directive current status and open questions
 Implementing the cooperation mechanisms of the RES directive current status and open questions Corinna Klessmann, Ecofys Germany RE-SHAPING Workshop, Vilnius, 16.05.2011 Supported by Intelligent Energy
AIDS Prevention. Fieldwork September to December 2005 Publication February 2006
 Special Eurobarometer European Commission AIDS Prevention Fieldwork September to December 2005 Publication February 2006 Special Eurobarometer 240 / Wave 64.1 and 64.3 TNS Opinion & Social This survey
Tourism trends in Europe and in Mediterranean Partner Countries, 2000-2006
 Industry, trade and services Author: Ulrich SPÖREL, Volker TÄUBE Statistics in focus 95/28 Tourism trends in Europe and in Mediterranean Partner Countries, 2-26 Tourism is a growth industry in Europe and
Fieldwork: November December 2010 Publication: June 2011. http://ec.europa.eu/public_opinion/index_en.htm
 Special Eurobarometer European Commission SPECIAL EUROBAROMETER 359 Attitudes on Data Protection and Electronic Identity in the European Union REPORT Fieldwork: November December 2010 Publication: June
The coverage rate of social benefits. Research note 9/2013
 Research note 9/2013 SOCIAL SITUATION OBSERVATORY INCOME DISTRIBUTION AND LIVING CONDITIONS APPLICA (BE), EUROPEAN CENTRE FOR THE EUROPEAN CENTRE FOR SOCIAL WELFARE POLICY AND RESEARCH (AT), ISER UNIVERSITY
I have asked for asylum in the EU which country will handle my claim?
 EN I have asked for asylum in the EU which country will handle my claim? A Information about the Dublin Regulation for applicants for international protection pursuant to article 4 of Regulation (EU) No
Private Sector Debt Dívida do Sector Privado. dossiers. Economic Outlook Conjuntura Económica. Conjuntura Económica.
 dossiers Economic Outlook Private Sector Debt Dívida do Sector Privado Last Update Última Actualização:12/08/2015 Portugal Economy Probe (PE Probe) Prepared by PE Probe Preparado por PE Probe Copyright
ANALYSIS OF THE STAKEHOLDER CONSULTATION ON
 ANALYSIS OF THE STAKEHOLDER CONSULTATION ON Science and Technology, the key to Europe s future: guidelines for future European policy to support research COM(353)2004 DG Research, European Commission,
the environment towards Special Eurobarometer 365 Special Eurobarometer 365 / Wave EB75.2 TNS opinion & social This document of the authors.
 Special Eurobarometer 365 European Commission Attitudes of European citizens towards the environment REPORT Special Eurobarometer 365 / Wave TNS opinion & social Fieldwork: April-May 2011 Publication:
Factsheet Swiss European Mobility Programme (SEMP/ex-Erasmus)
") Factsheet Swiss European Mobility Programme (SEMP/ex-Erasmus) Academic year 2016-2017 1. Institutional Information 1.1. Institutional details Name of the institution Code Institution website Online course
Factsheet Swiss European Mobility Programme (SEMP/ex-Erasmus) Academic year 2016-2017 1. Institutional Information 1.1. Institutional details Name of the institution Code Institution website Online course
Voluntary health insurance and health care reforms
 Voluntary health insurance and health care reforms Sarah Thomson Senior Research Fellow, European Observatory Deputy Director, LSE Health IMF conference, Paris, 21 st June 2011 Health financing policy