Rainfall Distributions. Joseph P. Wilson, PH, PE Sarah Simon, PE Allgeier, Martin and Associates, Inc. Hydro Division Rolla, Missouri
|
|
|
- Carol Adams
- 7 years ago
- Views:
Transcription
1 Rainfall Distributions Joseph P. Wilson, PH, PE Sarah Simon, PE Allgeier, Martin and Associates, Inc. Hydro Division Rolla, Missouri
2 Session Objectives Provide background on rainfall used in hydrologic modeling. Identify standard ways of presenting rainfall data. Introduce various techniques for determining the temporal distribution of rainfall. Examples and comparisons.
3 Hydrologic Modeling Estimate runoff: Design of improvements Determine flood risk for a location Replicate an observed event Based on an acceptable level of risk Annual Exceedance Probability, the likelihood a flowrate will be equaled or exceeded in any given year, 1/Tr
4 Hydrologic Modeling How much rainfall runs off? How long does it take for the rainfallrunoff transformation/translation to occur? The key input elements in hydrologic analysis are: Rainfall Watershed physical characteristics
5 Rainfall Characteristics Depth Duration Temporal Distribution Frequency, statistics Spatial Distribution
6 Rainfall Characteristics Short duration, high intensity, smaller coverage area, typically associated with thunderstorms. Longer duration, lower intensity, greater depths, larger coverage area, typically associated with frontal storms
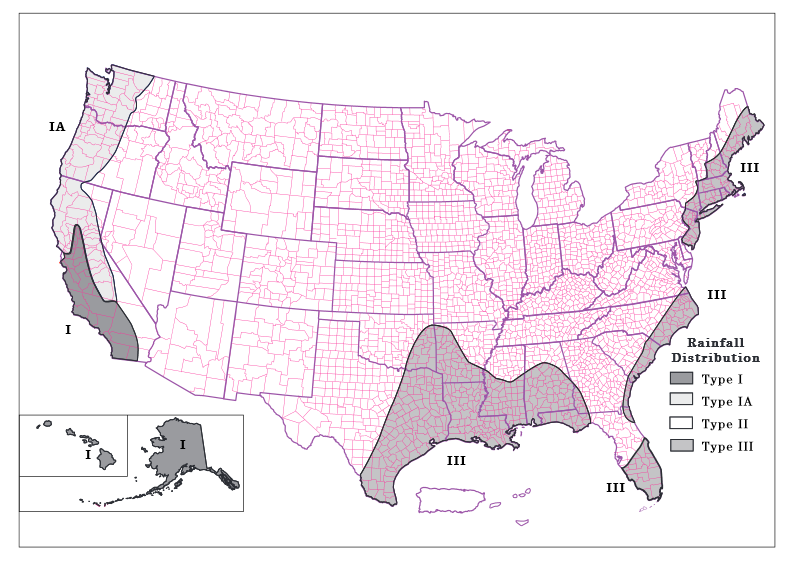
7 Precipitation Data Sources Rainfall frequency data are published on-line by the National Oceanic and Atmospheric Administration (NOAA). Missouri data is included in Atlas 14, Region 8. Historical observed data records are also maintained by NOAA. Probable Maximum Precipitation estimates are available in National Weather Service Hydrometeorological Report 51 (HMR 51). Doppler estimates are available from the National Weather Service.
8 Design Storms Most jurisdictions in this region use the design storm approach to hydrologic modeling for design and analysis. A design storm is a way of representing storm rainfall with respect to depth, duration, temporal distribution, frequency and spatial distribution. Based on the assumption that, under average conditions, a rainfall of a given frequency will produce runoff of the same frequency.
9 Representation of Rainfall Total depth Incremental depth or intensity per time period Cumulative mass curve Depth or Intensity hyetograph Intensity-Duration-Frequency curves Depth-Duration-Frequency curves
10 IDF Curve
11 DDF Curve
12 Depth vs. Area After Hershfield, 1961.
13 Depth, Inches Depth, Inches Graphical Rainfall Depiction Time, minutes Time, minutes Hyetograph Cumulative Mass Curve
14 Rainfall Distributions The selected design storm for hydrologic modeling has a significant impact on the computed results. Rainfall Distributions are generally categorized as: Distributed in a reasonable manner Statistical analysis of a gage network Nested intensity
15 Example Distributions Uniform Yen-Chow Alternating Block Keifer & Chu (Chicago Method) Pilgrim-Cordery distribution SCS Distributions Huff s Quartile Distributions NOAA Atlas 14 Temporal Distributions
16 Uniform Distribution Uniform Distribution assumes rainfall is constant over the duration of the event. Uniform distribution is generally used with the rational method. Unsuitable for use in hydrograph modeling.
17 Nested Intensity Nested intensity hyetographs contain the desired AEP intensity for any given duration within the storm. Example: for a 24-hour storm, 1% AEP event, there is a 10-minute period that has the 10-minute, 1% AEP intensity, a 30-minute period that contains the 30- minute, 1% AEP intensity and so on
18 Alternating Block Method Is a nested intensity method Design and Construction of Urban Stormwater Management Systems, ASCE 1992
19 Alternating Block Advantages Derived from local data Applicable to multiple durations Disadvantages Naturally occurring storms do not occur in this manner Yields relatively high peak discharges
20 Kiefer & Chu (Chicago Method) Nested Intensity, limited to maximum duration of 3-hours. Intensity based on a power curve, IDF relationship. Location parameter, advance, ratio of the time to the most intense period of rainfall to the storm duration. Advance varies by location, computed from observed rainfall, for Chicago 0.375, for Rolla 0.42.
21 Kiefer & Chu (Chicago Method) Journal of the Hydraulics Division, ASCE 1957
22 Chicago Method Advantages Derived from local data Disadvantages Original method investigated for up to 3- hour duration Requires statistical analysis of local rainfall to determine parameters
23 NRCS 24-Hour Distributions Nested Intensity Developed by SCS using rural gages, expanded on work by Hershfield, 1961
24
25 NRCS 24-Hour Type II Nested Intensity. 44% of storm rainfall occurs in less than one hour. A time transform for 6-hr, 12-hr and 18-hr durations is available from NRCS.
26 SCS Type II Advantages Applicable to various durations. Widely accepted. Disadvantages Yields high peak discharge rates. Significantly over-predicts frequent events. Observed rainfall events do not occur in this manner.
27 Pilgrim-Cordery Method Ranking Method. Arbitrary number of severe storms selected. Storm periods ranked by order of occurrence and by percent of overall storm depth.
28 Pilgrim-Cordery
29 Pilgrim-Cordery Distribution
30 Pilgrim-Cordery Advantages Derived from local data. Looks like observed rainfall. Produces results comparable to results from observed events. Distribution varies by duration Disadvantages Requires duration sensitivity analysis. Requires analysis of local rainfall.
31 Yen-Chow Statistically based on method of moments, results in a triangular hyetograph. Journal of the Hydraulics Division, ASCE 1980
32 Yen-Chow Advantages Derived from local data. Relatively easy to use. Disadvantages Requires duration sensitivity analysis. Requires analysis of local rainfall. Produces peak flows lower than observed values.
33 Huff s Quartile Distributions Huff analyzed a network of 49 raingages. Concluded that the majority of rainfall occurred in a relatively short period of time compared to the overall storm duration. Classified storms based on the quarter of the storm containing the most rainfall.
34 1 st Quartile 2 nd Quartile 3 rd Quartile 4 th Quartile Source: Time Distribution of Heavy Rainstorms in Illinois, Floyd A. Huff, 1990
35 1 st Quartile Time Distribution of Heavy Rainstorms in Illinois, Floyd A. Huff, 1990
36 Huff s continued 1 st quartile storms tended to have a duration of six or less hours. 2 nd quartile twelve or less. 3 rd quartile 24 or less. 4 th quartile greater than 24 hours.
37
38 Huff s Quartile Distributions Advantages Derived from regional data Produces results consistent with observed data Distribution varies by duration Disadvantages Requires duration sensitivity analysis
39 So what? Compare the distributions Example: Runoff model showing the impact on results.
40
41
42 Comparison of NRCS Type II Distribution and Alternating Block Distribution for Rolla, MO
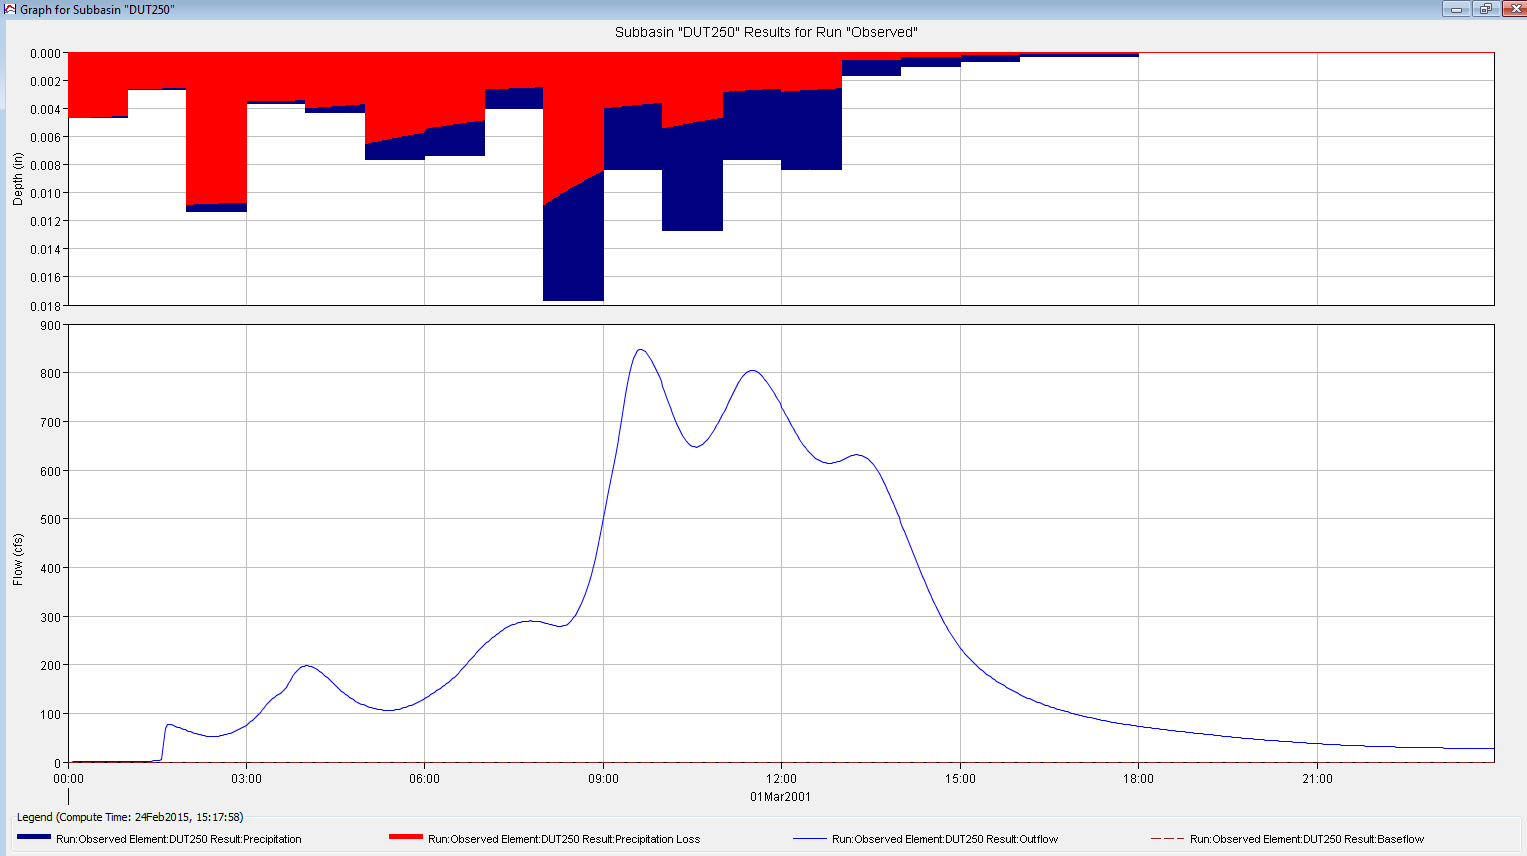
43 Dutro Carter Creek EXAMPLE
44 Dutro Carter Creek Watershed 6.0 Sq. Miles
45
46 Modeling Observed event, 3.13 inches in 18 hrs. This corresponds to an event with a 50%-20% AEP. Modeled same depth/duration using: Huff s Quartile NRCS Type II Rolla Alternating Block (nested intensity)
47

48

49 Maximum depth in Observed event
50 MODELED HYDROGRAPH FROM OBSERVED RAINFALL
51 RUNOFF HYDROGRAPH FROM HUFF S 3 RD QUARTILE DISTRIBUTION RUNOFF HYDROGRAPH FROM OBSERVED RAINFALL
52 RUNOFF HYDROGRAPH FROM ROLLA 2-YR NESTED INTENSITY RUNOFF HYDROGRAPH FROM HUFF S 3 RD QUARTILE DISTRIBUTION RUNOFF HYDROGRAPH FROM OBSERVED RAINFALL
53
54 Discuss among yourselves A higher computed peak flowrate is conservative. Yes, no, it depends What about systems with storage? Comparing pre-project with post-project conditions?
55 Example 2, Small Watershed Small watershed response time is dominated by the overland flow component of runoff. 128 acres, Curve Number 85.

56
57 Results 3.13 inches in 18 hours, 50%>AEP>20% Observed, 40 cfs Huff s, 42 cfs Rolla Nested Intensity, 64 cfs SCS, 112 cfs 7.2 inches in 24 hours, 1% AEP Huff s, 85 cfs SCS, 332 cfs
58 Advantages and Disadvantages Uniform Distribution Easy to apply. Does not represent observed rainfall. Not suitable for most design situations.
59 Advantages and Disadvantages Nested Intensity Distributions Rainfall does not generally occur in this manner. Avoids multiple runs to determine critical storm duration. Tends to overestimate intensities, particularly for frequent events. Can be derived from local data.
60 Advantages and Disadvantages Statistical Analysis Generally requires a substantial amount of analysis to initially determine the shape parameters of the distribution. Is appropriate for the region. Most methods require critical duration analysis while modeling. Typically produce the most realistic results.
61 A Comparison of Temporal Distributions: ATLAS 14 VS. HUFF S QUARTILE
62 Atlas 14 vs. Huff s Quartile Topics for Comparison Data Methodology Design

63 What is Atlas 14? Precipitation-Frequency Atlas of the United States Published by the National Oceanic and Atmospheric Administration
64 What is Atlas 14? Missouri rainfall frequency estimates are included in Atlas 14, Volume 8, Version 2.0, released April Supersedes Bulletin 71 for rainfall frequency data in Missouri. What about the temporal distributions in Atlas 14?
65
66
67 Atlas 14 vs. Huff s Quartile Huff s Quartile 49 rural gages in a 400- square-mile network (east-central Illinois) 12 additional urban gages in Champaign- Urbana area
68 Atlas 14 vs. Huff s Quartile Atlas gages reporting at least hourly 11,918 gages reporting daily 857,000- square-mile network
69 Atlas 14 vs. Huff s Quartile Atlas 14 Geography: Highly varied, divided into 4 regions Huff s Quartile Geography: Flat plains year period of record for hourly gages, ending in 2011 or year period of record ( ) 111,732 precipitation cases analyzed 261 storms analyzed
70 Methodology Storms Used in Study Atlas 14 Exceeded 50% AEP (2-yr) Huff s Quartile One or more gages recorded more than 1 inch. Network mean rainfall exceeded 0.5 inch.
71 Methodology Definition of Quartile Storms (or cases) were grouped into four categories by the quartile in which the greatest percentage of the total precipitation occurred. Atlas 14: 6-hr storm was not divided into even quartiles.
72 Methodology Definition of Storm Event Huff s Quartile Single Storm approach a rain period separated from preceding and succeeding rainfall by 6 hours or more. A period of continuous precipitation
73 Methodology Atlas 14 NOT a Single Storm approach Definition of Precipitation Case computed as the total accumulation over a specific duration. (set time period) may contain parts of one or more storms. Not necessarily a period of continuous precipitation
74 Methodology Definition of Storm Event
75 Methodology Definition of Storm Event 12-hour storm 6-hour storm Huff s Quartile
76 Methodology Definition of Storm Event 12-hour storm 6-hour storm 6-hour storm Huff s Quartile
77 Methodology Definition of Storm Event 12-hour storm 6-hour storm 6-hour storm 1-hour storm 1-hour storm Huff s Quartile
78 Methodology Definition of Storm Event
79 Methodology 12-hour storm Definition of Storm Event Atlas 14
80 Methodology 12-hour storm Atlas 14 Definition of Storm Event 12-hour storm
81 Methodology Definition of Storm Event 24-hour storm Atlas hour storm
82 Methodology So What? Atlas 14 Huff s Quartile Set-time-period approach May contain long periods of no precipitation May contain parts of one or more storm More front-loaded cases (first quartile dominant)!! Single-storm approach Looks at storm (or most intense portion) as a whole Dominant quartile varied by storm duration
83 Design Guidance (or lack thereof) Atlas 14 Use Atlas 14 for your rainfall frequency data Atlas 14 temporal distributions are not recommended for design purposes. No guidance in Atlas 14 for use in design Presented as informational only
84 Design Guidance Huff s Quartile It is recommended for runoff computations related to the design and operation of runoff control structures. Provides guidance on which temporal distribution to use: First Quartile for storm durations of 6 hours or less Second Quartile for storm durations 6.1 through 12.0 hours Third Quartile for storm durations 12.1 through 24.0 hours Fourth Quartile for storm durations over 24.1 hours
85 Conclusions Atlas 14 vs. Huff s Quartile Use the right tool for the job: Rainfall frequency data: Atlas 14 Temporal Distribution: Huff s Quartile
86 Summary Design storms will continue to be used in routine design. A design storm must be appropriate for: The region The objective Method that yields the highest discharge is not always conservative. Atlas 14 temporal distributions are more informational in nature, not design oriented.
87 Questions?
The Rational Method. David B. Thompson Civil Engineering Deptartment Texas Tech University. Draft: 20 September 2006
 The David B. Thompson Civil Engineering Deptartment Texas Tech University Draft: 20 September 2006 1. Introduction For hydraulic designs on very small watersheds, a complete hydrograph of runoff is not
Computing Stormwater Runoff Rates and Volumes
 New Jersey Stormwater Best Management Practices Manual February 2004 C H A P T E R 5 Computing Stormwater Runoff Rates and Volumes This chapter discusses the fundamentals of computing stormwater runoff
Rainfall Intensities for Southeastern Arizona
 Rainfall Intensities for Southeastern Arizona By Herbert B. Osborn, Member, ASCE1 and Kenneth G. Renard, Fellow, ASCE1 Introduction Small watershed storm runoff in the southwestern United States is dominated
CHAPTER 2 HYDRAULICS OF SEWERS
 CHAPTER 2 HYDRAULICS OF SEWERS SANITARY SEWERS The hydraulic design procedure for sewers requires: 1. Determination of Sewer System Type 2. Determination of Design Flow 3. Selection of Pipe Size 4. Determination
The Mississippi River & Tributaries Project
 The Mississippi River & Tributaries Project The Mississippi River & Tributaries (MR&T) project was authorized by the 1928 Flood Control Act. Following the devastating 1927 flood, the nation was galvanized
Flash Flood Science. Chapter 2. What Is in This Chapter? Flash Flood Processes
 Chapter 2 Flash Flood Science A flash flood is generally defined as a rapid onset flood of short duration with a relatively high peak discharge (World Meteorological Organization). The American Meteorological
Rational Method Hydrologic Calculations with Excel. Rational Method Hydrologic Calculations with Excel, Course #508. Presented by:
 Rational Method Hydrologic Calculations with Excel, Course #508 Presented by: PDH Enterprises, LLC PO Box 942 Morrisville, NC 27560 www.pdhsite.com Calculation of peak storm water runoff rate from a drainage
Stormwater Drainage Design for Parking Lots
 PDHonline Course C201 (4 PDH) Stormwater Drainage Design for Parking Lots 2012 PDH Online PDH Center 5272 Meadow Estates Drive Fairfax, VA 22030-6658 Phone & Fax: 703-988-0088 www.pdhonline.org www.pdhcenter.com
2D Modeling of Urban Flood Vulnerable Areas
 2D Modeling of Urban Flood Vulnerable Areas Sameer Dhalla, P.Eng. Dilnesaw Chekol, Ph.D. A.D. Latornell Conservation Symposium November 22, 2013 Outline 1. Toronto and Region 2. Evolution of Flood Management
10/4/2012. 40 slide sample of Presentation. Key Principles to Current Stormwater Management
 40 slide sample of Presentation Please contact mhoalton@pacewater.com if you would like the complete presentation Key Principles to Current Stormwater Management Distributed Control Measures Integrated
THUNDERSTORM RAINFALL IN THE SOUTHWEST -*
 Purchased by \hz U. S. Department or Agriculture for official use SOME REGIONAL DIFFERENCES IN RUNOFF-PRODUCING THUNDERSTORM RAINFALL IN THE SOUTHWEST -* H. B. 03born - INTRODUCTION Regional differences
Basic Hydrology. Time of Concentration Methodology
 Basic Hydrology Time of Concentration Methodology By: Paul Schiariti, P.E., CPESC Mercer County Soil Conservation District What is the Time of Concentration? The time it takes for runoff to travel from
Estimating Potential Reduction Flood Benefits of Restored Wetlands
 Estimating Potential Reduction Flood Benefits of Restored Wetlands Kenneth W. Potter University of Wisconsin Introduction Throughout the summer of 1993 a recurring question was the impact of wetland drainage
TENNESSEE GAS PIPELINE COMPANY, L.L.C.
 TENNESSEE GAS PIPELINE COMPANY, L.L.C. HYDROLOGIC & HYDRAULIC CALCULATIONS FOR WATERBODIES CROSSED BY CONNECTICUT PIPELINE EXPANSION PROJECT CONNECTICUT LOOP Submitted by: Tennessee Gas Pipeline Company,
Argonne National Laboratory
 Argonne National Laboratory Using Climate Data to Inform Critical Infrastructure Resilience and Urban Sustainability Decisionmaking National Academy of Sciences Roundtable on Science and Technology for
Climate Extremes Research: Recent Findings and New Direc8ons
 Climate Extremes Research: Recent Findings and New Direc8ons Kenneth Kunkel NOAA Cooperative Institute for Climate and Satellites North Carolina State University and National Climatic Data Center h#p://assessment.globalchange.gov
Havnepromenade 9, DK-9000 Aalborg, Denmark. Denmark. Sohngaardsholmsvej 57, DK-9000 Aalborg, Denmark
 Urban run-off volumes dependency on rainfall measurement method - Scaling properties of precipitation within a 2x2 km radar pixel L. Pedersen 1 *, N. E. Jensen 2, M. R. Rasmussen 3 and M. G. Nicolajsen
AZ EGER-PATAK HIDROLÓGIAI VIZSGÁLATA, A FELSZÍNI VÍZKÉSZLETEK VÁRHATÓ VÁLTOZÁSÁBÓL ADÓDÓ MÓDOSULÁSOK AZ ÉGHAJLATVÁLTOZÁS HATÁSÁRA
 AZ EGER-PATAK HIDROLÓGIAI VIZSGÁLATA, A FELSZÍNI VÍZKÉSZLETEK VÁRHATÓ VÁLTOZÁSÁBÓL ADÓDÓ MÓDOSULÁSOK AZ ÉGHAJLATVÁLTOZÁS HATÁSÁRA GÁBOR KEVE 1, GÉZA HAJNAL 2, KATALIN BENE 3, PÉTER TORMA 4 EXTRAPOLATING
Using probability to understand 100-year storms
 1 + Using probability to understand 100-year storms Grade Level: 5-7 Activity Duration: 30-45 minutes Overview: I. Storm stories II. 100-year Storm Probability III. Delineating Storms in NE Minnesota Summary:
Design of Urban Highway Drainage FHWA-TS-79-225 August 1979
 Design of Urban Highway Drainage FHWA-TS-79-225 August 1979 Welcome to Design of Urban Highway Drainage Table of Contents Preface Notice DISCLAIMER: During the editing of this manual for conversion to
C.3 Workshop Track 2: Sizing Calculations and Design Considerations for LID Treatment Measures
 C.3 Workshop Track 2: Sizing Calculations and Design Considerations for LID Treatment Measures Jill Bicknell, P.E., EOA, Inc. Santa Clara Valley Urban Runoff Pollution Prevention Program Presentation Overview
Next Generation Flood Alert in Houston
 Next Generation Flood Alert in Houston Philip B. Bedient Civil and Environmental Eng., Rice University Houston, TX Major Causes of Urban Flooding (Excess Water that Inundates) Highly Developed (urbanized)
Micromanagement of Stormwater in a Combined Sewer Community for Wet Weather Control The Skokie Experience
 Micromanagement of Stormwater in a Combined Sewer Community for Wet Weather Control The Skokie Experience Robert W. Carr 1 * and Stuart G. Walesh 2 1 Water Resources Modeling, LLC, 4144 S. Lipton Ave,
Application of Monte Carlo Simulation Technique with URBS Model for Design Flood Estimation of Large Catchments
 Application of Monte Carlo Simulation Technique with URBS Model for Design Flood Estimation of Large Catchments J. Charalambous ab, A. Rahman c and D. Carroll a a City Design, Brisbane City Council, hc@brisbane.qld.gov.au
06 - NATIONAL PLUVIAL FLOOD MAPPING FOR ALL IRELAND THE MODELLING APPROACH
 06 - NATIONAL PLUVIAL FLOOD MAPPING FOR ALL IRELAND THE MODELLING APPROACH Richard Kellagher 1, Mike Panzeri 1, Julien L Homme 1, Yannick Cesses 1, Ben Gouldby 1 John Martin 2, Oliver Nicholson 2, Mark
Fort Dodge Stormwater Master Planning. Prepared By: Ralph C. Stark, Jr., P.E., C.F.M. Joel N. Krause, P.E., C.F.M.
 Fort Dodge Stormwater Master Planning Prepared By: Ralph C. Stark, Jr., P.E., C.F.M. Joel N. Krause, P.E., C.F.M. Project Location Project Background Flooding History Localized flooding and storm sewer
Please click on the tutorial most fitting of your expertise in order to learn about the features of the visualization tool.
 Introduction Welcome to the Indian Creek Conservation Reserve Program (CRP) visualization tool. This tool was developed by the University of Iowa - Institute for Hydroscience and Research (IIHR) as part
Hydrologic Modeling using HEC-HMS
 Hydrologic Modeling using HEC-HMS Prepared by Venkatesh Merwade School of Civil Engineering, Purdue University vmerwade@purdue.edu April 2012 Introduction The intent of this exercise is to introduce you
PERFORMANCE OF DAMS AND SPILLWAYS 2009 GEORGIA FLOOD. Randall P. Bass, P.E. 1, 2. James R. Crowder, P. Joseph S. Monroe, P.E.
 PERFORMANCE OF DAMS AND SPILLWAYS 2009 GEORGIA FLOOD Randall P. Bass, P.E. 1, 2 James R. Crowder, P. Joseph S. Monroe, P.E. 3 ABSTRACT During the latter part of September 2009, the Atlanta metro area received
1800 Washington Boulevard, Baltimore, MD 21230-1718 www.mde.maryland.gov 410-537-3000 800-633-6101 TTY Users 800-735-2258 Larry Hogan, Governor Boyd
 ENVIRONMENTAL SITE DESIGN (ESD) REDEVELOPMENT EXAMPLES OCTOBER 2010 1800 Washington Boulevard, Baltimore, MD 21230-1718 www.mde.maryland.gov 410-537-3000 800-633-6101 TTY Users 800-735-2258 Larry Hogan,
Chapter 4. Flood Risk Assessment
 Chapter 4 Flood Risk Assessment Chapter Overview Any floodplain management program must be established on a sound technical and scientific basis in order to be effective, whether for flood loss reduction
BLACK/HARMONY/FAREWELL CREEK WATERSHED EXISTING CONDITIONS REPORT CHAPTER 12 - STORMWATER MANAGEMENT
 Harmony Creek subwatershed Harmony Creek subwatershed BLACK/HARMONY/FAREWELL CREEK WATERSHED EXISTING CONDITIONS REPORT CHAPTER 12 - STORMWATER MANAGEMENT April 2011 TABLE OF CONTENTS 1.0 INTRODUCTION...
Westerly Creek, A Poster Child for Understanding the Benefit of Stormwater Investment
 Westerly Creek, A Poster Child for Understanding the Benefit of Stormwater Investment Presented at the ASFPM Annual Conference Atlanta, GA June 1 June 5 2015 Jon Villines, EIT, CFM Aurora Water Alan Turner,
Appendix C - Risk Assessment: Technical Details. Appendix C - Risk Assessment: Technical Details
 Appendix C - Risk Assessment: Technical Details Page C1 C1 Surface Water Modelling 1. Introduction 1.1 BACKGROUND URS Scott Wilson has constructed 13 TUFLOW hydraulic models across the London Boroughs
URBAN DRAINAGE CRITERIA
 URBAN DRAINAGE CRITERIA I. Introduction This division contains guidelines for drainage system design and establishes a policy for recognized and established engineering design of storm drain facilities
Chicago and its suburbs experienced a record
 103 Universities Council on Water Resources Issue 146, Pages 103-109, December 2010 Stormwater Management for a Record Rainstorm at Chicago Stanley A. Changnon University of Illinois, Champaign, IL Abstract:
PRECIPITATION AND EVAPORATION
 PRECIPITATION AND EVAPORATION OBJECTIVES Use historical data to analyze relationships between precipitation, evaporation and stream flow in the San Antonio River Basin TOPICS Water cycle Precipitation
with Climate Change Risk: MWCOG Climate Impacts Symposium May 21, 2012
 Storm Sewer Infrastructure Planning with Climate Change Risk: A Case Study from Alexandria VA Laurens van der Tak, PE, D.WRE MWCOG Climate Impacts Symposium May 21, 2012 Presentation Topics Overview of
The AIR Inland Flood Model for the United States In Spring 2011, heavy rainfall and snowmelt produced massive flooding along the Mississippi River,
 The AIR Inland Flood Model for the United States In Spring 2011, heavy rainfall and snowmelt produced massive flooding along the Mississippi River, inundating huge swaths of land across seven states. As
Climate of Illinois Narrative Jim Angel, state climatologist. Introduction. Climatic controls
 Climate of Illinois Narrative Jim Angel, state climatologist Introduction Illinois lies midway between the Continental Divide and the Atlantic Ocean, and the state's southern tip is 500 miles north of
SYNTHESIS OF TxDOT STORM DRAIN DESIGN
 SYNTHESIS OF TxDOT STORM DRAIN DESIGN by David Thompson Associate Professor Department of Civil Engineering Texas Tech University Xing Fang Associate Professor Department of Civil Engineering Lamar University
Comparison of Temporal Rainfall Distributions for Near Probable Maximum Precipitation Storm Events for Dam Design
 Comparison of Temporal Rainfall Distributions for Near Probable Maximum Precipitation Storm Events for Dam Design James N Moore, P. E., Civil Engineer and Ray C Riley, P. E., Watershed Planning Specialist
City of Toronto Wet Weather Flow Monitoring Network: Baseline Conditions 2008 2011
 City of Toronto Wet Weather Flow Monitoring Network: Baseline Conditions 2008 2011 Sharing Loading Estimation Experiences Workshop Tuesday, January 20, 2015 Presented By: Derek Smith City of Toronto Flood
How To Understand And Understand The Flood Risk Of Hoang Long River In Phuon Vietnam
 FLOOD HAZARD AND RISK ASSESSMENT OF HOANG LONG RIVER BASIN, VIETNAM VU Thanh Tu 1, Tawatchai TINGSANCHALI 2 1 Water Resources University, Assistant Professor, 175 Tay Son Street, Dong Da District, Hanoi,
FLOOD INFORMATION SERVICE EXPLANATORY NOTES
 FLOOD INFORMATION SERVICE EXPLANATORY NOTES Part 1 About the flood maps Limitations of the mapping What the maps don t show Where to find more information Definitions of words used to describe flooding.
PUERTO RICO AND U.S. VIRGIN ISLANDS PRECIPITATION FREQUENCY PROJECT
 PUERTO RICO AND U.S. VIRGIN ISLANDS PRECIPITATION FREQUENCY PROJECT Twenty-fourth Progress Report 1 April 2006 through 30 June 2006 Hydrometeorological Design Studies Center Hydrology Laboratory Office
Real Time Flood Alert System (RTFAS) for Puerto Rico
 for Puerto Rico") Prepared in cooperation with the Puerto Rico Emergency Management Agency (PREMA) Real Time Flood Alert System (RTFAS) for Puerto Rico Overview The Real Time Flood Alert System is a web-based computer program,
Prepared in cooperation with the Puerto Rico Emergency Management Agency (PREMA) Real Time Flood Alert System (RTFAS) for Puerto Rico Overview The Real Time Flood Alert System is a web-based computer program,
Appendix F Benefit-Cost Analysis of Flood Protection Measures
 Appendix F Benefit-Cost Analysis of Flood Protection Measures Acronyms used in Appendix F: AA B AA C AA D BC BFE EAD FEMA NED O&M PV RED USACE Average Annual Benefits Average Annual Cost Average Annual
Land Disturbance, Erosion Control and Stormwater Management Checklist. Walworth County Land Conservation Department
 Land Disturbance, Erosion Control and Stormwater Management Checklist Walworth County Land Conservation Department The following checklist is designed to assist the applicant in complying with the Walworth
City of London Climate Change Adaptation Strategy Dealing with Extreme Rainfall Events
 City of London Climate Change Adaptation Strategy Dealing with Extreme Rainfall Events May 29, 2014 Presented by: Berta Krichker M.Eng., FEC, P.Eng. Manager of Stormwater Unit Environmental and Engineering
Storm Drainage Design and Technical Criteria Manual. City of Brookings, SD
 Storm Drainage Design and Technical Criteria Manual City of Brookings, SD May, 2006 City of Brookings Storm Drainage Manual Ecological Resource Consultants, Inc. Storm Drainage Design and Technical Criteria
ROSE CREEK WATERSHED HYDROLOGIC, HYDRAULIC, SEDIMENT TRANSPORT, AND GEOMORPHIC ANALYSES TASK 1 EXISTING DATA AND INFORMATION SUMMARY REPORT BACKGROUND
 ROSE CREEK WATERSHED HYDROLOGIC, HYDRAULIC, SEDIMENT TRANSPORT, AND GEOMORPHIC ANALYSES TASK 1 EXISTING DATA AND INFORMATION SUMMARY REPORT BACKGROUND The Rose Creek Watershed (RCW) consists of three planning
1 in 30 year 1 in 75 year 1 in 100 year 1 in 100 year plus climate change (+30%) 1 in 200 year
 1 in 200 year") Appendix C1 Surface Water Modelling 1 Overview 1.1 The Drain London modelling was designed to analyse the impact of heavy rainfall events across each London borough by assessing flow paths, velocities
Appendix C1 Surface Water Modelling 1 Overview 1.1 The Drain London modelling was designed to analyse the impact of heavy rainfall events across each London borough by assessing flow paths, velocities
Flood Risk Analysis considering 2 types of uncertainty
 US Army Corps of Engineers Institute for Water Resources Hydrologic Engineering Center Flood Risk Analysis considering 2 types of uncertainty Beth Faber, PhD, PE Hydrologic Engineering Center (HEC) US
A Self Assessment to Address Climate Change Readiness in Your Community Midwest Region
 A Self Assessment to Address Climate Change Readiness in Your Community Midwest Region 0 Climate Change Readiness Index A Self Assessment to Address Climate Change Readiness in Your Community Communities
Stormwater Best Management Practices (BMP) Performance Analysis
 Performance Analysis") Stormwater Best Management Practices (BMP) Performance Analysis Revised Document: March 2010 (Original Document: December 2008) Prepared for: United States Environmental Protection Agency Region 1 5 Post
Stormwater Best Management Practices (BMP) Performance Analysis Revised Document: March 2010 (Original Document: December 2008) Prepared for: United States Environmental Protection Agency Region 1 5 Post
The Natural Hazards Project - 5 Flood and Surface Water Flooding. Flood estimation in small catchments
 The Natural Hazards Project - 5 Flood and Surface Water Flooding Flood estimation in small catchments 60 2013 R A P P O R T NIFS - Flood estimation in small catchments (Literature study) Norwegian Water
WATER QUALITY MODELING TO SUPPORT THE ROUGE RIVER RESTORATION
 WATER QUALITY MODELING TO SUPPORT THE ROUGE RIVER RESTORATION Edward H. Kluitenberg, P.E., Applied Science, Inc. Gary W. Mercer, P.E., Camp, Dresser and McKee Vyto Kaunelis, Wayne County Department of
The Standardized Precipitation Index
 The Standardized Precipitation Index Theory The Standardized Precipitation Index (SPI) is a tool which was developed primarily for defining and monitoring drought. It allows an analyst to determine the
Ruissellement du Bassin Précipitation Abstractions Hydrogramme Flux de Base. Superposition Routage
 HEC-1 Leçon 11 This lesson will focus on how WMS can be used to develop HEC-1 modeling parameters and not on the fundamental hydrologic principles simulated by HEC-1. 1 Vue D Emsemble Utilisés Couramment
From Civil 3D, with Love
 From Civil 3D, with Love Download the zip file containing the files needed for the exercise. Extract the files to a convenient location on your hard drive before you begin. The files associated with this
Simple Hydrograph Shapes for Urban Stormwater Water Quality Continuous
 XX Simple Hydrograph Shapes for Urban Stormwater Water Quality Continuous Analyses Robert Pitt, John Voorhees, and Caroline Burger Over the years, a number of different approaches have been used to represent
Hydrologic Engineering Techniques for Regional Water Resources Planning
 US Army Corps of Engineers Hydrologic Engineering Center Hydrologic Engineering Techniques for Regional Water Resources Planning October 1969 Approved for Public Release. Distribution Unlimited. TP-17
Hydrologic Aspects of Flood Warning Preparedness Programs
 US Army Corps of Engineers Hydrologic Engineering Center Hydrologic Aspects of Flood Warning Preparedness Programs August 1990 Approved for Public Release. Distribution Unlimited. TP-131 REPORT DOCUMENTATION
CITY OF CHARLOTTE STORM WATER SERVICES CREDIT APPLICATION INSTRUCTION MANUAL
 CITY OF CHARLOTTE STORM WATER SERVICES CREDIT APPLICATION INSTRUCTION MANUAL March 2008 A note to recipients of the Charlotte-Mecklenburg Storm Water Services Credit Application Manual: This is the second
Methods for Determination of Safe Yield and Compensation Water from Storage Reservoirs
 US Army Corps of Engineers Hydrologic Engineering Center Methods for Determination of Safe Yield and Compensation Water from Storage Reservoirs October 1966 Approved for Public Release. Distribution Unlimited.
Triple Bottom Line Analysis for Green Infrastructure A Case Study 2012 ARCADIS
 Triple Bottom Line Analysis for Green Infrastructure A Case Study Imagine 1 25 June the 2013 result Learning Objectives Explain Green Infrastructure (GI) as a strategy for stormwater management Describe
Climate Change Case Study: Flood risk arising from future precipitation changes in Gleniti, Timaru
 Climate Change Case Study: Flood risk arising from future precipitation changes in Gleniti, Timaru Prepared for the NZ Climate Change Office (Ministry for the Environment) by OPUS International Consultants
Objective 4: Enhanced community education, flood awareness and preparedness
 Objective 4: Enhanced community education, flood awareness and preparedness Understanding the extent and full impacts of flooding is essential for planning for potential future pressures on the drainage
Travel Time. Computation of travel time and time of concentration. Factors affecting time of concentration. Surface roughness
 3 Chapter 3 of Concentration and Travel Time Time of Concentration and Travel Time Travel time ( T t ) is the time it takes water to travel from one location to another in a watershed. T t is a component
UNIFIED FACILITIES CRITERIA (UFC) LOW IMPACT DEVELOPMENT
 LOW IMPACT DEVELOPMENT") UNIFIED FACILITIES CRITERIA (UFC) LOW IMPACT DEVELOPMENT APPROVED FOR PUBLIC RELEASE; DISTRIBUTION UNLIMITED UNIFIED FACILITIES CRITERIA (UFC) LOW IMPACT DEVELOPMENT Any copyrighted material included in
UNIFIED FACILITIES CRITERIA (UFC) LOW IMPACT DEVELOPMENT APPROVED FOR PUBLIC RELEASE; DISTRIBUTION UNLIMITED UNIFIED FACILITIES CRITERIA (UFC) LOW IMPACT DEVELOPMENT Any copyrighted material included in
LYNDE CREEK WATERSHED EXISTING CONDITIONS REPORT CHAPTER 12 - STORMWATER MANAGEMENT
 Whitby CLOCA Whitby CLOCA LYNDE CREEK WATERSHED EXISTING CONDITIONS REPORT CHAPTER 12 - STORMWATER MANAGEMENT June 2008 TABLE OF CONTENTS 1.0 INTRODUCTION... 3 2.0 STUDY AREA AND SCOPE... 4 3.0 METHODOLOGY...
Module 6 : Quantity Estimation of Storm Water. Lecture 6 : Quantity Estimation of Storm Water
 1 P age Module 6 : Quantity Estimation of Storm Water Lecture 6 : Quantity Estimation of Storm Water 2 P age 6.1 Factors Affecting the Quantity of Stormwater The surface run-off resulting after precipitation
Missouri Regions Shaped by Land Forms and Geology
 Missouri Regions Shaped by Land Forms and Geology Lesson Abstract Summary: MO GLE: Subject Areas: The students will use various resources to compare and contrast the geology of each Missouri region to
Increasing water availability through juniper control.
 Tim Deboodt, OSU Crook County Extension Agent 498 SE Lynn Blvd. Prineville, OR 97754 541-447-6228 Tim.deboodt@oregonstate.edu Increasing water availability through juniper control. Throughout the region
National Dam Safety Program Technical Seminar #22. When is Flood Inundation Mapping Not Applicable for Forecasting
 National Dam Safety Program Technical Seminar #22 Thursday February 19 th 2015 Emmittsburg, MD When is Flood Inundation Mapping Not Applicable for Forecasting Victor Hom Hydrologic Services Division National
Basics of weather interpretation
 Basics of weather interpretation Safety at Sea Seminar, April 2 nd 2016 Dr. Gina Henderson Oceanography Dept., USNA ghenders@usna.edu Image source: http://earthobservatory.nasa.gov/naturalhazards/view.php?id=80399,
Estimating Storm Water Runoff
 PDHonline Course H119 (2 PDH) Estimating Storm Water Runoff Instructor: John Poullain, PE 2012 PDH Online PDH Center 5272 Meadow Estates Drive Fairfax, VA 22030-6658 Phone & Fax: 703-988-0088 www.pdhonline.org
ANALYSIS OF RAINFALL AND ITS INFLOW INTO MOBILE, ALABAMA S, ESLAVA SEWER SHED SYSTEM
 ANALYSIS OF RAINFALL AND ITS INFLOW INTO MOBILE, ALABAMA S, ESLAVA SEWER SHED SYSTEM Jerrod Frederking, Department of Earth Sciences, University of South Alabama, Mobile, AL 36688. E-mail: twisterj@gmail.com.
SITE SPECIFIC WEATHER ANALYSIS REPORT
 SAMPLE FLOOD ANALYSIS REPORT SITE SPECIFIC WEATHER ANALYSIS REPORT PREPARED FOR: Law Offices of Oliver Wendell Douglas Oliver Wendell Douglas PREPARED BY: November 29, 2007 CASE REFERENCE: Arnold Ziffel
MIKE 21 FLOW MODEL HINTS AND RECOMMENDATIONS IN APPLICATIONS WITH SIGNIFICANT FLOODING AND DRYING
 1 MIKE 21 FLOW MODEL HINTS AND RECOMMENDATIONS IN APPLICATIONS WITH SIGNIFICANT FLOODING AND DRYING This note is intended as a general guideline to setting up a standard MIKE 21 model for applications
Riprap-lined Swale (RS)
") Riprap-lined Swale (RS) Practice Description A riprap-lined swale is a natural or constructed channel with an erosion-resistant rock lining designed to carry concentrated runoff to a stable outlet. This
Riprap-lined Swale (RS) Practice Description A riprap-lined swale is a natural or constructed channel with an erosion-resistant rock lining designed to carry concentrated runoff to a stable outlet. This
TARP Section 2.2 Stormwater BMP Screening for Validation
 Requirements for Final Certification of Manufactured Treatment Devices for Total Suspended Solids Removal Based on Field Testing Amendments to TARP Protocol DRAFT April 28, 2009 The New Jersey Stormwater
DamWatch A WEB-BASED SOFTWARE SYSTEM TO MONITOR WATERSHED DAMS IN OKLAHOMA
 DamWatch A WEB-BASED SOFTWARE SYSTEM TO MONITOR WATERSHED DAMS IN OKLAHOMA Authors: Larry W. Caldwell, P.E., Oklahoma Conservation Commission, Stillwater, OK Joe Scannell, President,, USEngineering Solutions
An innovative approach to Floods and Fire Risk Assessment and Management: the FLIRE Project
 8 th International Conference of EWRA Water Resources Management in an Interdisciplinary and Changing Context 26-29 June 2013, Porto, Portugal An innovative approach to Floods and Fire Risk Assessment
Costs for Green Infrastructure and Stormwater Retention Practices
 Costs for Green Infrastructure and Stormwater Retention Practices Bob Newport U.S. EPA December 9, 2014 Topics to be Covered EPA data collection and cost analysis focused on postconstruction stormwater
Chapter 5.0. Stormwater Credits for Innovative Site Planning
 Chapter 5.0 Stormwater Credits for Innovative Site Planning Chapter 5. Stormwater Credits...Introduction 5.0 Stormwater Credits In Maryland, there are many programs at both the State and local level that
Drainage Analysis for the McKownville Area
 Drainage Analysis for the McKownville Area Town of Guilderland Albany County, New York Prepared by: DELAWARE ENGINEERING, P.C. 28 Madison Avenue Extension Albany, New York 12203 June 2010 Town of Guilderland
CITY UTILITIES DESIGN STANDARDS MANUAL
 CITY UTILITIES DESIGN STANDARDS MANUAL Book 2 (SW) SW9 June 2015 SW9.01 Purpose This Chapter provides information for the design of open channels for the conveyance of stormwater in the City of Fort Wayne.
Floods of April 28, 1966 In the Northern Part of Dallas, Texas
 Floods of April 28, 1966 In the Northern Part of Dallas, Texas GEOLOGICAL SURVEY WATER-SUPPLY PAPER 1870-B Prepared in cooperation with the city of Dallas Floods of April 28, 1966 In the Northern Part
5.14 Floodplains and Drainage/Hydrology
 I-70 East Final EIS 5.14 Floodplains and Drainage/Hydrology 5.14 Floodplains and Drainage/Hydrology This section discusses floodplain and drainage/hydrology resources and explains why they are important
Development of Technical Data For Long Term Flood Solutions For the Red River Basin
 IDENTIFYING WHAT WE DIDN T KNOW Development of Technical Data For Long Term Flood Solutions For the Red River Basin LTFS Study Area U.S. Portion of Red River Basin (MN, ND & SD) Main Stem Red River Tributaries
City and County of San Francisco 2030 Sewer System Master Plan TASK 400 TECHNICAL MEMORANDUM NO. 405
 City and County of San Francisco 2030 Sewer System Master Plan TASK 400 TECHNICAL MEMORANDUM NO. 405 REGULATORY CONSIDERATIONS FOR WET WEATHER COLLECTION SYSTEM BACKUPS FINAL DRAFT August 2009 2700 YGNACIO
Tropical Storm Allison and its impact on Harris County
 UNIVERSITY OF TEXAS AT AUSTIN CE 394K GIS in Water Resources Binbin Chen December 9, 2006 Tropical Storm Allison and its impact on Harris County Background Tropical Strom Allison Recovery Project Project
APPENDIX B. PRO-RATA SHARE PROGRAM EVALUATION
 APPENDIX B. PRO-RATA SHARE PROGRAM EVALUATION B.1 Introduction Across the United States, municipalities utilize mechanisms such as storm water utilities and pro rata share programs to fund activities required
Quantifying Potential Floodplain Restoration Benefits in the Upper Mississippi River Basin, USA
 Quantifying Potential Floodplain Restoration Benefits in the Upper Mississippi River Basin, USA Michael Schwar, Ph.D. PE (MARS) Eileen Fretz (American Rivers) Mississippi River Commission/USACE Upper Mississippi
General Insurance - Domestic Insurance - Home Contents Storm water damage policy exclusion flood damage
 Determination Case number: 227307 General Insurance - Domestic Insurance - Home Contents Storm water damage policy exclusion flood damage 4 April 2011 Background 1. The Applicants insured their home contents
DEPARTMENT OF THE ARMY EM 1110-2-1619 U.S. Army Corps of Engineers CECW-EH-Y Washington, DC 20314-1000
 DEPARTMENT OF THE ARMY EM 1110-2-1619 U.S. Army Corps of Engineers CECW-EH-Y Washington, DC 20314-1000 Manual No. 1110-2-1619 1 August 1996 Engineering and Design RISK-BASED ANALYSIS FOR FLOOD DAMAGE REDUCTION
Des Moines River Regulated Flow Frequency Study
 E S I Des Moines River Regulated Flow Frequency Study MINNESOTA WISCONSIN D E S C E D A R M I S S I M O I N S S I P P R A C C O O N R I V E R Saylorville Lake Des Moines - SE 6th St #* Lake Red Rock I
Chapter 3 : Reservoir models
 Chapter 3 : Reservoir models 3.1 History In earlier days, the dot graph of Kuipers was used to perform an impact assessment for combined sewer systems [Ribbius, 1951]. For a long period of rainfall, individual